Project
GSE58827: Dynamics of the Mouse Liver
Navigation
Downloads
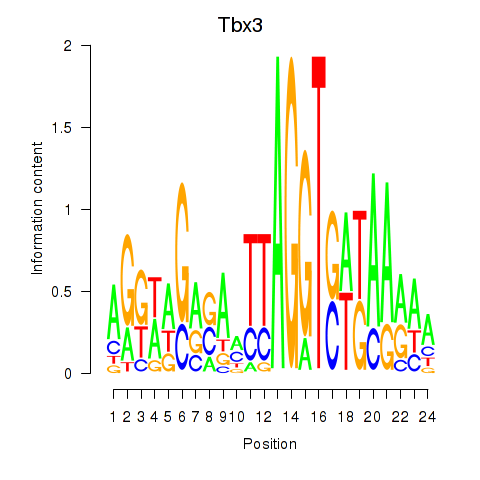
Results for Tbx3
Z-value: 0.45
Motif logo
Transcription factors associated with Tbx3
| Gene Symbol | Gene ID | Gene Info |
|---|---|---|
|
Tbx3
|
ENSMUSG00000018604.12 | T-box 3 |
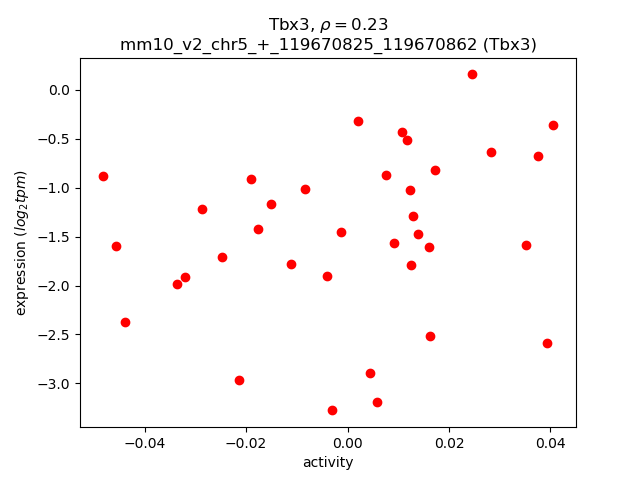
Activity-expression correlation:
| Gene | Promoter | Pearson corr. coef. | P-value | Plot |
|---|---|---|---|---|
| Tbx3 | mm10_v2_chr5_+_119670825_119670862 | 0.23 | 1.7e-01 | Click! |
Activity profile of Tbx3 motif
Sorted Z-values of Tbx3 motif
| Promoter | Log-likelihood | Transcript | Gene | Gene Info |
|---|---|---|---|---|
| chr4_+_135759705 | 1.22 |
ENSMUST00000105854.1
|
Myom3
|
myomesin family, member 3 |
| chr7_-_4522794 | 1.17 |
ENSMUST00000140424.1
|
Tnni3
|
troponin I, cardiac 3 |
| chr3_-_123034943 | 1.03 |
ENSMUST00000029761.7
|
Myoz2
|
myozenin 2 |
| chr19_+_7056731 | 1.02 |
ENSMUST00000040261.5
|
Macrod1
|
MACRO domain containing 1 |
| chr11_+_73350839 | 0.82 |
ENSMUST00000120137.1
|
Olfr20
|
olfactory receptor 20 |
| chr7_-_4522427 | 0.79 |
ENSMUST00000098859.3
|
Tnni3
|
troponin I, cardiac 3 |
| chr8_-_95306585 | 0.62 |
ENSMUST00000119870.2
ENSMUST00000093268.4 |
Cngb1
|
cyclic nucleotide gated channel beta 1 |
| chr17_-_59013264 | 0.62 |
ENSMUST00000174122.1
ENSMUST00000025065.5 |
Nudt12
|
nudix (nucleoside diphosphate linked moiety X)-type motif 12 |
| chr7_+_107567445 | 0.51 |
ENSMUST00000120990.1
|
Olfml1
|
olfactomedin-like 1 |
| chr14_+_67745229 | 0.49 |
ENSMUST00000111095.2
|
Gnrh1
|
gonadotropin releasing hormone 1 |
| chr7_-_120145286 | 0.34 |
ENSMUST00000033207.4
|
Zp2
|
zona pellucida glycoprotein 2 |
| chr1_-_31222604 | 0.33 |
ENSMUST00000127775.1
|
4931428L18Rik
|
RIKEN cDNA 4931428L18 gene |
| chr1_+_88095054 | 0.27 |
ENSMUST00000150634.1
ENSMUST00000058237.7 |
Ugt1a7c
|
UDP glucuronosyltransferase 1 family, polypeptide A7C |
| chr10_+_127514939 | 0.26 |
ENSMUST00000035735.9
|
Ndufa4l2
|
NADH dehydrogenase (ubiquinone) 1 alpha subcomplex, 4-like 2 |
| chr10_+_116966274 | 0.24 |
ENSMUST00000033651.3
|
D630029K05Rik
|
RIKEN cDNA D630029K05 gene |
| chr16_+_17619503 | 0.23 |
ENSMUST00000165092.1
|
Smpd4
|
sphingomyelin phosphodiesterase 4 |
| chr2_+_154551771 | 0.23 |
ENSMUST00000104928.1
|
Actl10
|
actin-like 10 |
| chr1_+_93215899 | 0.21 |
ENSMUST00000138595.1
|
E030010N08Rik
|
RIKEN cDNA E030010N08 gene |
| chr19_+_7494033 | 0.21 |
ENSMUST00000170373.1
|
Atl3
|
atlastin GTPase 3 |
| chr5_-_106926245 | 0.18 |
ENSMUST00000117588.1
|
Hfm1
|
HFM1, ATP-dependent DNA helicase homolog (S. cerevisiae) |
| chr19_+_11569447 | 0.17 |
ENSMUST00000087884.1
|
Gm10212
|
predicted pseudogene 10212 |
| chr10_+_75406911 | 0.17 |
ENSMUST00000039925.7
|
Upb1
|
ureidopropionase, beta |
| chr7_-_44236098 | 0.15 |
ENSMUST00000037220.4
|
1700028J19Rik
|
RIKEN cDNA 1700028J19 gene |
| chr1_+_39535747 | 0.15 |
ENSMUST00000003219.8
|
Cnot11
|
CCR4-NOT transcription complex, subunit 11 |
| chr11_+_31832660 | 0.15 |
ENSMUST00000132857.1
|
Gm12107
|
predicted gene 12107 |
| chr7_+_140704165 | 0.13 |
ENSMUST00000080681.3
|
Olfr541
|
olfactory receptor 541 |
| chr16_-_13730970 | 0.12 |
ENSMUST00000023364.6
|
Pla2g10
|
phospholipase A2, group X |
| chr4_-_128618609 | 0.12 |
ENSMUST00000074829.2
|
Tlr12
|
toll-like receptor 12 |
| chr7_+_112374839 | 0.12 |
ENSMUST00000106645.1
|
Micalcl
|
MICAL C-terminal like |
| chr12_-_84361802 | 0.10 |
ENSMUST00000021659.1
ENSMUST00000065536.2 |
Fam161b
|
family with sequence similarity 161, member B |
| chrX_-_134476479 | 0.07 |
ENSMUST00000009740.2
|
Taf7l
|
TAF7-like RNA polymerase II, TATA box binding protein (TBP)-associated factor |
| chr13_+_108046411 | 0.07 |
ENSMUST00000095458.4
|
Smim15
|
small integral membrane protein 15 |
| chr6_-_97060407 | 0.07 |
ENSMUST00000089295.4
|
Fam19a4
|
family with sequence similarity 19, member A4 |
| chr10_-_18743691 | 0.06 |
ENSMUST00000019999.5
|
D10Bwg1379e
|
DNA segment, Chr 10, Brigham & Women's Genetics 1379 expressed |
| chr13_+_33484784 | 0.05 |
ENSMUST00000081927.2
|
Serpinb9g
|
serine (or cysteine) peptidase inhibitor, clade B, member 9g |
| chr16_+_17619341 | 0.05 |
ENSMUST00000006053.6
ENSMUST00000171435.1 ENSMUST00000163476.1 ENSMUST00000168101.1 ENSMUST00000165363.1 ENSMUST00000169662.1 ENSMUST00000090159.4 ENSMUST00000172182.1 ENSMUST00000163592.1 |
Smpd4
|
sphingomyelin phosphodiesterase 4 |
| chr3_+_89246397 | 0.05 |
ENSMUST00000168900.1
|
Krtcap2
|
keratinocyte associated protein 2 |
| chr19_+_5704367 | 0.05 |
ENSMUST00000052448.3
|
Kcnk7
|
potassium channel, subfamily K, member 7 |
| chr1_-_31222644 | 0.03 |
ENSMUST00000135245.1
|
4931428L18Rik
|
RIKEN cDNA 4931428L18 gene |
| chr13_-_59706197 | 0.02 |
ENSMUST00000066510.6
|
Spata31d1a
|
spermatogenesis associated 31 subfamily D, member 1A |
| chr11_-_94507337 | 0.00 |
ENSMUST00000040692.8
|
Mycbpap
|
MYCBP associated protein |
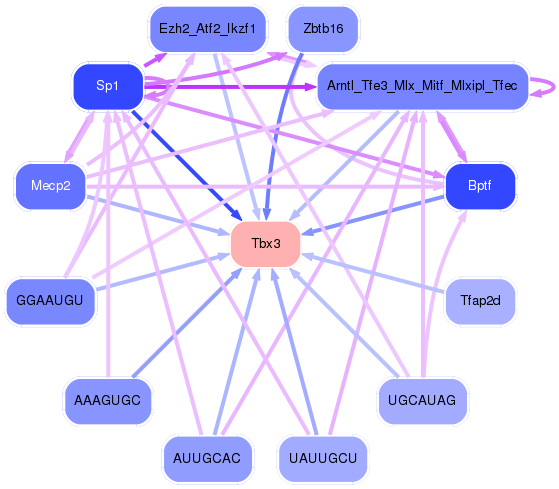
Network of associatons between targets according to the STRING database.

First level regulatory network of Tbx3
Gene Ontology Analysis
Gene overrepresentation in biological process category:
| Log-likelihood per target | Total log-likelihood | Term | Description |
|---|---|---|---|
| 0.3 | 2.0 | GO:0001980 | regulation of systemic arterial blood pressure by ischemic conditions(GO:0001980) |
| 0.2 | 0.6 | GO:0006742 | NADP catabolic process(GO:0006742) |
| 0.1 | 1.0 | GO:0051725 | protein de-ADP-ribosylation(GO:0051725) |
| 0.1 | 0.3 | GO:0046271 | coumarin metabolic process(GO:0009804) phenylpropanoid catabolic process(GO:0046271) |
| 0.1 | 0.5 | GO:2000354 | regulation of ovarian follicle development(GO:2000354) |
| 0.0 | 0.3 | GO:0060468 | prevention of polyspermy(GO:0060468) |
| 0.0 | 0.6 | GO:0035845 | photoreceptor cell outer segment organization(GO:0035845) |
| 0.0 | 0.1 | GO:0051977 | lysophospholipid transport(GO:0051977) |
| 0.0 | 0.3 | GO:0006685 | sphingomyelin catabolic process(GO:0006685) |
| 0.0 | 0.2 | GO:0019482 | beta-alanine metabolic process(GO:0019482) |
| 0.0 | 0.8 | GO:0050907 | detection of chemical stimulus involved in sensory perception(GO:0050907) |
| 0.0 | 0.2 | GO:0000712 | resolution of meiotic recombination intermediates(GO:0000712) |
| 0.0 | 1.0 | GO:0030239 | myofibril assembly(GO:0030239) |
Gene overrepresentation in cellular component category:
| Log-likelihood per target | Total log-likelihood | Term | Description |
|---|---|---|---|
| 0.3 | 2.0 | GO:1990584 | cardiac Troponin complex(GO:1990584) |
| 0.1 | 0.5 | GO:0098554 | cytoplasmic side of endoplasmic reticulum membrane(GO:0098554) |
| 0.0 | 1.2 | GO:0031430 | M band(GO:0031430) |
| 0.0 | 0.3 | GO:0005751 | mitochondrial respiratory chain complex IV(GO:0005751) |
Gene overrepresentation in molecular function category:
| Log-likelihood per target | Total log-likelihood | Term | Description |
|---|---|---|---|
| 0.3 | 2.0 | GO:0030172 | troponin C binding(GO:0030172) |
| 0.2 | 1.0 | GO:0051373 | FATZ binding(GO:0051373) |
| 0.1 | 0.3 | GO:0032190 | acrosin binding(GO:0032190) |
| 0.1 | 0.6 | GO:0035529 | NADH pyrophosphatase activity(GO:0035529) |
| 0.0 | 0.6 | GO:0043855 | cyclic nucleotide-gated ion channel activity(GO:0043855) |
| 0.0 | 0.3 | GO:0004767 | sphingomyelin phosphodiesterase activity(GO:0004767) |
| 0.0 | 1.0 | GO:0019213 | deacetylase activity(GO:0019213) |
Gene overrepresentation in curated gene sets: canonical pathways category:
| Log-likelihood per target | Total log-likelihood | Term | Description |
|---|---|---|---|
| 0.0 | 0.6 | PID RHODOPSIN PATHWAY | Visual signal transduction: Rods |
| 0.0 | 0.5 | PID AR NONGENOMIC PATHWAY | Nongenotropic Androgen signaling |
Gene overrepresentation in curated gene sets: REACTOME pathways category:
| Log-likelihood per target | Total log-likelihood | Term | Description |
|---|---|---|---|
| 0.1 | 0.5 | REACTOME HORMONE LIGAND BINDING RECEPTORS | Genes involved in Hormone ligand-binding receptors |
| 0.0 | 2.0 | REACTOME STRIATED MUSCLE CONTRACTION | Genes involved in Striated Muscle Contraction |