Project
avrg: GSE58827: Dynamics of the Mouse Liver
Navigation
Downloads
Results for Tbx20
Z-value: 0.49
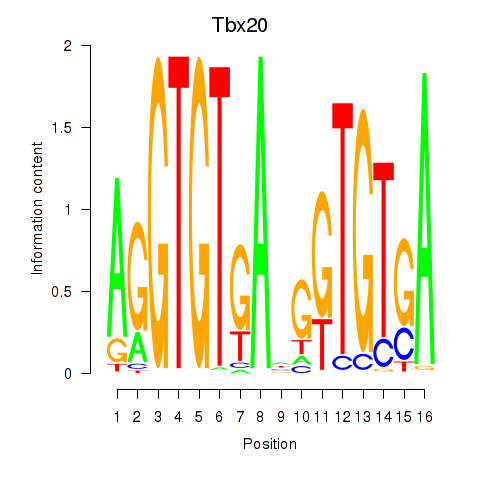
Motif logo
Transcription factors associated with Tbx20
| Gene Symbol | Gene ID | Gene Info |
|---|---|---|
|
Tbx20
|
ENSMUSG00000031965.8 | T-box 20 |
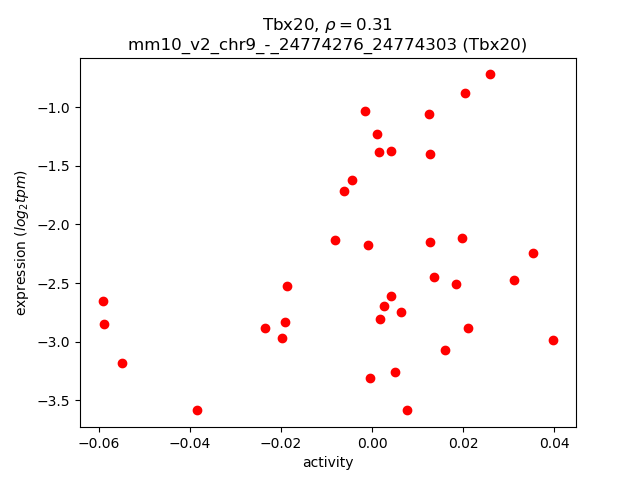
Activity-expression correlation:
| Gene | Promoter | Pearson corr. coef. | P-value | Plot |
|---|---|---|---|---|
| Tbx20 | mm10_v2_chr9_-_24774276_24774303 | 0.31 | 6.3e-02 | Click! |
Activity profile of Tbx20 motif
Sorted Z-values of Tbx20 motif
| Promoter | Log-likelihood | Transcript | Gene | Gene Info |
|---|---|---|---|---|
| chr8_-_105933832 | 5.60 |
ENSMUST00000034368.6
|
Ctrl
|
chymotrypsin-like |
| chr7_+_79660196 | 1.89 |
ENSMUST00000035977.7
|
Ticrr
|
TOPBP1-interacting checkpoint and replication regulator |
| chr5_-_53707532 | 1.48 |
ENSMUST00000031093.3
|
Cckar
|
cholecystokinin A receptor |
| chr4_-_118437331 | 1.15 |
ENSMUST00000006565.6
|
Cdc20
|
cell division cycle 20 |
| chr19_+_38055002 | 1.01 |
ENSMUST00000096096.4
ENSMUST00000116506.1 ENSMUST00000169673.1 |
Cep55
|
centrosomal protein 55 |
| chr12_+_51348265 | 0.77 |
ENSMUST00000119211.1
|
G2e3
|
G2/M-phase specific E3 ubiquitin ligase |
| chr12_+_51348370 | 0.67 |
ENSMUST00000121521.1
|
G2e3
|
G2/M-phase specific E3 ubiquitin ligase |
| chrX_-_134751331 | 0.66 |
ENSMUST00000113194.1
ENSMUST00000052431.5 |
Armcx6
|
armadillo repeat containing, X-linked 6 |
| chr17_-_29237759 | 0.59 |
ENSMUST00000137727.1
ENSMUST00000024805.7 |
Cpne5
|
copine V |
| chr5_-_120777628 | 0.39 |
ENSMUST00000044833.8
|
Oas3
|
2'-5' oligoadenylate synthetase 3 |
| chr17_-_12868126 | 0.37 |
ENSMUST00000089015.3
|
Mas1
|
MAS1 oncogene |
| chr6_-_122340499 | 0.37 |
ENSMUST00000160843.1
|
Phc1
|
polyhomeotic-like 1 (Drosophila) |
| chr8_+_83900706 | 0.29 |
ENSMUST00000045393.8
ENSMUST00000132500.1 ENSMUST00000152978.1 |
Lphn1
|
latrophilin 1 |
| chr15_+_75268379 | 0.25 |
ENSMUST00000023247.6
|
Ly6f
|
lymphocyte antigen 6 complex, locus F |
| chr8_-_22694061 | 0.21 |
ENSMUST00000131767.1
|
Ikbkb
|
inhibitor of kappaB kinase beta |
| chr6_-_122340525 | 0.17 |
ENSMUST00000112600.2
|
Phc1
|
polyhomeotic-like 1 (Drosophila) |
| chr15_-_78495059 | 0.13 |
ENSMUST00000089398.1
|
Il2rb
|
interleukin 2 receptor, beta chain |
| chrX_+_99042581 | 0.10 |
ENSMUST00000036606.7
|
Stard8
|
START domain containing 8 |
| chr7_-_105787544 | 0.10 |
ENSMUST00000078482.5
ENSMUST00000154659.1 |
Dchs1
|
dachsous 1 (Drosophila) |
| chr2_+_74681991 | 0.09 |
ENSMUST00000142312.1
|
Hoxd11
|
homeobox D11 |
| chr1_+_24177610 | 0.08 |
ENSMUST00000054588.8
|
Col9a1
|
collagen, type IX, alpha 1 |
| chr9_+_112227443 | 0.08 |
ENSMUST00000161216.1
|
2310075C17Rik
|
RIKEN cDNA 2310075C17 gene |
| chr11_-_61720795 | 0.06 |
ENSMUST00000051552.4
|
Slc5a10
|
solute carrier family 5 (sodium/glucose cotransporter), member 10 |
| chr4_+_152116312 | 0.05 |
ENSMUST00000035275.7
|
Tnfrsf25
|
tumor necrosis factor receptor superfamily, member 25 |
| chr8_-_85555261 | 0.02 |
ENSMUST00000034138.5
|
Dnaja2
|
DnaJ (Hsp40) homolog, subfamily A, member 2 |
| chr13_+_23011249 | 0.02 |
ENSMUST00000076897.1
|
Vmn1r213
|
vomeronasal 1 receptor 213 |
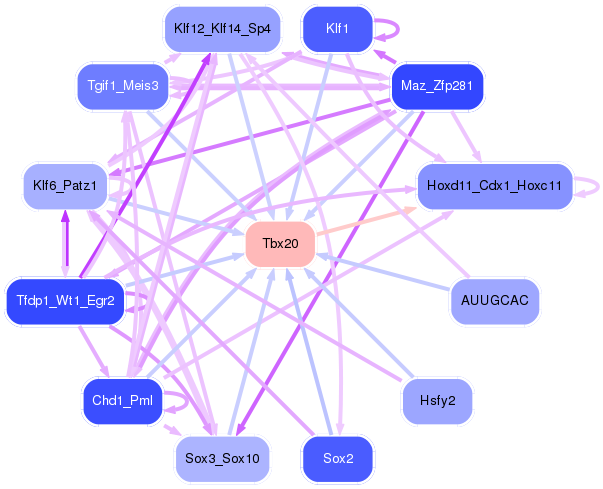
Network of associatons between targets according to the STRING database.

First level regulatory network of Tbx20
Gene Ontology Analysis
Gene overrepresentation in biological process category:
| Log-likelihood per target | Total log-likelihood | Term | Description |
|---|---|---|---|
| 0.5 | 1.5 | GO:0090274 | positive regulation of somatostatin secretion(GO:0090274) |
| 0.4 | 1.1 | GO:0098763 | mitotic cell cycle phase(GO:0098763) |
| 0.2 | 1.9 | GO:0030174 | regulation of DNA-dependent DNA replication initiation(GO:0030174) |
| 0.1 | 1.0 | GO:0000920 | cell separation after cytokinesis(GO:0000920) |
| 0.0 | 0.4 | GO:0060700 | regulation of ribonuclease activity(GO:0060700) |
| 0.0 | 0.2 | GO:1903347 | negative regulation of bicellular tight junction assembly(GO:1903347) |
| 0.0 | 0.4 | GO:0060732 | positive regulation of inositol phosphate biosynthetic process(GO:0060732) |
| 0.0 | 0.6 | GO:1903861 | positive regulation of dendrite extension(GO:1903861) |
| 0.0 | 1.4 | GO:2001243 | negative regulation of intrinsic apoptotic signaling pathway(GO:2001243) |
Gene overrepresentation in cellular component category:
| Log-likelihood per target | Total log-likelihood | Term | Description |
|---|---|---|---|
| 0.1 | 1.0 | GO:0090543 | Flemming body(GO:0090543) |
| 0.1 | 0.5 | GO:0001739 | sex chromatin(GO:0001739) |
| 0.0 | 1.1 | GO:0005680 | anaphase-promoting complex(GO:0005680) |
| 0.0 | 0.1 | GO:0005594 | collagen type IX trimer(GO:0005594) |
| 0.0 | 0.2 | GO:0008385 | IkappaB kinase complex(GO:0008385) |
Gene overrepresentation in molecular function category:
| Log-likelihood per target | Total log-likelihood | Term | Description |
|---|---|---|---|
| 0.2 | 1.1 | GO:0010997 | anaphase-promoting complex binding(GO:0010997) |
| 0.1 | 0.4 | GO:0001595 | angiotensin receptor activity(GO:0001595) |
| 0.0 | 0.1 | GO:0004911 | interleukin-2 receptor activity(GO:0004911) |
| 0.0 | 0.2 | GO:0008384 | IkappaB kinase activity(GO:0008384) |
| 0.0 | 0.4 | GO:0001730 | 2'-5'-oligoadenylate synthetase activity(GO:0001730) |
| 0.0 | 5.6 | GO:0008236 | serine-type peptidase activity(GO:0008236) |
| 0.0 | 1.5 | GO:0008528 | G-protein coupled peptide receptor activity(GO:0008528) |
Gene overrepresentation in curated gene sets: canonical pathways category:
| Log-likelihood per target | Total log-likelihood | Term | Description |
|---|---|---|---|
| 0.0 | 1.1 | PID PLK1 PATHWAY | PLK1 signaling events |
Gene overrepresentation in curated gene sets: REACTOME pathways category:
| Log-likelihood per target | Total log-likelihood | Term | Description |
|---|---|---|---|
| 0.1 | 1.1 | REACTOME CONVERSION FROM APC C CDC20 TO APC C CDH1 IN LATE ANAPHASE | Genes involved in Conversion from APC/C:Cdc20 to APC/C:Cdh1 in late anaphase |
| 0.0 | 0.2 | REACTOME IKK COMPLEX RECRUITMENT MEDIATED BY RIP1 | Genes involved in IKK complex recruitment mediated by RIP1 |