Project
GSE67402: E.coli regulatory changes under long-term starvation
Navigation
Downloads
Results for RcsB-BglJ
Z-value: 1.39
Transcription factors associated with RcsB-BglJ
| Gene Symbol | Gene ID | Gene Info |
|---|---|---|
|
rcsB
|
rcsB | RcsB |
|
bglJ
|
bglJ | BglJ DNA-binding transcriptional regulator |
Activity-expression correlation:
Activity profile of RcsB-BglJ motif
Sorted Z-values of RcsB-BglJ motif
| Promoter | Log-likelihood | Transcript | Gene | Gene Info |
|---|---|---|---|---|
| ykiA | 18.14 |
ykiA
|
predicted protein |
|
| ygiZ | 15.05 |
ygiZ
|
conserved inner membrane protein |
|
| molR_1 | 14.12 |
molR_1
|
molybdate metabolism regulator (interrupted) |
|
| yidL | 14.01 |
yidL
|
predicted DNA-binding transcriptional regulator |
|
| yqhG | 13.96 |
yqhG
|
conserved protein |
|
| ynbABCD | 10.18 |
ynbC
ynbB
ynbA
ynbD
|
predicted hydrolase predicted CDP-diglyceride synthase predicted inner membrane protein predicted phosphatase, inner membrane protein |
|
| ynjI | 3.85 |
ynjI
|
predicted inner membrane protein |
Network of associatons between targets according to the STRING database.

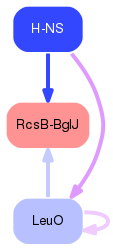
First level regulatory network of RcsB-BglJ
Gene Ontology Analysis
Gene overrepresentation in biological process category:
| Log-likelihood per target | Total log-likelihood | Term | Description |
|---|---|---|---|
| 0.8 | 10.2 | GO:0009273 | peptidoglycan-based cell wall biogenesis(GO:0009273) |
| 0.1 | 11.2 | GO:0006351 | transcription, DNA-templated(GO:0006351) nucleic acid-templated transcription(GO:0097659) |
Gene overrepresentation in cellular component category:
| Log-likelihood per target | Total log-likelihood | Term | Description |
|---|---|---|---|
| 0.1 | 24.4 | GO:0005886 | plasma membrane(GO:0005886) |
Gene overrepresentation in molecular function category:
| Log-likelihood per target | Total log-likelihood | Term | Description |
|---|---|---|---|
| 0.9 | 10.2 | GO:0016780 | phosphotransferase activity, for other substituted phosphate groups(GO:0016780) |