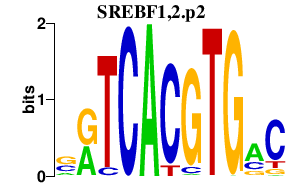
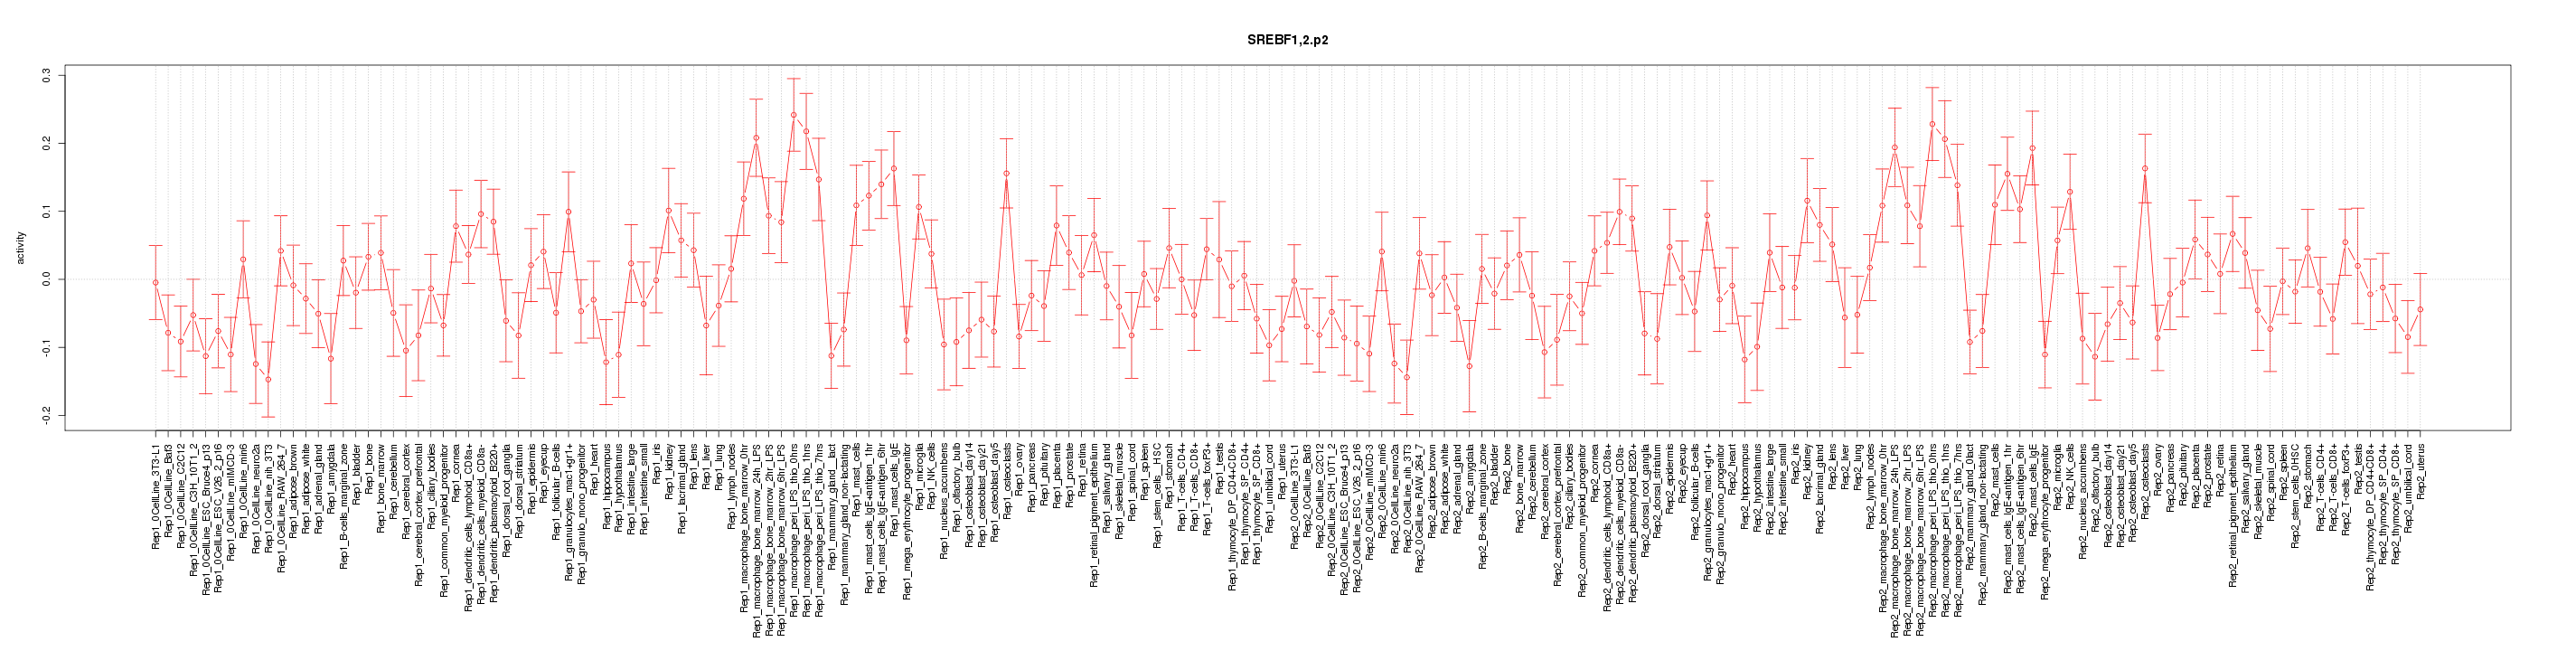
Motif ID: SREBF1,2.p2
Z-value: 1.537
Transcription factors associated with SREBF1,2.p2:
| Gene Symbol | Entrez ID | Gene Name |
|---|---|---|
| Srebf1 | 20787 | sterol regulatory element binding transcription factor 1 |
| Srebf2 | 20788 | sterol regulatory element binding factor 2 |
Activity-expression correlation:
| Gene Symbol | Promoter | Pearson corr. coef. | P-value | Plot |
|---|---|---|---|---|
| Srebf2 | chr15_+_82000246 | -0.33 | 4.1e-06 | Click! |
| Srebf1 | chr11_-_60013141 | 0.22 | 2.5e-03 | Click! |


Top targets:
Showing 1 to 20 of 200 entries
Gene overrepresentation in process category:
Showing 1 to 20 of 67 entries
Gene overrepresentation in compartment category:
Showing 1 to 20 of 29 entries
| Enrichment | P-value | GO Accession | GO Term |
|---|---|---|---|
| 11.51 | 1.70e-05 | GO:0016471 | vacuolar proton-transporting V-type ATPase complex |
| 9.99 | 3.95e-07 | GO:0033176 | proton-transporting V-type ATPase complex |
| 5.60 | 2.21e-04 | GO:0016469 | proton-transporting two-sector ATPase complex |
| 4.82 | 2.04e-06 | GO:0005774 | vacuolar membrane |
| 4.73 | 1.19e-06 | GO:0044437 | vacuolar part |
| 4.30 | 1.66e-23 | GO:0005773 | vacuole |
| 4.30 | 1.39e-19 | GO:0000323 | lytic vacuole |
| 4.30 | 1.39e-19 | GO:0005764 | lysosome |
| 2.54 | 2.93e-09 | GO:0005768 | endosome |
| 1.82 | 6.08e-03 | GO:0016023 | cytoplasmic membrane-bounded vesicle |
| 1.76 | 1.36e-02 | GO:0031988 | membrane-bounded vesicle |
| 1.74 | 1.37e-03 | GO:0031410 | cytoplasmic vesicle |
| 1.73 | 9.05e-04 | GO:0031982 | vesicle |
| 1.58 | 6.47e-03 | GO:0005794 | Golgi apparatus |
| 1.52 | 2.52e-02 | GO:0005654 | nucleoplasm |
| 1.38 | 5.07e-23 | GO:0043227 | membrane-bounded organelle |
| 1.37 | 9.72e-23 | GO:0043231 | intracellular membrane-bounded organelle |
| 1.35 | 1.87e-10 | GO:0044444 | cytoplasmic part |
| 1.32 | 1.86e-20 | GO:0043226 | organelle |
| 1.32 | 4.61e-20 | GO:0043229 | intracellular organelle |
Gene overrepresentation in function category:
Showing 1 to 13 of 13 entries
| Enrichment | P-value | GO Accession | GO Term |
|---|---|---|---|
| 8.63 | 2.88e-03 | GO:0008553 | hydrogen-exporting ATPase activity, phosphorylative mechanism |
| 3.62 | 2.52e-02 | GO:0042625 | ATPase activity, coupled to transmembrane movement of ions |
| 2.47 | 5.07e-03 | GO:0022890 | inorganic cation transmembrane transporter activity |
| 2.03 | 2.41e-02 | GO:0022804 | active transmembrane transporter activity |
| 2.02 | 3.48e-06 | GO:0043565 | sequence-specific DNA binding |
| 2.01 | 3.48e-07 | GO:0001071 | nucleic acid binding transcription factor activity |
| 2.01 | 3.48e-07 | GO:0003700 | sequence-specific DNA binding transcription factor activity |
| 1.81 | 1.20e-05 | GO:0030528 | transcription regulator activity |
| 1.56 | 8.62e-06 | GO:0003677 | DNA binding |
| 1.48 | 1.10e-06 | GO:0003676 | nucleic acid binding |
| 1.27 | 9.55e-06 | GO:0005515 | protein binding |
| 1.20 | 1.98e-02 | GO:0003824 | catalytic activity |
| 1.19 | 6.61e-09 | GO:0005488 | binding |