Project
Illumina Body Map 2, young vs old
Navigation
Downloads
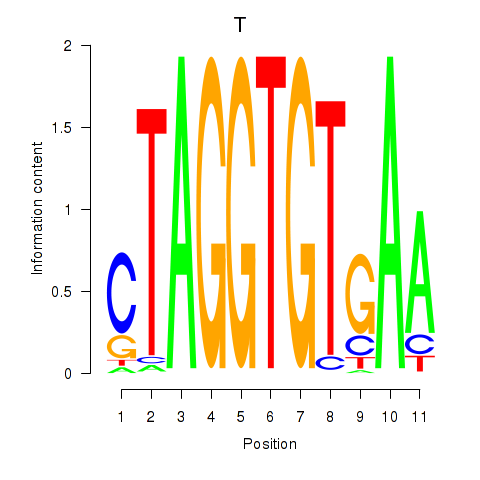
Results for T
Z-value: 0.53
Motif logo
Transcription factors associated with T
| Gene Symbol | Gene ID | Gene Info |
|---|---|---|
|
T
|
ENSG00000164458.5 | T |
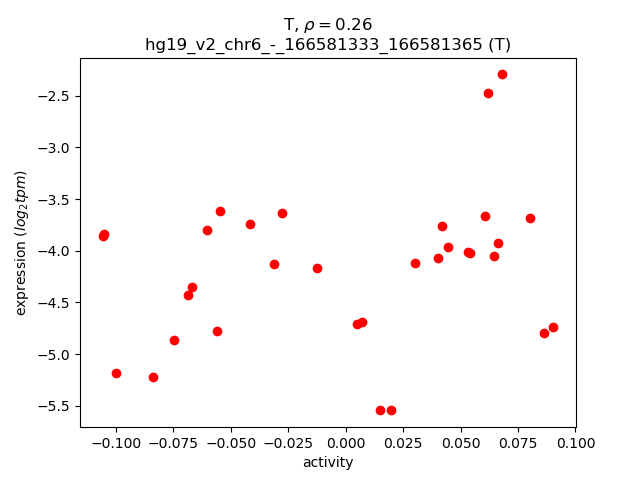
Activity-expression correlation:
| Gene | Promoter | Pearson corr. coef. | P-value | Plot |
|---|---|---|---|---|
| T | hg19_v2_chr6_-_166581333_166581365 | 0.26 | 1.5e-01 | Click! |
Activity profile of T motif
Sorted Z-values of T motif
| Promoter | Log-likelihood | Transcript | Gene | Gene Info |
|---|---|---|---|---|
| chr20_+_56725952 | 3.02 |
ENST00000371168.3
|
C20orf85
|
chromosome 20 open reading frame 85 |
| chr5_+_54320078 | 2.81 |
ENST00000231009.2
|
GZMK
|
granzyme K (granzyme 3; tryptase II) |
| chr14_+_22204418 | 2.74 |
ENST00000390426.2
|
TRAV4
|
T cell receptor alpha variable 4 |
| chr12_-_53074182 | 2.61 |
ENST00000252244.3
|
KRT1
|
keratin 1 |
| chr17_-_46657473 | 2.21 |
ENST00000332503.5
|
HOXB4
|
homeobox B4 |
| chr17_+_34538310 | 2.10 |
ENST00000444414.1
ENST00000378350.4 ENST00000389068.5 ENST00000588929.1 ENST00000589079.1 ENST00000589336.1 ENST00000400702.4 ENST00000591167.1 ENST00000586598.1 ENST00000591637.1 ENST00000378352.4 ENST00000358756.5 |
CCL4L1
|
chemokine (C-C motif) ligand 4-like 1 |
| chr17_+_34431212 | 2.06 |
ENST00000394495.1
|
CCL4
|
chemokine (C-C motif) ligand 4 |
| chr2_+_171571827 | 1.97 |
ENST00000375281.3
|
SP5
|
Sp5 transcription factor |
| chr17_+_34639793 | 1.81 |
ENST00000394465.2
ENST00000394463.2 ENST00000378342.4 |
CCL4L2
|
chemokine (C-C motif) ligand 4-like 2 |
| chr1_-_25256368 | 1.80 |
ENST00000308873.6
|
RUNX3
|
runt-related transcription factor 3 |
| chr12_+_54378923 | 1.80 |
ENST00000303460.4
|
HOXC10
|
homeobox C10 |
| chr7_+_142494244 | 1.70 |
ENST00000390413.1
|
TRBJ2-2
|
T cell receptor beta joining 2-2 |
| chr3_+_137728842 | 1.66 |
ENST00000183605.5
|
CLDN18
|
claudin 18 |
| chr4_-_73434498 | 1.63 |
ENST00000286657.4
|
ADAMTS3
|
ADAM metallopeptidase with thrombospondin type 1 motif, 3 |
| chr14_-_107114267 | 1.61 |
ENST00000454421.2
|
IGHV3-64
|
immunoglobulin heavy variable 3-64 |
| chr12_+_54379569 | 1.60 |
ENST00000513209.1
|
RP11-834C11.12
|
RP11-834C11.12 |
| chr2_-_219031709 | 1.60 |
ENST00000295683.2
|
CXCR1
|
chemokine (C-X-C motif) receptor 1 |
| chr14_-_107211459 | 1.50 |
ENST00000390636.2
|
IGHV3-73
|
immunoglobulin heavy variable 3-73 |
| chr2_+_149894968 | 1.50 |
ENST00000409642.3
|
LYPD6B
|
LY6/PLAUR domain containing 6B |
| chr19_+_3721719 | 1.44 |
ENST00000589378.1
ENST00000382008.3 |
TJP3
|
tight junction protein 3 |
| chr12_-_91348949 | 1.41 |
ENST00000358859.2
|
CCER1
|
coiled-coil glutamate-rich protein 1 |
| chr17_+_34430980 | 1.39 |
ENST00000250151.4
|
CCL4
|
chemokine (C-C motif) ligand 4 |
| chr2_+_149895207 | 1.38 |
ENST00000409876.1
|
LYPD6B
|
LY6/PLAUR domain containing 6B |
| chr12_+_54378849 | 1.38 |
ENST00000515593.1
|
HOXC10
|
homeobox C10 |
| chr21_-_15918618 | 1.33 |
ENST00000400564.1
ENST00000400566.1 |
SAMSN1
|
SAM domain, SH3 domain and nuclear localization signals 1 |
| chr13_-_39564993 | 1.29 |
ENST00000423210.1
|
STOML3
|
stomatin (EPB72)-like 3 |
| chr12_-_7848364 | 1.28 |
ENST00000329913.3
|
GDF3
|
growth differentiation factor 3 |
| chr2_+_192543694 | 1.21 |
ENST00000435931.1
|
NABP1
|
nucleic acid binding protein 1 |
| chr18_-_77276057 | 1.17 |
ENST00000597412.1
|
AC018445.1
|
Uncharacterized protein |
| chr20_+_44637526 | 1.17 |
ENST00000372330.3
|
MMP9
|
matrix metallopeptidase 9 (gelatinase B, 92kDa gelatinase, 92kDa type IV collagenase) |
| chr19_+_17638059 | 1.11 |
ENST00000599164.1
ENST00000449408.2 ENST00000600871.1 ENST00000599124.1 |
FAM129C
|
family with sequence similarity 129, member C |
| chr2_+_102759199 | 1.10 |
ENST00000409288.1
ENST00000410023.1 |
IL1R1
|
interleukin 1 receptor, type I |
| chr17_+_34640031 | 1.08 |
ENST00000339270.6
ENST00000482104.1 |
CCL4L2
|
chemokine (C-C motif) ligand 4-like 2 |
| chr2_+_189839046 | 1.07 |
ENST00000304636.3
ENST00000317840.5 |
COL3A1
|
collagen, type III, alpha 1 |
| chr16_-_88717423 | 1.05 |
ENST00000568278.1
ENST00000569359.1 ENST00000567174.1 |
CYBA
|
cytochrome b-245, alpha polypeptide |
| chr2_+_90139056 | 1.02 |
ENST00000492446.1
|
IGKV1D-16
|
immunoglobulin kappa variable 1D-16 |
| chr19_-_17958771 | 1.02 |
ENST00000534444.1
|
JAK3
|
Janus kinase 3 |
| chr22_+_35776828 | 0.98 |
ENST00000216117.8
|
HMOX1
|
heme oxygenase (decycling) 1 |
| chr1_-_153029980 | 0.97 |
ENST00000392653.2
|
SPRR2A
|
small proline-rich protein 2A |
| chr2_-_85895295 | 0.95 |
ENST00000428225.1
ENST00000519937.2 |
SFTPB
|
surfactant protein B |
| chr1_-_24126023 | 0.95 |
ENST00000429356.1
|
GALE
|
UDP-galactose-4-epimerase |
| chr7_-_142176790 | 0.94 |
ENST00000390369.2
|
TRBV7-4
|
T cell receptor beta variable 7-4 (gene/pseudogene) |
| chr20_-_31124186 | 0.93 |
ENST00000375678.3
|
C20orf112
|
chromosome 20 open reading frame 112 |
| chr2_-_208030647 | 0.93 |
ENST00000309446.6
|
KLF7
|
Kruppel-like factor 7 (ubiquitous) |
| chr10_+_45406764 | 0.93 |
ENST00000544540.1
|
TMEM72
|
transmembrane protein 72 |
| chr2_+_102758751 | 0.92 |
ENST00000442590.1
|
IL1R1
|
interleukin 1 receptor, type I |
| chr1_-_205290865 | 0.92 |
ENST00000367157.3
|
NUAK2
|
NUAK family, SNF1-like kinase, 2 |
| chr17_+_47296865 | 0.91 |
ENST00000573347.1
|
ABI3
|
ABI family, member 3 |
| chr7_-_81399438 | 0.91 |
ENST00000222390.5
|
HGF
|
hepatocyte growth factor (hepapoietin A; scatter factor) |
| chr1_-_204135450 | 0.90 |
ENST00000272190.8
ENST00000367195.2 |
REN
|
renin |
| chr8_-_99955042 | 0.89 |
ENST00000519420.1
|
STK3
|
serine/threonine kinase 3 |
| chr7_-_38370536 | 0.88 |
ENST00000390343.2
|
TRGV8
|
T cell receptor gamma variable 8 |
| chr9_+_36572851 | 0.88 |
ENST00000298048.2
ENST00000538311.1 ENST00000536987.1 ENST00000545008.1 ENST00000536860.1 ENST00000536329.1 ENST00000541717.1 ENST00000543751.1 |
MELK
|
maternal embryonic leucine zipper kinase |
| chr2_+_78143006 | 0.87 |
ENST00000443419.1
|
AC073628.1
|
AC073628.1 |
| chr16_+_69221028 | 0.86 |
ENST00000336278.4
|
SNTB2
|
syntrophin, beta 2 (dystrophin-associated protein A1, 59kDa, basic component 2) |
| chr9_+_127023704 | 0.86 |
ENST00000373596.1
ENST00000425237.1 |
NEK6
|
NIMA-related kinase 6 |
| chr2_+_102758271 | 0.86 |
ENST00000428279.1
|
IL1R1
|
interleukin 1 receptor, type I |
| chr17_-_39258461 | 0.85 |
ENST00000440582.1
|
KRTAP4-16P
|
keratin associated protein 4-16, pseudogene |
| chr19_+_17638041 | 0.85 |
ENST00000601861.1
|
FAM129C
|
family with sequence similarity 129, member C |
| chr1_+_19967014 | 0.84 |
ENST00000428975.1
|
NBL1
|
neuroblastoma 1, DAN family BMP antagonist |
| chr2_+_176972000 | 0.83 |
ENST00000249504.5
|
HOXD11
|
homeobox D11 |
| chr7_-_81399355 | 0.81 |
ENST00000457544.2
|
HGF
|
hepatocyte growth factor (hepapoietin A; scatter factor) |
| chr19_-_44174330 | 0.79 |
ENST00000340093.3
|
PLAUR
|
plasminogen activator, urokinase receptor |
| chr19_-_17958832 | 0.78 |
ENST00000458235.1
|
JAK3
|
Janus kinase 3 |
| chr16_-_88717482 | 0.78 |
ENST00000261623.3
|
CYBA
|
cytochrome b-245, alpha polypeptide |
| chr12_-_69326940 | 0.77 |
ENST00000549781.1
ENST00000548262.1 ENST00000551568.1 ENST00000548954.1 |
CPM
|
carboxypeptidase M |
| chr14_+_75746781 | 0.77 |
ENST00000555347.1
|
FOS
|
FBJ murine osteosarcoma viral oncogene homolog |
| chr19_-_44174305 | 0.76 |
ENST00000601723.1
ENST00000339082.3 |
PLAUR
|
plasminogen activator, urokinase receptor |
| chr3_+_102153859 | 0.76 |
ENST00000306176.1
ENST00000466937.1 |
ZPLD1
|
zona pellucida-like domain containing 1 |
| chr17_-_43502987 | 0.75 |
ENST00000376922.2
|
ARHGAP27
|
Rho GTPase activating protein 27 |
| chr7_-_81399329 | 0.74 |
ENST00000453411.1
ENST00000444829.2 |
HGF
|
hepatocyte growth factor (hepapoietin A; scatter factor) |
| chr16_+_67313412 | 0.74 |
ENST00000379344.3
ENST00000568621.1 ENST00000450733.1 ENST00000567938.1 |
PLEKHG4
|
pleckstrin homology domain containing, family G (with RhoGef domain) member 4 |
| chr1_-_211752073 | 0.74 |
ENST00000367001.4
|
SLC30A1
|
solute carrier family 30 (zinc transporter), member 1 |
| chr7_+_142494038 | 0.74 |
ENST00000390412.1
|
TRBJ2-1
|
T cell receptor beta joining 2-1 |
| chr2_-_85636928 | 0.74 |
ENST00000449030.1
|
CAPG
|
capping protein (actin filament), gelsolin-like |
| chr4_+_123300664 | 0.73 |
ENST00000388725.2
|
ADAD1
|
adenosine deaminase domain containing 1 (testis-specific) |
| chr1_-_26633067 | 0.73 |
ENST00000421827.2
ENST00000374215.1 ENST00000374223.1 ENST00000357089.4 ENST00000535108.1 ENST00000314675.7 ENST00000436301.2 ENST00000423664.1 ENST00000374221.3 |
UBXN11
|
UBX domain protein 11 |
| chr12_-_6961050 | 0.73 |
ENST00000538862.2
|
CDCA3
|
cell division cycle associated 3 |
| chr14_+_75746664 | 0.72 |
ENST00000557139.1
|
FOS
|
FBJ murine osteosarcoma viral oncogene homolog |
| chr19_-_36297348 | 0.72 |
ENST00000589835.1
|
PRODH2
|
proline dehydrogenase (oxidase) 2 |
| chr1_-_153066998 | 0.71 |
ENST00000368750.3
|
SPRR2E
|
small proline-rich protein 2E |
| chr17_-_26662464 | 0.70 |
ENST00000579419.1
ENST00000585313.1 ENST00000395418.3 ENST00000578985.1 ENST00000577498.1 ENST00000585089.1 ENST00000357896.3 |
IFT20
|
intraflagellar transport 20 homolog (Chlamydomonas) |
| chr2_+_102758210 | 0.70 |
ENST00000450319.1
|
IL1R1
|
interleukin 1 receptor, type I |
| chr2_-_152146385 | 0.69 |
ENST00000414946.1
ENST00000243346.5 |
NMI
|
N-myc (and STAT) interactor |
| chr16_+_77233294 | 0.69 |
ENST00000378644.4
|
SYCE1L
|
synaptonemal complex central element protein 1-like |
| chr9_-_117150303 | 0.69 |
ENST00000312033.3
|
AKNA
|
AT-hook transcription factor |
| chr6_+_138266498 | 0.67 |
ENST00000434437.1
ENST00000417800.1 |
RP11-240M16.1
|
RP11-240M16.1 |
| chr12_+_22778291 | 0.65 |
ENST00000545979.1
|
ETNK1
|
ethanolamine kinase 1 |
| chr1_-_24126051 | 0.65 |
ENST00000445705.1
|
GALE
|
UDP-galactose-4-epimerase |
| chr21_+_30502806 | 0.64 |
ENST00000399928.1
ENST00000399926.1 |
MAP3K7CL
|
MAP3K7 C-terminal like |
| chr1_-_159832438 | 0.64 |
ENST00000368100.1
|
VSIG8
|
V-set and immunoglobulin domain containing 8 |
| chrX_+_16804544 | 0.64 |
ENST00000380122.5
ENST00000398155.4 |
TXLNG
|
taxilin gamma |
| chr1_+_158325684 | 0.64 |
ENST00000368162.2
|
CD1E
|
CD1e molecule |
| chr6_+_159290917 | 0.62 |
ENST00000367072.1
|
C6orf99
|
chromosome 6 open reading frame 99 |
| chr17_+_19281034 | 0.62 |
ENST00000308406.5
ENST00000299612.7 |
MAPK7
|
mitogen-activated protein kinase 7 |
| chr19_-_6690723 | 0.59 |
ENST00000601008.1
|
C3
|
complement component 3 |
| chr19_+_55235969 | 0.58 |
ENST00000402254.2
ENST00000538269.1 ENST00000541392.1 ENST00000291860.1 ENST00000396284.2 |
KIR3DL1
KIR3DL3
KIR2DL4
|
killer cell immunoglobulin-like receptor, three domains, long cytoplasmic tail, 1 killer cell immunoglobulin-like receptor, three domains, long cytoplasmic tail, 3 killer cell immunoglobulin-like receptor, two domains, long cytoplasmic tail, 4 |
| chr7_-_81399678 | 0.58 |
ENST00000412881.1
|
HGF
|
hepatocyte growth factor (hepapoietin A; scatter factor) |
| chr19_+_55281260 | 0.58 |
ENST00000336077.6
ENST00000291633.7 |
KIR2DL1
|
killer cell immunoglobulin-like receptor, two domains, long cytoplasmic tail, 1 |
| chr19_-_44171817 | 0.58 |
ENST00000593714.1
|
PLAUR
|
plasminogen activator, urokinase receptor |
| chr15_-_81195510 | 0.56 |
ENST00000561295.1
|
RP11-351M8.1
|
Uncharacterized protein |
| chr22_-_41215291 | 0.53 |
ENST00000542412.1
ENST00000544408.1 |
SLC25A17
|
solute carrier family 25 (mitochondrial carrier; peroxisomal membrane protein, 34kDa), member 17 |
| chr6_+_131958436 | 0.53 |
ENST00000357639.3
ENST00000543135.1 ENST00000427148.2 ENST00000358229.5 |
ENPP3
|
ectonucleotide pyrophosphatase/phosphodiesterase 3 |
| chr7_-_81399411 | 0.53 |
ENST00000423064.2
|
HGF
|
hepatocyte growth factor (hepapoietin A; scatter factor) |
| chrX_-_48216101 | 0.53 |
ENST00000298396.2
ENST00000376893.3 |
SSX3
|
synovial sarcoma, X breakpoint 3 |
| chr19_+_11546440 | 0.53 |
ENST00000589126.1
ENST00000588269.1 ENST00000587509.1 ENST00000592741.1 ENST00000593101.1 ENST00000587327.1 |
PRKCSH
|
protein kinase C substrate 80K-H |
| chr22_-_41215328 | 0.52 |
ENST00000434185.1
ENST00000435456.2 |
SLC25A17
|
solute carrier family 25 (mitochondrial carrier; peroxisomal membrane protein, 34kDa), member 17 |
| chr8_-_99954788 | 0.51 |
ENST00000523601.1
|
STK3
|
serine/threonine kinase 3 |
| chr1_+_92417716 | 0.51 |
ENST00000402388.1
|
BRDT
|
bromodomain, testis-specific |
| chr2_-_208030886 | 0.50 |
ENST00000426163.1
|
KLF7
|
Kruppel-like factor 7 (ubiquitous) |
| chr11_+_120081475 | 0.49 |
ENST00000328965.4
|
OAF
|
OAF homolog (Drosophila) |
| chr17_-_40306934 | 0.49 |
ENST00000592574.1
ENST00000550406.1 ENST00000547517.1 ENST00000393860.3 ENST00000346213.4 |
CTD-2132N18.3
RAB5C
|
Uncharacterized protein RAB5C, member RAS oncogene family |
| chr14_+_101908402 | 0.49 |
ENST00000555725.1
|
RP11-168L7.3
|
RP11-168L7.3 |
| chr19_+_11546153 | 0.48 |
ENST00000591946.1
ENST00000252455.2 ENST00000412601.1 |
PRKCSH
|
protein kinase C substrate 80K-H |
| chr4_-_151936865 | 0.47 |
ENST00000535741.1
|
LRBA
|
LPS-responsive vesicle trafficking, beach and anchor containing |
| chr7_-_81399744 | 0.46 |
ENST00000421558.1
|
HGF
|
hepatocyte growth factor (hepapoietin A; scatter factor) |
| chr10_-_5060201 | 0.46 |
ENST00000407674.1
|
AKR1C2
|
aldo-keto reductase family 1, member C2 |
| chr1_-_204165610 | 0.45 |
ENST00000367194.4
|
KISS1
|
KiSS-1 metastasis-suppressor |
| chr7_+_117864815 | 0.45 |
ENST00000433239.1
|
ANKRD7
|
ankyrin repeat domain 7 |
| chr12_+_113590909 | 0.45 |
ENST00000550918.1
|
CCDC42B
|
coiled-coil domain containing 42B |
| chr6_-_130031358 | 0.44 |
ENST00000368149.2
|
ARHGAP18
|
Rho GTPase activating protein 18 |
| chr15_+_60296421 | 0.44 |
ENST00000396057.4
|
FOXB1
|
forkhead box B1 |
| chr19_+_10197463 | 0.43 |
ENST00000590378.1
ENST00000397881.3 |
C19orf66
|
chromosome 19 open reading frame 66 |
| chr17_+_7533439 | 0.43 |
ENST00000441599.2
ENST00000380450.4 ENST00000416273.3 ENST00000575903.1 ENST00000576830.1 ENST00000571153.1 ENST00000575618.1 ENST00000576152.1 |
SHBG
|
sex hormone-binding globulin |
| chr12_+_8850277 | 0.43 |
ENST00000539923.1
ENST00000537189.1 |
RIMKLB
|
ribosomal modification protein rimK-like family member B |
| chr14_-_94984181 | 0.43 |
ENST00000341228.2
|
SERPINA12
|
serpin peptidase inhibitor, clade A (alpha-1 antiproteinase, antitrypsin), member 12 |
| chr21_+_19617140 | 0.42 |
ENST00000299295.2
ENST00000338326.3 |
CHODL
|
chondrolectin |
| chr12_-_6960407 | 0.41 |
ENST00000540683.1
ENST00000229265.6 ENST00000535406.1 ENST00000422785.3 |
CDCA3
|
cell division cycle associated 3 |
| chr8_-_38326119 | 0.41 |
ENST00000356207.5
ENST00000326324.6 |
FGFR1
|
fibroblast growth factor receptor 1 |
| chr11_-_44972476 | 0.40 |
ENST00000527685.1
ENST00000308212.5 |
TP53I11
|
tumor protein p53 inducible protein 11 |
| chr10_-_5060147 | 0.40 |
ENST00000604507.1
|
AKR1C2
|
aldo-keto reductase family 1, member C2 |
| chr6_+_83073334 | 0.39 |
ENST00000369750.3
|
TPBG
|
trophoblast glycoprotein |
| chr2_-_47382442 | 0.39 |
ENST00000445927.2
|
C2orf61
|
chromosome 2 open reading frame 61 |
| chr1_+_203765437 | 0.39 |
ENST00000550078.1
|
ZBED6
|
zinc finger, BED-type containing 6 |
| chr1_+_33219592 | 0.38 |
ENST00000373481.3
|
KIAA1522
|
KIAA1522 |
| chr1_+_113009163 | 0.38 |
ENST00000256640.5
|
WNT2B
|
wingless-type MMTV integration site family, member 2B |
| chr19_-_1021113 | 0.38 |
ENST00000333175.5
ENST00000356663.3 |
TMEM259
|
transmembrane protein 259 |
| chr19_+_11546093 | 0.37 |
ENST00000591462.1
|
PRKCSH
|
protein kinase C substrate 80K-H |
| chr20_-_60942361 | 0.37 |
ENST00000252999.3
|
LAMA5
|
laminin, alpha 5 |
| chr17_-_61523622 | 0.37 |
ENST00000448884.2
ENST00000582297.1 ENST00000582034.1 ENST00000578072.1 ENST00000360793.3 |
CYB561
|
cytochrome b561 |
| chr6_+_160221293 | 0.37 |
ENST00000610273.1
ENST00000392167.3 |
PNLDC1
|
poly(A)-specific ribonuclease (PARN)-like domain containing 1 |
| chr9_+_132044730 | 0.36 |
ENST00000455981.1
|
RP11-344B5.2
|
RP11-344B5.2 |
| chr12_-_52867569 | 0.36 |
ENST00000252250.6
|
KRT6C
|
keratin 6C |
| chr17_-_26662440 | 0.36 |
ENST00000578122.1
|
IFT20
|
intraflagellar transport 20 homolog (Chlamydomonas) |
| chr2_+_108905325 | 0.36 |
ENST00000438339.1
ENST00000409880.1 ENST00000437390.2 |
SULT1C2
|
sulfotransferase family, cytosolic, 1C, member 2 |
| chr6_+_88106840 | 0.36 |
ENST00000369570.4
|
C6orf164
|
chromosome 6 open reading frame 164 |
| chr9_-_99637820 | 0.32 |
ENST00000289032.8
ENST00000535338.1 |
ZNF782
|
zinc finger protein 782 |
| chr13_-_96296944 | 0.32 |
ENST00000361396.2
ENST00000376829.2 |
DZIP1
|
DAZ interacting zinc finger protein 1 |
| chr7_+_134576317 | 0.31 |
ENST00000424922.1
ENST00000495522.1 |
CALD1
|
caldesmon 1 |
| chr8_+_56074008 | 0.31 |
ENST00000522559.1
|
RP11-386G21.2
|
Uncharacterized protein |
| chr13_+_24144509 | 0.31 |
ENST00000248484.4
|
TNFRSF19
|
tumor necrosis factor receptor superfamily, member 19 |
| chr16_-_52640834 | 0.30 |
ENST00000510238.3
|
CASC16
|
cancer susceptibility candidate 16 (non-protein coding) |
| chr7_+_117864708 | 0.30 |
ENST00000357099.4
ENST00000265224.4 ENST00000486422.1 ENST00000417525.1 |
ANKRD7
|
ankyrin repeat domain 7 |
| chr15_-_33180439 | 0.30 |
ENST00000559610.1
|
FMN1
|
formin 1 |
| chr6_+_43149903 | 0.29 |
ENST00000252050.4
ENST00000354495.3 ENST00000372647.2 |
CUL9
|
cullin 9 |
| chr17_+_26662597 | 0.29 |
ENST00000544907.2
|
TNFAIP1
|
tumor necrosis factor, alpha-induced protein 1 (endothelial) |
| chr3_+_133502877 | 0.29 |
ENST00000466490.2
|
SRPRB
|
signal recognition particle receptor, B subunit |
| chr21_+_30503282 | 0.28 |
ENST00000399925.1
|
MAP3K7CL
|
MAP3K7 C-terminal like |
| chrX_+_100353153 | 0.28 |
ENST00000423383.1
ENST00000218507.5 ENST00000403304.2 ENST00000435570.1 |
CENPI
|
centromere protein I |
| chrX_-_106146547 | 0.28 |
ENST00000276173.4
ENST00000411805.1 |
RIPPLY1
|
ripply transcriptional repressor 1 |
| chr1_+_1334914 | 0.26 |
ENST00000576232.1
ENST00000570344.1 |
RP4-758J18.2
|
HCG20425, isoform CRA_a; Uncharacterized protein; cDNA FLJ53815 |
| chr17_+_26662679 | 0.26 |
ENST00000578158.1
|
TNFAIP1
|
tumor necrosis factor, alpha-induced protein 1 (endothelial) |
| chr9_+_139553306 | 0.25 |
ENST00000371699.1
|
EGFL7
|
EGF-like-domain, multiple 7 |
| chr2_+_101223490 | 0.25 |
ENST00000414647.1
ENST00000424342.1 |
AC068538.4
|
AC068538.4 |
| chr20_+_34129770 | 0.25 |
ENST00000348547.2
ENST00000357394.4 ENST00000447986.1 ENST00000279052.6 ENST00000416206.1 ENST00000411577.1 ENST00000413587.1 |
ERGIC3
|
ERGIC and golgi 3 |
| chr22_+_40441456 | 0.25 |
ENST00000402203.1
|
TNRC6B
|
trinucleotide repeat containing 6B |
| chr16_+_66429358 | 0.24 |
ENST00000539168.1
|
CDH5
|
cadherin 5, type 2 (vascular endothelium) |
| chr7_-_81399287 | 0.24 |
ENST00000354224.6
|
HGF
|
hepatocyte growth factor (hepapoietin A; scatter factor) |
| chr3_-_57678772 | 0.23 |
ENST00000311128.5
|
DENND6A
|
DENN/MADD domain containing 6A |
| chr2_+_234601512 | 0.23 |
ENST00000305139.6
|
UGT1A6
|
UDP glucuronosyltransferase 1 family, polypeptide A6 |
| chr1_+_35225339 | 0.23 |
ENST00000339480.1
|
GJB4
|
gap junction protein, beta 4, 30.3kDa |
| chr2_+_108905095 | 0.23 |
ENST00000251481.6
ENST00000326853.5 |
SULT1C2
|
sulfotransferase family, cytosolic, 1C, member 2 |
| chr12_-_56727676 | 0.23 |
ENST00000547572.1
ENST00000257931.5 ENST00000440411.3 |
PAN2
|
PAN2 poly(A) specific ribonuclease subunit homolog (S. cerevisiae) |
| chr12_+_57610562 | 0.22 |
ENST00000349394.5
|
NXPH4
|
neurexophilin 4 |
| chr3_+_127770455 | 0.22 |
ENST00000464451.1
|
SEC61A1
|
Sec61 alpha 1 subunit (S. cerevisiae) |
| chr14_-_24809154 | 0.21 |
ENST00000216274.5
|
RIPK3
|
receptor-interacting serine-threonine kinase 3 |
| chr8_-_38326139 | 0.21 |
ENST00000335922.5
ENST00000532791.1 ENST00000397091.5 |
FGFR1
|
fibroblast growth factor receptor 1 |
| chr12_-_117318788 | 0.21 |
ENST00000550505.1
|
HRK
|
harakiri, BCL2 interacting protein (contains only BH3 domain) |
| chr12_+_8849773 | 0.21 |
ENST00000541044.1
|
RIMKLB
|
ribosomal modification protein rimK-like family member B |
| chr12_-_49351303 | 0.21 |
ENST00000256682.4
|
ARF3
|
ADP-ribosylation factor 3 |
| chr3_+_142315225 | 0.20 |
ENST00000457734.2
ENST00000483373.1 ENST00000475296.1 ENST00000495744.1 ENST00000476044.1 ENST00000461644.1 |
PLS1
|
plastin 1 |
| chr5_+_50678921 | 0.20 |
ENST00000230658.7
|
ISL1
|
ISL LIM homeobox 1 |
| chr1_-_91813006 | 0.20 |
ENST00000430465.1
|
HFM1
|
HFM1, ATP-dependent DNA helicase homolog (S. cerevisiae) |
| chr10_-_14596140 | 0.19 |
ENST00000496330.1
|
FAM107B
|
family with sequence similarity 107, member B |
| chr2_-_103353277 | 0.19 |
ENST00000258436.5
|
MFSD9
|
major facilitator superfamily domain containing 9 |
| chr12_-_49351228 | 0.18 |
ENST00000541959.1
ENST00000447318.2 |
ARF3
|
ADP-ribosylation factor 3 |
| chr2_-_152118276 | 0.18 |
ENST00000409092.1
|
RBM43
|
RNA binding motif protein 43 |
| chr2_-_216003127 | 0.18 |
ENST00000412081.1
ENST00000272895.7 |
ABCA12
|
ATP-binding cassette, sub-family A (ABC1), member 12 |
| chr1_-_156542328 | 0.17 |
ENST00000361170.2
|
IQGAP3
|
IQ motif containing GTPase activating protein 3 |
| chr7_-_28220354 | 0.17 |
ENST00000283928.5
|
JAZF1
|
JAZF zinc finger 1 |
| chr21_-_45078019 | 0.17 |
ENST00000542962.1
|
HSF2BP
|
heat shock transcription factor 2 binding protein |
| chr4_+_26322185 | 0.17 |
ENST00000361572.6
|
RBPJ
|
recombination signal binding protein for immunoglobulin kappa J region |
| chr17_-_35969409 | 0.17 |
ENST00000394378.2
ENST00000585472.1 ENST00000591288.1 ENST00000502449.2 ENST00000345615.4 ENST00000346661.4 ENST00000585689.1 ENST00000339208.6 |
SYNRG
|
synergin, gamma |
| chr1_+_39456895 | 0.16 |
ENST00000432648.3
ENST00000446189.2 ENST00000372984.4 |
AKIRIN1
|
akirin 1 |
| chr5_-_137514333 | 0.16 |
ENST00000411594.2
ENST00000430331.1 |
BRD8
|
bromodomain containing 8 |
| chr3_-_126373929 | 0.16 |
ENST00000523403.1
ENST00000524230.2 |
TXNRD3
|
thioredoxin reductase 3 |
| chr12_-_56710118 | 0.16 |
ENST00000273308.4
|
CNPY2
|
canopy FGF signaling regulator 2 |
| chr8_-_30890710 | 0.16 |
ENST00000523392.1
|
PURG
|
purine-rich element binding protein G |
| chr20_+_3190006 | 0.15 |
ENST00000380113.3
ENST00000455664.2 ENST00000399838.3 |
ITPA
|
inosine triphosphatase (nucleoside triphosphate pyrophosphatase) |
| chr11_+_93754513 | 0.15 |
ENST00000315765.9
|
HEPHL1
|
hephaestin-like 1 |
Network of associatons between targets according to the STRING database.

First level regulatory network of T
Gene Ontology Analysis
Gene overrepresentation in biological_process category:
| Log-likelihood per target | Total log-likelihood | Term | Description |
|---|---|---|---|
| 0.6 | 1.8 | GO:0045210 | negative regulation of dendritic cell cytokine production(GO:0002731) FasL biosynthetic process(GO:0045210) |
| 0.6 | 3.6 | GO:2000661 | positive regulation of interleukin-1-mediated signaling pathway(GO:2000661) |
| 0.5 | 3.5 | GO:2000503 | positive regulation of natural killer cell chemotaxis(GO:2000503) |
| 0.4 | 4.9 | GO:0060665 | regulation of branching involved in salivary gland morphogenesis by mesenchymal-epithelial signaling(GO:0060665) |
| 0.4 | 1.8 | GO:1904845 | response to L-glutamine(GO:1904844) cellular response to L-glutamine(GO:1904845) |
| 0.3 | 1.0 | GO:0043132 | coenzyme A transport(GO:0015880) coenzyme A transmembrane transport(GO:0035349) NAD transport(GO:0043132) adenosine 3',5'-bisphosphate transmembrane transport(GO:0071106) AMP transport(GO:0080121) |
| 0.3 | 1.6 | GO:1900748 | positive regulation of vascular endothelial growth factor signaling pathway(GO:1900748) |
| 0.3 | 1.6 | GO:0038112 | interleukin-8-mediated signaling pathway(GO:0038112) |
| 0.3 | 2.1 | GO:0038195 | urokinase plasminogen activator signaling pathway(GO:0038195) |
| 0.2 | 1.0 | GO:0006788 | heme oxidation(GO:0006788) negative regulation of mast cell cytokine production(GO:0032764) |
| 0.2 | 2.2 | GO:0048539 | bone marrow development(GO:0048539) |
| 0.2 | 1.4 | GO:0060800 | regulation of cell differentiation involved in embryonic placenta development(GO:0060800) |
| 0.2 | 3.4 | GO:0021520 | spinal cord motor neuron cell fate specification(GO:0021520) |
| 0.2 | 0.6 | GO:0070376 | regulation of ERK5 cascade(GO:0070376) negative regulation of ERK5 cascade(GO:0070377) |
| 0.2 | 0.6 | GO:0002894 | positive regulation of type IIa hypersensitivity(GO:0001798) positive regulation of type II hypersensitivity(GO:0002894) |
| 0.2 | 0.5 | GO:0030505 | inorganic diphosphate transport(GO:0030505) |
| 0.2 | 0.5 | GO:0001207 | histone displacement(GO:0001207) positive regulation of transcription involved in meiotic cell cycle(GO:0051039) |
| 0.2 | 0.8 | GO:0038098 | sequestering of BMP from receptor via BMP binding(GO:0038098) |
| 0.2 | 1.2 | GO:2001268 | negative regulation of cysteine-type endopeptidase activity involved in apoptotic signaling pathway(GO:2001268) |
| 0.2 | 1.7 | GO:0071847 | TNFSF11-mediated signaling pathway(GO:0071847) |
| 0.2 | 1.5 | GO:0001661 | conditioned taste aversion(GO:0001661) |
| 0.2 | 2.6 | GO:0001867 | complement activation, lectin pathway(GO:0001867) |
| 0.2 | 0.5 | GO:0033686 | positive regulation of luteinizing hormone secretion(GO:0033686) |
| 0.2 | 0.9 | GO:0002018 | renin-angiotensin regulation of aldosterone production(GO:0002018) |
| 0.1 | 0.7 | GO:0097501 | detoxification of inorganic compound(GO:0061687) stress response to metal ion(GO:0097501) |
| 0.1 | 0.4 | GO:0007412 | axon target recognition(GO:0007412) |
| 0.1 | 1.3 | GO:0048859 | formation of anatomical boundary(GO:0048859) |
| 0.1 | 0.4 | GO:0044727 | DNA demethylation of male pronucleus(GO:0044727) |
| 0.1 | 1.1 | GO:0060414 | aorta smooth muscle tissue morphogenesis(GO:0060414) |
| 0.1 | 0.7 | GO:0045349 | interferon-alpha biosynthetic process(GO:0045349) regulation of interferon-alpha biosynthetic process(GO:0045354) |
| 0.1 | 0.9 | GO:0071395 | response to jasmonic acid(GO:0009753) cellular response to jasmonic acid stimulus(GO:0071395) |
| 0.1 | 0.7 | GO:0010133 | proline catabolic process to glutamate(GO:0010133) |
| 0.1 | 1.6 | GO:0019388 | galactose catabolic process(GO:0019388) |
| 0.1 | 0.2 | GO:0039019 | pronephric nephron development(GO:0039019) |
| 0.1 | 0.2 | GO:0035698 | CD8-positive, alpha-beta cytotoxic T cell extravasation(GO:0035698) positive regulation of necroptotic process(GO:0060545) regulation of CD8-positive, alpha-beta cytotoxic T cell extravasation(GO:2000452) |
| 0.1 | 1.1 | GO:0035845 | photoreceptor cell outer segment organization(GO:0035845) |
| 0.1 | 1.8 | GO:0048935 | peripheral nervous system neuron differentiation(GO:0048934) peripheral nervous system neuron development(GO:0048935) |
| 0.1 | 2.0 | GO:0036342 | post-anal tail morphogenesis(GO:0036342) |
| 0.1 | 0.4 | GO:0060638 | mesenchymal-epithelial cell signaling(GO:0060638) |
| 0.1 | 0.6 | GO:0048007 | antigen processing and presentation of lipid antigen via MHC class Ib(GO:0048003) antigen processing and presentation, exogenous lipid antigen via MHC class Ib(GO:0048007) |
| 0.1 | 0.6 | GO:0002767 | immune response-inhibiting cell surface receptor signaling pathway(GO:0002767) |
| 0.1 | 0.2 | GO:0046041 | ITP metabolic process(GO:0046041) |
| 0.0 | 0.3 | GO:0001757 | somite specification(GO:0001757) |
| 0.0 | 0.2 | GO:0035627 | ceramide transport(GO:0035627) |
| 0.0 | 3.1 | GO:0006910 | phagocytosis, recognition(GO:0006910) |
| 0.0 | 0.3 | GO:0072092 | ureteric bud invasion(GO:0072092) |
| 0.0 | 0.3 | GO:1901297 | arterial endothelial cell fate commitment(GO:0060844) positive regulation of ephrin receptor signaling pathway(GO:1901189) positive regulation of canonical Wnt signaling pathway involved in cardiac muscle cell fate commitment(GO:1901297) positive regulation of canonical Wnt signaling pathway involved in heart development(GO:1905068) |
| 0.0 | 2.1 | GO:0048247 | lymphocyte chemotaxis(GO:0048247) |
| 0.0 | 1.4 | GO:0006491 | N-glycan processing(GO:0006491) |
| 0.0 | 2.9 | GO:0099601 | regulation of neurotransmitter receptor activity(GO:0099601) |
| 0.0 | 0.5 | GO:0048227 | plasma membrane to endosome transport(GO:0048227) |
| 0.0 | 0.1 | GO:0003245 | cardiac muscle tissue growth involved in heart morphogenesis(GO:0003245) |
| 0.0 | 0.7 | GO:0071803 | positive regulation of podosome assembly(GO:0071803) |
| 0.0 | 1.3 | GO:0050869 | negative regulation of B cell activation(GO:0050869) |
| 0.0 | 0.2 | GO:2000049 | positive regulation of cell-cell adhesion mediated by cadherin(GO:2000049) |
| 0.0 | 0.2 | GO:0045716 | positive regulation of low-density lipoprotein particle receptor biosynthetic process(GO:0045716) |
| 0.0 | 0.4 | GO:0045721 | negative regulation of gluconeogenesis(GO:0045721) |
| 0.0 | 0.1 | GO:0016103 | diterpenoid catabolic process(GO:0016103) retinoic acid catabolic process(GO:0034653) |
| 0.0 | 0.2 | GO:0042048 | olfactory behavior(GO:0042048) |
| 0.0 | 0.7 | GO:0007130 | synaptonemal complex assembly(GO:0007130) |
| 0.0 | 0.6 | GO:0006646 | phosphatidylethanolamine biosynthetic process(GO:0006646) |
| 0.0 | 0.2 | GO:1901552 | positive regulation of endothelial cell development(GO:1901552) positive regulation of establishment of endothelial barrier(GO:1903142) |
| 0.0 | 0.1 | GO:0061624 | fructose catabolic process(GO:0006001) fructose catabolic process to hydroxyacetone phosphate and glyceraldehyde-3-phosphate(GO:0061624) |
| 0.0 | 1.7 | GO:0018149 | peptide cross-linking(GO:0018149) |
| 0.0 | 0.2 | GO:0006366 | transcription from RNA polymerase II promoter(GO:0006366) |
| 0.0 | 0.2 | GO:0052697 | flavonoid glucuronidation(GO:0052696) xenobiotic glucuronidation(GO:0052697) |
| 0.0 | 0.5 | GO:0046546 | male gonad development(GO:0008584) development of primary male sexual characteristics(GO:0046546) |
| 0.0 | 0.9 | GO:2000772 | regulation of cellular senescence(GO:2000772) |
| 0.0 | 0.6 | GO:0051923 | sulfation(GO:0051923) |
| 0.0 | 0.1 | GO:0000707 | meiotic DNA recombinase assembly(GO:0000707) |
| 0.0 | 0.1 | GO:2000158 | positive regulation of ubiquitin-specific protease activity(GO:2000158) |
| 0.0 | 0.6 | GO:0035024 | negative regulation of Rho protein signal transduction(GO:0035024) |
| 0.0 | 0.4 | GO:1904294 | positive regulation of ERAD pathway(GO:1904294) |
| 0.0 | 0.1 | GO:1902896 | terminal web assembly(GO:1902896) |
| 0.0 | 0.9 | GO:0042149 | cellular response to glucose starvation(GO:0042149) |
| 0.0 | 0.1 | GO:2000210 | positive regulation of anoikis(GO:2000210) |
| 0.0 | 0.4 | GO:0060445 | branching involved in salivary gland morphogenesis(GO:0060445) |
| 0.0 | 0.1 | GO:0045653 | negative regulation of megakaryocyte differentiation(GO:0045653) |
| 0.0 | 0.2 | GO:0033601 | positive regulation of mammary gland epithelial cell proliferation(GO:0033601) |
| 0.0 | 0.2 | GO:0045974 | miRNA mediated inhibition of translation(GO:0035278) negative regulation of translation, ncRNA-mediated(GO:0040033) regulation of translation, ncRNA-mediated(GO:0045974) |
| 0.0 | 0.2 | GO:0000712 | resolution of meiotic recombination intermediates(GO:0000712) |
| 0.0 | 0.3 | GO:0006936 | muscle contraction(GO:0006936) |
| 0.0 | 1.2 | GO:0042795 | snRNA transcription(GO:0009301) snRNA transcription from RNA polymerase II promoter(GO:0042795) |
Gene overrepresentation in cellular_component category:
| Log-likelihood per target | Total log-likelihood | Term | Description |
|---|---|---|---|
| 0.4 | 1.1 | GO:1902636 | kinociliary basal body(GO:1902636) |
| 0.2 | 3.2 | GO:0019907 | cyclin-dependent protein kinase activating kinase holoenzyme complex(GO:0019907) |
| 0.2 | 1.5 | GO:0035976 | AP1 complex(GO:0035976) |
| 0.2 | 1.2 | GO:0070876 | SOSS complex(GO:0070876) |
| 0.1 | 2.1 | GO:0071438 | invadopodium membrane(GO:0071438) |
| 0.1 | 0.4 | GO:0042585 | germinal vesicle(GO:0042585) |
| 0.1 | 1.8 | GO:0043020 | NADPH oxidase complex(GO:0043020) |
| 0.1 | 0.4 | GO:0043260 | laminin-11 complex(GO:0043260) |
| 0.1 | 0.9 | GO:0097486 | alveolar lamellar body(GO:0097208) multivesicular body lumen(GO:0097486) |
| 0.1 | 1.1 | GO:0005583 | fibrillar collagen trimer(GO:0005583) banded collagen fibril(GO:0098643) |
| 0.1 | 3.1 | GO:0042571 | immunoglobulin complex, circulating(GO:0042571) |
| 0.1 | 0.2 | GO:0031251 | PAN complex(GO:0031251) |
| 0.1 | 4.3 | GO:0001533 | cornified envelope(GO:0001533) |
| 0.0 | 0.7 | GO:0008290 | F-actin capping protein complex(GO:0008290) |
| 0.0 | 4.3 | GO:0031093 | platelet alpha granule lumen(GO:0031093) |
| 0.0 | 1.0 | GO:0031231 | integral component of peroxisomal membrane(GO:0005779) intrinsic component of peroxisomal membrane(GO:0031231) |
| 0.0 | 0.3 | GO:0002193 | MAML1-RBP-Jkappa- ICN1 complex(GO:0002193) |
| 0.0 | 0.3 | GO:0005785 | signal recognition particle receptor complex(GO:0005785) |
| 0.0 | 0.2 | GO:0097209 | epidermal lamellar body(GO:0097209) |
| 0.0 | 0.2 | GO:0030121 | AP-1 adaptor complex(GO:0030121) |
| 0.0 | 0.3 | GO:0030478 | actin cap(GO:0030478) |
| 0.0 | 0.9 | GO:0090665 | dystrophin-associated glycoprotein complex(GO:0016010) glycoprotein complex(GO:0090665) |
| 0.0 | 0.1 | GO:1990357 | terminal web(GO:1990357) |
| 0.0 | 0.1 | GO:0033063 | Rad51B-Rad51C-Rad51D-XRCC2 complex(GO:0033063) |
| 0.0 | 0.3 | GO:0097539 | ciliary transition fiber(GO:0097539) |
| 0.0 | 3.4 | GO:0031225 | anchored component of membrane(GO:0031225) |
| 0.0 | 0.7 | GO:0000795 | synaptonemal complex(GO:0000795) |
| 0.0 | 2.7 | GO:0005923 | bicellular tight junction(GO:0005923) |
Gene overrepresentation in molecular_function category:
| Log-likelihood per target | Total log-likelihood | Term | Description |
|---|---|---|---|
| 0.5 | 3.6 | GO:0004909 | interleukin-1, Type I, activating receptor activity(GO:0004909) |
| 0.5 | 3.5 | GO:0031726 | CCR1 chemokine receptor binding(GO:0031726) |
| 0.4 | 1.6 | GO:0003974 | UDP-N-acetylglucosamine 4-epimerase activity(GO:0003974) UDP-glucose 4-epimerase activity(GO:0003978) |
| 0.3 | 1.0 | GO:0015228 | coenzyme A transmembrane transporter activity(GO:0015228) adenosine 3',5'-bisphosphate transmembrane transporter activity(GO:0071077) AMP transmembrane transporter activity(GO:0080122) |
| 0.3 | 2.1 | GO:0030377 | urokinase plasminogen activator receptor activity(GO:0030377) |
| 0.3 | 1.6 | GO:0004918 | interleukin-8 receptor activity(GO:0004918) |
| 0.2 | 1.0 | GO:0004392 | heme oxygenase (decyclizing) activity(GO:0004392) |
| 0.2 | 3.3 | GO:0030280 | structural constituent of epidermis(GO:0030280) |
| 0.2 | 0.6 | GO:0072591 | citrate-L-glutamate ligase activity(GO:0072591) |
| 0.2 | 1.1 | GO:0002046 | opsin binding(GO:0002046) |
| 0.2 | 0.7 | GO:0004657 | proline dehydrogenase activity(GO:0004657) |
| 0.2 | 2.9 | GO:0099602 | acetylcholine receptor regulator activity(GO:0030548) neurotransmitter receptor regulator activity(GO:0099602) |
| 0.1 | 0.7 | GO:0035529 | NADH pyrophosphatase activity(GO:0035529) |
| 0.1 | 0.9 | GO:0047086 | phenanthrene 9,10-monooxygenase activity(GO:0018636) ketosteroid monooxygenase activity(GO:0047086) |
| 0.1 | 0.6 | GO:0030109 | HLA-B specific inhibitory MHC class I receptor activity(GO:0030109) |
| 0.1 | 0.4 | GO:0022865 | transmembrane electron transfer carrier(GO:0022865) |
| 0.1 | 4.3 | GO:0042056 | chemoattractant activity(GO:0042056) |
| 0.1 | 1.8 | GO:0016175 | superoxide-generating NADPH oxidase activity(GO:0016175) |
| 0.1 | 0.6 | GO:0030883 | lipid antigen binding(GO:0030882) endogenous lipid antigen binding(GO:0030883) exogenous lipid antigen binding(GO:0030884) |
| 0.1 | 1.1 | GO:0048407 | platelet-derived growth factor binding(GO:0048407) |
| 0.1 | 0.6 | GO:0004305 | ethanolamine kinase activity(GO:0004305) |
| 0.1 | 2.1 | GO:0048020 | CCR chemokine receptor binding(GO:0048020) |
| 0.1 | 0.5 | GO:0005497 | androgen binding(GO:0005497) |
| 0.1 | 0.6 | GO:0005007 | fibroblast growth factor-activated receptor activity(GO:0005007) |
| 0.0 | 3.1 | GO:0034987 | immunoglobulin receptor binding(GO:0034987) |
| 0.0 | 0.2 | GO:0034040 | lipid-transporting ATPase activity(GO:0034040) |
| 0.0 | 0.3 | GO:0005047 | signal recognition particle binding(GO:0005047) |
| 0.0 | 0.7 | GO:0004000 | adenosine deaminase activity(GO:0004000) |
| 0.0 | 0.8 | GO:0004185 | serine-type carboxypeptidase activity(GO:0004185) |
| 0.0 | 0.9 | GO:0001222 | transcription corepressor binding(GO:0001222) |
| 0.0 | 1.4 | GO:0043539 | protein serine/threonine kinase activator activity(GO:0043539) |
| 0.0 | 0.3 | GO:0016015 | morphogen activity(GO:0016015) |
| 0.0 | 0.1 | GO:0050571 | 1,5-anhydro-D-fructose reductase activity(GO:0050571) |
| 0.0 | 0.6 | GO:0004535 | poly(A)-specific ribonuclease activity(GO:0004535) |
| 0.0 | 0.3 | GO:0019855 | calcium channel inhibitor activity(GO:0019855) |
| 0.0 | 0.7 | GO:0004190 | aspartic-type endopeptidase activity(GO:0004190) |
| 0.0 | 2.5 | GO:0004715 | non-membrane spanning protein tyrosine kinase activity(GO:0004715) |
| 0.0 | 0.2 | GO:0004704 | NF-kappaB-inducing kinase activity(GO:0004704) |
| 0.0 | 1.3 | GO:0005160 | transforming growth factor beta receptor binding(GO:0005160) |
| 0.0 | 0.9 | GO:0004709 | MAP kinase kinase kinase activity(GO:0004709) |
| 0.0 | 0.4 | GO:0000150 | recombinase activity(GO:0000150) |
| 0.0 | 0.6 | GO:0004062 | aryl sulfotransferase activity(GO:0004062) |
| 0.0 | 1.5 | GO:0070412 | R-SMAD binding(GO:0070412) |
| 0.0 | 0.5 | GO:0017049 | GTP-Rho binding(GO:0017049) |
| 0.0 | 0.6 | GO:0004707 | MAP kinase activity(GO:0004707) |
| 0.0 | 1.4 | GO:0005080 | protein kinase C binding(GO:0005080) |
| 0.0 | 5.7 | GO:0004252 | serine-type endopeptidase activity(GO:0004252) |
| 0.0 | 0.1 | GO:0035800 | deubiquitinase activator activity(GO:0035800) |
| 0.0 | 0.1 | GO:0008401 | retinoic acid 4-hydroxylase activity(GO:0008401) |
| 0.0 | 0.2 | GO:0016724 | ferroxidase activity(GO:0004322) oxidoreductase activity, oxidizing metal ions, oxygen as acceptor(GO:0016724) |
| 0.0 | 1.6 | GO:0004222 | metalloendopeptidase activity(GO:0004222) |
| 0.0 | 0.2 | GO:0032027 | myosin light chain binding(GO:0032027) |
| 0.0 | 0.5 | GO:0070577 | lysine-acetylated histone binding(GO:0070577) |
Gene overrepresentation in curated gene sets: canonical pathways category:
| Log-likelihood per target | Total log-likelihood | Term | Description |
|---|---|---|---|
| 0.1 | 1.8 | ST JAK STAT PATHWAY | Jak-STAT Pathway |
| 0.1 | 0.4 | PID AR NONGENOMIC PATHWAY | Nongenotropic Androgen signaling |
| 0.1 | 6.9 | PID SYNDECAN 1 PATHWAY | Syndecan-1-mediated signaling events |
| 0.1 | 8.5 | PID IL12 2PATHWAY | IL12-mediated signaling events |
| 0.1 | 2.1 | PID ARF6 DOWNSTREAM PATHWAY | Arf6 downstream pathway |
| 0.0 | 1.6 | PID IL8 CXCR1 PATHWAY | IL8- and CXCR1-mediated signaling events |
| 0.0 | 1.6 | PID FRA PATHWAY | Validated transcriptional targets of AP1 family members Fra1 and Fra2 |
| 0.0 | 0.6 | PID ERB GENOMIC PATHWAY | Validated nuclear estrogen receptor beta network |
| 0.0 | 4.6 | PID BETA CATENIN NUC PATHWAY | Regulation of nuclear beta catenin signaling and target gene transcription |
| 0.0 | 0.3 | PID ECADHERIN KERATINOCYTE PATHWAY | E-cadherin signaling in keratinocytes |
| 0.0 | 0.4 | SA G1 AND S PHASES | Cdk2, 4, and 6 bind cyclin D in G1, while cdk2/cyclin E promotes the G1/S transition. |
| 0.0 | 0.6 | PID GLYPICAN 1PATHWAY | Glypican 1 network |
| 0.0 | 1.5 | PID RAC1 PATHWAY | RAC1 signaling pathway |
| 0.0 | 6.9 | NABA SECRETED FACTORS | Genes encoding secreted soluble factors |
| 0.0 | 0.6 | PID MAPK TRK PATHWAY | Trk receptor signaling mediated by the MAPK pathway |
| 0.0 | 1.8 | PID SMAD2 3NUCLEAR PATHWAY | Regulation of nuclear SMAD2/3 signaling |
| 0.0 | 0.2 | PID S1P S1P2 PATHWAY | S1P2 pathway |
Gene overrepresentation in curated gene sets: REACTOME pathways category:
| Log-likelihood per target | Total log-likelihood | Term | Description |
|---|---|---|---|
| 0.1 | 3.3 | REACTOME IL 7 SIGNALING | Genes involved in Interleukin-7 signaling |
| 0.1 | 5.1 | REACTOME CHEMOKINE RECEPTORS BIND CHEMOKINES | Genes involved in Chemokine receptors bind chemokines |
| 0.1 | 1.4 | REACTOME CALNEXIN CALRETICULIN CYCLE | Genes involved in Calnexin/calreticulin cycle |
| 0.1 | 1.5 | REACTOME ACTIVATION OF THE AP1 FAMILY OF TRANSCRIPTION FACTORS | Genes involved in Activation of the AP-1 family of transcription factors |
| 0.0 | 3.6 | REACTOME IL1 SIGNALING | Genes involved in Interleukin-1 signaling |
| 0.0 | 2.1 | REACTOME POST TRANSLATIONAL MODIFICATION SYNTHESIS OF GPI ANCHORED PROTEINS | Genes involved in Post-translational modification: synthesis of GPI-anchored proteins |
| 0.0 | 0.6 | REACTOME ERKS ARE INACTIVATED | Genes involved in ERKs are inactivated |
| 0.0 | 1.7 | REACTOME TIGHT JUNCTION INTERACTIONS | Genes involved in Tight junction interactions |
| 0.0 | 1.8 | REACTOME LATENT INFECTION OF HOMO SAPIENS WITH MYCOBACTERIUM TUBERCULOSIS | Genes involved in Latent infection of Homo sapiens with Mycobacterium tuberculosis |
| 0.0 | 1.4 | REACTOME SIGNALING BY HIPPO | Genes involved in Signaling by Hippo |
| 0.0 | 0.6 | REACTOME SIGNALING BY ACTIVATED POINT MUTANTS OF FGFR1 | Genes involved in Signaling by activated point mutants of FGFR1 |
| 0.0 | 1.0 | REACTOME IRON UPTAKE AND TRANSPORT | Genes involved in Iron uptake and transport |
| 0.0 | 2.7 | REACTOME COLLAGEN FORMATION | Genes involved in Collagen formation |
| 0.0 | 1.2 | REACTOME EXTRACELLULAR MATRIX ORGANIZATION | Genes involved in Extracellular matrix organization |
| 0.0 | 1.0 | REACTOME PEROXISOMAL LIPID METABOLISM | Genes involved in Peroxisomal lipid metabolism |
| 0.0 | 0.6 | REACTOME SYNTHESIS OF PE | Genes involved in Synthesis of PE |
| 0.0 | 0.6 | REACTOME INITIAL TRIGGERING OF COMPLEMENT | Genes involved in Initial triggering of complement |
| 0.0 | 0.7 | REACTOME ZINC TRANSPORTERS | Genes involved in Zinc transporters |
| 0.0 | 0.6 | REACTOME CYTOSOLIC SULFONATION OF SMALL MOLECULES | Genes involved in Cytosolic sulfonation of small molecules |
| 0.0 | 0.5 | REACTOME PRE NOTCH TRANSCRIPTION AND TRANSLATION | Genes involved in Pre-NOTCH Transcription and Translation |
| 0.0 | 0.4 | REACTOME SYNTHESIS OF PIPS AT THE GOLGI MEMBRANE | Genes involved in Synthesis of PIPs at the Golgi membrane |