Project
Illumina Body Map 2: averaged replicates
Navigation
Downloads
Results for AGCAGCG
Z-value: 0.56
Motif logo

miRNA associated with seed AGCAGCG
| Name | miRBASE accession |
|---|---|
|
hsa-miR-503-5p
|
MIMAT0002874 |
Activity profile of AGCAGCG motif
Sorted Z-values of AGCAGCG motif
| Promoter | Log-likelihood | Transcript | Gene | Gene Info |
|---|---|---|---|---|
| chrY_+_15016725 | 1.10 |
ENST00000336079.3
|
DDX3Y
|
DEAD (Asp-Glu-Ala-Asp) box helicase 3, Y-linked |
| chr2_+_149632783 | 1.04 |
ENST00000435030.1
|
KIF5C
|
kinesin family member 5C |
| chr12_+_57943781 | 1.04 |
ENST00000455537.2
ENST00000286452.5 |
KIF5A
|
kinesin family member 5A |
| chr8_+_25316489 | 1.03 |
ENST00000330560.3
|
CDCA2
|
cell division cycle associated 2 |
| chr7_+_36429409 | 0.99 |
ENST00000265748.2
|
ANLN
|
anillin, actin binding protein |
| chr6_-_44265411 | 0.87 |
ENST00000371505.4
|
TCTE1
|
t-complex-associated-testis-expressed 1 |
| chr19_+_30302805 | 0.78 |
ENST00000262643.3
ENST00000575243.1 ENST00000357943.5 |
CCNE1
|
cyclin E1 |
| chr15_+_69706585 | 0.75 |
ENST00000559279.1
ENST00000395392.2 |
KIF23
|
kinesin family member 23 |
| chr18_+_76740189 | 0.72 |
ENST00000537592.2
ENST00000575389.2 |
SALL3
|
spalt-like transcription factor 3 |
| chr8_-_67525473 | 0.63 |
ENST00000522677.3
|
MYBL1
|
v-myb avian myeloblastosis viral oncogene homolog-like 1 |
| chrX_-_103087136 | 0.63 |
ENST00000243298.2
|
RAB9B
|
RAB9B, member RAS oncogene family |
| chr3_-_13921594 | 0.60 |
ENST00000285018.4
|
WNT7A
|
wingless-type MMTV integration site family, member 7A |
| chr4_+_128703295 | 0.58 |
ENST00000296464.4
ENST00000508549.1 |
HSPA4L
|
heat shock 70kDa protein 4-like |
| chr9_+_82186872 | 0.55 |
ENST00000376544.3
ENST00000376520.4 |
TLE4
|
transducin-like enhancer of split 4 (E(sp1) homolog, Drosophila) |
| chr6_-_94129244 | 0.55 |
ENST00000369303.4
ENST00000369297.1 |
EPHA7
|
EPH receptor A7 |
| chr5_+_170846640 | 0.52 |
ENST00000274625.5
|
FGF18
|
fibroblast growth factor 18 |
| chr9_-_3525968 | 0.52 |
ENST00000382004.3
ENST00000302303.1 ENST00000449190.1 |
RFX3
|
regulatory factor X, 3 (influences HLA class II expression) |
| chr12_+_4382917 | 0.51 |
ENST00000261254.3
|
CCND2
|
cyclin D2 |
| chr9_+_118916082 | 0.49 |
ENST00000328252.3
|
PAPPA
|
pregnancy-associated plasma protein A, pappalysin 1 |
| chr4_-_76944621 | 0.49 |
ENST00000306602.1
|
CXCL10
|
chemokine (C-X-C motif) ligand 10 |
| chr3_-_48229846 | 0.48 |
ENST00000302506.3
ENST00000351231.3 ENST00000437972.1 |
CDC25A
|
cell division cycle 25A |
| chr5_+_167181917 | 0.48 |
ENST00000519204.1
|
TENM2
|
teneurin transmembrane protein 2 |
| chr18_+_55018044 | 0.47 |
ENST00000324000.3
|
ST8SIA3
|
ST8 alpha-N-acetyl-neuraminide alpha-2,8-sialyltransferase 3 |
| chr19_-_51141196 | 0.47 |
ENST00000338916.4
|
SYT3
|
synaptotagmin III |
| chr6_-_97285336 | 0.47 |
ENST00000229955.3
ENST00000417980.1 |
GPR63
|
G protein-coupled receptor 63 |
| chr17_-_62658186 | 0.46 |
ENST00000262435.9
|
SMURF2
|
SMAD specific E3 ubiquitin protein ligase 2 |
| chr17_+_27920486 | 0.46 |
ENST00000394859.3
|
ANKRD13B
|
ankyrin repeat domain 13B |
| chr16_+_50582222 | 0.46 |
ENST00000268459.3
|
NKD1
|
naked cuticle homolog 1 (Drosophila) |
| chr3_-_123603137 | 0.45 |
ENST00000360304.3
ENST00000359169.1 ENST00000346322.5 ENST00000360772.3 |
MYLK
|
myosin light chain kinase |
| chr8_-_57123815 | 0.44 |
ENST00000316981.3
ENST00000423799.2 ENST00000429357.2 |
PLAG1
|
pleiomorphic adenoma gene 1 |
| chr7_+_140774032 | 0.43 |
ENST00000565468.1
|
TMEM178B
|
transmembrane protein 178B |
| chr19_-_17799008 | 0.41 |
ENST00000519716.2
|
UNC13A
|
unc-13 homolog A (C. elegans) |
| chr4_+_20255123 | 0.41 |
ENST00000504154.1
ENST00000273739.5 |
SLIT2
|
slit homolog 2 (Drosophila) |
| chrX_-_83442915 | 0.38 |
ENST00000262752.2
ENST00000543399.1 |
RPS6KA6
|
ribosomal protein S6 kinase, 90kDa, polypeptide 6 |
| chr5_+_140227048 | 0.38 |
ENST00000532602.1
|
PCDHA9
|
protocadherin alpha 9 |
| chr2_-_37193606 | 0.36 |
ENST00000379213.2
ENST00000263918.4 |
STRN
|
striatin, calmodulin binding protein |
| chr5_+_157170703 | 0.35 |
ENST00000286307.5
|
LSM11
|
LSM11, U7 small nuclear RNA associated |
| chr11_+_125496124 | 0.35 |
ENST00000533778.2
ENST00000534070.1 |
CHEK1
|
checkpoint kinase 1 |
| chr6_+_127439749 | 0.35 |
ENST00000356698.4
|
RSPO3
|
R-spondin 3 |
| chr12_-_8025442 | 0.31 |
ENST00000340749.5
ENST00000535295.1 ENST00000539234.1 |
SLC2A14
|
solute carrier family 2 (facilitated glucose transporter), member 14 |
| chr3_+_49591881 | 0.31 |
ENST00000296452.4
|
BSN
|
bassoon presynaptic cytomatrix protein |
| chr2_-_219925189 | 0.29 |
ENST00000295731.6
|
IHH
|
indian hedgehog |
| chr5_+_140213815 | 0.29 |
ENST00000525929.1
ENST00000378125.3 |
PCDHA7
|
protocadherin alpha 7 |
| chr14_-_39901618 | 0.29 |
ENST00000554932.1
ENST00000298097.7 |
FBXO33
|
F-box protein 33 |
| chr12_+_66217911 | 0.29 |
ENST00000403681.2
|
HMGA2
|
high mobility group AT-hook 2 |
| chr17_+_35294075 | 0.28 |
ENST00000254457.5
|
LHX1
|
LIM homeobox 1 |
| chr17_+_77751931 | 0.28 |
ENST00000310942.4
ENST00000269399.5 |
CBX2
|
chromobox homolog 2 |
| chr5_+_140345820 | 0.28 |
ENST00000289269.5
|
PCDHAC2
|
protocadherin alpha subfamily C, 2 |
| chr8_-_93115445 | 0.27 |
ENST00000523629.1
|
RUNX1T1
|
runt-related transcription factor 1; translocated to, 1 (cyclin D-related) |
| chr18_-_30050395 | 0.27 |
ENST00000269209.6
ENST00000399218.4 |
GAREM
|
GRB2 associated, regulator of MAPK1 |
| chr20_-_1165117 | 0.27 |
ENST00000381894.3
|
TMEM74B
|
transmembrane protein 74B |
| chr9_-_95432536 | 0.27 |
ENST00000287996.3
|
IPPK
|
inositol 1,3,4,5,6-pentakisphosphate 2-kinase |
| chr2_-_46385 | 0.27 |
ENST00000327669.4
|
FAM110C
|
family with sequence similarity 110, member C |
| chr3_+_38495333 | 0.26 |
ENST00000352511.4
|
ACVR2B
|
activin A receptor, type IIB |
| chr1_+_228194693 | 0.26 |
ENST00000284523.1
ENST00000366753.2 |
WNT3A
|
wingless-type MMTV integration site family, member 3A |
| chr12_-_71148413 | 0.26 |
ENST00000440835.2
ENST00000549308.1 ENST00000550661.1 |
PTPRR
|
protein tyrosine phosphatase, receptor type, R |
| chr3_+_10857885 | 0.25 |
ENST00000254488.2
ENST00000454147.1 |
SLC6A11
|
solute carrier family 6 (neurotransmitter transporter), member 11 |
| chr6_+_71122974 | 0.25 |
ENST00000418814.2
|
FAM135A
|
family with sequence similarity 135, member A |
| chr7_-_15726296 | 0.25 |
ENST00000262041.5
|
MEOX2
|
mesenchyme homeobox 2 |
| chr8_-_42397037 | 0.24 |
ENST00000342228.3
|
SLC20A2
|
solute carrier family 20 (phosphate transporter), member 2 |
| chr5_+_140207536 | 0.24 |
ENST00000529310.1
ENST00000527624.1 |
PCDHA6
|
protocadherin alpha 6 |
| chr3_+_52489503 | 0.24 |
ENST00000345716.4
|
NISCH
|
nischarin |
| chr10_+_103113802 | 0.24 |
ENST00000370187.3
|
BTRC
|
beta-transducin repeat containing E3 ubiquitin protein ligase |
| chr5_+_140306478 | 0.24 |
ENST00000253807.2
|
PCDHAC1
|
protocadherin alpha subfamily C, 1 |
| chr4_-_153457197 | 0.24 |
ENST00000281708.4
|
FBXW7
|
F-box and WD repeat domain containing 7, E3 ubiquitin protein ligase |
| chr17_+_30813576 | 0.23 |
ENST00000313401.3
|
CDK5R1
|
cyclin-dependent kinase 5, regulatory subunit 1 (p35) |
| chr4_+_166794383 | 0.23 |
ENST00000061240.2
ENST00000507499.1 |
TLL1
|
tolloid-like 1 |
| chr19_-_14316980 | 0.23 |
ENST00000361434.3
ENST00000340736.6 |
LPHN1
|
latrophilin 1 |
| chr15_+_38544476 | 0.22 |
ENST00000299084.4
|
SPRED1
|
sprouty-related, EVH1 domain containing 1 |
| chr5_+_140248518 | 0.22 |
ENST00000398640.2
|
PCDHA11
|
protocadherin alpha 11 |
| chr5_+_140254884 | 0.21 |
ENST00000398631.2
|
PCDHA12
|
protocadherin alpha 12 |
| chr3_-_120170052 | 0.21 |
ENST00000295633.3
|
FSTL1
|
follistatin-like 1 |
| chr3_-_114790179 | 0.21 |
ENST00000462705.1
|
ZBTB20
|
zinc finger and BTB domain containing 20 |
| chr2_-_180129484 | 0.20 |
ENST00000428443.3
|
SESTD1
|
SEC14 and spectrin domains 1 |
| chr1_+_22889953 | 0.20 |
ENST00000374644.4
ENST00000166244.3 ENST00000538803.1 |
EPHA8
|
EPH receptor A8 |
| chr5_+_140180635 | 0.20 |
ENST00000522353.2
ENST00000532566.2 |
PCDHA3
|
protocadherin alpha 3 |
| chr16_-_23160591 | 0.19 |
ENST00000219689.7
|
USP31
|
ubiquitin specific peptidase 31 |
| chr5_+_140165876 | 0.19 |
ENST00000504120.2
ENST00000394633.3 ENST00000378133.3 |
PCDHA1
|
protocadherin alpha 1 |
| chr12_-_112819896 | 0.18 |
ENST00000377560.5
ENST00000430131.2 ENST00000550722.1 ENST00000550724.1 |
HECTD4
|
HECT domain containing E3 ubiquitin protein ligase 4 |
| chr19_-_16738984 | 0.18 |
ENST00000600060.1
ENST00000263390.3 |
MED26
|
mediator complex subunit 26 |
| chrX_-_128788914 | 0.18 |
ENST00000429967.1
ENST00000307484.6 |
APLN
|
apelin |
| chr12_-_117628333 | 0.17 |
ENST00000427718.2
|
FBXO21
|
F-box protein 21 |
| chr5_+_140220769 | 0.17 |
ENST00000531613.1
ENST00000378123.3 |
PCDHA8
|
protocadherin alpha 8 |
| chr6_+_41040678 | 0.17 |
ENST00000341376.6
ENST00000353205.5 |
NFYA
|
nuclear transcription factor Y, alpha |
| chr15_+_59063478 | 0.16 |
ENST00000559228.1
ENST00000450403.2 |
FAM63B
|
family with sequence similarity 63, member B |
| chrX_+_53111541 | 0.16 |
ENST00000375442.4
ENST00000579390.1 |
TSPYL2
|
TSPY-like 2 |
| chr3_+_150126101 | 0.15 |
ENST00000361875.3
ENST00000361136.2 |
TSC22D2
|
TSC22 domain family, member 2 |
| chr10_+_88516396 | 0.15 |
ENST00000372037.3
|
BMPR1A
|
bone morphogenetic protein receptor, type IA |
| chr12_-_39837192 | 0.15 |
ENST00000361961.3
ENST00000395670.3 |
KIF21A
|
kinesin family member 21A |
| chr9_-_16870704 | 0.14 |
ENST00000380672.4
ENST00000380667.2 ENST00000380666.2 ENST00000486514.1 |
BNC2
|
basonuclin 2 |
| chr8_-_72268889 | 0.14 |
ENST00000388742.4
|
EYA1
|
eyes absent homolog 1 (Drosophila) |
| chr7_-_98741642 | 0.14 |
ENST00000361368.2
|
SMURF1
|
SMAD specific E3 ubiquitin protein ligase 1 |
| chr3_+_187930719 | 0.14 |
ENST00000312675.4
|
LPP
|
LIM domain containing preferred translocation partner in lipoma |
| chr5_+_102201430 | 0.14 |
ENST00000438793.3
ENST00000346918.2 |
PAM
|
peptidylglycine alpha-amidating monooxygenase |
| chr1_+_113010056 | 0.14 |
ENST00000369686.5
|
WNT2B
|
wingless-type MMTV integration site family, member 2B |
| chr20_+_49348081 | 0.14 |
ENST00000371610.2
|
PARD6B
|
par-6 family cell polarity regulator beta |
| chr11_-_74109422 | 0.14 |
ENST00000298198.4
|
PGM2L1
|
phosphoglucomutase 2-like 1 |
| chr17_+_27717415 | 0.14 |
ENST00000583121.1
ENST00000261716.3 |
TAOK1
|
TAO kinase 1 |
| chr1_-_85666688 | 0.14 |
ENST00000341460.5
|
SYDE2
|
synapse defective 1, Rho GTPase, homolog 2 (C. elegans) |
| chr20_-_31071239 | 0.14 |
ENST00000359676.5
|
C20orf112
|
chromosome 20 open reading frame 112 |
| chr2_-_72375167 | 0.14 |
ENST00000001146.2
|
CYP26B1
|
cytochrome P450, family 26, subfamily B, polypeptide 1 |
| chr11_+_9406169 | 0.13 |
ENST00000379719.3
ENST00000527431.1 |
IPO7
|
importin 7 |
| chr12_+_8850471 | 0.13 |
ENST00000535829.1
ENST00000357529.3 |
RIMKLB
|
ribosomal modification protein rimK-like family member B |
| chr3_-_178790057 | 0.13 |
ENST00000311417.2
|
ZMAT3
|
zinc finger, matrin-type 3 |
| chr13_-_27745936 | 0.12 |
ENST00000282344.6
|
USP12
|
ubiquitin specific peptidase 12 |
| chr3_+_49977440 | 0.12 |
ENST00000442092.1
ENST00000266022.4 ENST00000443081.1 |
RBM6
|
RNA binding motif protein 6 |
| chr4_-_41750922 | 0.12 |
ENST00000226382.2
|
PHOX2B
|
paired-like homeobox 2b |
| chr1_-_244013384 | 0.12 |
ENST00000366539.1
|
AKT3
|
v-akt murine thymoma viral oncogene homolog 3 |
| chr14_+_31028329 | 0.12 |
ENST00000206595.6
|
G2E3
|
G2/M-phase specific E3 ubiquitin protein ligase |
| chr15_+_74466012 | 0.12 |
ENST00000249842.3
|
ISLR
|
immunoglobulin superfamily containing leucine-rich repeat |
| chr12_-_14956396 | 0.12 |
ENST00000535328.1
ENST00000261167.2 |
WBP11
|
WW domain binding protein 11 |
| chr6_+_107811162 | 0.12 |
ENST00000317357.5
|
SOBP
|
sine oculis binding protein homolog (Drosophila) |
| chr16_+_30710462 | 0.11 |
ENST00000262518.4
ENST00000395059.2 ENST00000344771.4 |
SRCAP
|
Snf2-related CREBBP activator protein |
| chr2_+_46926048 | 0.11 |
ENST00000306503.5
|
SOCS5
|
suppressor of cytokine signaling 5 |
| chr5_-_132948216 | 0.11 |
ENST00000265342.7
|
FSTL4
|
follistatin-like 4 |
| chr8_+_95653373 | 0.11 |
ENST00000358397.5
|
ESRP1
|
epithelial splicing regulatory protein 1 |
| chr1_-_22469459 | 0.11 |
ENST00000290167.6
|
WNT4
|
wingless-type MMTV integration site family, member 4 |
| chr5_+_140261703 | 0.11 |
ENST00000409494.1
ENST00000289272.2 |
PCDHA13
|
protocadherin alpha 13 |
| chr5_+_140201183 | 0.11 |
ENST00000529619.1
ENST00000529859.1 ENST00000378126.3 |
PCDHA5
|
protocadherin alpha 5 |
| chr11_-_60929074 | 0.10 |
ENST00000301765.5
|
VPS37C
|
vacuolar protein sorting 37 homolog C (S. cerevisiae) |
| chr1_-_78444776 | 0.10 |
ENST00000370767.1
ENST00000421641.1 |
FUBP1
|
far upstream element (FUSE) binding protein 1 |
| chr9_-_73736511 | 0.10 |
ENST00000377110.3
ENST00000377111.2 |
TRPM3
|
transient receptor potential cation channel, subfamily M, member 3 |
| chr1_+_110091189 | 0.10 |
ENST00000369851.4
|
GNAI3
|
guanine nucleotide binding protein (G protein), alpha inhibiting activity polypeptide 3 |
| chr5_+_140186647 | 0.09 |
ENST00000512229.2
ENST00000356878.4 ENST00000530339.1 |
PCDHA4
|
protocadherin alpha 4 |
| chr13_+_26828275 | 0.09 |
ENST00000381527.3
|
CDK8
|
cyclin-dependent kinase 8 |
| chr1_-_48462566 | 0.09 |
ENST00000606738.2
|
TRABD2B
|
TraB domain containing 2B |
| chr5_+_140174429 | 0.09 |
ENST00000520672.2
ENST00000378132.1 ENST00000526136.1 |
PCDHA2
|
protocadherin alpha 2 |
| chr18_+_29671812 | 0.08 |
ENST00000261593.3
ENST00000578914.1 |
RNF138
|
ring finger protein 138, E3 ubiquitin protein ligase |
| chr11_-_119252359 | 0.08 |
ENST00000455332.2
|
USP2
|
ubiquitin specific peptidase 2 |
| chr10_+_18948311 | 0.08 |
ENST00000377275.3
|
ARL5B
|
ADP-ribosylation factor-like 5B |
| chr5_+_172483347 | 0.08 |
ENST00000522692.1
ENST00000296953.2 ENST00000540014.1 ENST00000520420.1 |
CREBRF
|
CREB3 regulatory factor |
| chr1_-_207224307 | 0.07 |
ENST00000315927.4
|
YOD1
|
YOD1 deubiquitinase |
| chr6_+_15246501 | 0.07 |
ENST00000341776.2
|
JARID2
|
jumonji, AT rich interactive domain 2 |
| chr4_+_140222609 | 0.07 |
ENST00000296543.5
ENST00000398947.1 |
NAA15
|
N(alpha)-acetyltransferase 15, NatA auxiliary subunit |
| chr15_+_49715293 | 0.07 |
ENST00000267843.4
ENST00000560270.1 |
FGF7
|
fibroblast growth factor 7 |
| chr13_-_46961580 | 0.07 |
ENST00000378787.3
ENST00000378797.2 ENST00000429979.1 ENST00000378781.3 |
KIAA0226L
|
KIAA0226-like |
| chr2_-_122042770 | 0.07 |
ENST00000263707.5
|
TFCP2L1
|
transcription factor CP2-like 1 |
| chr5_+_140235469 | 0.07 |
ENST00000506939.2
ENST00000307360.5 |
PCDHA10
|
protocadherin alpha 10 |
| chr19_-_2151523 | 0.06 |
ENST00000350812.6
ENST00000355272.6 ENST00000356926.4 ENST00000345016.5 |
AP3D1
|
adaptor-related protein complex 3, delta 1 subunit |
| chr15_+_101459420 | 0.06 |
ENST00000388948.3
ENST00000284395.5 ENST00000534045.1 ENST00000532029.2 |
LRRK1
|
leucine-rich repeat kinase 1 |
| chr7_+_30323923 | 0.06 |
ENST00000323037.4
|
ZNRF2
|
zinc and ring finger 2 |
| chr9_-_35732362 | 0.06 |
ENST00000314888.9
ENST00000540444.1 |
TLN1
|
talin 1 |
| chr5_-_16465901 | 0.05 |
ENST00000308683.2
|
ZNF622
|
zinc finger protein 622 |
| chr12_-_112037306 | 0.05 |
ENST00000535949.1
ENST00000542287.2 ENST00000377617.3 ENST00000550104.1 |
ATXN2
|
ataxin 2 |
| chr1_+_65613217 | 0.05 |
ENST00000545314.1
|
AK4
|
adenylate kinase 4 |
| chrX_+_95939711 | 0.05 |
ENST00000373049.4
ENST00000324765.8 |
DIAPH2
|
diaphanous-related formin 2 |
| chr16_-_47007545 | 0.05 |
ENST00000317089.5
|
DNAJA2
|
DnaJ (Hsp40) homolog, subfamily A, member 2 |
| chr1_+_33722080 | 0.04 |
ENST00000483388.1
ENST00000539719.1 |
ZNF362
|
zinc finger protein 362 |
| chr11_+_67159416 | 0.04 |
ENST00000307980.2
ENST00000544620.1 |
RAD9A
|
RAD9 homolog A (S. pombe) |
| chr6_+_43044003 | 0.04 |
ENST00000230419.4
ENST00000476760.1 ENST00000471863.1 ENST00000349241.2 ENST00000352931.2 ENST00000345201.2 |
PTK7
|
protein tyrosine kinase 7 |
| chr6_+_135502466 | 0.04 |
ENST00000367814.4
|
MYB
|
v-myb avian myeloblastosis viral oncogene homolog |
| chr16_+_22019404 | 0.04 |
ENST00000542527.2
ENST00000569656.1 ENST00000562695.1 |
C16orf52
|
chromosome 16 open reading frame 52 |
| chr1_+_203764742 | 0.04 |
ENST00000432282.1
ENST00000453771.1 ENST00000367214.1 ENST00000367212.3 ENST00000332127.4 |
ZC3H11A
|
zinc finger CCCH-type containing 11A |
| chr8_+_23386305 | 0.04 |
ENST00000519973.1
|
SLC25A37
|
solute carrier family 25 (mitochondrial iron transporter), member 37 |
| chr9_-_99180597 | 0.03 |
ENST00000375256.4
|
ZNF367
|
zinc finger protein 367 |
| chr16_+_67880574 | 0.03 |
ENST00000219169.4
|
NUTF2
|
nuclear transport factor 2 |
| chr7_+_5229819 | 0.03 |
ENST00000288828.4
ENST00000401525.3 ENST00000404704.3 |
WIPI2
|
WD repeat domain, phosphoinositide interacting 2 |
| chrX_+_134478706 | 0.03 |
ENST00000370761.3
ENST00000339249.4 ENST00000370760.3 |
ZNF449
|
zinc finger protein 449 |
| chr10_+_104678032 | 0.03 |
ENST00000369878.4
ENST00000369875.3 |
CNNM2
|
cyclin M2 |
| chr14_+_24867992 | 0.03 |
ENST00000382554.3
|
NYNRIN
|
NYN domain and retroviral integrase containing |
| chr19_+_49622646 | 0.03 |
ENST00000334186.4
|
PPFIA3
|
protein tyrosine phosphatase, receptor type, f polypeptide (PTPRF), interacting protein (liprin), alpha 3 |
| chr7_+_77166592 | 0.02 |
ENST00000248594.6
|
PTPN12
|
protein tyrosine phosphatase, non-receptor type 12 |
| chr4_+_123747834 | 0.02 |
ENST00000264498.3
|
FGF2
|
fibroblast growth factor 2 (basic) |
| chr5_+_140560980 | 0.02 |
ENST00000361016.2
|
PCDHB16
|
protocadherin beta 16 |
| chr14_-_99737565 | 0.02 |
ENST00000357195.3
|
BCL11B
|
B-cell CLL/lymphoma 11B (zinc finger protein) |
| chr6_+_147525541 | 0.02 |
ENST00000367481.3
ENST00000546097.1 |
STXBP5
|
syntaxin binding protein 5 (tomosyn) |
| chr15_+_41245160 | 0.02 |
ENST00000444189.2
ENST00000446533.3 |
CHAC1
|
ChaC, cation transport regulator homolog 1 (E. coli) |
| chr5_+_72794233 | 0.01 |
ENST00000335895.8
ENST00000380591.3 ENST00000507081.2 |
BTF3
|
basic transcription factor 3 |
| chr15_-_52821247 | 0.01 |
ENST00000399231.3
ENST00000399233.2 |
MYO5A
|
myosin VA (heavy chain 12, myoxin) |
| chr11_-_72853091 | 0.01 |
ENST00000311172.7
ENST00000409314.1 |
FCHSD2
|
FCH and double SH3 domains 2 |
| chr14_-_105487381 | 0.01 |
ENST00000392590.3
ENST00000336219.3 |
CDCA4
|
cell division cycle associated 4 |
| chr9_-_131534160 | 0.01 |
ENST00000291900.2
|
ZER1
|
zyg-11 related, cell cycle regulator |
| chr5_-_39074479 | 0.01 |
ENST00000514735.1
ENST00000296782.5 ENST00000357387.3 |
RICTOR
|
RPTOR independent companion of MTOR, complex 2 |
| chr1_-_22263790 | 0.01 |
ENST00000374695.3
|
HSPG2
|
heparan sulfate proteoglycan 2 |
| chr13_-_21476900 | 0.00 |
ENST00000400602.2
ENST00000255305.6 |
XPO4
|
exportin 4 |
| chr8_+_21777159 | 0.00 |
ENST00000434536.1
ENST00000252512.9 |
XPO7
|
exportin 7 |
| chr11_+_64781575 | 0.00 |
ENST00000246747.4
ENST00000529384.1 |
ARL2
|
ADP-ribosylation factor-like 2 |
Network of associatons between targets according to the STRING database.

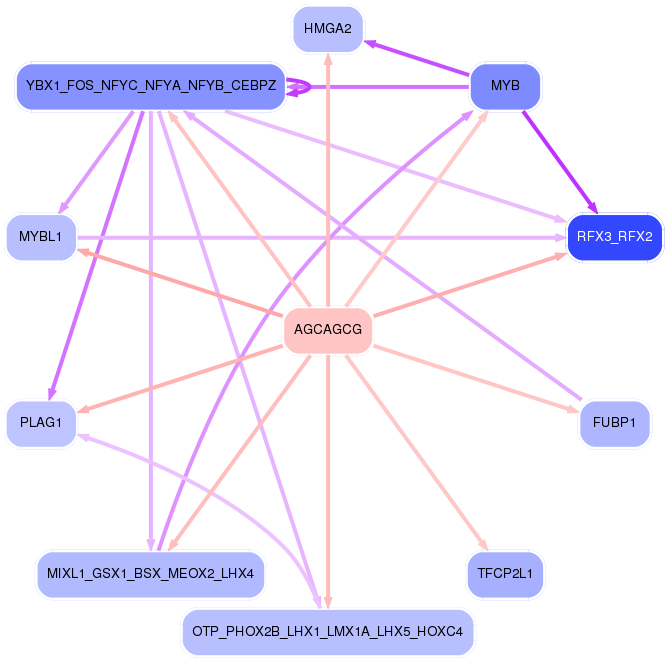
First level regulatory network of AGCAGCG
Gene Ontology Analysis
Gene overrepresentation in biological_process category:
| Log-likelihood per target | Total log-likelihood | Term | Description |
|---|---|---|---|
| 0.3 | 1.0 | GO:0031106 | septin ring assembly(GO:0000921) septin ring organization(GO:0031106) |
| 0.3 | 1.0 | GO:0099640 | axo-dendritic protein transport(GO:0099640) |
| 0.2 | 0.8 | GO:0000915 | assembly of actomyosin apparatus involved in cytokinesis(GO:0000912) actomyosin contractile ring assembly(GO:0000915) actomyosin contractile ring organization(GO:0044837) |
| 0.2 | 0.6 | GO:0031133 | regulation of axon diameter(GO:0031133) |
| 0.1 | 0.1 | GO:0048377 | lateral mesodermal cell fate commitment(GO:0048372) lateral mesodermal cell fate specification(GO:0048377) regulation of lateral mesodermal cell fate specification(GO:0048378) |
| 0.1 | 0.4 | GO:1902623 | negative regulation of granulocyte chemotaxis(GO:0071623) negative regulation of mononuclear cell migration(GO:0071676) negative regulation of neutrophil chemotaxis(GO:0090024) negative regulation of neutrophil migration(GO:1902623) |
| 0.1 | 0.4 | GO:0061184 | positive regulation of dermatome development(GO:0061184) |
| 0.1 | 0.5 | GO:1901165 | positive regulation of trophoblast cell migration(GO:1901165) |
| 0.1 | 0.5 | GO:0072560 | glandular epithelial cell maturation(GO:0002071) type B pancreatic cell maturation(GO:0072560) |
| 0.1 | 0.3 | GO:0016539 | intein-mediated protein splicing(GO:0016539) protein splicing(GO:0030908) |
| 0.1 | 0.3 | GO:2000742 | anterior head development(GO:0097065) regulation of anterior head development(GO:2000742) positive regulation of anterior head development(GO:2000744) |
| 0.1 | 0.5 | GO:0007525 | somatic muscle development(GO:0007525) |
| 0.1 | 0.5 | GO:2000546 | positive regulation of cell chemotaxis to fibroblast growth factor(GO:1904849) positive regulation of endothelial cell chemotaxis to fibroblast growth factor(GO:2000546) |
| 0.1 | 0.2 | GO:0021722 | superior olivary nucleus development(GO:0021718) superior olivary nucleus maturation(GO:0021722) |
| 0.1 | 0.3 | GO:0003131 | mesodermal-endodermal cell signaling(GO:0003131) programmed DNA elimination(GO:0031049) chromosome breakage(GO:0031052) histone H2A-S139 phosphorylation(GO:0035978) positive regulation of cellular response to X-ray(GO:2000685) |
| 0.1 | 0.4 | GO:0099525 | presynaptic dense core granule exocytosis(GO:0099525) |
| 0.1 | 0.2 | GO:0051466 | positive regulation of corticotropin-releasing hormone secretion(GO:0051466) |
| 0.1 | 0.3 | GO:0035407 | histone H3-T11 phosphorylation(GO:0035407) |
| 0.0 | 0.4 | GO:0060414 | aorta smooth muscle tissue morphogenesis(GO:0060414) |
| 0.0 | 0.2 | GO:2000639 | regulation of SREBP signaling pathway(GO:2000638) negative regulation of SREBP signaling pathway(GO:2000639) |
| 0.0 | 0.6 | GO:0051964 | negative regulation of synapse assembly(GO:0051964) |
| 0.0 | 0.1 | GO:2001035 | tongue muscle cell differentiation(GO:0035981) positive regulation of skeletal muscle fiber differentiation(GO:1902811) regulation of tongue muscle cell differentiation(GO:2001035) positive regulation of tongue muscle cell differentiation(GO:2001037) |
| 0.0 | 0.2 | GO:0001757 | somite specification(GO:0001757) |
| 0.0 | 0.1 | GO:0021934 | medulla oblongata development(GO:0021550) hindbrain tangential cell migration(GO:0021934) lateral line system development(GO:0048925) |
| 0.0 | 0.5 | GO:1901740 | negative regulation of myoblast fusion(GO:1901740) |
| 0.0 | 0.3 | GO:1903385 | regulation of homophilic cell adhesion(GO:1903385) |
| 0.0 | 0.1 | GO:0031548 | regulation of brain-derived neurotrophic factor receptor signaling pathway(GO:0031548) |
| 0.0 | 0.3 | GO:0006398 | mRNA 3'-end processing by stem-loop binding and cleavage(GO:0006398) |
| 0.0 | 0.4 | GO:2000381 | negative regulation of mesoderm development(GO:2000381) |
| 0.0 | 0.7 | GO:0021891 | olfactory bulb interneuron development(GO:0021891) |
| 0.0 | 0.2 | GO:0060979 | vasculogenesis involved in coronary vascular morphogenesis(GO:0060979) |
| 0.0 | 0.1 | GO:1902534 | single-organism membrane invagination(GO:1902534) |
| 0.0 | 0.5 | GO:0060252 | positive regulation of glial cell proliferation(GO:0060252) |
| 0.0 | 0.1 | GO:0061033 | secretion by lung epithelial cell involved in lung growth(GO:0061033) |
| 0.0 | 0.1 | GO:0018032 | protein amidation(GO:0018032) |
| 0.0 | 0.5 | GO:0071481 | cellular response to X-ray(GO:0071481) |
| 0.0 | 0.1 | GO:1904808 | regulation of protein oxidation(GO:1904806) positive regulation of protein oxidation(GO:1904808) |
| 0.0 | 0.7 | GO:0032354 | response to follicle-stimulating hormone(GO:0032354) |
| 0.0 | 0.5 | GO:0097264 | self proteolysis(GO:0097264) |
| 0.0 | 0.5 | GO:0001574 | ganglioside biosynthetic process(GO:0001574) |
| 0.0 | 1.0 | GO:0008045 | motor neuron axon guidance(GO:0008045) |
| 0.0 | 0.1 | GO:0036466 | synaptic vesicle recycling via endosome(GO:0036466) |
| 0.0 | 0.3 | GO:0060836 | lymphatic endothelial cell differentiation(GO:0060836) |
| 0.0 | 0.1 | GO:1990167 | protein K27-linked deubiquitination(GO:1990167) protein K33-linked deubiquitination(GO:1990168) |
| 0.0 | 0.3 | GO:2000096 | positive regulation of Wnt signaling pathway, planar cell polarity pathway(GO:2000096) |
| 0.0 | 0.1 | GO:0072513 | positive regulation of secondary heart field cardioblast proliferation(GO:0072513) |
| 0.0 | 0.1 | GO:0060423 | foregut regionalization(GO:0060423) lung field specification(GO:0060424) lung induction(GO:0060492) |
| 0.0 | 0.8 | GO:0000083 | regulation of transcription involved in G1/S transition of mitotic cell cycle(GO:0000083) |
| 0.0 | 0.2 | GO:0044341 | sodium-dependent phosphate transport(GO:0044341) |
| 0.0 | 2.9 | GO:0007156 | homophilic cell adhesion via plasma membrane adhesion molecules(GO:0007156) |
| 0.0 | 0.1 | GO:0045629 | negative regulation of T-helper 2 cell differentiation(GO:0045629) |
| 0.0 | 0.1 | GO:1900169 | regulation of glucocorticoid mediated signaling pathway(GO:1900169) |
| 0.0 | 0.0 | GO:0048250 | mitochondrial iron ion transport(GO:0048250) |
| 0.0 | 0.3 | GO:0045137 | development of primary sexual characteristics(GO:0045137) |
| 0.0 | 0.3 | GO:0006020 | inositol metabolic process(GO:0006020) |
| 0.0 | 0.3 | GO:0015812 | gamma-aminobutyric acid transport(GO:0015812) |
| 0.0 | 1.0 | GO:0035307 | positive regulation of dephosphorylation(GO:0035306) positive regulation of protein dephosphorylation(GO:0035307) |
| 0.0 | 0.2 | GO:0048243 | norepinephrine secretion(GO:0048243) |
Gene overrepresentation in cellular_component category:
| Log-likelihood per target | Total log-likelihood | Term | Description |
|---|---|---|---|
| 0.3 | 0.8 | GO:0097134 | cyclin E1-CDK2 complex(GO:0097134) |
| 0.1 | 2.1 | GO:0035253 | ciliary rootlet(GO:0035253) |
| 0.1 | 0.8 | GO:0097149 | centralspindlin complex(GO:0097149) |
| 0.1 | 1.0 | GO:0005826 | actomyosin contractile ring(GO:0005826) |
| 0.1 | 0.5 | GO:0097129 | cyclin D2-CDK4 complex(GO:0097129) |
| 0.1 | 0.2 | GO:0016533 | cyclin-dependent protein kinase 5 holoenzyme complex(GO:0016533) |
| 0.1 | 0.3 | GO:1990851 | Wnt-Frizzled-LRP5/6 complex(GO:1990851) |
| 0.0 | 0.4 | GO:0044305 | calyx of Held(GO:0044305) |
| 0.0 | 0.3 | GO:0005683 | U7 snRNP(GO:0005683) |
| 0.0 | 0.2 | GO:1990452 | Parkin-FBXW7-Cul1 ubiquitin ligase complex(GO:1990452) |
| 0.0 | 0.3 | GO:0035985 | senescence-associated heterochromatin focus(GO:0035985) |
| 0.0 | 0.8 | GO:0000159 | protein phosphatase type 2A complex(GO:0000159) |
| 0.0 | 0.2 | GO:0016602 | CCAAT-binding factor complex(GO:0016602) |
| 0.0 | 0.3 | GO:0035102 | PRC1 complex(GO:0035102) |
Gene overrepresentation in molecular_function category:
| Log-likelihood per target | Total log-likelihood | Term | Description |
|---|---|---|---|
| 0.2 | 0.5 | GO:0005111 | type 2 fibroblast growth factor receptor binding(GO:0005111) |
| 0.1 | 0.5 | GO:0048248 | CXCR3 chemokine receptor binding(GO:0048248) |
| 0.1 | 0.3 | GO:0071209 | U7 snRNA binding(GO:0071209) |
| 0.1 | 0.2 | GO:0016534 | cyclin-dependent protein kinase 5 activator activity(GO:0016534) |
| 0.1 | 0.3 | GO:0035501 | MH1 domain binding(GO:0035501) |
| 0.1 | 0.3 | GO:0035402 | histone kinase activity (H3-T11 specific)(GO:0035402) |
| 0.1 | 0.2 | GO:0005173 | stem cell factor receptor binding(GO:0005173) |
| 0.1 | 0.6 | GO:0008046 | axon guidance receptor activity(GO:0008046) |
| 0.1 | 0.3 | GO:0005110 | frizzled-2 binding(GO:0005110) |
| 0.1 | 2.1 | GO:0008574 | ATP-dependent microtubule motor activity, plus-end-directed(GO:0008574) |
| 0.0 | 0.1 | GO:0098821 | BMP receptor activity(GO:0098821) |
| 0.0 | 0.4 | GO:0043237 | laminin-1 binding(GO:0043237) |
| 0.0 | 0.7 | GO:0001135 | transcription factor activity, RNA polymerase II transcription factor recruiting(GO:0001135) |
| 0.0 | 0.4 | GO:0004687 | myosin light chain kinase activity(GO:0004687) |
| 0.0 | 0.1 | GO:0072591 | citrate-L-glutamate ligase activity(GO:0072591) |
| 0.0 | 0.5 | GO:0003828 | alpha-N-acetylneuraminate alpha-2,8-sialyltransferase activity(GO:0003828) |
| 0.0 | 0.3 | GO:0005332 | gamma-aminobutyric acid:sodium symporter activity(GO:0005332) |
| 0.0 | 0.2 | GO:0050816 | phosphothreonine binding(GO:0050816) |
| 0.0 | 0.1 | GO:0032184 | SUMO polymer binding(GO:0032184) |
| 0.0 | 0.2 | GO:0015319 | sodium:inorganic phosphate symporter activity(GO:0015319) |
| 0.0 | 1.2 | GO:0005109 | frizzled binding(GO:0005109) |
| 0.0 | 0.1 | GO:0004504 | peptidylglycine monooxygenase activity(GO:0004504) peptidylamidoglycolate lyase activity(GO:0004598) |
| 0.0 | 0.3 | GO:0005113 | patched binding(GO:0005113) |
| 0.0 | 0.1 | GO:0004614 | phosphoglucomutase activity(GO:0004614) |
| 0.0 | 0.1 | GO:0008401 | retinoic acid 4-hydroxylase activity(GO:0008401) |
| 0.0 | 0.2 | GO:0017002 | activin-activated receptor activity(GO:0017002) |
| 0.0 | 0.3 | GO:0055056 | D-glucose transmembrane transporter activity(GO:0055056) |
| 0.0 | 0.1 | GO:0048403 | brain-derived neurotrophic factor binding(GO:0048403) |
| 0.0 | 0.4 | GO:0070016 | armadillo repeat domain binding(GO:0070016) |
| 0.0 | 0.7 | GO:0016538 | cyclin-dependent protein serine/threonine kinase regulator activity(GO:0016538) |
| 0.0 | 0.2 | GO:0005004 | GPI-linked ephrin receptor activity(GO:0005004) |
| 0.0 | 0.2 | GO:0010314 | phosphatidylinositol-5-phosphate binding(GO:0010314) |
Gene overrepresentation in curated gene sets: canonical pathways category:
| Log-likelihood per target | Total log-likelihood | Term | Description |
|---|---|---|---|
| 0.1 | 0.8 | SA G2 AND M PHASES | Cdc25 activates the cdc2/cyclin B complex to induce the G2/M transition. |
| 0.0 | 0.7 | SA REG CASCADE OF CYCLIN EXPR | Expression of cyclins regulates progression through the cell cycle by activating cyclin-dependent kinases. |
| 0.0 | 0.9 | PID WNT SIGNALING PATHWAY | Wnt signaling network |
| 0.0 | 1.2 | PID AURORA B PATHWAY | Aurora B signaling |
| 0.0 | 0.7 | PID EPHA FWDPATHWAY | EPHA forward signaling |
| 0.0 | 0.8 | ST WNT BETA CATENIN PATHWAY | Wnt/beta-catenin Pathway |
Gene overrepresentation in curated gene sets: REACTOME pathways category:
| Log-likelihood per target | Total log-likelihood | Term | Description |
|---|---|---|---|
| 0.0 | 1.8 | REACTOME KINESINS | Genes involved in Kinesins |
| 0.0 | 1.3 | REACTOME G1 S SPECIFIC TRANSCRIPTION | Genes involved in G1/S-Specific Transcription |
| 0.0 | 0.5 | REACTOME SIGNALING BY FGFR3 MUTANTS | Genes involved in Signaling by FGFR3 mutants |
| 0.0 | 1.0 | REACTOME SIGNALING BY BMP | Genes involved in Signaling by BMP |
| 0.0 | 0.3 | REACTOME SLBP DEPENDENT PROCESSING OF REPLICATION DEPENDENT HISTONE PRE MRNAS | Genes involved in SLBP Dependent Processing of Replication-Dependent Histone Pre-mRNAs |
| 0.0 | 0.5 | REACTOME REGULATION OF INSULIN LIKE GROWTH FACTOR IGF ACTIVITY BY INSULIN LIKE GROWTH FACTOR BINDING PROTEINS IGFBPS | Genes involved in Regulation of Insulin-like Growth Factor (IGF) Activity by Insulin-like Growth Factor Binding Proteins (IGFBPs) |
| 0.0 | 0.3 | REACTOME G2 M DNA DAMAGE CHECKPOINT | Genes involved in G2/M DNA damage checkpoint |
| 0.0 | 0.5 | REACTOME N GLYCAN ANTENNAE ELONGATION | Genes involved in N-Glycan antennae elongation |
| 0.0 | 0.1 | REACTOME ADP SIGNALLING THROUGH P2RY12 | Genes involved in ADP signalling through P2Y purinoceptor 12 |
| 0.0 | 0.4 | REACTOME ACTIVATION OF RAC | Genes involved in Activation of Rac |
| 0.0 | 0.2 | REACTOME ACTIVATION OF CHAPERONE GENES BY ATF6 ALPHA | Genes involved in Activation of Chaperone Genes by ATF6-alpha |
| 0.0 | 0.1 | REACTOME MEMBRANE BINDING AND TARGETTING OF GAG PROTEINS | Genes involved in Membrane binding and targetting of GAG proteins |