Project
Illumina Body Map 2
Navigation
Downloads
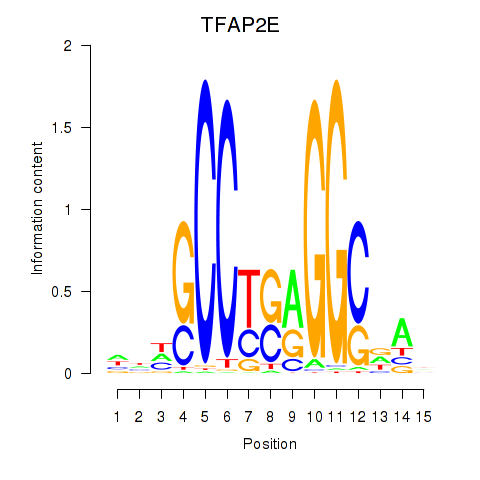
Results for TFAP2E
Z-value: 0.62
Motif logo
Transcription factors associated with TFAP2E
| Gene Symbol | Gene ID | Gene Info |
|---|---|---|
|
TFAP2E
|
ENSG00000116819.6 | transcription factor AP-2 epsilon |
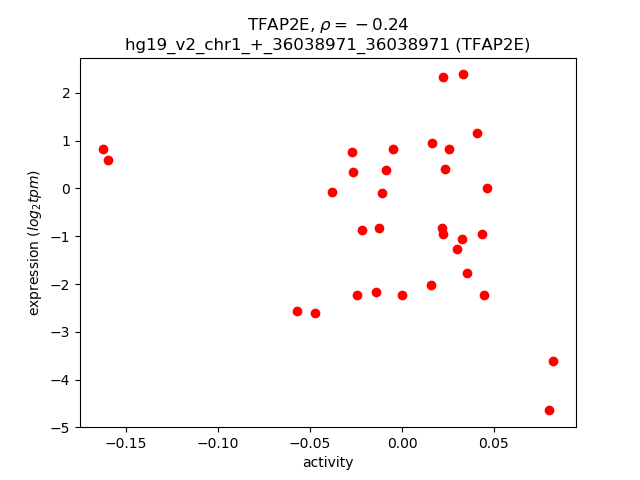
Activity-expression correlation:
| Gene | Promoter | Pearson corr. coef. | P-value | Plot |
|---|---|---|---|---|
| TFAP2E | hg19_v2_chr1_+_36038971_36038971 | -0.24 | 1.8e-01 | Click! |
Activity profile of TFAP2E motif
Sorted Z-values of TFAP2E motif
| Promoter | Log-likelihood | Transcript | Gene | Gene Info |
|---|---|---|---|---|
| chr5_-_115152651 | 3.21 |
ENST00000250535.4
|
CDO1
|
cysteine dioxygenase type 1 |
| chr11_+_116700600 | 2.78 |
ENST00000227667.3
|
APOC3
|
apolipoprotein C-III |
| chr11_+_116700614 | 2.75 |
ENST00000375345.1
|
APOC3
|
apolipoprotein C-III |
| chr14_+_24837226 | 2.43 |
ENST00000554050.1
ENST00000554903.1 ENST00000554779.1 ENST00000250373.4 ENST00000553708.1 |
NFATC4
|
nuclear factor of activated T-cells, cytoplasmic, calcineurin-dependent 4 |
| chr11_-_61062762 | 1.75 |
ENST00000335613.5
|
VWCE
|
von Willebrand factor C and EGF domains |
| chr12_+_53443963 | 1.62 |
ENST00000546602.1
ENST00000552570.1 ENST00000549700.1 |
TENC1
|
tensin like C1 domain containing phosphatase (tensin 2) |
| chr3_+_52813932 | 1.52 |
ENST00000537050.1
|
ITIH1
|
inter-alpha-trypsin inhibitor heavy chain 1 |
| chr9_+_136501478 | 1.39 |
ENST00000393056.2
ENST00000263611.2 |
DBH
|
dopamine beta-hydroxylase (dopamine beta-monooxygenase) |
| chr3_+_50192833 | 1.38 |
ENST00000426511.1
|
SEMA3F
|
sema domain, immunoglobulin domain (Ig), short basic domain, secreted, (semaphorin) 3F |
| chr12_-_15942503 | 1.33 |
ENST00000281172.5
|
EPS8
|
epidermal growth factor receptor pathway substrate 8 |
| chr17_+_72428218 | 1.32 |
ENST00000392628.2
|
GPRC5C
|
G protein-coupled receptor, family C, group 5, member C |
| chr19_-_35981358 | 1.31 |
ENST00000484218.2
ENST00000338897.3 |
KRTDAP
|
keratinocyte differentiation-associated protein |
| chr2_-_133429091 | 1.25 |
ENST00000345008.6
|
LYPD1
|
LY6/PLAUR domain containing 1 |
| chr14_-_25519095 | 1.22 |
ENST00000419632.2
ENST00000358326.2 ENST00000396700.1 ENST00000548724.1 |
STXBP6
|
syntaxin binding protein 6 (amisyn) |
| chrX_+_128872918 | 1.19 |
ENST00000371105.3
|
XPNPEP2
|
X-prolyl aminopeptidase (aminopeptidase P) 2, membrane-bound |
| chr12_-_75784669 | 1.10 |
ENST00000552497.1
ENST00000551829.1 ENST00000436898.1 ENST00000442339.2 |
CAPS2
|
calcyphosine 2 |
| chr1_+_214163033 | 1.08 |
ENST00000607425.1
|
PROX1
|
prospero homeobox 1 |
| chr12_+_72666407 | 1.07 |
ENST00000261180.4
|
TRHDE
|
thyrotropin-releasing hormone degrading enzyme |
| chr1_+_233749739 | 1.04 |
ENST00000366621.3
|
KCNK1
|
potassium channel, subfamily K, member 1 |
| chr14_+_21214039 | 1.04 |
ENST00000326842.2
|
EDDM3A
|
epididymal protein 3A |
| chr17_-_39769005 | 1.00 |
ENST00000301653.4
ENST00000593067.1 |
KRT16
|
keratin 16 |
| chr12_-_15942309 | 0.98 |
ENST00000544064.1
ENST00000543523.1 ENST00000536793.1 |
EPS8
|
epidermal growth factor receptor pathway substrate 8 |
| chr17_+_40932610 | 0.91 |
ENST00000246914.5
|
WNK4
|
WNK lysine deficient protein kinase 4 |
| chr2_-_45236540 | 0.89 |
ENST00000303077.6
|
SIX2
|
SIX homeobox 2 |
| chr3_+_110790590 | 0.88 |
ENST00000485303.1
|
PVRL3
|
poliovirus receptor-related 3 |
| chr11_+_118478313 | 0.87 |
ENST00000356063.5
|
PHLDB1
|
pleckstrin homology-like domain, family B, member 1 |
| chr14_-_25519317 | 0.86 |
ENST00000323944.5
|
STXBP6
|
syntaxin binding protein 6 (amisyn) |
| chr15_+_23810903 | 0.85 |
ENST00000564592.1
|
MKRN3
|
makorin ring finger protein 3 |
| chr15_-_65503801 | 0.84 |
ENST00000261883.4
|
CILP
|
cartilage intermediate layer protein, nucleotide pyrophosphohydrolase |
| chr3_+_49591881 | 0.84 |
ENST00000296452.4
|
BSN
|
bassoon presynaptic cytomatrix protein |
| chr12_+_72667203 | 0.83 |
ENST00000547300.1
|
TRHDE
|
thyrotropin-releasing hormone degrading enzyme |
| chr4_-_101439148 | 0.82 |
ENST00000511970.1
ENST00000502569.1 ENST00000305864.3 |
EMCN
|
endomucin |
| chr8_+_22250334 | 0.81 |
ENST00000520832.1
|
SLC39A14
|
solute carrier family 39 (zinc transporter), member 14 |
| chr9_-_34662651 | 0.77 |
ENST00000259631.4
|
CCL27
|
chemokine (C-C motif) ligand 27 |
| chr4_-_101439242 | 0.76 |
ENST00000296420.4
|
EMCN
|
endomucin |
| chr11_-_35441524 | 0.75 |
ENST00000395750.1
ENST00000449068.1 |
SLC1A2
|
solute carrier family 1 (glial high affinity glutamate transporter), member 2 |
| chr17_+_36584662 | 0.75 |
ENST00000431231.2
ENST00000437668.3 |
ARHGAP23
|
Rho GTPase activating protein 23 |
| chr2_+_241375069 | 0.73 |
ENST00000264039.2
|
GPC1
|
glypican 1 |
| chr22_+_29601840 | 0.72 |
ENST00000334018.6
ENST00000429226.1 ENST00000404755.3 ENST00000404820.3 ENST00000430127.1 |
EMID1
|
EMI domain containing 1 |
| chr20_+_55205825 | 0.70 |
ENST00000544508.1
|
TFAP2C
|
transcription factor AP-2 gamma (activating enhancer binding protein 2 gamma) |
| chrX_+_128872998 | 0.70 |
ENST00000371106.3
|
XPNPEP2
|
X-prolyl aminopeptidase (aminopeptidase P) 2, membrane-bound |
| chr11_+_64009072 | 0.69 |
ENST00000535135.1
ENST00000394540.3 |
FKBP2
|
FK506 binding protein 2, 13kDa |
| chr2_-_241831424 | 0.69 |
ENST00000402775.2
ENST00000307486.8 |
C2orf54
|
chromosome 2 open reading frame 54 |
| chr11_-_35440796 | 0.66 |
ENST00000278379.3
|
SLC1A2
|
solute carrier family 1 (glial high affinity glutamate transporter), member 2 |
| chr1_-_231175964 | 0.64 |
ENST00000366654.4
|
FAM89A
|
family with sequence similarity 89, member A |
| chr3_-_48632593 | 0.62 |
ENST00000454817.1
ENST00000328333.8 |
COL7A1
|
collagen, type VII, alpha 1 |
| chr7_+_100464760 | 0.61 |
ENST00000200457.4
|
TRIP6
|
thyroid hormone receptor interactor 6 |
| chr10_+_102505954 | 0.59 |
ENST00000556085.1
ENST00000427256.1 |
PAX2
|
paired box 2 |
| chr16_+_56623433 | 0.58 |
ENST00000570176.1
|
MT3
|
metallothionein 3 |
| chr11_+_66045634 | 0.55 |
ENST00000528852.1
ENST00000311445.6 |
CNIH2
|
cornichon family AMPA receptor auxiliary protein 2 |
| chr3_+_155860751 | 0.54 |
ENST00000471742.1
|
KCNAB1
|
potassium voltage-gated channel, shaker-related subfamily, beta member 1 |
| chr6_+_99282570 | 0.52 |
ENST00000328345.5
|
POU3F2
|
POU class 3 homeobox 2 |
| chr1_+_152943122 | 0.52 |
ENST00000328051.2
|
SPRR4
|
small proline-rich protein 4 |
| chr19_-_39264072 | 0.51 |
ENST00000599035.1
ENST00000378626.4 |
LGALS7
|
lectin, galactoside-binding, soluble, 7 |
| chr1_-_63782888 | 0.51 |
ENST00000436475.2
|
LINC00466
|
long intergenic non-protein coding RNA 466 |
| chr11_-_66056596 | 0.49 |
ENST00000471387.2
ENST00000359461.6 ENST00000376901.4 |
YIF1A
|
Yip1 interacting factor homolog A (S. cerevisiae) |
| chr4_-_82393052 | 0.49 |
ENST00000335927.7
ENST00000504863.1 ENST00000264400.2 |
RASGEF1B
|
RasGEF domain family, member 1B |
| chr11_-_66056478 | 0.48 |
ENST00000431556.2
ENST00000528575.1 |
YIF1A
|
Yip1 interacting factor homolog A (S. cerevisiae) |
| chr4_-_82393009 | 0.47 |
ENST00000436139.2
|
RASGEF1B
|
RasGEF domain family, member 1B |
| chr3_-_55521323 | 0.47 |
ENST00000264634.4
|
WNT5A
|
wingless-type MMTV integration site family, member 5A |
| chr17_+_37824411 | 0.46 |
ENST00000269582.2
|
PNMT
|
phenylethanolamine N-methyltransferase |
| chr15_+_27112251 | 0.46 |
ENST00000400081.3
|
GABRA5
|
gamma-aminobutyric acid (GABA) A receptor, alpha 5 |
| chr10_-_108924284 | 0.45 |
ENST00000344440.6
ENST00000263054.6 |
SORCS1
|
sortilin-related VPS10 domain containing receptor 1 |
| chr19_-_11039261 | 0.44 |
ENST00000590329.1
ENST00000587943.1 ENST00000585858.1 ENST00000586748.1 ENST00000586575.1 ENST00000253031.2 |
YIPF2
|
Yip1 domain family, member 2 |
| chr19_-_11039188 | 0.44 |
ENST00000588347.1
|
YIPF2
|
Yip1 domain family, member 2 |
| chr17_+_37824217 | 0.43 |
ENST00000394246.1
|
PNMT
|
phenylethanolamine N-methyltransferase |
| chr17_-_31620006 | 0.41 |
ENST00000225823.2
|
ASIC2
|
acid-sensing (proton-gated) ion channel 2 |
| chrX_+_51636629 | 0.40 |
ENST00000375722.1
ENST00000326587.7 ENST00000375695.2 |
MAGED1
|
melanoma antigen family D, 1 |
| chr15_+_27112058 | 0.40 |
ENST00000355395.5
|
GABRA5
|
gamma-aminobutyric acid (GABA) A receptor, alpha 5 |
| chr22_+_31644309 | 0.37 |
ENST00000425203.1
|
LIMK2
|
LIM domain kinase 2 |
| chr1_+_35225339 | 0.36 |
ENST00000339480.1
|
GJB4
|
gap junction protein, beta 4, 30.3kDa |
| chr2_+_74741569 | 0.33 |
ENST00000233638.7
|
TLX2
|
T-cell leukemia homeobox 2 |
| chr12_+_57984965 | 0.32 |
ENST00000540759.2
ENST00000551772.1 ENST00000550465.1 ENST00000354947.5 |
PIP4K2C
|
phosphatidylinositol-5-phosphate 4-kinase, type II, gamma |
| chr12_+_75784850 | 0.31 |
ENST00000550916.1
ENST00000435775.1 ENST00000378689.2 ENST00000378692.3 ENST00000320460.4 ENST00000547164.1 |
GLIPR1L2
|
GLI pathogenesis-related 1 like 2 |
| chr17_+_37824700 | 0.31 |
ENST00000581428.1
|
PNMT
|
phenylethanolamine N-methyltransferase |
| chr15_+_27112380 | 0.31 |
ENST00000554596.1
|
GABRA5
|
gamma-aminobutyric acid (GABA) A receptor, alpha 5 |
| chr19_-_54676884 | 0.31 |
ENST00000376591.4
|
TMC4
|
transmembrane channel-like 4 |
| chr1_+_9599540 | 0.30 |
ENST00000302692.6
|
SLC25A33
|
solute carrier family 25 (pyrimidine nucleotide carrier), member 33 |
| chr15_+_27112194 | 0.30 |
ENST00000555182.1
|
GABRA5
|
gamma-aminobutyric acid (GABA) A receptor, alpha 5 |
| chr2_+_38893047 | 0.27 |
ENST00000272252.5
|
GALM
|
galactose mutarotase (aldose 1-epimerase) |
| chr19_-_54676846 | 0.26 |
ENST00000301187.4
|
TMC4
|
transmembrane channel-like 4 |
| chr1_-_154531095 | 0.25 |
ENST00000292211.4
|
UBE2Q1
|
ubiquitin-conjugating enzyme E2Q family member 1 |
| chr2_+_155555201 | 0.25 |
ENST00000544049.1
|
KCNJ3
|
potassium inwardly-rectifying channel, subfamily J, member 3 |
| chr15_+_27112296 | 0.25 |
ENST00000554038.1
|
GABRA5
|
gamma-aminobutyric acid (GABA) A receptor, alpha 5 |
| chr4_-_85419603 | 0.23 |
ENST00000295886.4
|
NKX6-1
|
NK6 homeobox 1 |
| chr11_-_113345995 | 0.23 |
ENST00000355319.2
ENST00000542616.1 |
DRD2
|
dopamine receptor D2 |
| chr1_-_32801825 | 0.22 |
ENST00000329421.7
|
MARCKSL1
|
MARCKS-like 1 |
| chr16_+_69599861 | 0.22 |
ENST00000354436.2
|
NFAT5
|
nuclear factor of activated T-cells 5, tonicity-responsive |
| chr6_-_49917157 | 0.22 |
ENST00000398721.2
|
DEFB133
|
defensin, beta 133 |
| chr8_-_11853819 | 0.20 |
ENST00000526438.1
ENST00000382205.4 |
DEFB134
|
defensin, beta 134 |
| chr2_+_38893208 | 0.20 |
ENST00000410063.1
|
GALM
|
galactose mutarotase (aldose 1-epimerase) |
| chr16_-_72698834 | 0.20 |
ENST00000570152.1
ENST00000561611.2 ENST00000570035.1 |
AC004158.2
|
AC004158.2 |
| chr5_+_176237478 | 0.19 |
ENST00000329542.4
|
UNC5A
|
unc-5 homolog A (C. elegans) |
| chrX_+_152783131 | 0.19 |
ENST00000349466.2
ENST00000370186.1 |
ATP2B3
|
ATPase, Ca++ transporting, plasma membrane 3 |
| chr14_-_60952739 | 0.18 |
ENST00000555476.1
ENST00000321731.3 |
C14orf39
|
chromosome 14 open reading frame 39 |
| chr12_+_108168162 | 0.18 |
ENST00000342331.4
|
ASCL4
|
achaete-scute family bHLH transcription factor 4 |
| chr19_+_54960358 | 0.17 |
ENST00000439657.1
ENST00000376514.2 ENST00000376526.4 ENST00000436479.1 |
LENG8
|
leukocyte receptor cluster (LRC) member 8 |
| chr1_+_228194693 | 0.17 |
ENST00000284523.1
ENST00000366753.2 |
WNT3A
|
wingless-type MMTV integration site family, member 3A |
| chr9_-_86432547 | 0.17 |
ENST00000376365.3
ENST00000376371.2 |
GKAP1
|
G kinase anchoring protein 1 |
| chr3_-_170459154 | 0.16 |
ENST00000473110.1
|
RP11-373E16.4
|
RP11-373E16.4 |
| chr2_-_177502254 | 0.14 |
ENST00000339037.3
|
AC017048.3
|
long intergenic non-protein coding RNA 1116 |
| chrX_-_124097620 | 0.13 |
ENST00000371130.3
ENST00000422452.2 |
TENM1
|
teneurin transmembrane protein 1 |
| chr3_+_4535155 | 0.13 |
ENST00000544951.1
|
ITPR1
|
inositol 1,4,5-trisphosphate receptor, type 1 |
| chr17_+_3627185 | 0.13 |
ENST00000325418.4
|
GSG2
|
germ cell associated 2 (haspin) |
| chr19_+_36195467 | 0.12 |
ENST00000426659.2
|
ZBTB32
|
zinc finger and BTB domain containing 32 |
| chr16_+_69600058 | 0.12 |
ENST00000393742.2
|
NFAT5
|
nuclear factor of activated T-cells 5, tonicity-responsive |
| chrX_+_115567767 | 0.10 |
ENST00000371900.4
|
SLC6A14
|
solute carrier family 6 (amino acid transporter), member 14 |
| chr2_+_239335449 | 0.10 |
ENST00000264607.4
|
ASB1
|
ankyrin repeat and SOCS box containing 1 |
| chr19_+_49458107 | 0.10 |
ENST00000539787.1
ENST00000345358.7 ENST00000391871.3 ENST00000415969.2 ENST00000354470.3 ENST00000506183.1 ENST00000293288.8 |
BAX
|
BCL2-associated X protein |
| chr5_+_133984462 | 0.10 |
ENST00000398844.2
ENST00000322887.4 |
SEC24A
|
SEC24 family member A |
| chr10_-_112678692 | 0.08 |
ENST00000605742.1
|
BBIP1
|
BBSome interacting protein 1 |
| chr1_+_182584314 | 0.08 |
ENST00000566297.1
|
RP11-317P15.4
|
RP11-317P15.4 |
| chr3_+_32280159 | 0.08 |
ENST00000458535.2
ENST00000307526.3 |
CMTM8
|
CKLF-like MARVEL transmembrane domain containing 8 |
| chr3_+_105086056 | 0.07 |
ENST00000472644.2
|
ALCAM
|
activated leukocyte cell adhesion molecule |
| chr1_+_901847 | 0.07 |
ENST00000379410.3
ENST00000379409.2 ENST00000379407.3 |
PLEKHN1
|
pleckstrin homology domain containing, family N member 1 |
| chr6_+_37787262 | 0.06 |
ENST00000287218.4
|
ZFAND3
|
zinc finger, AN1-type domain 3 |
| chr6_+_7107999 | 0.06 |
ENST00000491191.1
ENST00000379938.2 ENST00000471433.1 |
RREB1
|
ras responsive element binding protein 1 |
| chr6_+_150070831 | 0.05 |
ENST00000367380.5
|
PCMT1
|
protein-L-isoaspartate (D-aspartate) O-methyltransferase |
| chr15_+_23810853 | 0.05 |
ENST00000568252.1
|
MKRN3
|
makorin ring finger protein 3 |
| chr3_-_136471204 | 0.04 |
ENST00000480733.1
ENST00000383202.2 ENST00000236698.5 ENST00000434713.2 |
STAG1
|
stromal antigen 1 |
| chr6_+_150070857 | 0.03 |
ENST00000544496.1
|
PCMT1
|
protein-L-isoaspartate (D-aspartate) O-methyltransferase |
| chr17_+_74070853 | 0.03 |
ENST00000329003.3
|
GALR2
|
galanin receptor 2 |
| chr1_-_151778630 | 0.02 |
ENST00000368820.3
|
LINGO4
|
leucine rich repeat and Ig domain containing 4 |
| chr14_+_77607026 | 0.02 |
ENST00000600936.1
|
AC007375.1
|
Uncharacterized protein; cDNA FLJ43210 fis, clone FEBRA2020582 |
| chr22_+_35653445 | 0.02 |
ENST00000420166.1
ENST00000444518.2 ENST00000455359.1 ENST00000216106.5 |
HMGXB4
|
HMG box domain containing 4 |
| chr1_-_11865982 | 0.01 |
ENST00000418034.1
|
MTHFR
|
methylenetetrahydrofolate reductase (NAD(P)H) |
| chr3_+_51428704 | 0.01 |
ENST00000323686.4
|
RBM15B
|
RNA binding motif protein 15B |
| chr7_-_129251459 | 0.01 |
ENST00000608694.1
|
RP11-448A19.1
|
RP11-448A19.1 |
| chr10_-_112678904 | 0.00 |
ENST00000423273.1
ENST00000436562.1 ENST00000447005.1 ENST00000454061.1 |
BBIP1
|
BBSome interacting protein 1 |
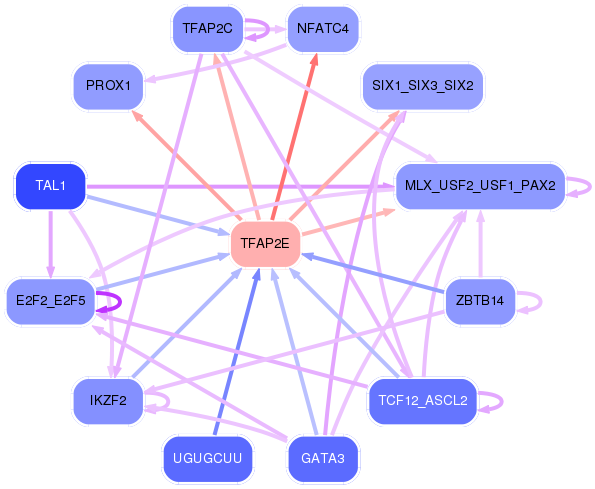
Network of associatons between targets according to the STRING database.

First level regulatory network of TFAP2E
Gene Ontology Analysis
Gene overrepresentation in biological_process category:
| Log-likelihood per target | Total log-likelihood | Term | Description |
|---|---|---|---|
| 1.8 | 5.5 | GO:0060621 | negative regulation of cholesterol import(GO:0060621) negative regulation of sterol import(GO:2000910) |
| 0.6 | 3.2 | GO:0042412 | taurine biosynthetic process(GO:0042412) |
| 0.5 | 2.4 | GO:2000297 | negative regulation of synapse maturation(GO:2000297) |
| 0.4 | 1.1 | GO:0002194 | hepatocyte cell migration(GO:0002194) otic placode formation(GO:0043049) branching involved in pancreas morphogenesis(GO:0061114) acinar cell differentiation(GO:0090425) positive regulation of forebrain neuron differentiation(GO:2000979) |
| 0.3 | 1.2 | GO:0042418 | epinephrine biosynthetic process(GO:0042418) |
| 0.3 | 2.3 | GO:0070358 | actin polymerization-dependent cell motility(GO:0070358) |
| 0.2 | 1.4 | GO:0042421 | norepinephrine biosynthetic process(GO:0042421) |
| 0.2 | 0.6 | GO:0035566 | regulation of metanephros size(GO:0035566) |
| 0.2 | 0.6 | GO:0097212 | cadmium ion homeostasis(GO:0055073) lysosomal membrane organization(GO:0097212) negative regulation of hydrogen peroxide catabolic process(GO:2000296) regulation of oxygen metabolic process(GO:2000374) |
| 0.2 | 0.9 | GO:0072137 | condensed mesenchymal cell proliferation(GO:0072137) |
| 0.1 | 0.6 | GO:1902683 | regulation of receptor localization to synapse(GO:1902683) |
| 0.1 | 0.9 | GO:0072156 | distal tubule morphogenesis(GO:0072156) |
| 0.1 | 2.1 | GO:0035542 | regulation of SNARE complex assembly(GO:0035542) |
| 0.1 | 1.4 | GO:0070777 | D-aspartate transport(GO:0070777) D-aspartate import(GO:0070779) |
| 0.1 | 0.6 | GO:0008588 | release of cytoplasmic sequestered NF-kappaB(GO:0008588) |
| 0.1 | 0.5 | GO:0033499 | galactose catabolic process via UDP-galactose(GO:0033499) |
| 0.1 | 0.5 | GO:0061354 | chemoattraction of serotonergic neuron axon(GO:0036517) planar cell polarity pathway involved in outflow tract morphogenesis(GO:0061347) planar cell polarity pathway involved in ventricular septum morphogenesis(GO:0061348) planar cell polarity pathway involved in cardiac right atrium morphogenesis(GO:0061349) planar cell polarity pathway involved in cardiac muscle tissue morphogenesis(GO:0061350) planar cell polarity pathway involved in pericardium morphogenesis(GO:0061354) chemoattraction of axon(GO:0061642) negative regulation of cell proliferation in midbrain(GO:1904934) planar cell polarity pathway involved in midbrain dopaminergic neuron differentiation(GO:1904955) |
| 0.1 | 0.7 | GO:0030200 | heparan sulfate proteoglycan catabolic process(GO:0030200) |
| 0.1 | 0.3 | GO:1990519 | pyrimidine nucleotide transport(GO:0006864) mitochondrial pyrimidine nucleotide import(GO:1990519) |
| 0.1 | 1.4 | GO:0036486 | trunk segmentation(GO:0035290) trunk neural crest cell migration(GO:0036484) ventral trunk neural crest cell migration(GO:0036486) |
| 0.1 | 1.0 | GO:0060075 | regulation of resting membrane potential(GO:0060075) |
| 0.1 | 0.2 | GO:0021912 | regulation of transcription from RNA polymerase II promoter involved in spinal cord motor neuron fate specification(GO:0021912) |
| 0.1 | 0.8 | GO:0043569 | negative regulation of insulin-like growth factor receptor signaling pathway(GO:0043569) |
| 0.1 | 1.0 | GO:0007320 | insemination(GO:0007320) |
| 0.1 | 0.5 | GO:0021979 | hypothalamus cell differentiation(GO:0021979) |
| 0.1 | 0.4 | GO:0050915 | sensory perception of sour taste(GO:0050915) |
| 0.1 | 0.2 | GO:0061184 | positive regulation of cell fate specification(GO:0042660) positive regulation of dermatome development(GO:0061184) regulation of heart induction(GO:0090381) regulation of heart induction by canonical Wnt signaling pathway(GO:0100012) |
| 0.1 | 1.0 | GO:0051546 | keratinocyte migration(GO:0051546) |
| 0.0 | 0.9 | GO:1904259 | regulation of basement membrane assembly involved in embryonic body morphogenesis(GO:1904259) positive regulation of basement membrane assembly involved in embryonic body morphogenesis(GO:1904261) basement membrane assembly involved in embryonic body morphogenesis(GO:2001197) |
| 0.0 | 0.8 | GO:1903874 | ferrous iron transport(GO:0015684) ferrous iron transmembrane transport(GO:1903874) |
| 0.0 | 0.1 | GO:0072356 | chromosome passenger complex localization to kinetochore(GO:0072356) |
| 0.0 | 3.0 | GO:0002209 | behavioral fear response(GO:0001662) behavioral defense response(GO:0002209) |
| 0.0 | 0.2 | GO:0051586 | glial cell-derived neurotrophic factor secretion(GO:0044467) positive regulation of neurotransmitter uptake(GO:0051582) positive regulation of dopamine uptake involved in synaptic transmission(GO:0051586) positive regulation of catecholamine uptake involved in synaptic transmission(GO:0051944) regulation of glial cell-derived neurotrophic factor secretion(GO:1900166) positive regulation of glial cell-derived neurotrophic factor secretion(GO:1900168) |
| 0.0 | 0.1 | GO:0046666 | B cell negative selection(GO:0002352) retinal cell programmed cell death(GO:0046666) post-embryonic camera-type eye morphogenesis(GO:0048597) positive regulation of apoptotic DNA fragmentation(GO:1902512) |
| 0.0 | 1.9 | GO:0043171 | peptide catabolic process(GO:0043171) |
| 0.0 | 0.5 | GO:0060539 | diaphragm development(GO:0060539) negative regulation of delayed rectifier potassium channel activity(GO:1902260) |
| 0.0 | 0.2 | GO:0033564 | anterior/posterior axon guidance(GO:0033564) |
| 0.0 | 0.4 | GO:0042048 | olfactory behavior(GO:0042048) |
| 0.0 | 0.3 | GO:0098914 | membrane repolarization during atrial cardiac muscle cell action potential(GO:0098914) |
| 0.0 | 0.2 | GO:1990034 | calcium ion export from cell(GO:1990034) |
| 0.0 | 1.5 | GO:0030212 | hyaluronan metabolic process(GO:0030212) |
| 0.0 | 0.3 | GO:0070459 | prolactin secretion(GO:0070459) |
| 0.0 | 0.3 | GO:0048484 | enteric nervous system development(GO:0048484) |
| 0.0 | 0.3 | GO:2000786 | positive regulation of autophagosome assembly(GO:2000786) |
| 0.0 | 0.4 | GO:0061213 | positive regulation of mesonephros development(GO:0061213) positive regulation of branching involved in ureteric bud morphogenesis(GO:0090190) |
| 0.0 | 1.7 | GO:0006501 | C-terminal protein lipidation(GO:0006501) |
| 0.0 | 0.7 | GO:0000413 | protein peptidyl-prolyl isomerization(GO:0000413) |
Gene overrepresentation in cellular_component category:
| Log-likelihood per target | Total log-likelihood | Term | Description |
|---|---|---|---|
| 0.6 | 5.5 | GO:0034363 | intermediate-density lipoprotein particle(GO:0034363) |
| 0.2 | 1.0 | GO:1902937 | inward rectifier potassium channel complex(GO:1902937) |
| 0.1 | 0.6 | GO:0097450 | astrocyte end-foot(GO:0097450) |
| 0.1 | 0.6 | GO:0030934 | anchoring collagen complex(GO:0030934) |
| 0.1 | 0.6 | GO:0045323 | interleukin-1 receptor complex(GO:0045323) |
| 0.1 | 1.4 | GO:0042584 | chromaffin granule membrane(GO:0042584) |
| 0.1 | 2.3 | GO:0017146 | NMDA selective glutamate receptor complex(GO:0017146) |
| 0.1 | 0.5 | GO:1990635 | proximal dendrite(GO:1990635) |
| 0.0 | 2.1 | GO:0000145 | exocyst(GO:0000145) |
| 0.0 | 0.9 | GO:0045180 | basal cortex(GO:0045180) |
| 0.0 | 1.7 | GO:1902711 | GABA-A receptor complex(GO:1902711) |
| 0.0 | 1.3 | GO:0042599 | lamellar body(GO:0042599) |
| 0.0 | 0.2 | GO:1990851 | Wnt-Frizzled-LRP5/6 complex(GO:1990851) |
| 0.0 | 1.4 | GO:0030673 | axolemma(GO:0030673) |
| 0.0 | 0.8 | GO:0048786 | presynaptic active zone(GO:0048786) |
| 0.0 | 3.6 | GO:0031225 | anchored component of membrane(GO:0031225) |
| 0.0 | 1.6 | GO:0030134 | ER to Golgi transport vesicle(GO:0030134) |
| 0.0 | 0.4 | GO:0005922 | connexon complex(GO:0005922) |
Gene overrepresentation in molecular_function category:
| Log-likelihood per target | Total log-likelihood | Term | Description |
|---|---|---|---|
| 1.4 | 5.5 | GO:0070653 | high-density lipoprotein particle receptor binding(GO:0070653) |
| 0.4 | 1.2 | GO:0004603 | phenylethanolamine N-methyltransferase activity(GO:0004603) |
| 0.3 | 1.2 | GO:0030550 | acetylcholine receptor inhibitor activity(GO:0030550) |
| 0.2 | 0.8 | GO:0031728 | CCR3 chemokine receptor binding(GO:0031728) |
| 0.2 | 1.4 | GO:0016715 | oxidoreductase activity, acting on paired donors, with incorporation or reduction of molecular oxygen, reduced ascorbate as one donor, and incorporation of one atom of oxygen(GO:0016715) |
| 0.1 | 1.4 | GO:0015501 | glutamate:sodium symporter activity(GO:0015501) |
| 0.1 | 2.4 | GO:0042975 | peroxisome proliferator activated receptor binding(GO:0042975) |
| 0.1 | 0.6 | GO:0005110 | frizzled-2 binding(GO:0005110) |
| 0.1 | 3.8 | GO:0070006 | metalloaminopeptidase activity(GO:0070006) |
| 0.1 | 1.1 | GO:0050692 | DBD domain binding(GO:0050692) |
| 0.1 | 0.3 | GO:0015218 | pyrimidine nucleotide transmembrane transporter activity(GO:0015218) |
| 0.1 | 0.8 | GO:0004035 | alkaline phosphatase activity(GO:0004035) |
| 0.1 | 3.2 | GO:0016702 | oxidoreductase activity, acting on single donors with incorporation of molecular oxygen, incorporation of two atoms of oxygen(GO:0016702) |
| 0.1 | 0.3 | GO:0016309 | 1-phosphatidylinositol-5-phosphate 4-kinase activity(GO:0016309) |
| 0.1 | 0.9 | GO:0019869 | chloride channel inhibitor activity(GO:0019869) |
| 0.1 | 0.4 | GO:0044736 | acid-sensing ion channel activity(GO:0044736) |
| 0.1 | 1.9 | GO:0017049 | GTP-Rho binding(GO:0017049) |
| 0.1 | 0.8 | GO:0015093 | ferrous iron transmembrane transporter activity(GO:0015093) |
| 0.1 | 0.6 | GO:0046870 | cadmium ion binding(GO:0046870) |
| 0.1 | 1.4 | GO:0045499 | chemorepellent activity(GO:0045499) |
| 0.1 | 1.1 | GO:0005432 | calcium:sodium antiporter activity(GO:0005432) |
| 0.1 | 1.7 | GO:0050811 | GABA receptor binding(GO:0050811) |
| 0.0 | 1.0 | GO:0022841 | potassium ion leak channel activity(GO:0022841) |
| 0.0 | 0.3 | GO:0086089 | voltage-gated potassium channel activity involved in atrial cardiac muscle cell action potential repolarization(GO:0086089) |
| 0.0 | 0.6 | GO:0005149 | interleukin-1 receptor binding(GO:0005149) |
| 0.0 | 0.6 | GO:0016175 | superoxide-generating NADPH oxidase activity(GO:0016175) |
| 0.0 | 0.7 | GO:0043395 | heparan sulfate proteoglycan binding(GO:0043395) |
| 0.0 | 0.5 | GO:0016857 | racemase and epimerase activity, acting on carbohydrates and derivatives(GO:0016857) |
| 0.0 | 2.3 | GO:0048365 | Rac GTPase binding(GO:0048365) |
| 0.0 | 0.7 | GO:0005528 | macrolide binding(GO:0005527) FK506 binding(GO:0005528) |
| 0.0 | 0.5 | GO:0070402 | NADPH binding(GO:0070402) |
| 0.0 | 0.2 | GO:0001591 | dopamine neurotransmitter receptor activity, coupled via Gi/Go(GO:0001591) |
| 0.0 | 2.1 | GO:0004867 | serine-type endopeptidase inhibitor activity(GO:0004867) |
| 0.0 | 0.1 | GO:0035184 | histone threonine kinase activity(GO:0035184) |
| 0.0 | 0.1 | GO:0004719 | protein-L-isoaspartate (D-aspartate) O-methyltransferase activity(GO:0004719) |
Gene overrepresentation in curated gene sets: canonical pathways category:
| Log-likelihood per target | Total log-likelihood | Term | Description |
|---|---|---|---|
| 0.0 | 2.2 | PID ERBB2 ERBB3 PATHWAY | ErbB2/ErbB3 signaling events |
| 0.0 | 2.3 | PID RAC1 REG PATHWAY | Regulation of RAC1 activity |
| 0.0 | 0.9 | PID NECTIN PATHWAY | Nectin adhesion pathway |
| 0.0 | 0.6 | PID WNT SIGNALING PATHWAY | Wnt signaling network |
| 0.0 | 0.3 | PID ALK2 PATHWAY | ALK2 signaling events |
| 0.0 | 4.2 | NABA ECM AFFILIATED | Genes encoding proteins affiliated structurally or functionally to extracellular matrix proteins |
Gene overrepresentation in curated gene sets: REACTOME pathways category:
| Log-likelihood per target | Total log-likelihood | Term | Description |
|---|---|---|---|
| 0.2 | 5.5 | REACTOME HDL MEDIATED LIPID TRANSPORT | Genes involved in HDL-mediated lipid transport |
| 0.1 | 2.6 | REACTOME AMINE DERIVED HORMONES | Genes involved in Amine-derived hormones |
| 0.1 | 3.2 | REACTOME SULFUR AMINO ACID METABOLISM | Genes involved in Sulfur amino acid metabolism |
| 0.1 | 1.0 | REACTOME TANDEM PORE DOMAIN POTASSIUM CHANNELS | Genes involved in Tandem pore domain potassium channels |
| 0.0 | 1.7 | REACTOME GABA A RECEPTOR ACTIVATION | Genes involved in GABA A receptor activation |
| 0.0 | 0.6 | REACTOME ROLE OF DCC IN REGULATING APOPTOSIS | Genes involved in Role of DCC in regulating apoptosis |
| 0.0 | 0.7 | REACTOME ACTIVATION OF RAC | Genes involved in Activation of Rac |
| 0.0 | 1.5 | REACTOME AMINO ACID AND OLIGOPEPTIDE SLC TRANSPORTERS | Genes involved in Amino acid and oligopeptide SLC transporters |
| 0.0 | 0.9 | REACTOME ADHERENS JUNCTIONS INTERACTIONS | Genes involved in Adherens junctions interactions |
| 0.0 | 0.4 | REACTOME GAP JUNCTION ASSEMBLY | Genes involved in Gap junction assembly |
| 0.0 | 0.8 | REACTOME CHEMOKINE RECEPTORS BIND CHEMOKINES | Genes involved in Chemokine receptors bind chemokines |