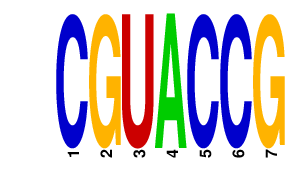
Motif ID: CGUACCG

Z-value: 0.487


Mature miRNA associated with seed CGUACCG:

NamemiRBase Accession
hsa-miR-126 MIMAT0000445


Activity profile for motif CGUACCG.

activity profile for motif CGUACCG


Sorted Z-values histogram for motif CGUACCG

Sorted Z-values for motif CGUACCG


Network of associatons between targets according to the STRING database.


First level regulatory network of CGUACCG

PNG image of the network

In order to view interactive SVG image please either update your browser to latest version or install SVG plugin.


View svg image
View png image


Top targets:


Promoter Score Refseq Gene Symbol Gene Name
chr9_+_116207010 6.773 NM_144488
RGS3
regulator of G-protein signaling 3
chr9_+_116327301 6.659 NM_134427
RGS3
regulator of G-protein signaling 3
chr9_+_116342939 6.649 NM_021106
RGS3
regulator of G-protein signaling 3
chr9_+_116263706 6.594 NM_130795
RGS3
regulator of G-protein signaling 3
chr9_+_116356199 5.964 NM_144489
RGS3
regulator of G-protein signaling 3
chr5_-_57755787 5.903 NM_001252226
NM_006622
PLK2

polo-like kinase 2

chr4_+_76439653 4.342 NM_144721
THAP6
THAP domain containing 6
chr22_-_50746000 4.120 NM_012401
PLXNB2
plexin B2
chr9_+_139560193 3.331 NM_201446
EGFL7
EGF-like-domain, multiple 7
chr8_+_38854431 2.723 NM_003816
ADAM9
ADAM metallopeptidase domain 9
chr2_-_227663454 2.633 NM_005544
IRS1
insulin receptor substrate 1
chr9_+_139557378 2.359 NM_016215
EGFL7
EGF-like-domain, multiple 7
chr8_+_97505876 1.945 NM_002998
SDC2
syndecan 2
chr17_-_1359410 1.705 NM_005206
NM_016823
CRK

v-crk sarcoma virus CT10 oncogene homolog (avian)

chr2_-_176866925 1.517 NM_030650
KIAA1715
KIAA1715
chr1_+_15736387 1.315 NM_024329
EFHD2
EF-hand domain family, member D2
chr15_+_85923739 1.099 NM_006738
NM_007200
AKAP13

A kinase (PRKA) anchor protein 13

chr13_-_95364248 1.024 NM_007084
SOX21
SRY (sex determining region Y)-box 21
chr17_-_63052884 0.763 NM_006572
GNA13
guanine nucleotide binding protein (G protein), alpha 13
chr12_-_12419702 0.745 NM_002336
LRP6
low density lipoprotein receptor-related protein 6
chr22_+_35695792 0.604 NM_001135730
NM_001135732
NM_005488
TOM1


target of myb1 (chicken)


chr22_+_35695267 0.565 NM_001135729
TOM1
target of myb1 (chicken)
chr14_-_21572789 0.558 NM_001102454
ZNF219
zinc finger protein 219
chr10_-_735522 0.432 NM_014974
DIP2C
DIP2 disco-interacting protein 2 homolog C (Drosophila)
chr4_+_30721865 0.408 NM_032456
NM_001173523
NM_002589
NM_032457
PCDH7


protocadherin 7


chr6_+_108882068 0.399 NM_001455
FOXO3
forkhead box O3
chr6_+_108881010 0.142 NM_201559
FOXO3
forkhead box O3
chr14_-_21567069 0.141 NM_001101672
ZNF219
zinc finger protein 219
chr14_-_21566728 0.136 NM_016423
ZNF219
zinc finger protein 219
chr12_+_69864065 0.120 NM_001042555
NM_006654
FRS2

fibroblast growth factor receptor substrate 2

chr5_-_32174397 0.003 NM_022130
GOLPH3
golgi phosphoprotein 3 (coat-protein)

Gene Ontology Analysis

Gene overrepresentation in process category:

enrichment   p-value GO term description
11.55 2.28e-03 GO:0007243 intracellular protein kinase cascade
11.55 2.28e-03 GO:0023014 signal transduction via phosphorylation event
5.25 4.89e-03 GO:0009966 regulation of signal transduction
9.92 5.42e-03 GO:0043549 regulation of kinase activity
9.58 6.62e-03 GO:0051338 regulation of transferase activity
22.46 7.11e-03 GO:0008286 insulin receptor signaling pathway
47.93 8.75e-03 GO:0000186 activation of MAPKK activity
4.57 1.49e-02 GO:0023051 regulation of signaling
17.32 1.97e-02 GO:0032869 cellular response to insulin stimulus
7.55 2.53e-02 GO:0007167 enzyme linked receptor protein signaling pathway
133.54 2.74e-02 GO:0048596 embryonic camera-type eye morphogenesis
4.87 2.94e-02 GO:0035556 intracellular signal transduction
7.28 3.10e-02 GO:0042325 regulation of phosphorylation
4.13 3.33e-02 GO:0007166 cell surface receptor linked signaling pathway
7.07 3.63e-02 GO:0019220 regulation of phosphate metabolic process
7.07 3.63e-02 GO:0051174 regulation of phosphorus metabolic process
2.94 4.02e-02 GO:0007165 signal transduction
3.97 4.55e-02 GO:0048583 regulation of response to stimulus
13.90 4.63e-02 GO:0071375 cellular response to peptide hormone stimulus
13.70 4.89e-02 GO:0032868 response to insulin stimulus
4.52 4.98e-02 GO:0065009 regulation of molecular function

Nothing significant found in compartment category.

Gene overrepresentation in function category:

enrichment   p-value GO term description
209.82 1.79e-03 GO:0005068 transmembrane receptor protein tyrosine kinase adaptor activity
36.75 3.32e-03 GO:0035591 signaling adaptor activity
11.30 1.75e-02 GO:0032403 protein complex binding
63.89 2.13e-02 GO:0030971 receptor tyrosine kinase binding
61.23 2.32e-02 GO:0042169 SH2 domain binding
18.55 2.53e-02 GO:0030674 protein binding, bridging
17.39 3.06e-02 GO:0060090 binding, bridging
52.49 3.16e-02 GO:0005158 insulin receptor binding
45.93 4.14e-02 GO:0005080 protein kinase C binding