Project
Inflammatory response time course, HUVEC (Wada et al., 2009)
Navigation
Downloads
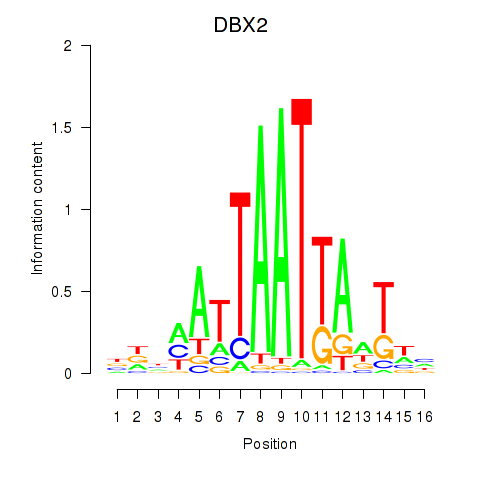
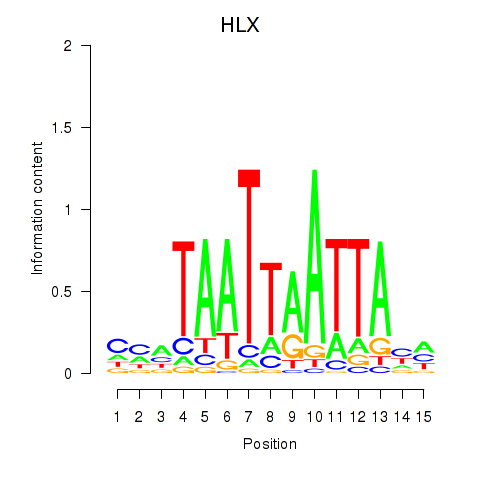
Results for DBX2_HLX
Z-value: 0.62
Motif logo
Transcription factors associated with DBX2_HLX
| Gene Symbol | Gene ID | Gene Info |
|---|---|---|
|
DBX2
|
ENSG00000185610.6 | developing brain homeobox 2 |
|
HLX
|
ENSG00000136630.11 | H2.0 like homeobox |
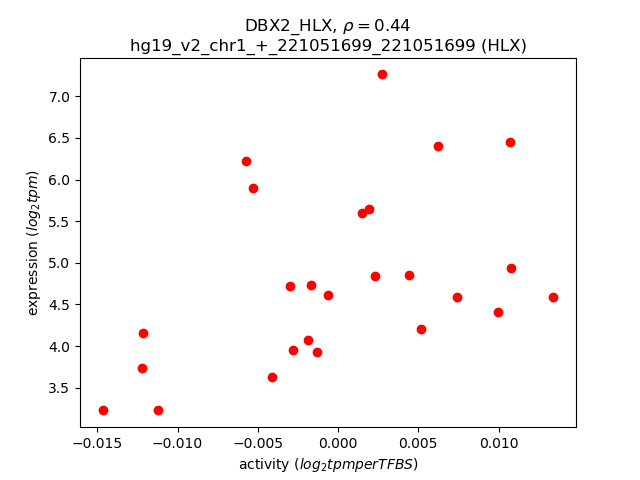
Activity-expression correlation:
| Gene | Promoter | Pearson corr. coef. | P-value | Plot |
|---|---|---|---|---|
| HLX | hg19_v2_chr1_+_221051699_221051699 | 0.44 | 2.6e-02 | Click! |
Activity profile of DBX2_HLX motif
Sorted Z-values of DBX2_HLX motif
| Promoter | Log-likelihood | Transcript | Gene | Gene Info |
|---|---|---|---|---|
| chr4_+_156587853 | 4.35 |
ENST00000506455.1
ENST00000511108.1 |
GUCY1A3
|
guanylate cyclase 1, soluble, alpha 3 |
| chr8_+_98900132 | 1.80 |
ENST00000520016.1
|
MATN2
|
matrilin 2 |
| chr4_+_41540160 | 1.60 |
ENST00000503057.1
ENST00000511496.1 |
LIMCH1
|
LIM and calponin homology domains 1 |
| chr1_+_84630645 | 1.53 |
ENST00000394839.2
|
PRKACB
|
protein kinase, cAMP-dependent, catalytic, beta |
| chr1_+_76540386 | 1.44 |
ENST00000328299.3
|
ST6GALNAC3
|
ST6 (alpha-N-acetyl-neuraminyl-2,3-beta-galactosyl-1,3)-N-acetylgalactosaminide alpha-2,6-sialyltransferase 3 |
| chr12_-_10978957 | 1.21 |
ENST00000240619.2
|
TAS2R10
|
taste receptor, type 2, member 10 |
| chr4_+_156587979 | 1.19 |
ENST00000511507.1
|
GUCY1A3
|
guanylate cyclase 1, soluble, alpha 3 |
| chr11_-_63376013 | 1.08 |
ENST00000540943.1
|
PLA2G16
|
phospholipase A2, group XVI |
| chr20_-_33735070 | 1.05 |
ENST00000374491.3
ENST00000542871.1 ENST00000374492.3 |
EDEM2
|
ER degradation enhancer, mannosidase alpha-like 2 |
| chr6_+_132455526 | 1.00 |
ENST00000443303.1
|
LINC01013
|
long intergenic non-protein coding RNA 1013 |
| chr3_-_18480260 | 0.97 |
ENST00000454909.2
|
SATB1
|
SATB homeobox 1 |
| chr6_-_76072719 | 0.95 |
ENST00000370020.1
|
FILIP1
|
filamin A interacting protein 1 |
| chr6_-_52859046 | 0.92 |
ENST00000457564.1
ENST00000541324.1 ENST00000370960.1 |
GSTA4
|
glutathione S-transferase alpha 4 |
| chrX_+_77166172 | 0.90 |
ENST00000343533.5
ENST00000350425.4 ENST00000341514.6 |
ATP7A
|
ATPase, Cu++ transporting, alpha polypeptide |
| chr14_-_54423529 | 0.86 |
ENST00000245451.4
ENST00000559087.1 |
BMP4
|
bone morphogenetic protein 4 |
| chr6_+_132455118 | 0.85 |
ENST00000458028.1
|
LINC01013
|
long intergenic non-protein coding RNA 1013 |
| chr3_-_141719195 | 0.81 |
ENST00000397991.4
|
TFDP2
|
transcription factor Dp-2 (E2F dimerization partner 2) |
| chr9_+_75766763 | 0.79 |
ENST00000456643.1
ENST00000415424.1 |
ANXA1
|
annexin A1 |
| chr4_-_140201333 | 0.79 |
ENST00000398955.1
|
MGARP
|
mitochondria-localized glutamic acid-rich protein |
| chr3_+_138340049 | 0.78 |
ENST00000464668.1
|
FAIM
|
Fas apoptotic inhibitory molecule |
| chr19_+_50016610 | 0.76 |
ENST00000596975.1
|
FCGRT
|
Fc fragment of IgG, receptor, transporter, alpha |
| chr22_-_29107919 | 0.75 |
ENST00000434810.1
ENST00000456369.1 |
CHEK2
|
checkpoint kinase 2 |
| chr9_+_71944241 | 0.74 |
ENST00000257515.8
|
FAM189A2
|
family with sequence similarity 189, member A2 |
| chr1_+_221051699 | 0.73 |
ENST00000366903.6
|
HLX
|
H2.0-like homeobox |
| chr7_+_107224364 | 0.73 |
ENST00000491150.1
|
BCAP29
|
B-cell receptor-associated protein 29 |
| chr4_-_110723194 | 0.72 |
ENST00000394635.3
|
CFI
|
complement factor I |
| chr4_-_90757364 | 0.71 |
ENST00000508895.1
|
SNCA
|
synuclein, alpha (non A4 component of amyloid precursor) |
| chr1_-_92371839 | 0.71 |
ENST00000370399.2
|
TGFBR3
|
transforming growth factor, beta receptor III |
| chr19_-_58864848 | 0.67 |
ENST00000263100.3
|
A1BG
|
alpha-1-B glycoprotein |
| chr12_-_10022735 | 0.66 |
ENST00000228438.2
|
CLEC2B
|
C-type lectin domain family 2, member B |
| chr7_+_138943265 | 0.66 |
ENST00000483726.1
|
UBN2
|
ubinuclein 2 |
| chr8_-_93115445 | 0.64 |
ENST00000523629.1
|
RUNX1T1
|
runt-related transcription factor 1; translocated to, 1 (cyclin D-related) |
| chr10_-_116444371 | 0.64 |
ENST00000533213.2
ENST00000369252.4 |
ABLIM1
|
actin binding LIM protein 1 |
| chr8_+_97597148 | 0.63 |
ENST00000521590.1
|
SDC2
|
syndecan 2 |
| chr1_-_160924589 | 0.62 |
ENST00000368029.3
|
ITLN2
|
intelectin 2 |
| chr4_-_110723134 | 0.62 |
ENST00000510800.1
ENST00000512148.1 |
CFI
|
complement factor I |
| chr14_-_78083112 | 0.62 |
ENST00000216484.2
|
SPTLC2
|
serine palmitoyltransferase, long chain base subunit 2 |
| chr5_+_55149150 | 0.61 |
ENST00000297015.3
|
IL31RA
|
interleukin 31 receptor A |
| chr1_+_81771806 | 0.61 |
ENST00000370721.1
ENST00000370727.1 ENST00000370725.1 ENST00000370723.1 ENST00000370728.1 ENST00000370730.1 |
LPHN2
|
latrophilin 2 |
| chr10_+_5135981 | 0.60 |
ENST00000380554.3
|
AKR1C3
|
aldo-keto reductase family 1, member C3 |
| chr2_-_183106641 | 0.60 |
ENST00000346717.4
|
PDE1A
|
phosphodiesterase 1A, calmodulin-dependent |
| chr12_-_12503156 | 0.59 |
ENST00000543314.1
ENST00000396349.3 |
MANSC1
|
MANSC domain containing 1 |
| chr10_+_35484793 | 0.58 |
ENST00000488741.1
ENST00000474931.1 ENST00000468236.1 ENST00000344351.5 ENST00000490511.1 |
CREM
|
cAMP responsive element modulator |
| chr7_+_130126165 | 0.57 |
ENST00000427521.1
ENST00000416162.2 ENST00000378576.4 |
MEST
|
mesoderm specific transcript |
| chr7_+_130126012 | 0.54 |
ENST00000341441.5
|
MEST
|
mesoderm specific transcript |
| chr19_+_13842559 | 0.53 |
ENST00000586600.1
|
CCDC130
|
coiled-coil domain containing 130 |
| chr9_+_34652164 | 0.52 |
ENST00000441545.2
ENST00000553620.1 |
IL11RA
|
interleukin 11 receptor, alpha |
| chrX_+_55744228 | 0.52 |
ENST00000262850.7
|
RRAGB
|
Ras-related GTP binding B |
| chr19_+_50016411 | 0.51 |
ENST00000426395.3
ENST00000600273.1 ENST00000599988.1 |
FCGRT
|
Fc fragment of IgG, receptor, transporter, alpha |
| chr17_+_67498538 | 0.50 |
ENST00000589647.1
|
MAP2K6
|
mitogen-activated protein kinase kinase 6 |
| chr9_+_2015335 | 0.49 |
ENST00000349721.2
ENST00000357248.2 ENST00000450198.1 |
SMARCA2
|
SWI/SNF related, matrix associated, actin dependent regulator of chromatin, subfamily a, member 2 |
| chr3_+_145782358 | 0.49 |
ENST00000422482.1
|
AC107021.1
|
HCG1786590; PRO2533; Uncharacterized protein |
| chr7_+_99717230 | 0.48 |
ENST00000262932.3
|
CNPY4
|
canopy FGF signaling regulator 4 |
| chr1_+_196788887 | 0.48 |
ENST00000320493.5
ENST00000367424.4 ENST00000367421.3 |
CFHR1
CFHR2
|
complement factor H-related 1 complement factor H-related 2 |
| chr10_+_32873190 | 0.48 |
ENST00000375025.4
|
C10orf68
|
Homo sapiens coiled-coil domain containing 7 (CCDC7), transcript variant 5, mRNA. |
| chr4_-_163085107 | 0.47 |
ENST00000379164.4
|
FSTL5
|
follistatin-like 5 |
| chr16_-_30122717 | 0.47 |
ENST00000566613.1
|
GDPD3
|
glycerophosphodiester phosphodiesterase domain containing 3 |
| chr4_-_159080806 | 0.47 |
ENST00000590648.1
|
FAM198B
|
family with sequence similarity 198, member B |
| chrX_+_55744166 | 0.47 |
ENST00000374941.4
ENST00000414239.1 |
RRAGB
|
Ras-related GTP binding B |
| chr6_+_26104104 | 0.47 |
ENST00000377803.2
|
HIST1H4C
|
histone cluster 1, H4c |
| chr16_+_24549014 | 0.45 |
ENST00000564314.1
ENST00000567686.1 |
RBBP6
|
retinoblastoma binding protein 6 |
| chr17_+_61086917 | 0.45 |
ENST00000424789.2
ENST00000389520.4 |
TANC2
|
tetratricopeptide repeat, ankyrin repeat and coiled-coil containing 2 |
| chr18_+_6834472 | 0.45 |
ENST00000581099.1
ENST00000419673.2 ENST00000531294.1 |
ARHGAP28
|
Rho GTPase activating protein 28 |
| chr3_-_141747950 | 0.44 |
ENST00000497579.1
|
TFDP2
|
transcription factor Dp-2 (E2F dimerization partner 2) |
| chr6_-_110501200 | 0.44 |
ENST00000392586.1
ENST00000419252.1 ENST00000392589.1 ENST00000392588.1 ENST00000359451.2 |
WASF1
|
WAS protein family, member 1 |
| chr12_-_10959892 | 0.43 |
ENST00000240615.2
|
TAS2R8
|
taste receptor, type 2, member 8 |
| chr17_+_35851570 | 0.42 |
ENST00000394386.1
|
DUSP14
|
dual specificity phosphatase 14 |
| chr2_+_88047606 | 0.42 |
ENST00000359481.4
|
PLGLB2
|
plasminogen-like B2 |
| chr9_-_5833027 | 0.40 |
ENST00000339450.5
|
ERMP1
|
endoplasmic reticulum metallopeptidase 1 |
| chr2_+_133874577 | 0.39 |
ENST00000596384.1
|
AC011755.1
|
HCG2006742; Protein LOC100996685 |
| chr19_+_35417798 | 0.39 |
ENST00000303586.7
ENST00000439785.1 ENST00000601540.1 |
ZNF30
|
zinc finger protein 30 |
| chr14_+_57046500 | 0.38 |
ENST00000261556.6
|
TMEM260
|
transmembrane protein 260 |
| chr2_+_120687335 | 0.37 |
ENST00000544261.1
|
PTPN4
|
protein tyrosine phosphatase, non-receptor type 4 (megakaryocyte) |
| chr13_-_110438914 | 0.36 |
ENST00000375856.3
|
IRS2
|
insulin receptor substrate 2 |
| chr7_+_116654935 | 0.36 |
ENST00000432298.1
ENST00000422922.1 |
ST7
|
suppression of tumorigenicity 7 |
| chr18_-_53303123 | 0.35 |
ENST00000569357.1
ENST00000565124.1 ENST00000398339.1 |
TCF4
|
transcription factor 4 |
| chr6_-_112575838 | 0.34 |
ENST00000455073.1
|
LAMA4
|
laminin, alpha 4 |
| chr15_-_20193370 | 0.34 |
ENST00000558565.2
|
IGHV3OR15-7
|
immunoglobulin heavy variable 3/OR15-7 (pseudogene) |
| chr16_+_81678957 | 0.33 |
ENST00000398040.4
|
CMIP
|
c-Maf inducing protein |
| chr5_+_140227048 | 0.32 |
ENST00000532602.1
|
PCDHA9
|
protocadherin alpha 9 |
| chr1_+_196912902 | 0.32 |
ENST00000476712.2
ENST00000367415.5 |
CFHR2
|
complement factor H-related 2 |
| chr1_-_54411255 | 0.32 |
ENST00000371377.3
|
HSPB11
|
heat shock protein family B (small), member 11 |
| chr6_+_28092338 | 0.32 |
ENST00000340487.4
|
ZSCAN16
|
zinc finger and SCAN domain containing 16 |
| chr5_+_95066823 | 0.31 |
ENST00000506817.1
ENST00000379982.3 |
RHOBTB3
|
Rho-related BTB domain containing 3 |
| chr3_-_150996239 | 0.31 |
ENST00000309170.3
|
P2RY14
|
purinergic receptor P2Y, G-protein coupled, 14 |
| chr6_-_112575687 | 0.31 |
ENST00000521398.1
ENST00000424408.2 ENST00000243219.3 |
LAMA4
|
laminin, alpha 4 |
| chr7_-_5998714 | 0.30 |
ENST00000539903.1
|
RSPH10B
|
radial spoke head 10 homolog B (Chlamydomonas) |
| chr19_-_51920952 | 0.30 |
ENST00000356298.5
ENST00000339313.5 ENST00000529627.1 ENST00000439889.2 ENST00000353836.5 ENST00000432469.2 |
SIGLEC10
|
sialic acid binding Ig-like lectin 10 |
| chr4_-_100356551 | 0.30 |
ENST00000209665.4
|
ADH7
|
alcohol dehydrogenase 7 (class IV), mu or sigma polypeptide |
| chr12_+_59989918 | 0.30 |
ENST00000547379.1
ENST00000549465.1 |
SLC16A7
|
solute carrier family 16 (monocarboxylate transporter), member 7 |
| chr12_+_60058458 | 0.30 |
ENST00000548610.1
|
SLC16A7
|
solute carrier family 16 (monocarboxylate transporter), member 7 |
| chr20_-_29978286 | 0.29 |
ENST00000376315.2
|
DEFB119
|
defensin, beta 119 |
| chr8_+_42396274 | 0.29 |
ENST00000438528.3
|
SMIM19
|
small integral membrane protein 19 |
| chrX_-_73072534 | 0.28 |
ENST00000429829.1
|
XIST
|
X inactive specific transcript (non-protein coding) |
| chr7_+_13141097 | 0.28 |
ENST00000411542.1
|
AC011288.2
|
AC011288.2 |
| chr7_-_130080977 | 0.28 |
ENST00000223208.5
|
CEP41
|
centrosomal protein 41kDa |
| chr2_+_87135076 | 0.27 |
ENST00000409776.2
|
RGPD1
|
RANBP2-like and GRIP domain containing 1 |
| chr2_-_165424973 | 0.27 |
ENST00000543549.1
|
GRB14
|
growth factor receptor-bound protein 14 |
| chr1_-_21377383 | 0.27 |
ENST00000374935.3
|
EIF4G3
|
eukaryotic translation initiation factor 4 gamma, 3 |
| chr11_-_128894053 | 0.27 |
ENST00000392657.3
|
ARHGAP32
|
Rho GTPase activating protein 32 |
| chr6_-_112575758 | 0.27 |
ENST00000431543.2
ENST00000453937.2 ENST00000368638.4 ENST00000389463.4 |
LAMA4
|
laminin, alpha 4 |
| chr16_+_33204156 | 0.27 |
ENST00000398667.4
|
TP53TG3C
|
TP53 target 3C |
| chr6_+_26087509 | 0.27 |
ENST00000397022.3
ENST00000353147.5 ENST00000352392.4 ENST00000349999.4 ENST00000317896.7 ENST00000357618.5 ENST00000470149.1 ENST00000336625.8 ENST00000461397.1 ENST00000488199.1 |
HFE
|
hemochromatosis |
| chr5_-_55412774 | 0.27 |
ENST00000434982.2
|
ANKRD55
|
ankyrin repeat domain 55 |
| chr15_+_75639296 | 0.27 |
ENST00000564500.1
ENST00000355059.4 ENST00000566752.1 |
NEIL1
|
nei endonuclease VIII-like 1 (E. coli) |
| chr20_-_25320367 | 0.26 |
ENST00000450393.1
ENST00000491682.1 |
ABHD12
|
abhydrolase domain containing 12 |
| chr7_+_138915102 | 0.26 |
ENST00000486663.1
|
UBN2
|
ubinuclein 2 |
| chr13_+_32313658 | 0.26 |
ENST00000380314.1
ENST00000298386.2 |
RXFP2
|
relaxin/insulin-like family peptide receptor 2 |
| chr6_+_29079668 | 0.25 |
ENST00000377169.1
|
OR2J3
|
olfactory receptor, family 2, subfamily J, member 3 |
| chr20_+_11008811 | 0.25 |
ENST00000537362.1
|
C20orf187
|
chromosome 20 open reading frame 187 |
| chr3_+_136649311 | 0.25 |
ENST00000469404.1
ENST00000467911.1 |
NCK1
|
NCK adaptor protein 1 |
| chr6_+_130339710 | 0.25 |
ENST00000526087.1
ENST00000533560.1 ENST00000361794.2 |
L3MBTL3
|
l(3)mbt-like 3 (Drosophila) |
| chr16_+_15489603 | 0.25 |
ENST00000568766.1
ENST00000287594.7 |
RP11-1021N1.1
MPV17L
|
Uncharacterized protein MPV17 mitochondrial membrane protein-like |
| chr11_-_102576537 | 0.24 |
ENST00000260229.4
|
MMP27
|
matrix metallopeptidase 27 |
| chr9_-_95166841 | 0.24 |
ENST00000262551.4
|
OGN
|
osteoglycin |
| chr2_+_101591314 | 0.24 |
ENST00000450763.1
|
NPAS2
|
neuronal PAS domain protein 2 |
| chr2_-_58468437 | 0.24 |
ENST00000403676.1
ENST00000427708.2 ENST00000403295.3 ENST00000446381.1 ENST00000417361.1 ENST00000233741.4 ENST00000402135.3 ENST00000540646.1 ENST00000449070.1 |
FANCL
|
Fanconi anemia, complementation group L |
| chr11_-_121986923 | 0.24 |
ENST00000560104.1
|
BLID
|
BH3-like motif containing, cell death inducer |
| chr7_-_64023410 | 0.24 |
ENST00000447137.2
|
ZNF680
|
zinc finger protein 680 |
| chr2_-_179343226 | 0.24 |
ENST00000434643.2
|
FKBP7
|
FK506 binding protein 7 |
| chr6_-_52859968 | 0.24 |
ENST00000370959.1
|
GSTA4
|
glutathione S-transferase alpha 4 |
| chr8_+_11666649 | 0.23 |
ENST00000528643.1
ENST00000525777.1 |
FDFT1
|
farnesyl-diphosphate farnesyltransferase 1 |
| chr7_+_151722712 | 0.23 |
ENST00000430044.2
ENST00000431668.1 ENST00000446096.1 ENST00000452146.2 ENST00000423337.1 |
GALNT11
|
UDP-N-acetyl-alpha-D-galactosamine:polypeptide N-acetylgalactosaminyltransferase 11 (GalNAc-T11) |
| chr11_-_2162468 | 0.23 |
ENST00000434045.2
|
IGF2
|
insulin-like growth factor 2 (somatomedin A) |
| chr12_-_46121554 | 0.23 |
ENST00000609803.1
|
LINC00938
|
long intergenic non-protein coding RNA 938 |
| chr15_+_25200108 | 0.23 |
ENST00000577949.1
ENST00000338094.6 ENST00000338327.4 ENST00000579070.1 ENST00000577565.1 |
SNURF
SNRPN
|
SNRPN upstream reading frame protein small nuclear ribonucleoprotein polypeptide N |
| chr2_-_27712583 | 0.23 |
ENST00000260570.3
ENST00000359466.6 ENST00000416524.2 |
IFT172
|
intraflagellar transport 172 homolog (Chlamydomonas) |
| chr10_+_81601114 | 0.23 |
ENST00000602967.1
ENST00000429984.3 |
NUTM2E
|
NUT family member 2E |
| chr15_+_25200074 | 0.23 |
ENST00000390687.4
ENST00000584968.1 ENST00000346403.6 ENST00000554227.2 |
SNRPN
|
small nuclear ribonucleoprotein polypeptide N |
| chr18_+_60206744 | 0.22 |
ENST00000586834.1
|
ZCCHC2
|
zinc finger, CCHC domain containing 2 |
| chr7_-_64023441 | 0.22 |
ENST00000309683.6
|
ZNF680
|
zinc finger protein 680 |
| chr17_-_41050716 | 0.22 |
ENST00000417193.1
ENST00000301683.3 ENST00000436546.1 ENST00000431109.2 |
LINC00671
|
long intergenic non-protein coding RNA 671 |
| chr14_-_72458326 | 0.22 |
ENST00000542853.1
|
AC005477.1
|
AC005477.1 |
| chr9_-_21305312 | 0.22 |
ENST00000259555.4
|
IFNA5
|
interferon, alpha 5 |
| chr16_-_66584059 | 0.22 |
ENST00000417693.3
ENST00000544898.1 ENST00000569718.1 ENST00000527284.1 ENST00000299697.7 ENST00000451102.2 |
TK2
|
thymidine kinase 2, mitochondrial |
| chr11_+_49050504 | 0.22 |
ENST00000332682.7
|
TRIM49B
|
tripartite motif containing 49B |
| chr6_-_112575912 | 0.21 |
ENST00000522006.1
ENST00000230538.7 ENST00000519932.1 |
LAMA4
|
laminin, alpha 4 |
| chr11_+_22689648 | 0.21 |
ENST00000278187.3
|
GAS2
|
growth arrest-specific 2 |
| chr6_+_89674246 | 0.21 |
ENST00000369474.1
|
AL079342.1
|
Uncharacterized protein; cDNA FLJ27030 fis, clone SLV07741 |
| chr14_-_106552755 | 0.21 |
ENST00000390600.2
|
IGHV3-9
|
immunoglobulin heavy variable 3-9 |
| chr7_+_80275953 | 0.21 |
ENST00000538969.1
ENST00000544133.1 ENST00000433696.2 |
CD36
|
CD36 molecule (thrombospondin receptor) |
| chr3_+_16216137 | 0.21 |
ENST00000339732.5
|
GALNT15
|
UDP-N-acetyl-alpha-D-galactosamine:polypeptide N-acetylgalactosaminyltransferase 15 |
| chr2_+_85811525 | 0.21 |
ENST00000306384.4
|
VAMP5
|
vesicle-associated membrane protein 5 |
| chr1_+_158801095 | 0.21 |
ENST00000368141.4
|
MNDA
|
myeloid cell nuclear differentiation antigen |
| chr3_+_138340067 | 0.21 |
ENST00000479848.1
|
FAIM
|
Fas apoptotic inhibitory molecule |
| chr13_+_103459704 | 0.21 |
ENST00000602836.1
|
BIVM-ERCC5
|
BIVM-ERCC5 readthrough |
| chr1_+_178694300 | 0.21 |
ENST00000367635.3
|
RALGPS2
|
Ral GEF with PH domain and SH3 binding motif 2 |
| chr2_-_191115229 | 0.21 |
ENST00000409820.2
ENST00000410045.1 |
HIBCH
|
3-hydroxyisobutyryl-CoA hydrolase |
| chrX_+_44703249 | 0.20 |
ENST00000339042.4
|
DUSP21
|
dual specificity phosphatase 21 |
| chr5_-_111754948 | 0.20 |
ENST00000261486.5
|
EPB41L4A
|
erythrocyte membrane protein band 4.1 like 4A |
| chr13_+_24144796 | 0.20 |
ENST00000403372.2
|
TNFRSF19
|
tumor necrosis factor receptor superfamily, member 19 |
| chr14_-_90085458 | 0.20 |
ENST00000345097.4
ENST00000555855.1 ENST00000555353.1 |
FOXN3
|
forkhead box N3 |
| chr9_-_95166884 | 0.19 |
ENST00000375561.5
|
OGN
|
osteoglycin |
| chr20_+_11871371 | 0.19 |
ENST00000254977.3
|
BTBD3
|
BTB (POZ) domain containing 3 |
| chr16_+_14802801 | 0.19 |
ENST00000526520.1
ENST00000531598.2 |
NPIPA3
|
nuclear pore complex interacting protein family, member A3 |
| chr16_-_28937027 | 0.19 |
ENST00000358201.4
|
RABEP2
|
rabaptin, RAB GTPase binding effector protein 2 |
| chr17_-_38938786 | 0.19 |
ENST00000301656.3
|
KRT27
|
keratin 27 |
| chr20_+_11871433 | 0.19 |
ENST00000399006.2
ENST00000405977.1 |
BTBD3
|
BTB (POZ) domain containing 3 |
| chrX_+_153533275 | 0.19 |
ENST00000426989.1
ENST00000426203.1 ENST00000369912.2 |
TKTL1
|
transketolase-like 1 |
| chr9_+_105757590 | 0.18 |
ENST00000374798.3
ENST00000487798.1 |
CYLC2
|
cylicin, basic protein of sperm head cytoskeleton 2 |
| chr2_+_169312350 | 0.18 |
ENST00000305747.6
|
CERS6
|
ceramide synthase 6 |
| chr4_-_48782259 | 0.18 |
ENST00000507711.1
ENST00000358350.4 ENST00000537810.1 ENST00000264319.7 |
FRYL
|
FRY-like |
| chr1_-_51796987 | 0.18 |
ENST00000262676.5
|
TTC39A
|
tetratricopeptide repeat domain 39A |
| chr5_+_140552218 | 0.18 |
ENST00000231137.3
|
PCDHB7
|
protocadherin beta 7 |
| chr1_+_15668240 | 0.18 |
ENST00000444385.1
|
FHAD1
|
forkhead-associated (FHA) phosphopeptide binding domain 1 |
| chr11_+_22696314 | 0.18 |
ENST00000532398.1
ENST00000433790.1 |
GAS2
|
growth arrest-specific 2 |
| chrX_+_15525426 | 0.18 |
ENST00000342014.6
|
BMX
|
BMX non-receptor tyrosine kinase |
| chr3_-_151047327 | 0.18 |
ENST00000325602.5
|
P2RY13
|
purinergic receptor P2Y, G-protein coupled, 13 |
| chr16_+_75182376 | 0.18 |
ENST00000570010.1
ENST00000568079.1 ENST00000464850.1 ENST00000332307.4 ENST00000393430.2 |
ZFP1
|
ZFP1 zinc finger protein |
| chr11_-_101000445 | 0.17 |
ENST00000534013.1
|
PGR
|
progesterone receptor |
| chr3_-_114790179 | 0.17 |
ENST00000462705.1
|
ZBTB20
|
zinc finger and BTB domain containing 20 |
| chr2_+_109204909 | 0.17 |
ENST00000393310.1
|
LIMS1
|
LIM and senescent cell antigen-like domains 1 |
| chr3_-_180707306 | 0.17 |
ENST00000479269.1
|
DNAJC19
|
DnaJ (Hsp40) homolog, subfamily C, member 19 |
| chr4_-_100356291 | 0.17 |
ENST00000476959.1
ENST00000482593.1 |
ADH7
|
alcohol dehydrogenase 7 (class IV), mu or sigma polypeptide |
| chr2_+_112939365 | 0.17 |
ENST00000272559.4
|
FBLN7
|
fibulin 7 |
| chr14_+_23012122 | 0.17 |
ENST00000390534.1
|
TRAJ3
|
T cell receptor alpha joining 3 |
| chr15_+_54901540 | 0.17 |
ENST00000539562.2
|
UNC13C
|
unc-13 homolog C (C. elegans) |
| chr15_+_65843130 | 0.17 |
ENST00000569894.1
|
PTPLAD1
|
protein tyrosine phosphatase-like A domain containing 1 |
| chr19_+_9296279 | 0.17 |
ENST00000344248.2
|
OR7D2
|
olfactory receptor, family 7, subfamily D, member 2 |
| chr2_+_132479948 | 0.16 |
ENST00000355171.4
|
C2orf27A
|
chromosome 2 open reading frame 27A |
| chr12_+_104337515 | 0.16 |
ENST00000550595.1
|
HSP90B1
|
heat shock protein 90kDa beta (Grp94), member 1 |
| chr12_+_101988627 | 0.16 |
ENST00000547405.1
ENST00000452455.2 ENST00000441232.1 ENST00000360610.2 ENST00000392934.3 ENST00000547509.1 ENST00000361685.2 ENST00000549145.1 ENST00000553190.1 |
MYBPC1
|
myosin binding protein C, slow type |
| chr11_-_59950486 | 0.16 |
ENST00000426738.2
ENST00000533023.1 ENST00000420732.2 |
MS4A6A
|
membrane-spanning 4-domains, subfamily A, member 6A |
| chr7_-_140482926 | 0.16 |
ENST00000496384.2
|
BRAF
|
v-raf murine sarcoma viral oncogene homolog B |
| chr4_-_170533723 | 0.16 |
ENST00000510533.1
ENST00000439128.2 ENST00000511633.1 ENST00000512193.1 ENST00000507142.1 |
NEK1
|
NIMA-related kinase 1 |
| chr11_+_44117099 | 0.16 |
ENST00000533608.1
|
EXT2
|
exostosin glycosyltransferase 2 |
| chr6_+_47749718 | 0.16 |
ENST00000489301.2
ENST00000371211.2 ENST00000393699.2 |
OPN5
|
opsin 5 |
| chr2_+_108994633 | 0.16 |
ENST00000409309.3
|
SULT1C4
|
sulfotransferase family, cytosolic, 1C, member 4 |
| chr5_+_140254884 | 0.16 |
ENST00000398631.2
|
PCDHA12
|
protocadherin alpha 12 |
| chr19_+_15852203 | 0.16 |
ENST00000305892.1
|
OR10H3
|
olfactory receptor, family 10, subfamily H, member 3 |
| chr4_-_138453606 | 0.16 |
ENST00000412923.2
ENST00000344876.4 ENST00000507846.1 ENST00000510305.1 |
PCDH18
|
protocadherin 18 |
| chr14_+_35591928 | 0.16 |
ENST00000605870.1
ENST00000557404.3 |
KIAA0391
|
KIAA0391 |
| chr11_-_124670550 | 0.16 |
ENST00000239614.4
|
MSANTD2
|
Myb/SANT-like DNA-binding domain containing 2 |
| chr5_-_86534822 | 0.15 |
ENST00000445770.2
|
AC008394.1
|
Uncharacterized protein |
| chr15_-_55657428 | 0.15 |
ENST00000568543.1
|
CCPG1
|
cell cycle progression 1 |
| chr14_-_106926724 | 0.15 |
ENST00000434710.1
|
IGHV3-43
|
immunoglobulin heavy variable 3-43 |
| chr2_+_103089756 | 0.15 |
ENST00000295269.4
|
SLC9A4
|
solute carrier family 9, subfamily A (NHE4, cation proton antiporter 4), member 4 |
| chr2_+_89998789 | 0.15 |
ENST00000453166.2
|
IGKV2D-28
|
immunoglobulin kappa variable 2D-28 |
| chr5_-_125930929 | 0.15 |
ENST00000553117.1
ENST00000447989.2 ENST00000409134.3 |
ALDH7A1
|
aldehyde dehydrogenase 7 family, member A1 |
| chr10_-_63995871 | 0.15 |
ENST00000315289.2
|
RTKN2
|
rhotekin 2 |
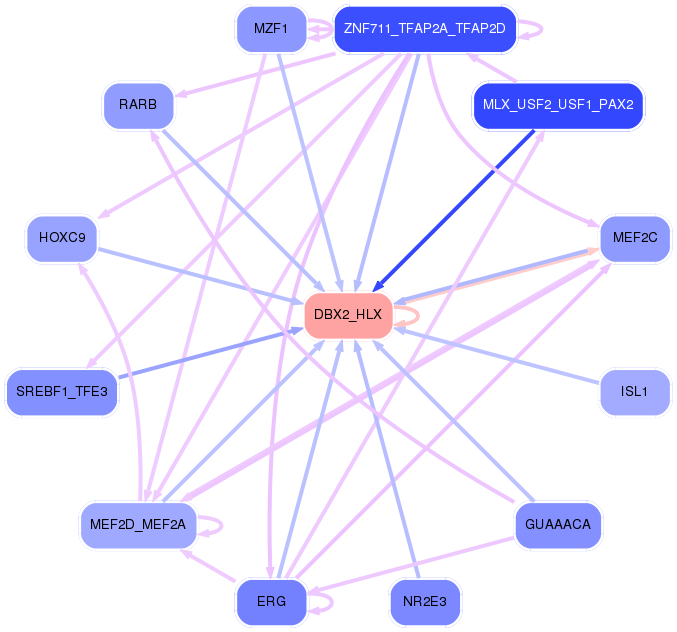
Network of associatons between targets according to the STRING database.

First level regulatory network of DBX2_HLX
Gene Ontology Analysis
Gene overrepresentation in biological process category:
| Log-likelihood per target | Total log-likelihood | Term | Description |
|---|---|---|---|
| 0.9 | 5.5 | GO:0052565 | response to defense-related nitric oxide production by other organism involved in symbiotic interaction(GO:0052551) response to defense-related host nitric oxide production(GO:0052565) |
| 0.3 | 1.0 | GO:0036511 | trimming of terminal mannose on B branch(GO:0036509) trimming of first mannose on A branch(GO:0036511) trimming of second mannose on A branch(GO:0036512) |
| 0.3 | 0.9 | GO:0071284 | cellular response to lead ion(GO:0071284) |
| 0.3 | 0.9 | GO:0072099 | apoptotic process involved in endocardial cushion morphogenesis(GO:0003277) intermediate mesoderm morphogenesis(GO:0048390) intermediate mesoderm formation(GO:0048391) intermediate mesodermal cell differentiation(GO:0048392) regulation of cardiac muscle fiber development(GO:0055018) positive regulation of cardiac muscle fiber development(GO:0055020) bud dilation involved in lung branching(GO:0060503) BMP signaling pathway involved in ureter morphogenesis(GO:0061149) renal system segmentation(GO:0061150) BMP signaling pathway involved in renal system segmentation(GO:0061151) pulmonary artery endothelial tube morphogenesis(GO:0061155) regulation of transcription from RNA polymerase II promoter involved in mesonephros development(GO:0061216) BMP signaling pathway involved in nephric duct formation(GO:0071893) negative regulation of branch elongation involved in ureteric bud branching(GO:0072096) negative regulation of branch elongation involved in ureteric bud branching by BMP signaling pathway(GO:0072097) anterior/posterior pattern specification involved in ureteric bud development(GO:0072099) specification of ureteric bud anterior/posterior symmetry(GO:0072100) specification of ureteric bud anterior/posterior symmetry by BMP signaling pathway(GO:0072101) ureter epithelial cell differentiation(GO:0072192) negative regulation of mesenchymal cell proliferation involved in ureter development(GO:0072200) positive regulation of cell proliferation involved in outflow tract morphogenesis(GO:1901964) cardiac jelly development(GO:1905072) regulation of metanephric S-shaped body morphogenesis(GO:2000004) negative regulation of metanephric S-shaped body morphogenesis(GO:2000005) regulation of metanephric comma-shaped body morphogenesis(GO:2000006) negative regulation of metanephric comma-shaped body morphogenesis(GO:2000007) |
| 0.3 | 0.8 | GO:0014839 | myoblast migration involved in skeletal muscle regeneration(GO:0014839) |
| 0.2 | 0.7 | GO:0072428 | signal transduction involved in intra-S DNA damage checkpoint(GO:0072428) response to bisphenol A(GO:1903925) cellular response to bisphenol A(GO:1903926) |
| 0.2 | 1.5 | GO:0097338 | response to clozapine(GO:0097338) |
| 0.2 | 0.6 | GO:0006667 | sphinganine metabolic process(GO:0006667) |
| 0.2 | 0.7 | GO:0007181 | transforming growth factor beta receptor complex assembly(GO:0007181) |
| 0.2 | 0.5 | GO:0072709 | cellular response to sorbitol(GO:0072709) |
| 0.2 | 0.8 | GO:0097211 | response to gonadotropin-releasing hormone(GO:0097210) cellular response to gonadotropin-releasing hormone(GO:0097211) |
| 0.2 | 0.5 | GO:0010430 | fatty acid omega-oxidation(GO:0010430) |
| 0.2 | 0.6 | GO:0016095 | polyprenol catabolic process(GO:0016095) |
| 0.1 | 0.4 | GO:1904425 | negative regulation of GTP binding(GO:1904425) |
| 0.1 | 0.7 | GO:0051620 | negative regulation of dopamine uptake involved in synaptic transmission(GO:0051585) norepinephrine uptake(GO:0051620) regulation of norepinephrine uptake(GO:0051621) negative regulation of norepinephrine uptake(GO:0051622) negative regulation of catecholamine uptake involved in synaptic transmission(GO:0051945) regulation of glutathione peroxidase activity(GO:1903282) positive regulation of glutathione peroxidase activity(GO:1903284) positive regulation of hydrogen peroxide catabolic process(GO:1903285) positive regulation of peroxidase activity(GO:2000470) |
| 0.1 | 0.7 | GO:0045629 | negative regulation of T-helper 2 cell differentiation(GO:0045629) |
| 0.1 | 1.1 | GO:0002414 | immunoglobulin transcytosis in epithelial cells(GO:0002414) |
| 0.1 | 1.0 | GO:1990253 | cellular response to leucine starvation(GO:1990253) |
| 0.1 | 1.1 | GO:0046485 | ether lipid metabolic process(GO:0046485) |
| 0.1 | 0.3 | GO:0002589 | regulation of antigen processing and presentation of peptide antigen via MHC class I(GO:0002589) negative regulation of antigen processing and presentation of peptide antigen via MHC class I(GO:0002590) regulation of T cell antigen processing and presentation(GO:0002625) positive regulation of iron ion transport(GO:0034758) positive regulation of iron ion transmembrane transport(GO:0034761) regulation of iron ion import(GO:1900390) regulation of ferrous iron import into cell(GO:1903989) positive regulation of ferrous iron import into cell(GO:1903991) regulation of ferrous iron binding(GO:1904432) positive regulation of ferrous iron binding(GO:1904434) regulation of transferrin receptor binding(GO:1904435) positive regulation of transferrin receptor binding(GO:1904437) regulation of ferrous iron import across plasma membrane(GO:1904438) positive regulation of ferrous iron import across plasma membrane(GO:1904440) response to iron ion starvation(GO:1990641) |
| 0.1 | 0.6 | GO:0008218 | bioluminescence(GO:0008218) |
| 0.1 | 0.3 | GO:1903674 | regulation of cap-dependent translational initiation(GO:1903674) positive regulation of cap-dependent translational initiation(GO:1903676) |
| 0.1 | 0.3 | GO:0046104 | thymidine metabolic process(GO:0046104) pyrimidine deoxyribonucleoside metabolic process(GO:0046125) |
| 0.1 | 0.6 | GO:1901475 | pyruvate transport(GO:0006848) pyruvate transmembrane transport(GO:1901475) |
| 0.1 | 0.7 | GO:0070973 | protein localization to endoplasmic reticulum exit site(GO:0070973) |
| 0.1 | 0.3 | GO:0046462 | monoacylglycerol metabolic process(GO:0046462) monoacylglycerol catabolic process(GO:0052651) |
| 0.1 | 0.2 | GO:0010730 | negative regulation of hydrogen peroxide biosynthetic process(GO:0010730) |
| 0.1 | 0.4 | GO:0010748 | regulation of plasma membrane long-chain fatty acid transport(GO:0010746) negative regulation of plasma membrane long-chain fatty acid transport(GO:0010748) |
| 0.1 | 0.2 | GO:0031247 | actin rod assembly(GO:0031247) |
| 0.1 | 1.0 | GO:0043374 | CD8-positive, alpha-beta T cell differentiation(GO:0043374) |
| 0.1 | 0.8 | GO:0045919 | positive regulation of cytolysis(GO:0045919) |
| 0.1 | 0.2 | GO:0032485 | Ral protein signal transduction(GO:0032484) regulation of Ral protein signal transduction(GO:0032485) |
| 0.1 | 0.2 | GO:0031456 | glycine betaine biosynthetic process from choline(GO:0019285) glycine betaine metabolic process(GO:0031455) glycine betaine biosynthetic process(GO:0031456) |
| 0.0 | 1.5 | GO:0006677 | glycosylceramide metabolic process(GO:0006677) |
| 0.0 | 0.2 | GO:0006696 | ergosterol biosynthetic process(GO:0006696) ergosterol metabolic process(GO:0008204) cellular lipid biosynthetic process(GO:0097384) |
| 0.0 | 0.2 | GO:0002074 | extraocular skeletal muscle development(GO:0002074) |
| 0.0 | 0.2 | GO:0018243 | protein O-linked glycosylation via threonine(GO:0018243) |
| 0.0 | 0.1 | GO:2000583 | regulation of platelet-derived growth factor receptor-alpha signaling pathway(GO:2000583) negative regulation of platelet-derived growth factor receptor-alpha signaling pathway(GO:2000584) |
| 0.0 | 1.8 | GO:0001580 | detection of chemical stimulus involved in sensory perception of bitter taste(GO:0001580) |
| 0.0 | 0.4 | GO:2000601 | positive regulation of Arp2/3 complex-mediated actin nucleation(GO:2000601) |
| 0.0 | 0.2 | GO:0060748 | tertiary branching involved in mammary gland duct morphogenesis(GO:0060748) |
| 0.0 | 0.1 | GO:1901143 | insulin catabolic process(GO:1901143) |
| 0.0 | 0.1 | GO:2000395 | regulation of ubiquitin-dependent endocytosis(GO:2000395) positive regulation of ubiquitin-dependent endocytosis(GO:2000397) |
| 0.0 | 0.2 | GO:0051919 | positive regulation of fibrinolysis(GO:0051919) |
| 0.0 | 0.1 | GO:2001180 | negative regulation of interleukin-10 secretion(GO:2001180) |
| 0.0 | 0.6 | GO:0043031 | negative regulation of macrophage activation(GO:0043031) |
| 0.0 | 0.2 | GO:0070543 | response to linoleic acid(GO:0070543) |
| 0.0 | 0.1 | GO:0036269 | swimming behavior(GO:0036269) |
| 0.0 | 0.6 | GO:0046069 | cGMP catabolic process(GO:0046069) |
| 0.0 | 0.2 | GO:0006574 | valine catabolic process(GO:0006574) |
| 0.0 | 0.1 | GO:0098905 | regulation of bundle of His cell action potential(GO:0098905) |
| 0.0 | 0.2 | GO:0035609 | C-terminal protein deglutamylation(GO:0035609) |
| 0.0 | 0.2 | GO:2000301 | negative regulation of synaptic vesicle exocytosis(GO:2000301) |
| 0.0 | 0.2 | GO:1904844 | response to L-glutamine(GO:1904844) cellular response to L-glutamine(GO:1904845) |
| 0.0 | 0.2 | GO:2001106 | regulation of Rho guanyl-nucleotide exchange factor activity(GO:2001106) |
| 0.0 | 0.6 | GO:0070986 | left/right axis specification(GO:0070986) |
| 0.0 | 0.3 | GO:0090646 | mitochondrial tRNA processing(GO:0090646) |
| 0.0 | 0.2 | GO:2000467 | positive regulation of glycogen (starch) synthase activity(GO:2000467) |
| 0.0 | 0.0 | GO:0055095 | lipoprotein particle mediated signaling(GO:0055095) low-density lipoprotein particle mediated signaling(GO:0055096) |
| 0.0 | 0.3 | GO:0018095 | protein polyglutamylation(GO:0018095) |
| 0.0 | 1.8 | GO:0031102 | neuron projection regeneration(GO:0031102) |
| 0.0 | 1.2 | GO:0000083 | regulation of transcription involved in G1/S transition of mitotic cell cycle(GO:0000083) |
| 0.0 | 1.1 | GO:1901685 | glutathione derivative metabolic process(GO:1901685) glutathione derivative biosynthetic process(GO:1901687) |
| 0.0 | 0.4 | GO:0042340 | keratan sulfate catabolic process(GO:0042340) |
| 0.0 | 0.1 | GO:0070980 | biphenyl catabolic process(GO:0070980) |
| 0.0 | 0.1 | GO:1901873 | regulation of post-translational protein modification(GO:1901873) |
| 0.0 | 0.1 | GO:0051552 | flavone metabolic process(GO:0051552) |
| 0.0 | 0.1 | GO:0031291 | Ran protein signal transduction(GO:0031291) |
| 0.0 | 0.3 | GO:0032074 | negative regulation of nuclease activity(GO:0032074) |
| 0.0 | 0.1 | GO:0006668 | sphinganine-1-phosphate metabolic process(GO:0006668) |
| 0.0 | 0.2 | GO:0031914 | negative regulation of synaptic plasticity(GO:0031914) |
| 0.0 | 0.1 | GO:0002188 | translation reinitiation(GO:0002188) |
| 0.0 | 0.1 | GO:1903575 | cornified envelope assembly(GO:1903575) |
| 0.0 | 0.2 | GO:0006772 | thiamine metabolic process(GO:0006772) |
| 0.0 | 0.2 | GO:0043249 | erythrocyte maturation(GO:0043249) |
| 0.0 | 0.4 | GO:0035589 | G-protein coupled purinergic nucleotide receptor signaling pathway(GO:0035589) |
| 0.0 | 0.1 | GO:0051611 | negative regulation of neurotransmitter uptake(GO:0051581) serotonin uptake(GO:0051610) regulation of serotonin uptake(GO:0051611) negative regulation of serotonin uptake(GO:0051612) |
| 0.0 | 0.2 | GO:0001865 | NK T cell differentiation(GO:0001865) |
| 0.0 | 0.1 | GO:0006740 | NADPH regeneration(GO:0006740) |
| 0.0 | 0.2 | GO:0071688 | striated muscle myosin thick filament assembly(GO:0071688) |
| 0.0 | 0.1 | GO:0051598 | meiotic recombination checkpoint(GO:0051598) |
| 0.0 | 0.2 | GO:0015014 | heparan sulfate proteoglycan biosynthetic process, polysaccharide chain biosynthetic process(GO:0015014) |
| 0.0 | 0.7 | GO:0000188 | inactivation of MAPK activity(GO:0000188) |
| 0.0 | 0.1 | GO:0097647 | calcitonin family receptor signaling pathway(GO:0097646) amylin receptor signaling pathway(GO:0097647) |
| 0.0 | 0.1 | GO:0003172 | primary heart field specification(GO:0003138) sinoatrial valve development(GO:0003172) sinoatrial valve morphogenesis(GO:0003185) |
| 0.0 | 0.1 | GO:0060467 | negative regulation of fertilization(GO:0060467) |
| 0.0 | 2.3 | GO:0006958 | complement activation, classical pathway(GO:0006958) |
| 0.0 | 0.1 | GO:0010286 | heat acclimation(GO:0010286) cellular heat acclimation(GO:0070370) |
| 0.0 | 0.2 | GO:0050713 | negative regulation of interleukin-1 beta secretion(GO:0050713) |
| 0.0 | 0.1 | GO:1904424 | regulation of GTP binding(GO:1904424) |
| 0.0 | 0.1 | GO:0030210 | heparin metabolic process(GO:0030202) heparin biosynthetic process(GO:0030210) |
| 0.0 | 0.1 | GO:0015705 | iodide transport(GO:0015705) |
| 0.0 | 0.2 | GO:0051775 | response to redox state(GO:0051775) |
| 0.0 | 0.1 | GO:0015801 | aromatic amino acid transport(GO:0015801) |
| 0.0 | 0.1 | GO:0070124 | mitochondrial translational initiation(GO:0070124) |
| 0.0 | 0.1 | GO:0060449 | bud elongation involved in lung branching(GO:0060449) positive regulation of stem cell population maintenance(GO:1902459) |
| 0.0 | 0.3 | GO:2000353 | positive regulation of endothelial cell apoptotic process(GO:2000353) |
| 0.0 | 0.2 | GO:0046784 | viral mRNA export from host cell nucleus(GO:0046784) |
| 0.0 | 0.1 | GO:0034627 | 'de novo' NAD biosynthetic process(GO:0034627) |
| 0.0 | 0.1 | GO:0043116 | negative regulation of vascular permeability(GO:0043116) |
| 0.0 | 0.0 | GO:0035948 | positive regulation of gluconeogenesis by positive regulation of transcription from RNA polymerase II promoter(GO:0035948) |
| 0.0 | 0.1 | GO:0038007 | netrin-activated signaling pathway(GO:0038007) |
| 0.0 | 0.4 | GO:0000042 | protein targeting to Golgi(GO:0000042) |
| 0.0 | 0.1 | GO:0043152 | induction of bacterial agglutination(GO:0043152) |
| 0.0 | 0.1 | GO:0060287 | epithelial cilium movement involved in determination of left/right asymmetry(GO:0060287) |
| 0.0 | 0.0 | GO:0042732 | D-xylose metabolic process(GO:0042732) |
| 0.0 | 0.1 | GO:0071896 | protein localization to adherens junction(GO:0071896) |
| 0.0 | 0.3 | GO:0001556 | oocyte maturation(GO:0001556) |
| 0.0 | 0.8 | GO:0006687 | glycosphingolipid metabolic process(GO:0006687) |
Gene overrepresentation in cellular component category:
| Log-likelihood per target | Total log-likelihood | Term | Description |
|---|---|---|---|
| 0.2 | 5.5 | GO:0008074 | guanylate cyclase complex, soluble(GO:0008074) |
| 0.2 | 0.7 | GO:0034673 | inhibin-betaglycan-ActRII complex(GO:0034673) |
| 0.2 | 1.0 | GO:1990131 | Gtr1-Gtr2 GTPase complex(GO:1990131) |
| 0.1 | 0.8 | GO:0031232 | extrinsic component of external side of plasma membrane(GO:0031232) |
| 0.1 | 0.6 | GO:0031211 | serine C-palmitoyltransferase complex(GO:0017059) endoplasmic reticulum palmitoyltransferase complex(GO:0031211) |
| 0.1 | 0.2 | GO:0097598 | sperm cytoplasmic droplet(GO:0097598) |
| 0.1 | 1.5 | GO:0005952 | cAMP-dependent protein kinase complex(GO:0005952) |
| 0.1 | 0.3 | GO:1990357 | terminal web(GO:1990357) |
| 0.0 | 0.3 | GO:0030678 | mitochondrial ribonuclease P complex(GO:0030678) |
| 0.0 | 0.1 | GO:0097224 | sperm connecting piece(GO:0097224) |
| 0.0 | 0.2 | GO:0042406 | extrinsic component of endoplasmic reticulum membrane(GO:0042406) |
| 0.0 | 0.2 | GO:0044305 | calyx of Held(GO:0044305) |
| 0.0 | 0.1 | GO:0071149 | TEAD-2-YAP complex(GO:0071149) |
| 0.0 | 0.1 | GO:0000806 | Y chromosome(GO:0000806) |
| 0.0 | 0.1 | GO:0097232 | lamellar body membrane(GO:0097232) alveolar lamellar body membrane(GO:0097233) |
| 0.0 | 0.1 | GO:0033150 | cytoskeletal calyx(GO:0033150) |
| 0.0 | 1.0 | GO:0044322 | endoplasmic reticulum quality control compartment(GO:0044322) |
| 0.0 | 0.4 | GO:0031209 | SCAR complex(GO:0031209) |
| 0.0 | 0.8 | GO:0031307 | integral component of mitochondrial outer membrane(GO:0031307) |
| 0.0 | 0.9 | GO:0031092 | platelet alpha granule membrane(GO:0031092) |
| 0.0 | 0.4 | GO:0005687 | U4 snRNP(GO:0005687) |
| 0.0 | 0.2 | GO:0031314 | extrinsic component of mitochondrial inner membrane(GO:0031314) |
| 0.0 | 0.2 | GO:0043240 | Fanconi anaemia nuclear complex(GO:0043240) |
| 0.0 | 0.1 | GO:0030485 | smooth muscle contractile fiber(GO:0030485) |
| 0.0 | 0.2 | GO:0043541 | UDP-N-acetylglucosamine transferase complex(GO:0043541) |
| 0.0 | 0.9 | GO:0005605 | basal lamina(GO:0005605) |
| 0.0 | 0.9 | GO:0030140 | trans-Golgi network transport vesicle(GO:0030140) |
| 0.0 | 0.5 | GO:0071564 | npBAF complex(GO:0071564) |
| 0.0 | 1.0 | GO:0005720 | nuclear heterochromatin(GO:0005720) |
| 0.0 | 0.2 | GO:0000347 | THO complex(GO:0000347) THO complex part of transcription export complex(GO:0000445) |
| 0.0 | 0.2 | GO:0000788 | nuclear nucleosome(GO:0000788) |
| 0.0 | 0.3 | GO:0031597 | cytosolic proteasome complex(GO:0031597) |
| 0.0 | 0.4 | GO:0032982 | myosin filament(GO:0032982) |
| 0.0 | 0.3 | GO:0034663 | endoplasmic reticulum chaperone complex(GO:0034663) |
| 0.0 | 1.4 | GO:0005604 | basement membrane(GO:0005604) |
| 0.0 | 0.1 | GO:0000221 | vacuolar proton-transporting V-type ATPase, V1 domain(GO:0000221) |
| 0.0 | 0.2 | GO:0000164 | protein phosphatase type 1 complex(GO:0000164) |
| 0.0 | 0.6 | GO:0042571 | immunoglobulin complex, circulating(GO:0042571) |
| 0.0 | 0.1 | GO:0000322 | storage vacuole(GO:0000322) |
| 0.0 | 0.1 | GO:0000444 | MIS12/MIND type complex(GO:0000444) |
| 0.0 | 0.0 | GO:0071006 | U2-type catalytic step 1 spliceosome(GO:0071006) |
| 0.0 | 0.1 | GO:0097025 | MPP7-DLG1-LIN7 complex(GO:0097025) |
| 0.0 | 0.3 | GO:0016281 | eukaryotic translation initiation factor 4F complex(GO:0016281) |
| 0.0 | 0.1 | GO:0071986 | Ragulator complex(GO:0071986) |
| 0.0 | 0.3 | GO:0030992 | intraciliary transport particle B(GO:0030992) |
| 0.0 | 1.0 | GO:0031903 | peroxisomal membrane(GO:0005778) microbody membrane(GO:0031903) |
| 0.0 | 0.1 | GO:0044326 | dendritic spine neck(GO:0044326) |
Gene overrepresentation in molecular function category:
| Log-likelihood per target | Total log-likelihood | Term | Description |
|---|---|---|---|
| 0.3 | 1.3 | GO:0019770 | IgG receptor activity(GO:0019770) |
| 0.3 | 0.9 | GO:0032767 | copper-dependent protein binding(GO:0032767) |
| 0.2 | 1.1 | GO:0052740 | 1-acyl-2-lysophosphatidylserine acylhydrolase activity(GO:0052740) |
| 0.2 | 1.5 | GO:0001665 | alpha-N-acetylgalactosaminide alpha-2,6-sialyltransferase activity(GO:0001665) |
| 0.2 | 5.5 | GO:0004383 | guanylate cyclase activity(GO:0004383) |
| 0.2 | 0.6 | GO:0047023 | androsterone dehydrogenase activity(GO:0047023) indanol dehydrogenase activity(GO:0047718) |
| 0.1 | 0.6 | GO:0005477 | pyruvate secondary active transmembrane transporter activity(GO:0005477) |
| 0.1 | 0.7 | GO:0060961 | phospholipase D inhibitor activity(GO:0060961) |
| 0.1 | 0.6 | GO:0004758 | serine C-palmitoyltransferase activity(GO:0004758) C-palmitoyltransferase activity(GO:0016454) |
| 0.1 | 0.5 | GO:0004031 | aldehyde oxidase activity(GO:0004031) |
| 0.1 | 0.8 | GO:0019834 | phospholipase A2 inhibitor activity(GO:0019834) |
| 0.1 | 0.3 | GO:0004797 | deoxycytidine kinase activity(GO:0004137) thymidine kinase activity(GO:0004797) |
| 0.1 | 0.3 | GO:0005174 | CD40 receptor binding(GO:0005174) |
| 0.1 | 1.2 | GO:0039706 | co-receptor binding(GO:0039706) |
| 0.1 | 0.6 | GO:0048101 | calcium- and calmodulin-regulated 3',5'-cyclic-GMP phosphodiesterase activity(GO:0048101) |
| 0.1 | 1.5 | GO:0004691 | cAMP-dependent protein kinase activity(GO:0004691) |
| 0.1 | 1.7 | GO:0033038 | bitter taste receptor activity(GO:0033038) |
| 0.1 | 0.7 | GO:0005114 | type II transforming growth factor beta receptor binding(GO:0005114) |
| 0.1 | 0.2 | GO:0051996 | farnesyl-diphosphate farnesyltransferase activity(GO:0004310) squalene synthase activity(GO:0051996) |
| 0.1 | 0.2 | GO:1904492 | Ac-Asp-Glu binding(GO:1904492) tetrahydrofolyl-poly(glutamate) polymer binding(GO:1904493) |
| 0.1 | 0.6 | GO:0004571 | mannosyl-oligosaccharide 1,2-alpha-mannosidase activity(GO:0004571) |
| 0.1 | 0.2 | GO:0047273 | galactosylgalactosylglucosylceramide beta-D-acetylgalactosaminyltransferase activity(GO:0047273) |
| 0.1 | 0.3 | GO:0045029 | UDP-activated nucleotide receptor activity(GO:0045029) |
| 0.1 | 0.3 | GO:0071074 | eukaryotic initiation factor eIF2 binding(GO:0071074) |
| 0.0 | 0.1 | GO:0033754 | indoleamine 2,3-dioxygenase activity(GO:0033754) |
| 0.0 | 0.2 | GO:0004802 | transketolase activity(GO:0004802) |
| 0.0 | 0.1 | GO:0015173 | aromatic amino acid transmembrane transporter activity(GO:0015173) |
| 0.0 | 0.2 | GO:0050509 | N-acetylglucosaminyl-proteoglycan 4-beta-glucuronosyltransferase activity(GO:0050509) |
| 0.0 | 0.7 | GO:0008140 | cAMP response element binding protein binding(GO:0008140) |
| 0.0 | 0.6 | GO:0017017 | MAP kinase tyrosine/serine/threonine phosphatase activity(GO:0017017) |
| 0.0 | 0.2 | GO:0070892 | lipoteichoic acid receptor activity(GO:0070892) |
| 0.0 | 0.2 | GO:0032089 | NACHT domain binding(GO:0032089) |
| 0.0 | 0.4 | GO:0004726 | non-membrane spanning protein tyrosine phosphatase activity(GO:0004726) |
| 0.0 | 0.3 | GO:0001011 | transcription factor activity, sequence-specific DNA binding, RNA polymerase recruiting(GO:0001011) transcription factor activity, TFIIB-class binding(GO:0001087) |
| 0.0 | 0.3 | GO:0046790 | virion binding(GO:0046790) |
| 0.0 | 0.1 | GO:0016936 | galactoside binding(GO:0016936) |
| 0.0 | 0.1 | GO:0008746 | NAD(P)+ transhydrogenase activity(GO:0008746) oxidoreductase activity, acting on NAD(P)H, NAD(P) as acceptor(GO:0016652) |
| 0.0 | 0.2 | GO:0005502 | 11-cis retinal binding(GO:0005502) |
| 0.0 | 0.1 | GO:0008273 | calcium, potassium:sodium antiporter activity(GO:0008273) |
| 0.0 | 1.1 | GO:0004364 | glutathione transferase activity(GO:0004364) |
| 0.0 | 0.2 | GO:0036402 | proteasome-activating ATPase activity(GO:0036402) |
| 0.0 | 0.2 | GO:0004969 | histamine receptor activity(GO:0004969) |
| 0.0 | 0.4 | GO:0004653 | polypeptide N-acetylgalactosaminyltransferase activity(GO:0004653) |
| 0.0 | 0.5 | GO:0004708 | MAP kinase kinase activity(GO:0004708) |
| 0.0 | 0.5 | GO:0097493 | structural molecule activity conferring elasticity(GO:0097493) |
| 0.0 | 1.3 | GO:0005044 | scavenger receptor activity(GO:0005044) |
| 0.0 | 0.3 | GO:0004526 | ribonuclease P activity(GO:0004526) |
| 0.0 | 0.1 | GO:0008379 | thioredoxin peroxidase activity(GO:0008379) |
| 0.0 | 0.2 | GO:0050291 | sphingosine N-acyltransferase activity(GO:0050291) |
| 0.0 | 0.1 | GO:0042030 | ATPase inhibitor activity(GO:0042030) |
| 0.0 | 0.3 | GO:0047372 | acylglycerol lipase activity(GO:0047372) |
| 0.0 | 0.3 | GO:0016500 | protein-hormone receptor activity(GO:0016500) |
| 0.0 | 0.2 | GO:0022821 | potassium:proton antiporter activity(GO:0015386) potassium ion antiporter activity(GO:0022821) |
| 0.0 | 0.1 | GO:0005087 | Ran guanyl-nucleotide exchange factor activity(GO:0005087) |
| 0.0 | 0.0 | GO:0052591 | sn-glycerol-3-phosphate:ubiquinone oxidoreductase activity(GO:0052590) sn-glycerol-3-phosphate:ubiquinone-8 oxidoreductase activity(GO:0052591) |
| 0.0 | 0.3 | GO:0005527 | macrolide binding(GO:0005527) FK506 binding(GO:0005528) |
| 0.0 | 0.1 | GO:0032027 | myosin light chain binding(GO:0032027) |
| 0.0 | 0.6 | GO:0034987 | immunoglobulin receptor binding(GO:0034987) |
| 0.0 | 0.3 | GO:0000339 | RNA cap binding(GO:0000339) |
| 0.0 | 1.1 | GO:0005201 | extracellular matrix structural constituent(GO:0005201) |
| 0.0 | 0.0 | GO:0004877 | complement component C4b receptor activity(GO:0001861) complement component C3b receptor activity(GO:0004877) |
Gene overrepresentation in curated gene sets: canonical pathways category:
| Log-likelihood per target | Total log-likelihood | Term | Description |
|---|---|---|---|
| 0.0 | 0.5 | PID P38 GAMMA DELTA PATHWAY | Signaling mediated by p38-gamma and p38-delta |
| 0.0 | 1.8 | PID FOXM1 PATHWAY | FOXM1 transcription factor network |
| 0.0 | 1.2 | PID IL3 PATHWAY | IL3-mediated signaling events |
| 0.0 | 0.2 | SA G2 AND M PHASES | Cdc25 activates the cdc2/cyclin B complex to induce the G2/M transition. |
| 0.0 | 2.2 | PID E2F PATHWAY | E2F transcription factor network |
| 0.0 | 0.5 | PID TGFBR PATHWAY | TGF-beta receptor signaling |
| 0.0 | 0.9 | PID TCR CALCIUM PATHWAY | Calcium signaling in the CD4+ TCR pathway |
| 0.0 | 0.2 | PID TCR RAS PATHWAY | Ras signaling in the CD4+ TCR pathway |
| 0.0 | 0.4 | SIG IL4RECEPTOR IN B LYPHOCYTES | Genes related to IL4 rceptor signaling in B lymphocytes |
| 0.0 | 0.7 | ST PHOSPHOINOSITIDE 3 KINASE PATHWAY | PI3K Pathway |
| 0.0 | 0.8 | PID SHP2 PATHWAY | SHP2 signaling |
| 0.0 | 0.9 | PID ANGIOPOIETIN RECEPTOR PATHWAY | Angiopoietin receptor Tie2-mediated signaling |
| 0.0 | 1.3 | PID TRKR PATHWAY | Neurotrophic factor-mediated Trk receptor signaling |
| 0.0 | 0.7 | PID ALPHA SYNUCLEIN PATHWAY | Alpha-synuclein signaling |
| 0.0 | 1.1 | PID CASPASE PATHWAY | Caspase cascade in apoptosis |
| 0.0 | 0.7 | PID MTOR 4PATHWAY | mTOR signaling pathway |
Gene overrepresentation in curated gene sets: REACTOME pathways category:
| Log-likelihood per target | Total log-likelihood | Term | Description |
|---|---|---|---|
| 0.1 | 6.2 | REACTOME NITRIC OXIDE STIMULATES GUANYLATE CYCLASE | Genes involved in Nitric oxide stimulates guanylate cyclase |
| 0.1 | 1.1 | REACTOME ACYL CHAIN REMODELLING OF PS | Genes involved in Acyl chain remodelling of PS |
| 0.1 | 1.0 | REACTOME CALNEXIN CALRETICULIN CYCLE | Genes involved in Calnexin/calreticulin cycle |
| 0.1 | 1.6 | REACTOME TERMINATION OF O GLYCAN BIOSYNTHESIS | Genes involved in Termination of O-glycan biosynthesis |
| 0.0 | 1.4 | REACTOME HORMONE SENSITIVE LIPASE HSL MEDIATED TRIACYLGLYCEROL HYDROLYSIS | Genes involved in Hormone-sensitive lipase (HSL)-mediated triacylglycerol hydrolysis |
| 0.0 | 0.7 | REACTOME BILE SALT AND ORGANIC ANION SLC TRANSPORTERS | Genes involved in Bile salt and organic anion SLC transporters |
| 0.0 | 0.5 | REACTOME ETHANOL OXIDATION | Genes involved in Ethanol oxidation |
| 0.0 | 1.0 | REACTOME DCC MEDIATED ATTRACTIVE SIGNALING | Genes involved in DCC mediated attractive signaling |
| 0.0 | 0.6 | REACTOME G2 M DNA DAMAGE CHECKPOINT | Genes involved in G2/M DNA damage checkpoint |
| 0.0 | 0.8 | REACTOME REGULATION OF COMPLEMENT CASCADE | Genes involved in Regulation of Complement cascade |
| 0.0 | 0.4 | REACTOME KERATAN SULFATE DEGRADATION | Genes involved in Keratan sulfate degradation |
| 0.0 | 0.5 | REACTOME P2Y RECEPTORS | Genes involved in P2Y receptors |
| 0.0 | 1.1 | REACTOME GLUTATHIONE CONJUGATION | Genes involved in Glutathione conjugation |
| 0.0 | 0.6 | REACTOME HS GAG DEGRADATION | Genes involved in HS-GAG degradation |
| 0.0 | 0.9 | REACTOME SPHINGOLIPID DE NOVO BIOSYNTHESIS | Genes involved in Sphingolipid de novo biosynthesis |
| 0.0 | 0.4 | REACTOME SOS MEDIATED SIGNALLING | Genes involved in SOS-mediated signalling |
| 0.0 | 0.2 | REACTOME SIGNALLING TO P38 VIA RIT AND RIN | Genes involved in Signalling to p38 via RIT and RIN |
| 0.0 | 1.5 | REACTOME APOPTOTIC CLEAVAGE OF CELLULAR PROTEINS | Genes involved in Apoptotic cleavage of cellular proteins |
| 0.0 | 0.3 | REACTOME TIE2 SIGNALING | Genes involved in Tie2 Signaling |
| 0.0 | 0.8 | REACTOME MYOGENESIS | Genes involved in Myogenesis |
| 0.0 | 1.2 | REACTOME AMYLOIDS | Genes involved in Amyloids |
| 0.0 | 0.2 | REACTOME ACTIVATION OF CHAPERONE GENES BY ATF6 ALPHA | Genes involved in Activation of Chaperone Genes by ATF6-alpha |
| 0.0 | 0.4 | REACTOME CELL EXTRACELLULAR MATRIX INTERACTIONS | Genes involved in Cell-extracellular matrix interactions |
| 0.0 | 0.8 | REACTOME ION TRANSPORT BY P TYPE ATPASES | Genes involved in Ion transport by P-type ATPases |
| 0.0 | 0.2 | REACTOME OPSINS | Genes involved in Opsins |
| 0.0 | 0.3 | REACTOME G1 S SPECIFIC TRANSCRIPTION | Genes involved in G1/S-Specific Transcription |
| 0.0 | 0.3 | REACTOME REGULATION OF INSULIN LIKE GROWTH FACTOR IGF ACTIVITY BY INSULIN LIKE GROWTH FACTOR BINDING PROTEINS IGFBPS | Genes involved in Regulation of Insulin-like Growth Factor (IGF) Activity by Insulin-like Growth Factor Binding Proteins (IGFBPs) |
| 0.0 | 0.2 | REACTOME FANCONI ANEMIA PATHWAY | Genes involved in Fanconi Anemia pathway |