Motif ID: MTF1.p2

Z-value: 1.886
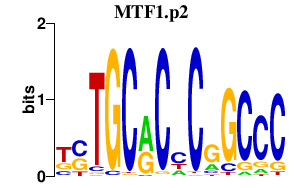

Transcription factors associated with MTF1.p2:

Gene SymbolEntrez IDGene Name
MTF1 4520 metal-regulatory transcription factor 1


Activity profile for motif MTF1.p2.

activity profile for motif MTF1.p2


Sorted Z-values histogram for motif MTF1.p2

Sorted Z-values for motif MTF1.p2


Network of associatons between targets according to the STRING database.


First level regulatory network of MTF1.p2

PNG image of the network

In order to view interactive SVG image please either update your browser to latest version or install SVG plugin.


View svg image
View png image


Top targets:


Showing 1 to 20 of 200 entries
PromoterScoreRefseqGene SymbolGene Name
chr19_+_1704661 4.896 NM_001080488
ONECUT3
one cut homeobox 3
chr16_-_87535106 3.214 NM_175931
CBFA2T3
core-binding factor, runt domain, alpha subunit 2; translocated to, 3
chr20_-_60228665 2.964 NM_007232
HRH3
histamine receptor H3
chr14_+_105012106 2.944 NM_001312
CRIP2
cysteine-rich protein 2
chr17_+_72880967 2.651 SEPT9
septin 9
chr2_-_128792515 2.559 NM_004807
HS6ST1
heparan sulfate 6-O-sulfotransferase 1
chr2_+_232281491 2.533 PTMA
prothymosin, alpha
chr2_+_120820140 2.518 NM_002193
INHBB
inhibin, beta B
chr6_+_41622267 2.341 FOXP4
forkhead box P4
chr2_+_241156776 2.286 NM_018226
RNPEPL1
arginyl aminopeptidase (aminopeptidase B)-like 1
chr9_+_125813849 2.284 LHX2
LIM homeobox 2
chr12_+_130878870 2.097 NM_016155
MMP17
matrix metallopeptidase 17 (membrane-inserted)
chr16_+_1143738 2.006 CACNA1H
calcium channel, voltage-dependent, T type, alpha 1H subunit
chr20_-_60484420 1.978 NM_080473
GATA5
GATA binding protein 5
chr12_+_55896844 1.939 NM_007224
NXPH4
neurexophilin 4
chr7_+_1239078 1.917 NM_001080461
UNCX
UNC homeobox
chr16_+_49139694 1.894 NM_033119
NKD1
naked cuticle homolog 1 (Drosophila)
chr1_-_6402467 1.866 NM_019089
HES2
hairy and enhancer of split 2 (Drosophila)
chr11_+_119887630 1.862 LOC100293636
GRIK4
hypothetical protein LOC100293636
glutamate receptor, ionotropic, kainate 4
chr1_+_2149993 1.803 NM_003036
SKI
v-ski sarcoma viral oncogene homolog (avian)

Gene Ontology Analysis

Gene overrepresentation in process category:

Showing 1 to 20 of 164 entries
enrichment   p-value GO term description
2.40 2.01e-03 GO:0050768 negative regulation of neurogenesis
2.28 1.05e-03 GO:0010721 negative regulation of cell development
2.14 5.46e-03 GO:0050769 positive regulation of neurogenesis
2.11 3.14e-04 GO:0010720 positive regulation of cell development
2.09 1.15e-02 GO:0008016 regulation of heart contraction
1.90 9.60e-05 GO:0030155 regulation of cell adhesion
1.90 4.76e-03 GO:0010769 regulation of cell morphogenesis involved in differentiation
1.88 6.35e-03 GO:0022604 regulation of cell morphogenesis
1.83 2.05e-06 GO:0050767 regulation of neurogenesis
1.83 4.89e-03 GO:0045165 cell fate commitment
1.83 1.21e-02 GO:0016055 Wnt receptor signaling pathway
1.82 4.22e-04 GO:0014070 response to organic cyclic compound
1.80 6.15e-08 GO:0060284 regulation of cell development
1.80 3.53e-02 GO:0030111 regulation of Wnt receptor signaling pathway
1.77 3.36e-06 GO:0051960 regulation of nervous system development
1.77 4.08e-03 GO:0030900 forebrain development
1.76 1.64e-05 GO:0045596 negative regulation of cell differentiation
1.75 2.19e-03 GO:0032582 negative regulation of gene-specific transcription
1.74 6.29e-07 GO:0007411 axon guidance
1.73 2.23e-03 GO:0045664 regulation of neuron differentiation

Gene overrepresentation in compartment category:

Showing 1 to 20 of 30 entries
enrichment   p-value GO term description
2.32 1.91e-02 GO:0017053 transcriptional repressor complex
1.83 2.87e-02 GO:0005925 focal adhesion
1.68 1.90e-02 GO:0005912 adherens junction
1.66 6.83e-03 GO:0044297 cell body
1.65 1.06e-02 GO:0043025 neuronal cell body
1.63 2.73e-02 GO:0070161 anchoring junction
1.53 6.05e-05 GO:0045202 synapse
1.50 8.35e-03 GO:0044456 synapse part
1.46 2.24e-02 GO:0005578 proteinaceous extracellular matrix
1.44 1.07e-02 GO:0031012 extracellular matrix
1.40 2.82e-02 GO:0043005 neuron projection
1.32 3.60e-02 GO:0030054 cell junction
1.21 2.77e-02 GO:0005654 nucleoplasm
1.20 3.41e-03 GO:0031981 nuclear lumen
1.17 8.47e-03 GO:0044459 plasma membrane part
1.17 1.59e-02 GO:0044428 nuclear part
1.15 4.52e-02 GO:0070013 intracellular organelle lumen
1.11 9.17e-04 GO:0044422 organelle part
1.10 1.74e-03 GO:0044446 intracellular organelle part
1.09 8.33e-06 GO:0005737 cytoplasm

Gene overrepresentation in function category:

Showing 1 to 20 of 27 entries
enrichment   p-value GO term description
1.91 2.78e-02 GO:0003704 specific RNA polymerase II transcription factor activity
1.73 1.63e-02 GO:0022843 voltage-gated cation channel activity
1.71 1.45e-03 GO:0005244 voltage-gated ion channel activity
1.71 1.45e-03 GO:0022832 voltage-gated channel activity
1.67 1.79e-03 GO:0000975 regulatory region DNA binding
1.67 1.79e-03 GO:0001067 regulatory region nucleic acid binding
1.67 1.79e-03 GO:0044212 transcription regulatory region DNA binding
1.67 3.10e-03 GO:0010843 promoter binding
1.59 2.69e-04 GO:0016564 transcription repressor activity
1.54 7.72e-03 GO:0005261 cation channel activity
1.52 2.20e-08 GO:0043565 sequence-specific DNA binding
1.52 4.09e-03 GO:0022836 gated channel activity
1.47 2.89e-02 GO:0016563 transcription activator activity
1.45 1.60e-09 GO:0001071 nucleic acid binding transcription factor activity
1.45 1.60e-09 GO:0003700 sequence-specific DNA binding transcription factor activity
1.43 1.16e-04 GO:0004672 protein kinase activity
1.41 3.88e-05 GO:0016773 phosphotransferase activity, alcohol group as acceptor
1.41 2.91e-02 GO:0022838 substrate-specific channel activity
1.41 3.03e-02 GO:0015267 channel activity
1.40 2.22e-02 GO:0004674 protein serine/threonine kinase activity