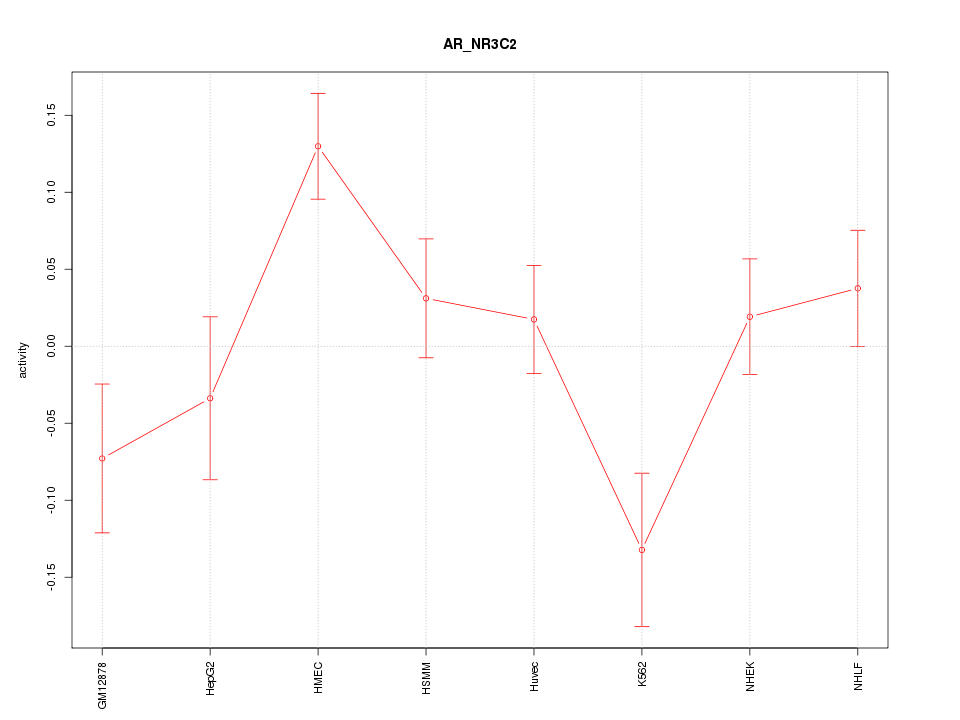
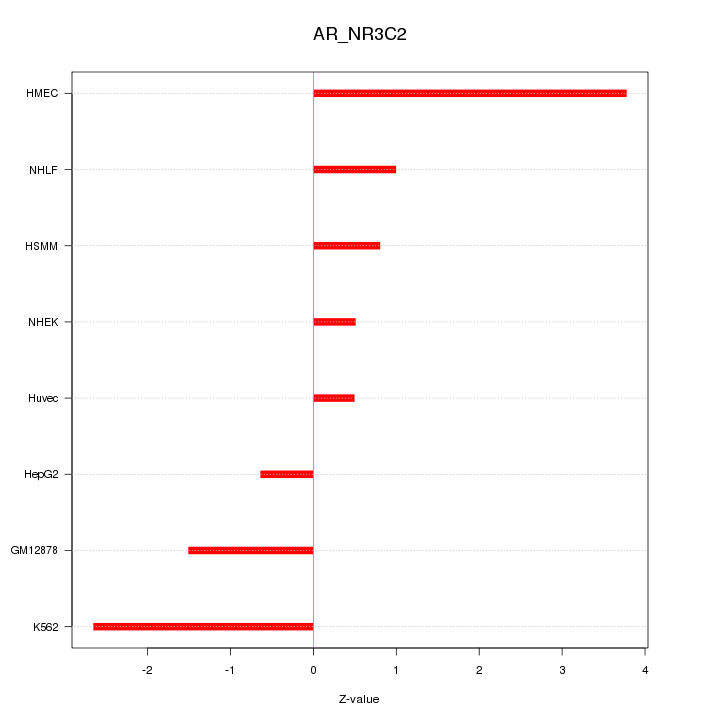
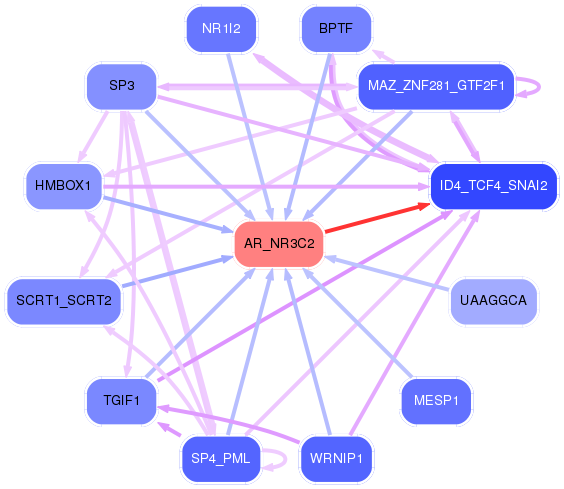
Motif ID: AR_NR3C2
Z-value: 1.808
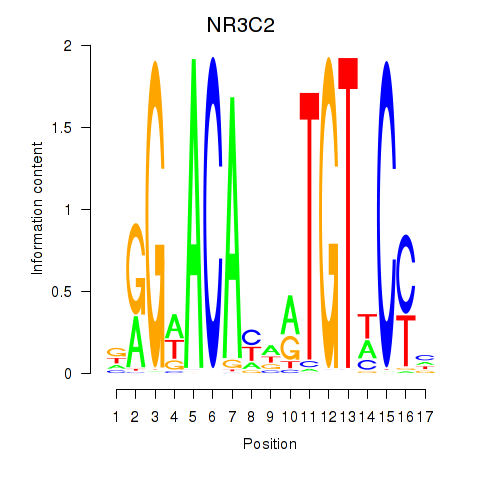
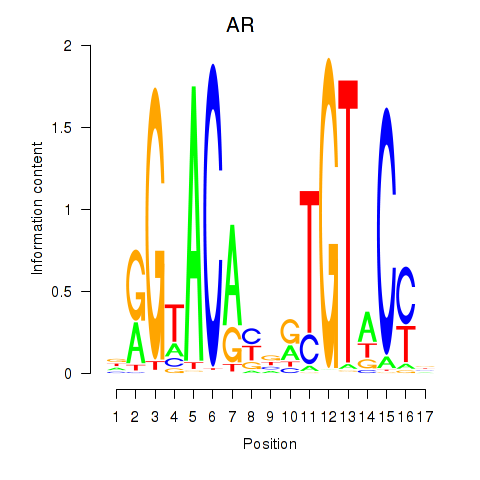
Transcription factors associated with AR_NR3C2:
| Gene Symbol | Entrez ID | Gene Name |
|---|---|---|
| AR | ENSG00000169083.11 | AR |
| NR3C2 | ENSG00000151623.10 | NR3C2 |

Top targets:
Gene overrepresentation in biological_process category:
| Log-likelihood per target | Total log-likelihood | Term | Description |
|---|---|---|---|
| 4.7 | 14.1 | GO:0010273 | detoxification of copper ion(GO:0010273) stress response to copper ion(GO:1990169) |
| 1.7 | 10.0 | GO:0007499 | ectoderm and mesoderm interaction(GO:0007499) |
| 0.3 | 5.6 | GO:0032400 | melanosome localization(GO:0032400) |
| 0.2 | 1.0 | GO:0034201 | response to oleic acid(GO:0034201) |
| 0.1 | 0.8 | GO:0010842 | retina layer formation(GO:0010842) |
| 0.1 | 0.3 | GO:0010936 | negative regulation of macrophage cytokine production(GO:0010936) |
| 0.1 | 4.9 | GO:0045740 | positive regulation of DNA replication(GO:0045740) |
| 0.1 | 0.5 | GO:0006264 | mitochondrial DNA replication(GO:0006264) |
| 0.0 | 7.2 | GO:0007160 | cell-matrix adhesion(GO:0007160) |
| 0.0 | 5.4 | GO:0010038 | response to metal ion(GO:0010038) |
| 0.0 | 0.1 | GO:0050668 | positive regulation of sulfur amino acid metabolic process(GO:0031337) positive regulation of cellular amino acid metabolic process(GO:0045764) negative regulation of catecholamine metabolic process(GO:0045914) negative regulation of dopamine metabolic process(GO:0045963) positive regulation of homocysteine metabolic process(GO:0050668) |
| 0.0 | 0.6 | GO:0030512 | negative regulation of transforming growth factor beta receptor signaling pathway(GO:0030512) negative regulation of cellular response to transforming growth factor beta stimulus(GO:1903845) |
| 0.0 | 0.3 | GO:0033540 | fatty acid beta-oxidation using acyl-CoA oxidase(GO:0033540) |
| 0.0 | 0.6 | GO:0006635 | fatty acid beta-oxidation(GO:0006635) |
| 0.0 | 0.4 | GO:0045646 | regulation of erythrocyte differentiation(GO:0045646) |
| 0.0 | 0.1 | GO:0051026 | chiasma assembly(GO:0051026) |
Gene overrepresentation in cellular_component category:
| Log-likelihood per target | Total log-likelihood | Term | Description |
|---|---|---|---|
| 1.0 | 7.6 | GO:0016012 | sarcoglycan complex(GO:0016012) |
| 0.1 | 0.3 | GO:0005602 | complement component C1 complex(GO:0005602) |
| 0.0 | 0.5 | GO:0001527 | microfibril(GO:0001527) |
| 0.0 | 0.5 | GO:0046658 | anchored component of plasma membrane(GO:0046658) |
| 0.0 | 0.8 | GO:0005913 | cell-cell adherens junction(GO:0005913) |
| 0.0 | 5.6 | GO:0015629 | actin cytoskeleton(GO:0015629) |
| 0.0 | 0.3 | GO:0005776 | autophagosome(GO:0005776) |
Gene overrepresentation in molecular_function category:
| Log-likelihood per target | Total log-likelihood | Term | Description |
|---|---|---|---|
| 0.8 | 11.6 | GO:0046870 | cadmium ion binding(GO:0046870) |
| 0.6 | 5.6 | GO:0031489 | myosin V binding(GO:0031489) |
| 0.2 | 0.6 | GO:0008670 | 2,4-dienoyl-CoA reductase (NADPH) activity(GO:0008670) |
| 0.2 | 0.5 | GO:0004797 | thymidine kinase activity(GO:0004797) |
| 0.1 | 0.5 | GO:0004597 | peptide-aspartate beta-dioxygenase activity(GO:0004597) |
| 0.1 | 0.3 | GO:0016402 | pristanoyl-CoA oxidase activity(GO:0016402) |
| 0.1 | 1.0 | GO:0047760 | butyrate-CoA ligase activity(GO:0047760) |
| 0.0 | 0.2 | GO:0016167 | glial cell-derived neurotrophic factor receptor activity(GO:0016167) |
| 0.0 | 0.5 | GO:0032393 | MHC class I receptor activity(GO:0032393) |
| 0.0 | 0.1 | GO:0004607 | phosphatidylcholine-sterol O-acyltransferase activity(GO:0004607) |
| 0.0 | 0.8 | GO:0005001 | transmembrane receptor protein tyrosine phosphatase activity(GO:0005001) transmembrane receptor protein phosphatase activity(GO:0019198) |
| 0.0 | 4.5 | GO:0005125 | cytokine activity(GO:0005125) |
| 0.0 | 0.4 | GO:0004709 | MAP kinase kinase kinase activity(GO:0004709) |
|
|
|
|