Motif ID: GZF1

Z-value: 1.111
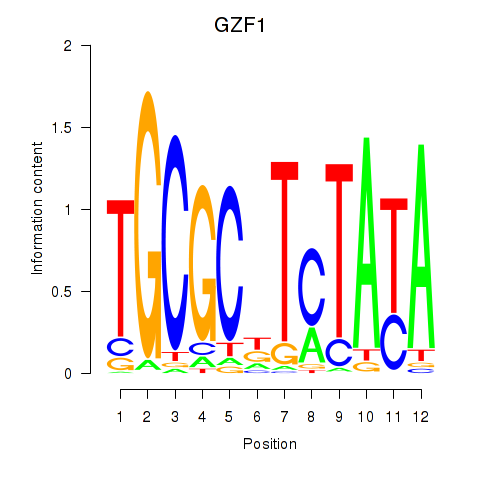

Transcription factors associated with GZF1:

Gene SymbolEntrez IDGene Name
GZF1 ENSG00000125812.11 GZF1


Activity profile for motif GZF1.

activity profile for motif GZF1


Sorted Z-values histogram for motif GZF1

Sorted Z-values for motif GZF1


Network of associatons between targets according to the STRING database.


First level regulatory network of GZF1

PNG image of the network

In order to view interactive SVG image please either update your browser to latest version or install SVG plugin.


View svg image
View png image


Top targets:


Promoter Score Refseq Gene Symbol Gene Name
chr14_-_52535712 3.117 ENST00000216286.5
ENST00000541773.1
NID2

nidogen 2 (osteonidogen)

chr3_-_87040233 2.121 ENST00000398399.2
VGLL3
vestigial like 3 (Drosophila)
chr3_-_114035026 1.784 ENST00000570269.1
RP11-553L6.5
RP11-553L6.5
chr18_-_53303123 1.676 ENST00000569357.1
ENST00000565124.1
ENST00000398339.1
TCF4


transcription factor 4


chr1_+_26606608 1.191 ENST00000319041.6
SH3BGRL3
SH3 domain binding glutamic acid-rich protein like 3
chr1_-_144995002 1.076 ENST00000369356.4
PDE4DIP
phosphodiesterase 4D interacting protein
chrX_+_54835493 1.017 ENST00000396224.1
MAGED2
melanoma antigen family D, 2
chr1_-_144994909 0.845 ENST00000369347.4
ENST00000369354.3
PDE4DIP

phosphodiesterase 4D interacting protein

chr1_-_144995074 0.831 ENST00000534536.1
PDE4DIP
phosphodiesterase 4D interacting protein
chr14_-_92413353 0.782 ENST00000556154.1
FBLN5
fibulin 5
chr10_-_126849588 0.764 ENST00000411419.2
CTBP2
C-terminal binding protein 2
chr10_-_126849068 0.751 ENST00000494626.2
ENST00000337195.5
CTBP2

C-terminal binding protein 2

chr14_-_92413727 0.701 ENST00000267620.10
FBLN5
fibulin 5
chr3_+_30647994 0.691 ENST00000295754.5
TGFBR2
transforming growth factor, beta receptor II (70/80kDa)
chr5_+_92919043 0.583 ENST00000327111.3
NR2F1
nuclear receptor subfamily 2, group F, member 1
chr3_+_30648066 0.565 ENST00000359013.4
TGFBR2
transforming growth factor, beta receptor II (70/80kDa)
chr14_+_101292445 0.531 ENST00000429159.2
ENST00000520714.1
ENST00000522771.2
ENST00000424076.3
ENST00000423456.1
ENST00000521404.1
ENST00000556736.1
ENST00000451743.2
ENST00000398518.2
ENST00000554639.1
ENST00000452120.2
ENST00000519709.1
ENST00000412736.2
MEG3


maternally expressed 3 (non-protein coding)


chr20_+_42086525 0.444 ENST00000244020.3
SRSF6
serine/arginine-rich splicing factor 6
chr9_+_96338647 0.409 ENST00000359246.4
PHF2
PHD finger protein 2
chr1_-_144994840 0.408 ENST00000369351.3
ENST00000369349.3
PDE4DIP

phosphodiesterase 4D interacting protein

chr1_-_226374373 0.392 ENST00000366812.5
ACBD3
acyl-CoA binding domain containing 3
chr7_-_27183263 0.328 ENST00000222726.3
HOXA5
homeobox A5
chrX_+_102883620 0.319 ENST00000372626.3
TCEAL1
transcription elongation factor A (SII)-like 1
chr12_+_107168418 0.304 ENST00000392839.2
ENST00000548914.1
ENST00000355478.2
ENST00000552619.1
ENST00000549643.1
RIC8B


RIC8 guanine nucleotide exchange factor B


chr1_-_32801825 0.275 ENST00000329421.7
MARCKSL1
MARCKS-like 1
chr9_+_96338860 0.233 ENST00000375376.4
PHF2
PHD finger protein 2
chr12_+_104458235 0.230 ENST00000229330.4
HCFC2
host cell factor C2
chr9_-_14308004 0.212 ENST00000493697.1
NFIB
nuclear factor I/B
chr9_+_131133598 0.160 ENST00000372853.4
ENST00000452446.1
ENST00000372850.1
ENST00000372847.1
URM1


ubiquitin related modifier 1


chr12_-_76478417 0.129 ENST00000552342.1
NAP1L1
nucleosome assembly protein 1-like 1
chr12_-_76478386 0.125 ENST00000535020.2
NAP1L1
nucleosome assembly protein 1-like 1
chr14_-_21979428 0.109 ENST00000538267.1
ENST00000298717.4
METTL3

methyltransferase like 3

chr10_+_89264625 0.099 ENST00000371996.4
ENST00000371994.4
MINPP1

multiple inositol-polyphosphate phosphatase 1

chr2_-_150444300 0.094 ENST00000303319.5
MMADHC
methylmalonic aciduria (cobalamin deficiency) cblD type, with homocystinuria
chr12_-_76478446 0.081 ENST00000393263.3
ENST00000548044.1
ENST00000547704.1
ENST00000431879.3
ENST00000549596.1
ENST00000550934.1
ENST00000551600.1
ENST00000547479.1
ENST00000547773.1
ENST00000544816.1
ENST00000542344.1
ENST00000548273.1
NAP1L1


nucleosome assembly protein 1-like 1


chr14_+_22293618 0.071 ENST00000390432.2
TRAV10
T cell receptor alpha variable 10
chr2_-_150444116 0.069 ENST00000428879.1
ENST00000422782.2
MMADHC

methylmalonic aciduria (cobalamin deficiency) cblD type, with homocystinuria

chr7_+_102004322 0.055 ENST00000496391.1
PRKRIP1
PRKR interacting protein 1 (IL11 inducible)
chr7_-_105029812 0.045 ENST00000482897.1
SRPK2
SRSF protein kinase 2
chr6_+_30524663 0.019 ENST00000376560.3
PRR3
proline rich 3
chr6_+_30525051 0.007 ENST00000376557.3
PRR3
proline rich 3

Gene Ontology Analysis

Gene overrepresentation in biological_process category:

Log-likelihood per target  Total log-likelihood Term Description
1.0 3.1 GO:0008218 bioluminescence(GO:0008218)
0.5 1.5 GO:2000121 regulation of removal of superoxide radicals(GO:2000121)
0.4 1.3 GO:0002514 B cell tolerance induction(GO:0002514) regulation of B cell tolerance induction(GO:0002661) positive regulation of B cell tolerance induction(GO:0002663)
0.2 0.6 GO:0061188 regulation of chromatin silencing at rDNA(GO:0061187) negative regulation of chromatin silencing at rDNA(GO:0061188)
0.1 0.5 GO:0034337 RNA folding(GO:0034337) DNA hypomethylation(GO:0044028) hypomethylation of CpG island(GO:0044029) regulation of DNA methylation(GO:0044030)
0.1 0.3 GO:0060574 trachea cartilage morphogenesis(GO:0060535) cartilage morphogenesis(GO:0060536) intestinal epithelial cell maturation(GO:0060574) intestinal epithelial cell development(GO:0060576)
0.1 1.5 GO:0050872 white fat cell differentiation(GO:0050872)
0.0 0.4 GO:0006376 mRNA splice site selection(GO:0006376)
0.0 1.2 GO:0045454 cell redox homeostasis(GO:0045454)
0.0 1.7 GO:0006367 transcription initiation from RNA polymerase II promoter(GO:0006367)
0.0 0.2 GO:0006400 tRNA modification(GO:0006400)
0.0 0.1 GO:0001510 RNA methylation(GO:0001510)

Gene overrepresentation in cellular_component category:

Log-likelihood per target  Total log-likelihood Term Description
0.5 1.5 GO:0071953 elastic fiber(GO:0071953)
0.2 1.3 GO:0070022 transforming growth factor beta receptor homodimeric complex(GO:0070022)
0.0 3.1 GO:0005604 basement membrane(GO:0005604)
0.0 0.3 GO:0005678 obsolete chromatin assembly complex(GO:0005678)
0.0 1.2 GO:0017053 transcriptional repressor complex(GO:0017053)
0.0 3.2 GO:0030016 myofibril(GO:0030016)

Gene overrepresentation in molecular_function category:

Log-likelihood per target  Total log-likelihood Term Description
0.3 1.3 GO:0005026 transforming growth factor beta receptor activity, type II(GO:0005026)
0.1 1.7 GO:0001011 transcription factor activity, sequence-specific DNA binding, RNA polymerase recruiting(GO:0001011) transcription factor activity, RNA polymerase II basal transcription factor binding(GO:0001083) transcription factor activity, TFIIB-class binding(GO:0001087) RNA polymerase II basal transcription factor binding(GO:0001091) TFIIB-class transcription factor binding(GO:0001093)
0.1 3.1 GO:0005518 collagen binding(GO:0005518)
0.1 0.3 GO:0001965 G-protein alpha-subunit binding(GO:0001965)
0.0 0.6 GO:0003706 obsolete ligand-regulated transcription factor activity(GO:0003706)
0.0 0.1 GO:0008174 mRNA methyltransferase activity(GO:0008174)
0.0 1.2 GO:0015035 protein disulfide oxidoreductase activity(GO:0015035)
0.0 0.4 GO:0000062 fatty-acyl-CoA binding(GO:0000062)
0.0 1.5 GO:0051287 NAD binding(GO:0051287)
0.0 0.6 GO:0035064 methylated histone binding(GO:0035064)
0.0 0.1 GO:0034416 bisphosphoglycerate phosphatase activity(GO:0034416)
0.0 1.5 GO:0005178 integrin binding(GO:0005178)
0.0 0.2 GO:0016783 sulfurtransferase activity(GO:0016783)