Project
ENCODE cell lines, expression (Ernst 2011)
Navigation
Downloads
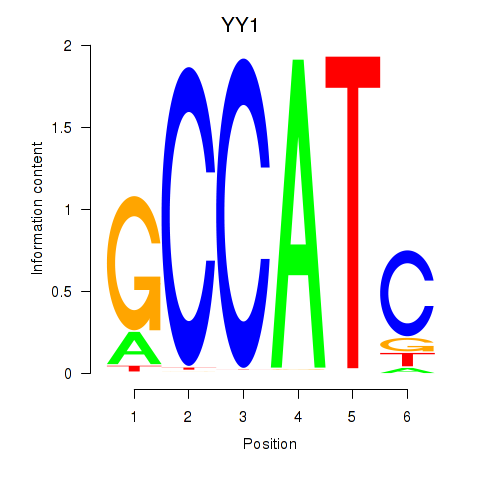
Results for YY1_YY2
Z-value: 1.28
Motif logo

Transcription factors associated with YY1_YY2
| Gene Symbol | Gene ID | Gene Info |
|---|---|---|
|
YY1
|
ENSG00000100811.6 | YY1 |
|
YY2
|
ENSG00000230797.2 | YY2 |
Activity-expression correlation:
| Gene | Promoter | Pearson corr. coef. | P-value | Plot |
|---|---|---|---|---|
| YY1 | hg19_v2_chr14_+_100705322_100705360 | -0.80 | 2.1e-04 | Click! |
| YY2 | hg19_v2_chrX_+_21874105_21874105 | 0.10 | 7.1e-01 | Click! |
Activity profile of YY1_YY2 motif
Sorted Z-values of YY1_YY2 motif
Network of associatons between targets according to the STRING database.

First level regulatory network of YY1_YY2
| Promoter | Score | Transcript | Gene | Gene Info |
|---|---|---|---|---|
| chr3_-_149688896 | 4.53 |
ENST00000239940.7 |
PFN2 |
profilin 2 |
| chr3_-_149688502 | 4.50 |
ENST00000481767.1 ENST00000475518.1 |
PFN2 |
profilin 2 |
| chr3_-_149688655 | 4.24 |
ENST00000461930.1 ENST00000423691.2 ENST00000490975.1 ENST00000461868.1 ENST00000452853.2 |
PFN2 |
profilin 2 |
| chr2_-_190044480 | 3.04 |
ENST00000374866.3 |
COL5A2 |
collagen, type V, alpha 2 |
| chr12_-_91539918 | 2.35 |
ENST00000548218.1 |
DCN |
decorin |
| chr5_-_16936340 | 2.28 |
ENST00000507288.1 ENST00000513610.1 |
MYO10 |
myosin X |
| chr2_-_175870085 | 2.25 |
ENST00000409156.3 |
CHN1 |
chimerin 1 |
| chr17_-_3571934 | 2.25 |
ENST00000225525.3 |
TAX1BP3 |
Tax1 (human T-cell leukemia virus type I) binding protein 3 |
| chr15_+_63340647 | 2.12 |
ENST00000404484.4 |
TPM1 |
tropomyosin 1 (alpha) |
| chrX_-_153236819 | 2.09 |
ENST00000354233.3 |
HCFC1 |
host cell factor C1 (VP16-accessory protein) |
| chr15_+_33022885 | 2.09 |
ENST00000322805.4 |
GREM1 |
gremlin 1, DAN family BMP antagonist |
| chr2_-_175869936 | 2.04 |
ENST00000409900.3 |
CHN1 |
chimerin 1 |
| chr14_-_53417732 | 2.03 |
ENST00000399304.3 ENST00000395631.2 ENST00000341590.3 ENST00000343279.4 |
FERMT2 |
fermitin family member 2 |
| chr14_-_53331239 | 1.95 |
ENST00000553663.1 |
FERMT2 |
fermitin family member 2 |
| chr3_-_123304017 | 1.82 |
ENST00000383657.5 |
PTPLB |
protein tyrosine phosphatase-like (proline instead of catalytic arginine), member b |
| chr9_-_35689900 | 1.77 |
ENST00000378300.5 ENST00000329305.2 ENST00000360958.2 |
TPM2 |
tropomyosin 2 (beta) |
| chr15_+_63340858 | 1.74 |
ENST00000560615.1 |
TPM1 |
tropomyosin 1 (alpha) |
| chr7_+_134551583 | 1.71 |
ENST00000435928.1 |
CALD1 |
caldesmon 1 |
| chr15_+_63340734 | 1.67 |
ENST00000560959.1 |
TPM1 |
tropomyosin 1 (alpha) |
| chr15_+_63340553 | 1.64 |
ENST00000334895.5 |
TPM1 |
tropomyosin 1 (alpha) |
| chr4_-_52904425 | 1.60 |
ENST00000535450.1 |
SGCB |
sarcoglycan, beta (43kDa dystrophin-associated glycoprotein) |
| chr2_+_242255297 | 1.57 |
ENST00000401990.1 ENST00000407971.1 ENST00000436795.1 ENST00000411484.1 ENST00000434955.1 ENST00000402092.2 ENST00000441533.1 ENST00000443492.1 ENST00000437066.1 ENST00000429791.1 |
SEPT2 |
septin 2 |
| chr16_-_74640986 | 1.57 |
ENST00000422840.2 ENST00000565260.1 ENST00000447066.2 ENST00000205061.5 |
GLG1 |
golgi glycoprotein 1 |
| chr15_+_63334831 | 1.53 |
ENST00000288398.6 ENST00000358278.3 ENST00000560445.1 ENST00000403994.3 ENST00000357980.4 ENST00000559556.1 ENST00000559397.1 ENST00000267996.7 ENST00000560970.1 |
TPM1 |
tropomyosin 1 (alpha) |
| chr15_+_63340775 | 1.50 |
ENST00000559281.1 ENST00000317516.7 |
TPM1 |
tropomyosin 1 (alpha) |
| chr22_-_36236623 | 1.50 |
ENST00000405409.2 |
RBFOX2 |
RNA binding protein, fox-1 homolog (C. elegans) 2 |
| chr2_-_175712270 | 1.49 |
ENST00000295497.7 ENST00000444394.1 |
CHN1 |
chimerin 1 |
| chr9_-_131709858 | 1.49 |
ENST00000372586.3 |
DOLK |
dolichol kinase |
| chrX_+_102631844 | 1.48 |
ENST00000372634.1 ENST00000299872.7 |
NGFRAP1 |
nerve growth factor receptor (TNFRSF16) associated protein 1 |
| chr5_+_71403061 | 1.47 |
ENST00000512974.1 ENST00000296755.7 |
MAP1B |
microtubule-associated protein 1B |
| chr12_+_13349650 | 1.46 |
ENST00000256951.5 ENST00000431267.2 ENST00000542474.1 ENST00000544053.1 |
EMP1 |
epithelial membrane protein 1 |
| chr2_-_216257849 | 1.46 |
ENST00000456923.1 |
FN1 |
fibronectin 1 |
| chr20_+_56884752 | 1.42 |
ENST00000244040.3 |
RAB22A |
RAB22A, member RAS oncogene family |
| chr1_-_151965048 | 1.41 |
ENST00000368809.1 |
S100A10 |
S100 calcium binding protein A10 |
| chr6_+_31588478 | 1.39 |
ENST00000376007.4 ENST00000376033.2 |
PRRC2A |
proline-rich coiled-coil 2A |
| chr6_+_151561506 | 1.39 |
ENST00000253332.1 |
AKAP12 |
A kinase (PRKA) anchor protein 12 |
| chr1_+_114522049 | 1.37 |
ENST00000369551.1 ENST00000320334.4 |
OLFML3 |
olfactomedin-like 3 |
| chrX_-_153237258 | 1.35 |
ENST00000310441.7 |
HCFC1 |
host cell factor C1 (VP16-accessory protein) |
| chr17_-_1303462 | 1.33 |
ENST00000573026.1 ENST00000575977.1 ENST00000571732.1 ENST00000264335.8 |
YWHAE |
tyrosine 3-monooxygenase/tryptophan 5-monooxygenase activation protein, epsilon |
| chr14_-_30396802 | 1.31 |
ENST00000415220.2 |
PRKD1 |
protein kinase D1 |
| chr22_-_36236265 | 1.31 |
ENST00000414461.2 ENST00000416721.2 ENST00000449924.2 ENST00000262829.7 ENST00000397305.3 |
RBFOX2 |
RNA binding protein, fox-1 homolog (C. elegans) 2 |
| chr22_+_39916558 | 1.25 |
ENST00000337304.2 ENST00000396680.1 |
ATF4 |
activating transcription factor 4 |
| chr11_+_69455855 | 1.25 |
ENST00000227507.2 ENST00000536559.1 |
CCND1 |
cyclin D1 |
| chr11_+_129939779 | 1.23 |
ENST00000533195.1 ENST00000533713.1 ENST00000528499.1 ENST00000539648.1 ENST00000263574.5 |
APLP2 |
amyloid beta (A4) precursor-like protein 2 |
| chr6_-_43484718 | 1.21 |
ENST00000372422.2 |
YIPF3 |
Yip1 domain family, member 3 |
| chr6_+_121756809 | 1.20 |
ENST00000282561.3 |
GJA1 |
gap junction protein, alpha 1, 43kDa |
| chr11_+_129939811 | 1.16 |
ENST00000345598.5 ENST00000338167.5 |
APLP2 |
amyloid beta (A4) precursor-like protein 2 |
| chr18_-_812517 | 1.16 |
ENST00000584307.1 |
YES1 |
v-yes-1 Yamaguchi sarcoma viral oncogene homolog 1 |
| chr20_-_17641097 | 1.15 |
ENST00000246043.4 |
RRBP1 |
ribosome binding protein 1 |
| chr6_-_74363803 | 1.15 |
ENST00000355773.5 |
SLC17A5 |
solute carrier family 17 (acidic sugar transporter), member 5 |
| chr16_-_66785497 | 1.15 |
ENST00000440564.2 ENST00000379482.2 ENST00000443351.2 ENST00000566150.1 |
DYNC1LI2 |
dynein, cytoplasmic 1, light intermediate chain 2 |
| chr3_-_185542761 | 1.15 |
ENST00000457616.2 ENST00000346192.3 |
IGF2BP2 |
insulin-like growth factor 2 mRNA binding protein 2 |
| chr1_-_153599426 | 1.14 |
ENST00000392622.1 |
S100A13 |
S100 calcium binding protein A13 |
| chr3_-_185542817 | 1.12 |
ENST00000382199.2 |
IGF2BP2 |
insulin-like growth factor 2 mRNA binding protein 2 |
| chr2_+_242254679 | 1.11 |
ENST00000428282.1 ENST00000360051.3 |
SEPT2 |
septin 2 |
| chr10_-_70092671 | 1.11 |
ENST00000358769.2 ENST00000432941.1 ENST00000495025.2 |
PBLD |
phenazine biosynthesis-like protein domain containing |
| chr6_+_33168637 | 1.11 |
ENST00000374677.3 |
SLC39A7 |
solute carrier family 39 (zinc transporter), member 7 |
| chr11_-_47270341 | 1.10 |
ENST00000529444.1 ENST00000530453.1 ENST00000537863.1 ENST00000529788.1 ENST00000444355.2 ENST00000527256.1 ENST00000529663.1 ENST00000256997.3 |
ACP2 |
acid phosphatase 2, lysosomal |
| chr6_+_33168597 | 1.10 |
ENST00000374675.3 |
SLC39A7 |
solute carrier family 39 (zinc transporter), member 7 |
| chr12_-_91546926 | 1.08 |
ENST00000550758.1 |
DCN |
decorin |
| chr14_-_23504087 | 1.08 |
ENST00000493471.2 ENST00000460922.2 |
PSMB5 |
proteasome (prosome, macropain) subunit, beta type, 5 |
| chr6_-_138428613 | 1.08 |
ENST00000421351.3 |
PERP |
PERP, TP53 apoptosis effector |
| chr12_+_58087901 | 1.07 |
ENST00000315970.7 ENST00000547079.1 ENST00000439210.2 ENST00000389146.6 ENST00000413095.2 ENST00000551035.1 ENST00000257966.8 ENST00000435406.2 ENST00000550372.1 ENST00000389142.5 |
OS9 |
osteosarcoma amplified 9, endoplasmic reticulum lectin |
| chr9_+_131873659 | 1.07 |
ENST00000452489.2 ENST00000347048.4 ENST00000357197.4 ENST00000445241.1 ENST00000355007.3 ENST00000414331.1 |
PPP2R4 |
protein phosphatase 2A activator, regulatory subunit 4 |
| chr6_-_43484621 | 1.04 |
ENST00000506469.1 ENST00000503972.1 |
YIPF3 |
Yip1 domain family, member 3 |
| chr10_+_17271266 | 1.03 |
ENST00000224237.5 |
VIM |
vimentin |
| chr8_+_30300119 | 1.03 |
ENST00000520191.1 |
RBPMS |
RNA binding protein with multiple splicing |
| chr17_-_46682321 | 1.02 |
ENST00000225648.3 ENST00000484302.2 |
HOXB6 |
homeobox B6 |
| chrX_-_153236620 | 1.00 |
ENST00000369984.4 |
HCFC1 |
host cell factor C1 (VP16-accessory protein) |
| chr4_+_76439665 | 1.00 |
ENST00000508105.1 ENST00000311638.3 ENST00000380837.3 ENST00000507556.1 ENST00000504190.1 ENST00000507885.1 ENST00000502620.1 ENST00000514480.1 |
THAP6 |
THAP domain containing 6 |
| chrX_+_102840408 | 0.98 |
ENST00000468024.1 ENST00000472484.1 ENST00000415568.2 ENST00000490644.1 ENST00000459722.1 ENST00000472745.1 ENST00000494801.1 ENST00000434216.2 ENST00000425011.1 |
TCEAL4 |
transcription elongation factor A (SII)-like 4 |
| chr3_-_99833333 | 0.98 |
ENST00000354552.3 ENST00000331335.5 ENST00000398326.2 |
FILIP1L |
filamin A interacting protein 1-like |
| chr17_+_38599693 | 0.98 |
ENST00000542955.1 ENST00000269593.4 |
IGFBP4 |
insulin-like growth factor binding protein 4 |
| chr12_-_110434183 | 0.96 |
ENST00000360185.4 ENST00000354574.4 ENST00000338373.5 ENST00000343646.5 ENST00000356259.4 ENST00000553118.1 |
GIT2 |
G protein-coupled receptor kinase interacting ArfGAP 2 |
| chr16_-_2827128 | 0.96 |
ENST00000494946.2 ENST00000409477.1 ENST00000572954.1 ENST00000262306.7 ENST00000409906.4 |
TCEB2 |
transcription elongation factor B (SIII), polypeptide 2 (18kDa, elongin B) |
| chr6_+_146864829 | 0.95 |
ENST00000367495.3 |
RAB32 |
RAB32, member RAS oncogene family |
| chr2_+_242255275 | 0.94 |
ENST00000391971.2 |
SEPT2 |
septin 2 |
| chr6_+_151561085 | 0.94 |
ENST00000402676.2 |
AKAP12 |
A kinase (PRKA) anchor protein 12 |
| chr12_+_6309963 | 0.94 |
ENST00000382515.2 |
CD9 |
CD9 molecule |
| chr14_-_23504337 | 0.94 |
ENST00000361611.6 |
PSMB5 |
proteasome (prosome, macropain) subunit, beta type, 5 |
| chr11_+_77532233 | 0.92 |
ENST00000525409.1 |
AAMDC |
adipogenesis associated, Mth938 domain containing |
| chrX_+_67718863 | 0.91 |
ENST00000374622.2 |
YIPF6 |
Yip1 domain family, member 6 |
| chr2_+_187454749 | 0.91 |
ENST00000261023.3 ENST00000374907.3 |
ITGAV |
integrin, alpha V |
| chr1_-_144932014 | 0.91 |
ENST00000529945.1 |
PDE4DIP |
phosphodiesterase 4D interacting protein |
| chr8_+_136469684 | 0.91 |
ENST00000355849.5 |
KHDRBS3 |
KH domain containing, RNA binding, signal transduction associated 3 |
| chr16_+_83841448 | 0.90 |
ENST00000433866.2 |
HSBP1 |
heat shock factor binding protein 1 |
| chr11_-_117166276 | 0.90 |
ENST00000510630.1 ENST00000392937.6 |
BACE1 |
beta-site APP-cleaving enzyme 1 |
| chr11_+_842928 | 0.89 |
ENST00000397408.1 |
TSPAN4 |
tetraspanin 4 |
| chr14_-_30396948 | 0.89 |
ENST00000331968.5 |
PRKD1 |
protein kinase D1 |
| chr9_+_131873591 | 0.87 |
ENST00000393370.2 ENST00000337738.1 ENST00000348141.5 |
PPP2R4 |
protein phosphatase 2A activator, regulatory subunit 4 |
| chr7_-_41740181 | 0.87 |
ENST00000442711.1 |
INHBA |
inhibin, beta A |
| chrX_+_153237740 | 0.87 |
ENST00000369982.4 |
TMEM187 |
transmembrane protein 187 |
| chr5_-_148930960 | 0.87 |
ENST00000261798.5 ENST00000377843.2 |
CSNK1A1 |
casein kinase 1, alpha 1 |
| chr1_+_81771806 | 0.87 |
ENST00000370721.1 ENST00000370727.1 ENST00000370725.1 ENST00000370723.1 ENST00000370728.1 ENST00000370730.1 |
LPHN2 |
latrophilin 2 |
| chr11_-_65640325 | 0.86 |
ENST00000307998.6 |
EFEMP2 |
EGF containing fibulin-like extracellular matrix protein 2 |
| chr6_-_32145861 | 0.86 |
ENST00000336984.6 |
AGPAT1 |
1-acylglycerol-3-phosphate O-acyltransferase 1 |
| chr14_-_23504432 | 0.86 |
ENST00000425762.2 |
PSMB5 |
proteasome (prosome, macropain) subunit, beta type, 5 |
| chr2_-_242254595 | 0.85 |
ENST00000441124.1 ENST00000391976.2 |
HDLBP |
high density lipoprotein binding protein |
| chr2_+_102508955 | 0.84 |
ENST00000414004.2 |
FLJ20373 |
FLJ20373 |
| chr11_-_65640198 | 0.84 |
ENST00000528176.1 |
EFEMP2 |
EGF containing fibulin-like extracellular matrix protein 2 |
| chr7_-_6523755 | 0.84 |
ENST00000436575.1 ENST00000258739.4 |
DAGLB KDELR2 |
diacylglycerol lipase, beta KDEL (Lys-Asp-Glu-Leu) endoplasmic reticulum protein retention receptor 2 |
| chrX_-_10645773 | 0.83 |
ENST00000453318.2 |
MID1 |
midline 1 (Opitz/BBB syndrome) |
| chr8_+_9413410 | 0.83 |
ENST00000520408.1 ENST00000310430.6 ENST00000522110.1 |
TNKS |
tankyrase, TRF1-interacting ankyrin-related ADP-ribose polymerase |
| chr11_-_111782696 | 0.82 |
ENST00000227251.3 ENST00000526180.1 |
CRYAB |
crystallin, alpha B |
| chr2_-_242255117 | 0.82 |
ENST00000420451.1 ENST00000417540.1 ENST00000310931.4 |
HDLBP |
high density lipoprotein binding protein |
| chr12_+_56211703 | 0.81 |
ENST00000243045.5 ENST00000552672.1 ENST00000550836.1 |
ORMDL2 |
ORM1-like 2 (S. cerevisiae) |
| chr20_+_30193083 | 0.81 |
ENST00000376112.3 ENST00000376105.3 |
ID1 |
inhibitor of DNA binding 1, dominant negative helix-loop-helix protein |
| chr12_-_110434021 | 0.78 |
ENST00000355312.3 ENST00000551209.1 ENST00000550186.1 |
GIT2 |
G protein-coupled receptor kinase interacting ArfGAP 2 |
| chr14_+_69865401 | 0.78 |
ENST00000556605.1 ENST00000336643.5 ENST00000031146.4 |
SLC39A9 |
solute carrier family 39, member 9 |
| chr4_+_47487285 | 0.77 |
ENST00000273859.3 ENST00000504445.1 |
ATP10D |
ATPase, class V, type 10D |
| chr19_-_5622991 | 0.77 |
ENST00000252542.4 |
SAFB2 |
scaffold attachment factor B2 |
| chr16_+_69221028 | 0.76 |
ENST00000336278.4 |
SNTB2 |
syntrophin, beta 2 (dystrophin-associated protein A1, 59kDa, basic component 2) |
| chr7_-_27205136 | 0.76 |
ENST00000396345.1 ENST00000343483.6 |
HOXA9 |
homeobox A9 |
| chr7_-_72972319 | 0.76 |
ENST00000223368.2 |
BCL7B |
B-cell CLL/lymphoma 7B |
| chr2_+_66662690 | 0.75 |
ENST00000488550.1 |
MEIS1 |
Meis homeobox 1 |
| chr2_+_202899310 | 0.75 |
ENST00000286201.1 |
FZD7 |
frizzled family receptor 7 |
| chr1_-_43232649 | 0.75 |
ENST00000372526.2 ENST00000236040.4 ENST00000296388.5 ENST00000397054.3 |
LEPRE1 |
leucine proline-enriched proteoglycan (leprecan) 1 |
| chr16_-_88923285 | 0.75 |
ENST00000542788.1 ENST00000569433.1 ENST00000268695.5 ENST00000568311.1 |
GALNS |
galactosamine (N-acetyl)-6-sulfate sulfatase |
| chr13_-_45150392 | 0.74 |
ENST00000501704.2 |
TSC22D1 |
TSC22 domain family, member 1 |
| chr9_+_470288 | 0.74 |
ENST00000382303.1 |
KANK1 |
KN motif and ankyrin repeat domains 1 |
| chr15_+_63335899 | 0.73 |
ENST00000561266.1 |
TPM1 |
tropomyosin 1 (alpha) |
| chr2_+_33172012 | 0.73 |
ENST00000404816.2 |
LTBP1 |
latent transforming growth factor beta binding protein 1 |
| chr14_+_62162258 | 0.73 |
ENST00000337138.4 ENST00000394997.1 |
HIF1A |
hypoxia inducible factor 1, alpha subunit (basic helix-loop-helix transcription factor) |
| chr8_+_26371763 | 0.73 |
ENST00000521913.1 |
DPYSL2 |
dihydropyrimidinase-like 2 |
| chr14_-_51411146 | 0.73 |
ENST00000532462.1 |
PYGL |
phosphorylase, glycogen, liver |
| chr19_+_17326191 | 0.72 |
ENST00000595101.1 ENST00000596136.1 ENST00000379776.4 |
USE1 |
unconventional SNARE in the ER 1 homolog (S. cerevisiae) |
| chr16_-_1020954 | 0.72 |
ENST00000543238.1 ENST00000539379.1 ENST00000399843.2 ENST00000262301.11 |
LMF1 |
lipase maturation factor 1 |
| chr11_+_114310237 | 0.72 |
ENST00000539119.1 |
REXO2 |
RNA exonuclease 2 |
| chr9_-_99381660 | 0.72 |
ENST00000375240.3 ENST00000463569.1 |
CDC14B |
cell division cycle 14B |
| chr11_+_114310102 | 0.71 |
ENST00000265881.5 |
REXO2 |
RNA exonuclease 2 |
| chr15_+_90808919 | 0.71 |
ENST00000379095.3 |
NGRN |
neugrin, neurite outgrowth associated |
| chr1_-_1167346 | 0.71 |
ENST00000545427.1 ENST00000360001.6 |
SDF4 |
stromal cell derived factor 4 |
| chr19_-_42463418 | 0.70 |
ENST00000600292.1 ENST00000601078.1 ENST00000601891.1 ENST00000222008.6 |
RABAC1 |
Rab acceptor 1 (prenylated) |
| chr19_+_17326141 | 0.70 |
ENST00000445667.2 ENST00000263897.5 |
USE1 |
unconventional SNARE in the ER 1 homolog (S. cerevisiae) |
| chr1_-_226374373 | 0.70 |
ENST00000366812.5 |
ACBD3 |
acyl-CoA binding domain containing 3 |
| chr3_+_10068095 | 0.70 |
ENST00000287647.3 ENST00000383807.1 ENST00000383806.1 ENST00000419585.1 |
FANCD2 |
Fanconi anemia, complementation group D2 |
| chr8_-_67525473 | 0.70 |
ENST00000522677.3 |
MYBL1 |
v-myb avian myeloblastosis viral oncogene homolog-like 1 |
| chr19_+_11546093 | 0.70 |
ENST00000591462.1 |
PRKCSH |
protein kinase C substrate 80K-H |
| chr14_+_50234827 | 0.69 |
ENST00000554589.1 ENST00000557247.1 |
KLHDC2 |
kelch domain containing 2 |
| chr2_+_66662510 | 0.69 |
ENST00000272369.9 ENST00000407092.2 |
MEIS1 |
Meis homeobox 1 |
| chr17_+_42634844 | 0.69 |
ENST00000315323.3 |
FZD2 |
frizzled family receptor 2 |
| chr8_+_26435359 | 0.68 |
ENST00000311151.5 |
DPYSL2 |
dihydropyrimidinase-like 2 |
| chr14_-_51411194 | 0.68 |
ENST00000544180.2 |
PYGL |
phosphorylase, glycogen, liver |
| chr3_+_159557637 | 0.68 |
ENST00000445224.2 |
SCHIP1 |
schwannomin interacting protein 1 |
| chr11_+_114310164 | 0.67 |
ENST00000544196.1 ENST00000539754.1 ENST00000539275.1 |
REXO2 |
RNA exonuclease 2 |
| chr11_+_77532155 | 0.67 |
ENST00000532481.1 ENST00000526415.1 ENST00000393427.2 ENST00000527134.1 ENST00000304716.8 |
AAMDC |
adipogenesis associated, Mth938 domain containing |
| chr11_+_842808 | 0.67 |
ENST00000397397.2 ENST00000397411.2 ENST00000397396.1 |
TSPAN4 |
tetraspanin 4 |
| chr12_-_53574376 | 0.67 |
ENST00000267085.4 ENST00000379850.3 ENST00000379846.1 ENST00000424990.1 |
CSAD |
cysteine sulfinic acid decarboxylase |
| chr1_+_164528866 | 0.66 |
ENST00000420696.2 |
PBX1 |
pre-B-cell leukemia homeobox 1 |
| chr1_-_227506158 | 0.65 |
ENST00000366769.3 |
CDC42BPA |
CDC42 binding protein kinase alpha (DMPK-like) |
| chr2_+_33172221 | 0.64 |
ENST00000354476.3 |
LTBP1 |
latent transforming growth factor beta binding protein 1 |
| chr1_+_156105878 | 0.64 |
ENST00000508500.1 |
LMNA |
lamin A/C |
| chr1_+_100111479 | 0.64 |
ENST00000263174.4 |
PALMD |
palmdelphin |
| chr18_-_812231 | 0.64 |
ENST00000314574.4 |
YES1 |
v-yes-1 Yamaguchi sarcoma viral oncogene homolog 1 |
| chr18_-_34408902 | 0.63 |
ENST00000593035.1 ENST00000383056.3 ENST00000588909.1 ENST00000590337.1 |
TPGS2 |
tubulin polyglutamylase complex subunit 2 |
| chr3_+_52489503 | 0.63 |
ENST00000345716.4 |
NISCH |
nischarin |
| chr20_-_60942361 | 0.63 |
ENST00000252999.3 |
LAMA5 |
laminin, alpha 5 |
| chr3_-_114035026 | 0.63 |
ENST00000570269.1 |
RP11-553L6.5 |
RP11-553L6.5 |
| chr2_+_173292280 | 0.62 |
ENST00000264107.7 |
ITGA6 |
integrin, alpha 6 |
| chr20_+_53092123 | 0.62 |
ENST00000262593.5 |
DOK5 |
docking protein 5 |
| chr19_+_11546153 | 0.62 |
ENST00000591946.1 ENST00000252455.2 ENST00000412601.1 |
PRKCSH |
protein kinase C substrate 80K-H |
| chr7_+_6414128 | 0.61 |
ENST00000348035.4 ENST00000356142.4 |
RAC1 |
ras-related C3 botulinum toxin substrate 1 (rho family, small GTP binding protein Rac1) |
| chr12_+_8234807 | 0.61 |
ENST00000339754.5 |
NECAP1 |
NECAP endocytosis associated 1 |
| chr3_-_136471204 | 0.61 |
ENST00000480733.1 ENST00000383202.2 ENST00000236698.5 ENST00000434713.2 |
STAG1 |
stromal antigen 1 |
| chr16_+_2564254 | 0.61 |
ENST00000565223.1 |
ATP6V0C |
ATPase, H+ transporting, lysosomal 16kDa, V0 subunit c |
| chr2_-_201729284 | 0.61 |
ENST00000434813.2 |
CLK1 |
CDC-like kinase 1 |
| chr15_-_71146480 | 0.61 |
ENST00000299213.8 |
LARP6 |
La ribonucleoprotein domain family, member 6 |
| chr10_-_81205373 | 0.60 |
ENST00000372336.3 |
ZCCHC24 |
zinc finger, CCHC domain containing 24 |
| chr14_-_74551172 | 0.60 |
ENST00000553458.1 |
ALDH6A1 |
aldehyde dehydrogenase 6 family, member A1 |
| chr1_+_36023035 | 0.60 |
ENST00000373253.3 |
NCDN |
neurochondrin |
| chr1_+_223900034 | 0.60 |
ENST00000295006.5 |
CAPN2 |
calpain 2, (m/II) large subunit |
| chr12_-_53574418 | 0.60 |
ENST00000379843.3 ENST00000453446.2 ENST00000437073.1 |
CSAD |
cysteine sulfinic acid decarboxylase |
| chr10_+_104503727 | 0.59 |
ENST00000448841.1 |
WBP1L |
WW domain binding protein 1-like |
| chr16_+_8736232 | 0.59 |
ENST00000562973.1 |
METTL22 |
methyltransferase like 22 |
| chr10_-_92681033 | 0.59 |
ENST00000371697.3 |
ANKRD1 |
ankyrin repeat domain 1 (cardiac muscle) |
| chr19_+_39214797 | 0.59 |
ENST00000440400.1 |
ACTN4 |
actinin, alpha 4 |
| chr14_+_75746781 | 0.59 |
ENST00000555347.1 |
FOS |
FBJ murine osteosarcoma viral oncogene homolog |
| chr4_+_77870960 | 0.59 |
ENST00000505788.1 ENST00000510515.1 ENST00000504637.1 |
SEPT11 |
septin 11 |
| chr3_-_114343768 | 0.59 |
ENST00000393785.2 |
ZBTB20 |
zinc finger and BTB domain containing 20 |
| chr17_+_37844331 | 0.59 |
ENST00000578199.1 ENST00000406381.2 |
ERBB2 |
v-erb-b2 avian erythroblastic leukemia viral oncogene homolog 2 |
| chr11_-_111782484 | 0.58 |
ENST00000533971.1 |
CRYAB |
crystallin, alpha B |
| chr2_+_210517895 | 0.58 |
ENST00000447185.1 |
MAP2 |
microtubule-associated protein 2 |
| chr17_-_1359443 | 0.58 |
ENST00000574295.1 ENST00000398970.5 ENST00000300574.2 |
CRK |
v-crk avian sarcoma virus CT10 oncogene homolog |
| chr19_+_3094398 | 0.58 |
ENST00000078429.4 |
GNA11 |
guanine nucleotide binding protein (G protein), alpha 11 (Gq class) |
| chr5_-_54603368 | 0.58 |
ENST00000508346.1 ENST00000251636.5 |
DHX29 |
DEAH (Asp-Glu-Ala-His) box polypeptide 29 |
| chr1_-_227505826 | 0.57 |
ENST00000334218.5 ENST00000366766.2 ENST00000366764.2 |
CDC42BPA |
CDC42 binding protein kinase alpha (DMPK-like) |
| chr20_+_44563267 | 0.57 |
ENST00000372409.3 |
PCIF1 |
PDX1 C-terminal inhibiting factor 1 |
| chr3_+_142442841 | 0.57 |
ENST00000476941.1 ENST00000273482.6 |
TRPC1 |
transient receptor potential cation channel, subfamily C, member 1 |
| chr2_+_173292390 | 0.57 |
ENST00000442250.1 ENST00000458358.1 ENST00000409080.1 |
ITGA6 |
integrin, alpha 6 |
| chr11_+_65686802 | 0.57 |
ENST00000376991.2 |
DRAP1 |
DR1-associated protein 1 (negative cofactor 2 alpha) |
| chr10_+_104613980 | 0.56 |
ENST00000339834.5 |
C10orf32 |
chromosome 10 open reading frame 32 |
| chr2_-_201729393 | 0.56 |
ENST00000321356.4 |
CLK1 |
CDC-like kinase 1 |
| chr6_-_33239612 | 0.56 |
ENST00000482399.1 ENST00000445902.2 |
VPS52 |
vacuolar protein sorting 52 homolog (S. cerevisiae) |
| chr1_+_36023370 | 0.55 |
ENST00000356090.4 ENST00000373243.2 |
NCDN |
neurochondrin |
| chr17_-_46671323 | 0.55 |
ENST00000239151.5 |
HOXB5 |
homeobox B5 |
| chr1_-_103574024 | 0.55 |
ENST00000512756.1 ENST00000370096.3 ENST00000358392.2 ENST00000353414.4 |
COL11A1 |
collagen, type XI, alpha 1 |
| chr1_-_9884011 | 0.55 |
ENST00000361311.4 |
CLSTN1 |
calsyntenin 1 |
| chr2_+_113403434 | 0.55 |
ENST00000272542.3 |
SLC20A1 |
solute carrier family 20 (phosphate transporter), member 1 |
| chr5_-_176981417 | 0.54 |
ENST00000514747.1 ENST00000443375.2 ENST00000329540.5 |
FAM193B |
family with sequence similarity 193, member B |
| chr22_+_31489344 | 0.54 |
ENST00000404574.1 |
SMTN |
smoothelin |
Gene Ontology Analysis
Gene overrepresentation in molecular_function category:
| Log-likelihood per target | Total log-likelihood | Term | Description |
|---|---|---|---|
| 0.5 | 1.9 | GO:0008184 | glycogen phosphorylase activity(GO:0008184) |
| 0.5 | 1.4 | GO:0004157 | dihydropyrimidinase activity(GO:0004157) |
| 0.3 | 1.4 | GO:0004782 | sulfinoalanine decarboxylase activity(GO:0004782) |
| 0.3 | 1.0 | GO:0070699 | type II activin receptor binding(GO:0070699) |
| 0.3 | 0.9 | GO:0008798 | beta-aspartyl-peptidase activity(GO:0008798) |
| 0.3 | 2.1 | GO:0016015 | morphogen activity(GO:0016015) |
| 0.3 | 3.6 | GO:0046972 | histone acetyltransferase activity (H4-K5 specific)(GO:0043995) histone acetyltransferase activity (H4-K8 specific)(GO:0043996) histone acetyltransferase activity (H4-K16 specific)(GO:0046972) |
| 0.3 | 13.4 | GO:0003785 | actin monomer binding(GO:0003785) |
| 0.3 | 1.1 | GO:0005046 | KDEL sequence binding(GO:0005046) |
| 0.3 | 1.4 | GO:0050436 | microfibril binding(GO:0050436) |
| 0.3 | 2.3 | GO:0060002 | plus-end directed microfilament motor activity(GO:0060002) |
| 0.2 | 1.2 | GO:0086075 | gap junction channel activity involved in cardiac conduction electrical coupling(GO:0086075) |
| 0.2 | 0.9 | GO:0035651 | AP-1 adaptor complex binding(GO:0035650) AP-3 adaptor complex binding(GO:0035651) |
| 0.2 | 0.7 | GO:0061629 | RNA polymerase II sequence-specific DNA binding transcription factor binding(GO:0061629) |
| 0.2 | 0.2 | GO:0055077 | gap junction hemi-channel activity(GO:0055077) |
| 0.2 | 0.9 | GO:0060422 | peptidyl-dipeptidase inhibitor activity(GO:0060422) |
| 0.2 | 1.6 | GO:0050815 | phosphoserine binding(GO:0050815) |
| 0.2 | 0.6 | GO:0005171 | hepatocyte growth factor receptor binding(GO:0005171) |
| 0.2 | 0.6 | GO:0004379 | glycylpeptide N-tetradecanoyltransferase activity(GO:0004379) myristoyltransferase activity(GO:0019107) |
| 0.2 | 2.6 | GO:0038132 | neuregulin binding(GO:0038132) |
| 0.2 | 0.6 | GO:0034739 | histone deacetylase activity (H4-K16 specific)(GO:0034739) |
| 0.2 | 0.5 | GO:0033823 | procollagen-lysine 5-dioxygenase activity(GO:0008475) procollagen glucosyltransferase activity(GO:0033823) procollagen galactosyltransferase activity(GO:0050211) |
| 0.2 | 0.5 | GO:0004821 | histidine-tRNA ligase activity(GO:0004821) |
| 0.2 | 2.7 | GO:0008179 | adenylate cyclase binding(GO:0008179) |
| 0.2 | 0.5 | GO:0016422 | mRNA (2'-O-methyladenosine-N6-)-methyltransferase activity(GO:0016422) |
| 0.2 | 2.0 | GO:0032050 | clathrin heavy chain binding(GO:0032050) |
| 0.2 | 0.7 | GO:0032810 | sterol response element binding(GO:0032810) |
| 0.2 | 1.0 | GO:1990254 | keratin filament binding(GO:1990254) |
| 0.2 | 15.4 | GO:0008307 | structural constituent of muscle(GO:0008307) |
| 0.2 | 1.1 | GO:0035614 | snRNA stem-loop binding(GO:0035614) |
| 0.2 | 1.1 | GO:0060072 | large conductance calcium-activated potassium channel activity(GO:0060072) |
| 0.2 | 0.5 | GO:0000253 | 3-keto sterol reductase activity(GO:0000253) |
| 0.1 | 0.4 | GO:0004582 | dolichyl-phosphate beta-D-mannosyltransferase activity(GO:0004582) |
| 0.1 | 0.5 | GO:0015319 | sodium:inorganic phosphate symporter activity(GO:0015319) |
| 0.1 | 0.5 | GO:0099609 | microtubule lateral binding(GO:0099609) |
| 0.1 | 0.4 | GO:0070984 | SET domain binding(GO:0070984) |
| 0.1 | 0.4 | GO:0003923 | GPI-anchor transamidase activity(GO:0003923) |
| 0.1 | 0.5 | GO:0004886 | 9-cis retinoic acid receptor activity(GO:0004886) |
| 0.1 | 2.2 | GO:0005385 | zinc ion transmembrane transporter activity(GO:0005385) |
| 0.1 | 5.4 | GO:0046875 | ephrin receptor binding(GO:0046875) |
| 0.1 | 0.3 | GO:0032093 | SAM domain binding(GO:0032093) |
| 0.1 | 0.3 | GO:0061752 | telomeric repeat-containing RNA binding(GO:0061752) |
| 0.1 | 0.6 | GO:0051022 | GDP-dissociation inhibitor binding(GO:0051021) Rho GDP-dissociation inhibitor binding(GO:0051022) |
| 0.1 | 1.0 | GO:0031994 | insulin-like growth factor I binding(GO:0031994) |
| 0.1 | 0.6 | GO:0031826 | type 2A serotonin receptor binding(GO:0031826) |
| 0.1 | 0.2 | GO:0070815 | peptidyl-lysine 5-dioxygenase activity(GO:0070815) |
| 0.1 | 4.1 | GO:0005547 | phosphatidylinositol-3,4,5-trisphosphate binding(GO:0005547) |
| 0.1 | 0.3 | GO:0016833 | oxo-acid-lyase activity(GO:0016833) |
| 0.1 | 2.0 | GO:0070008 | serine-type exopeptidase activity(GO:0070008) |
| 0.1 | 0.3 | GO:0008140 | cAMP response element binding protein binding(GO:0008140) |
| 0.1 | 2.1 | GO:0004697 | protein kinase C activity(GO:0004697) |
| 0.1 | 0.3 | GO:0004662 | CAAX-protein geranylgeranyltransferase activity(GO:0004662) |
| 0.1 | 1.2 | GO:0005402 | sugar:proton symporter activity(GO:0005351) cation:sugar symporter activity(GO:0005402) |
| 0.1 | 0.3 | GO:0016900 | oxidoreductase activity, acting on the CH-OH group of donors, disulfide as acceptor(GO:0016900) vitamin-K-epoxide reductase (warfarin-sensitive) activity(GO:0047057) |
| 0.1 | 0.9 | GO:0001042 | RNA polymerase I core binding(GO:0001042) |
| 0.1 | 1.5 | GO:0045504 | dynein heavy chain binding(GO:0045504) |
| 0.1 | 0.2 | GO:0030158 | protein xylosyltransferase activity(GO:0030158) |
| 0.1 | 1.3 | GO:0008569 | ATP-dependent microtubule motor activity, minus-end-directed(GO:0008569) |
| 0.1 | 0.2 | GO:0004663 | protein geranylgeranyltransferase activity(GO:0004661) Rab geranylgeranyltransferase activity(GO:0004663) |
| 0.1 | 0.2 | GO:0047150 | betaine-homocysteine S-methyltransferase activity(GO:0047150) |
| 0.1 | 0.2 | GO:0051377 | mannose-ethanolamine phosphotransferase activity(GO:0051377) |
| 0.1 | 2.0 | GO:0070064 | proline-rich region binding(GO:0070064) |
| 0.1 | 0.2 | GO:0016899 | oxidoreductase activity, acting on the CH-OH group of donors, oxygen as acceptor(GO:0016899) |
| 0.1 | 1.1 | GO:0043522 | leucine zipper domain binding(GO:0043522) |
| 0.1 | 2.2 | GO:0070003 | threonine-type endopeptidase activity(GO:0004298) threonine-type peptidase activity(GO:0070003) |
| 0.1 | 0.3 | GO:0043812 | phosphatidylinositol-4-phosphate phosphatase activity(GO:0043812) |
| 0.1 | 0.3 | GO:0004739 | pyruvate dehydrogenase (acetyl-transferring) activity(GO:0004739) |
| 0.1 | 1.7 | GO:0042813 | Wnt-activated receptor activity(GO:0042813) |
| 0.1 | 0.9 | GO:0015279 | store-operated calcium channel activity(GO:0015279) |
| 0.1 | 0.2 | GO:0016309 | 1-phosphatidylinositol-5-phosphate 4-kinase activity(GO:0016309) |
| 0.1 | 2.1 | GO:0048027 | mRNA 5'-UTR binding(GO:0048027) |
| 0.1 | 0.6 | GO:0004887 | thyroid hormone receptor activity(GO:0004887) |
| 0.1 | 1.8 | GO:0005523 | tropomyosin binding(GO:0005523) |
| 0.1 | 0.5 | GO:0070181 | small ribosomal subunit rRNA binding(GO:0070181) |
| 0.1 | 0.2 | GO:0005119 | smoothened binding(GO:0005119) |
| 0.1 | 1.5 | GO:0000062 | fatty-acyl-CoA binding(GO:0000062) |
| 0.1 | 0.2 | GO:0052810 | 1-phosphatidylinositol-5-kinase activity(GO:0052810) |
| 0.1 | 0.1 | GO:0004939 | beta-adrenergic receptor activity(GO:0004939) |
| 0.1 | 1.7 | GO:0046933 | proton-transporting ATP synthase activity, rotational mechanism(GO:0046933) |
| 0.1 | 0.4 | GO:0071532 | ankyrin repeat binding(GO:0071532) |
| 0.1 | 4.0 | GO:0050840 | extracellular matrix binding(GO:0050840) |
| 0.1 | 0.2 | GO:0003989 | acetyl-CoA carboxylase activity(GO:0003989) |
| 0.1 | 5.6 | GO:0005201 | extracellular matrix structural constituent(GO:0005201) |
| 0.1 | 1.1 | GO:0050786 | RAGE receptor binding(GO:0050786) |
| 0.1 | 0.2 | GO:0004140 | dephospho-CoA kinase activity(GO:0004140) |
| 0.1 | 0.8 | GO:0002162 | dystroglycan binding(GO:0002162) |
| 0.1 | 1.1 | GO:0042171 | 1-acylglycerol-3-phosphate O-acyltransferase activity(GO:0003841) lysophosphatidic acid acyltransferase activity(GO:0042171) lysophospholipid acyltransferase activity(GO:0071617) |
| 0.1 | 0.5 | GO:0004767 | sphingomyelin phosphodiesterase activity(GO:0004767) |
| 0.1 | 0.2 | GO:0004706 | JUN kinase kinase kinase activity(GO:0004706) |
| 0.1 | 0.3 | GO:0102337 | fatty acid elongase activity(GO:0009922) 3-oxo-arachidoyl-CoA synthase activity(GO:0102336) 3-oxo-cerotoyl-CoA synthase activity(GO:0102337) 3-oxo-lignoceronyl-CoA synthase activity(GO:0102338) |
| 0.1 | 1.4 | GO:0005212 | structural constituent of eye lens(GO:0005212) |
| 0.0 | 0.4 | GO:0004322 | ferroxidase activity(GO:0004322) oxidoreductase activity, oxidizing metal ions, oxygen as acceptor(GO:0016724) |
| 0.0 | 0.0 | GO:0050405 | [hydroxymethylglutaryl-CoA reductase (NADPH)] kinase activity(GO:0047322) [acetyl-CoA carboxylase] kinase activity(GO:0050405) |
| 0.0 | 1.2 | GO:0004012 | phospholipid-translocating ATPase activity(GO:0004012) |
| 0.0 | 0.2 | GO:0004449 | isocitrate dehydrogenase (NAD+) activity(GO:0004449) |
| 0.0 | 0.5 | GO:0015038 | glutathione disulfide oxidoreductase activity(GO:0015038) |
| 0.0 | 0.5 | GO:0033192 | calmodulin-dependent protein phosphatase activity(GO:0033192) |
| 0.0 | 0.4 | GO:0001849 | complement component C1q binding(GO:0001849) |
| 0.0 | 0.7 | GO:0017154 | semaphorin receptor activity(GO:0017154) |
| 0.0 | 0.1 | GO:0003968 | RNA-directed RNA polymerase activity(GO:0003968) |
| 0.0 | 0.6 | GO:0015095 | magnesium ion transmembrane transporter activity(GO:0015095) |
| 0.0 | 1.9 | GO:0005080 | protein kinase C binding(GO:0005080) |
| 0.0 | 0.5 | GO:0008093 | cytoskeletal adaptor activity(GO:0008093) |
| 0.0 | 0.1 | GO:0003777 | microtubule motor activity(GO:0003777) |
| 0.0 | 0.1 | GO:0008312 | 7S RNA binding(GO:0008312) |
| 0.0 | 0.2 | GO:0004704 | NF-kappaB-inducing kinase activity(GO:0004704) |
| 0.0 | 0.1 | GO:0036435 | K48-linked polyubiquitin binding(GO:0036435) |
| 0.0 | 0.5 | GO:0017160 | Ral GTPase binding(GO:0017160) |
| 0.0 | 0.1 | GO:0004853 | uroporphyrinogen decarboxylase activity(GO:0004853) |
| 0.0 | 1.2 | GO:0070182 | DNA polymerase binding(GO:0070182) |
| 0.0 | 5.9 | GO:0005178 | integrin binding(GO:0005178) |
| 0.0 | 0.2 | GO:0004803 | transposase activity(GO:0004803) |
| 0.0 | 0.1 | GO:0015137 | citrate transmembrane transporter activity(GO:0015137) tricarboxylic acid transmembrane transporter activity(GO:0015142) |
| 0.0 | 0.2 | GO:0008079 | translation release factor activity(GO:0003747) translation termination factor activity(GO:0008079) |
| 0.0 | 1.2 | GO:0004198 | calcium-dependent cysteine-type endopeptidase activity(GO:0004198) |
| 0.0 | 0.7 | GO:0005537 | mannose binding(GO:0005537) |
| 0.0 | 2.5 | GO:0004715 | non-membrane spanning protein tyrosine kinase activity(GO:0004715) |
| 0.0 | 0.4 | GO:0019789 | SUMO transferase activity(GO:0019789) |
| 0.0 | 0.7 | GO:0008484 | sulfuric ester hydrolase activity(GO:0008484) |
| 0.0 | 0.2 | GO:0044547 | DNA topoisomerase binding(GO:0044547) |
| 0.0 | 1.6 | GO:0015485 | cholesterol binding(GO:0015485) |
| 0.0 | 0.2 | GO:0042056 | chemoattractant activity(GO:0042056) |
| 0.0 | 0.1 | GO:0031728 | CCR3 chemokine receptor binding(GO:0031728) |
| 0.0 | 0.1 | GO:0004376 | glycolipid mannosyltransferase activity(GO:0004376) |
| 0.0 | 0.1 | GO:0042799 | histone methyltransferase activity (H4-K20 specific)(GO:0042799) |
| 0.0 | 0.1 | GO:0000827 | inositol-1,3,4,5,6-pentakisphosphate kinase activity(GO:0000827) inositol hexakisphosphate kinase activity(GO:0000828) inositol heptakisphosphate kinase activity(GO:0000829) inositol hexakisphosphate 5-kinase activity(GO:0000832) inositol hexakisphosphate 1-kinase activity(GO:0052723) inositol hexakisphosphate 3-kinase activity(GO:0052724) |
| 0.0 | 0.2 | GO:0001595 | angiotensin receptor activity(GO:0001595) angiotensin type II receptor activity(GO:0004945) |
| 0.0 | 0.4 | GO:0015924 | mannosyl-oligosaccharide mannosidase activity(GO:0015924) |
| 0.0 | 0.2 | GO:0005432 | calcium:sodium antiporter activity(GO:0005432) |
| 0.0 | 1.0 | GO:0044183 | protein binding involved in protein folding(GO:0044183) |
| 0.0 | 0.2 | GO:0090599 | alpha-glucosidase activity(GO:0090599) |
| 0.0 | 0.2 | GO:0033130 | acetylcholine receptor binding(GO:0033130) |
| 0.0 | 0.1 | GO:0050265 | RNA uridylyltransferase activity(GO:0050265) |
| 0.0 | 0.2 | GO:0042608 | T cell receptor binding(GO:0042608) |
| 0.0 | 0.0 | GO:0097677 | STAT family protein binding(GO:0097677) |
| 0.0 | 0.1 | GO:0052798 | beta-galactoside alpha-2,3-sialyltransferase activity(GO:0052798) |
| 0.0 | 0.2 | GO:0097322 | 7SK snRNA binding(GO:0097322) |
| 0.0 | 0.2 | GO:0016206 | catechol O-methyltransferase activity(GO:0016206) |
| 0.0 | 0.1 | GO:0015616 | DNA translocase activity(GO:0015616) |
| 0.0 | 0.1 | GO:0005412 | glucose:sodium symporter activity(GO:0005412) |
| 0.0 | 0.3 | GO:0003680 | AT DNA binding(GO:0003680) |
| 0.0 | 0.5 | GO:0051787 | misfolded protein binding(GO:0051787) |
| 0.0 | 0.2 | GO:0004792 | thiosulfate sulfurtransferase activity(GO:0004792) |
| 0.0 | 0.2 | GO:0003998 | acylphosphatase activity(GO:0003998) |
| 0.0 | 0.5 | GO:0008603 | cAMP-dependent protein kinase inhibitor activity(GO:0004862) cAMP-dependent protein kinase regulator activity(GO:0008603) |
| 0.0 | 0.1 | GO:0005294 | neutral L-amino acid secondary active transmembrane transporter activity(GO:0005294) |
| 0.0 | 0.1 | GO:0050811 | GABA receptor binding(GO:0050811) |
| 0.0 | 0.2 | GO:0008597 | calcium-dependent protein serine/threonine phosphatase regulator activity(GO:0008597) |
| 0.0 | 1.2 | GO:0030544 | Hsp70 protein binding(GO:0030544) |
| 0.0 | 0.4 | GO:0003993 | acid phosphatase activity(GO:0003993) |
| 0.0 | 1.4 | GO:0004693 | cyclin-dependent protein serine/threonine kinase activity(GO:0004693) |
| 0.0 | 0.7 | GO:0005528 | macrolide binding(GO:0005527) FK506 binding(GO:0005528) |
| 0.0 | 2.7 | GO:0004867 | serine-type endopeptidase inhibitor activity(GO:0004867) |
| 0.0 | 0.1 | GO:0003696 | satellite DNA binding(GO:0003696) |
| 0.0 | 0.5 | GO:0070411 | I-SMAD binding(GO:0070411) |
| 0.0 | 0.3 | GO:0036402 | proteasome-activating ATPase activity(GO:0036402) |
| 0.0 | 0.2 | GO:0019869 | chloride channel inhibitor activity(GO:0019869) |
| 0.0 | 0.1 | GO:0016907 | G-protein coupled acetylcholine receptor activity(GO:0016907) |
| 0.0 | 0.1 | GO:0004817 | cysteine-tRNA ligase activity(GO:0004817) |
| 0.0 | 0.1 | GO:0098519 | nucleotide phosphatase activity, acting on free nucleotides(GO:0098519) |
| 0.0 | 0.2 | GO:0097643 | amylin receptor activity(GO:0097643) |
| 0.0 | 0.1 | GO:0015923 | alpha-mannosidase activity(GO:0004559) mannosidase activity(GO:0015923) |
| 0.0 | 0.1 | GO:1990829 | C-rich single-stranded DNA binding(GO:1990829) |
| 0.0 | 1.0 | GO:0050699 | WW domain binding(GO:0050699) |
| 0.0 | 0.5 | GO:0005247 | voltage-gated chloride channel activity(GO:0005247) |
| 0.0 | 0.1 | GO:0017018 | myosin phosphatase activity(GO:0017018) |
| 0.0 | 0.1 | GO:0046790 | virion binding(GO:0046790) |
| 0.0 | 0.2 | GO:0050998 | nitric-oxide synthase binding(GO:0050998) |
| 0.0 | 0.5 | GO:0071889 | 14-3-3 protein binding(GO:0071889) |
| 0.0 | 0.2 | GO:0019870 | potassium channel inhibitor activity(GO:0019870) |
| 0.0 | 0.2 | GO:0034452 | dynactin binding(GO:0034452) |
| 0.0 | 0.4 | GO:0070628 | proteasome binding(GO:0070628) |
| 0.0 | 0.5 | GO:0004181 | metallocarboxypeptidase activity(GO:0004181) |
| 0.0 | 0.1 | GO:0004819 | glutamine-tRNA ligase activity(GO:0004819) |
| 0.0 | 0.2 | GO:0036122 | BMP binding(GO:0036122) |
| 0.0 | 0.1 | GO:0035368 | selenocysteine insertion sequence binding(GO:0035368) |
| 0.0 | 0.7 | GO:0017075 | syntaxin-1 binding(GO:0017075) |
| 0.0 | 0.1 | GO:0003827 | alpha-1,3-mannosylglycoprotein 2-beta-N-acetylglucosaminyltransferase activity(GO:0003827) |
| 0.0 | 0.3 | GO:0051959 | dynein light intermediate chain binding(GO:0051959) |
| 0.0 | 0.1 | GO:0097109 | neuroligin family protein binding(GO:0097109) |
| 0.0 | 0.8 | GO:0019894 | kinesin binding(GO:0019894) |
| 0.0 | 0.1 | GO:0005223 | intracellular cGMP activated cation channel activity(GO:0005223) |
| 0.0 | 0.4 | GO:0015929 | hexosaminidase activity(GO:0015929) |
| 0.0 | 0.5 | GO:0016702 | oxidoreductase activity, acting on single donors with incorporation of molecular oxygen, incorporation of two atoms of oxygen(GO:0016702) |
| 0.0 | 0.3 | GO:0005545 | 1-phosphatidylinositol binding(GO:0005545) |
| 0.0 | 0.4 | GO:0050321 | tau-protein kinase activity(GO:0050321) |
| 0.0 | 0.3 | GO:0033549 | MAP kinase phosphatase activity(GO:0033549) |
| 0.0 | 0.6 | GO:0035035 | histone acetyltransferase binding(GO:0035035) |
| 0.0 | 0.1 | GO:0015252 | hydrogen ion channel activity(GO:0015252) |
| 0.0 | 0.1 | GO:0016647 | oxidoreductase activity, acting on the CH-NH group of donors, oxygen as acceptor(GO:0016647) |
| 0.0 | 0.2 | GO:0008198 | ferrous iron binding(GO:0008198) |
| 0.0 | 0.3 | GO:0008191 | metalloendopeptidase inhibitor activity(GO:0008191) |
| 0.0 | 0.2 | GO:0035497 | cAMP response element binding(GO:0035497) |
| 0.0 | 0.2 | GO:0016413 | O-acetyltransferase activity(GO:0016413) |
| 0.0 | 1.0 | GO:0001102 | RNA polymerase II activating transcription factor binding(GO:0001102) |
| 0.0 | 0.1 | GO:0035500 | MH2 domain binding(GO:0035500) |
| 0.0 | 0.8 | GO:0005546 | phosphatidylinositol-4,5-bisphosphate binding(GO:0005546) |
| 0.0 | 0.1 | GO:0048156 | tau protein binding(GO:0048156) |
| 0.0 | 0.1 | GO:0035174 | histone serine kinase activity(GO:0035174) |
| 0.0 | 0.8 | GO:0005158 | insulin receptor binding(GO:0005158) |
| 0.0 | 0.3 | GO:0032794 | GTPase activating protein binding(GO:0032794) |
| 0.0 | 0.1 | GO:0015184 | L-cystine transmembrane transporter activity(GO:0015184) |
| 0.0 | 0.2 | GO:0031386 | protein tag(GO:0031386) |
| 0.0 | 0.1 | GO:0047631 | ADP-ribose diphosphatase activity(GO:0047631) |
| 0.0 | 0.2 | GO:0048018 | receptor agonist activity(GO:0048018) |
| 0.0 | 0.1 | GO:0003845 | 11-beta-hydroxysteroid dehydrogenase [NAD(P)] activity(GO:0003845) |
| 0.0 | 0.1 | GO:0051731 | polynucleotide 5'-hydroxyl-kinase activity(GO:0051731) |
| 0.0 | 0.2 | GO:0015643 | toxic substance binding(GO:0015643) |
| 0.0 | 0.1 | GO:0000268 | peroxisome targeting sequence binding(GO:0000268) |
| 0.0 | 0.1 | GO:0031685 | adenosine receptor binding(GO:0031685) |
| 0.0 | 0.1 | GO:0031543 | peptidyl-proline dioxygenase activity(GO:0031543) |
| 0.0 | 0.1 | GO:0004774 | succinate-CoA ligase activity(GO:0004774) |
| 0.0 | 0.3 | GO:0043014 | alpha-tubulin binding(GO:0043014) |
| 0.0 | 0.4 | GO:0004708 | MAP kinase kinase activity(GO:0004708) |
| 0.0 | 0.3 | GO:0008656 | cysteine-type endopeptidase activator activity involved in apoptotic process(GO:0008656) |
| 0.0 | 0.4 | GO:0051019 | mitogen-activated protein kinase binding(GO:0051019) |
| 0.0 | 0.0 | GO:0052596 | tryptamine:oxygen oxidoreductase (deaminating) activity(GO:0052593) aminoacetone:oxygen oxidoreductase(deaminating) activity(GO:0052594) aliphatic-amine oxidase activity(GO:0052595) phenethylamine:oxygen oxidoreductase (deaminating) activity(GO:0052596) |
| 0.0 | 0.1 | GO:0048273 | mitogen-activated protein kinase p38 binding(GO:0048273) |
| 0.0 | 0.4 | GO:0017134 | fibroblast growth factor binding(GO:0017134) |
| 0.0 | 0.2 | GO:0005132 | type I interferon receptor binding(GO:0005132) |
| 0.0 | 0.3 | GO:0030971 | receptor tyrosine kinase binding(GO:0030971) |
| 0.0 | 0.2 | GO:0032454 | histone demethylase activity (H3-K9 specific)(GO:0032454) |
| 0.0 | 0.1 | GO:0004979 | beta-endorphin receptor activity(GO:0004979) morphine receptor activity(GO:0038047) |
| 0.0 | 0.1 | GO:0047499 | calcium-independent phospholipase A2 activity(GO:0047499) |
| 0.0 | 0.3 | GO:0048487 | beta-tubulin binding(GO:0048487) |
| 0.0 | 0.1 | GO:0010997 | anaphase-promoting complex binding(GO:0010997) |
| 0.0 | 0.1 | GO:0016402 | pristanoyl-CoA oxidase activity(GO:0016402) |
| 0.0 | 0.1 | GO:0005166 | neurotrophin p75 receptor binding(GO:0005166) |
| 0.0 | 0.7 | GO:0019905 | syntaxin binding(GO:0019905) |
| 0.0 | 0.0 | GO:0051373 | FATZ binding(GO:0051373) |
| 0.0 | 0.1 | GO:0003995 | acyl-CoA dehydrogenase activity(GO:0003995) |
| 0.0 | 0.2 | GO:0016653 | oxidoreductase activity, acting on NAD(P)H, heme protein as acceptor(GO:0016653) |
| 0.0 | 0.2 | GO:0046965 | retinoid X receptor binding(GO:0046965) |
| 0.0 | 0.5 | GO:0016709 | oxidoreductase activity, acting on paired donors, with incorporation or reduction of molecular oxygen, NAD(P)H as one donor, and incorporation of one atom of oxygen(GO:0016709) |
| 0.0 | 0.2 | GO:0051721 | protein phosphatase 2A binding(GO:0051721) |
| 0.0 | 0.0 | GO:0004594 | pantothenate kinase activity(GO:0004594) |
| 0.0 | 0.2 | GO:0005112 | Notch binding(GO:0005112) |
| 0.0 | 0.1 | GO:0071208 | histone pre-mRNA DCP binding(GO:0071208) |
| 0.0 | 0.1 | GO:0047760 | butyrate-CoA ligase activity(GO:0047760) |
| 0.0 | 0.1 | GO:0004457 | lactate dehydrogenase activity(GO:0004457) L-lactate dehydrogenase activity(GO:0004459) |
| 0.0 | 0.0 | GO:0071558 | histone demethylase activity (H3-K27 specific)(GO:0071558) |
| 0.0 | 0.1 | GO:0098599 | palmitoyl-(protein) hydrolase activity(GO:0008474) palmitoyl hydrolase activity(GO:0098599) |
| 0.0 | 0.1 | GO:0019788 | NEDD8 transferase activity(GO:0019788) |
| 0.0 | 0.1 | GO:0004972 | NMDA glutamate receptor activity(GO:0004972) |
| 0.0 | 0.1 | GO:0016722 | oxidoreductase activity, oxidizing metal ions(GO:0016722) |
| 0.0 | 0.1 | GO:0042826 | histone deacetylase binding(GO:0042826) |
| 0.0 | 2.9 | GO:0003714 | transcription corepressor activity(GO:0003714) |
| 0.0 | 0.1 | GO:0016783 | sulfurtransferase activity(GO:0016783) |
| 0.0 | 1.1 | GO:0003705 | transcription factor activity, RNA polymerase II distal enhancer sequence-specific binding(GO:0003705) |
| 0.0 | 0.0 | GO:0071987 | WD40-repeat domain binding(GO:0071987) |
| 0.0 | 0.2 | GO:0030332 | cyclin binding(GO:0030332) |
| 0.0 | 0.1 | GO:0008494 | translation activator activity(GO:0008494) |
| 0.0 | 0.2 | GO:0008349 | MAP kinase kinase kinase kinase activity(GO:0008349) |
Gene overrepresentation in cellular_component category:
| Log-likelihood per target | Total log-likelihood | Term | Description |
|---|---|---|---|
| 1.0 | 3.0 | GO:0005588 | collagen type V trimer(GO:0005588) |
| 0.7 | 12.3 | GO:0032059 | bleb(GO:0032059) |
| 0.6 | 1.7 | GO:0034676 | integrin alpha6-beta4 complex(GO:0034676) |
| 0.3 | 0.9 | GO:0034686 | integrin alphav-beta6 complex(GO:0034685) integrin alphav-beta8 complex(GO:0034686) |
| 0.3 | 0.9 | GO:0043511 | inhibin complex(GO:0043511) inhibin A complex(GO:0043512) |
| 0.2 | 3.4 | GO:0005589 | collagen type VI trimer(GO:0005589) collagen beaded filament(GO:0098647) |
| 0.2 | 3.4 | GO:0097227 | sperm annulus(GO:0097227) |
| 0.2 | 1.0 | GO:1990745 | EARP complex(GO:1990745) |
| 0.2 | 4.3 | GO:0005671 | Ada2/Gcn5/Ada3 transcription activator complex(GO:0005671) |
| 0.2 | 0.9 | GO:0005797 | Golgi medial cisterna(GO:0005797) |
| 0.2 | 2.3 | GO:0005862 | muscle thin filament tropomyosin(GO:0005862) |
| 0.2 | 1.2 | GO:1990037 | Lewy body core(GO:1990037) |
| 0.2 | 0.8 | GO:0031211 | serine C-palmitoyltransferase complex(GO:0017059) endoplasmic reticulum palmitoyltransferase complex(GO:0031211) |
| 0.2 | 1.6 | GO:0016012 | sarcoglycan complex(GO:0016012) |
| 0.2 | 0.9 | GO:0031905 | early endosome lumen(GO:0031905) |
| 0.2 | 0.6 | GO:0043260 | laminin-10 complex(GO:0043259) laminin-11 complex(GO:0043260) |
| 0.2 | 2.5 | GO:0019774 | proteasome core complex, beta-subunit complex(GO:0019774) |
| 0.2 | 4.0 | GO:0031092 | platelet alpha granule membrane(GO:0031092) |
| 0.1 | 0.4 | GO:0033185 | dolichol-phosphate-mannose synthase complex(GO:0033185) |
| 0.1 | 1.3 | GO:0034464 | BBSome(GO:0034464) |
| 0.1 | 13.9 | GO:0043195 | terminal bouton(GO:0043195) |
| 0.1 | 0.5 | GO:0045160 | myosin I complex(GO:0045160) |
| 0.1 | 0.8 | GO:0002177 | manchette(GO:0002177) |
| 0.1 | 0.5 | GO:0000138 | Golgi trans cisterna(GO:0000138) |
| 0.1 | 0.4 | GO:0042765 | GPI-anchor transamidase complex(GO:0042765) |
| 0.1 | 0.7 | GO:0070381 | endosome to plasma membrane transport vesicle(GO:0070381) |
| 0.1 | 0.4 | GO:0071159 | NF-kappaB complex(GO:0071159) |
| 0.1 | 0.1 | GO:0031526 | brush border membrane(GO:0031526) |
| 0.1 | 1.1 | GO:0061574 | ASAP complex(GO:0061574) |
| 0.1 | 2.3 | GO:0032433 | filopodium tip(GO:0032433) |
| 0.1 | 0.6 | GO:0000836 | Hrd1p ubiquitin ligase complex(GO:0000836) |
| 0.1 | 0.4 | GO:0045293 | MIS complex(GO:0036396) mRNA editing complex(GO:0045293) |
| 0.1 | 4.4 | GO:0031258 | lamellipodium membrane(GO:0031258) |
| 0.1 | 1.0 | GO:0000220 | vacuolar proton-transporting V-type ATPase, V0 domain(GO:0000220) |
| 0.1 | 1.7 | GO:0030478 | actin cap(GO:0030478) |
| 0.1 | 1.4 | GO:0005847 | mRNA cleavage and polyadenylation specificity factor complex(GO:0005847) |
| 0.1 | 0.9 | GO:0035976 | AP1 complex(GO:0035976) |
| 0.1 | 1.5 | GO:0005577 | fibrinogen complex(GO:0005577) |
| 0.1 | 0.4 | GO:0008043 | intracellular ferritin complex(GO:0008043) ferritin complex(GO:0070288) |
| 0.1 | 0.3 | GO:0008622 | epsilon DNA polymerase complex(GO:0008622) |
| 0.1 | 0.4 | GO:0070985 | TFIIK complex(GO:0070985) |
| 0.1 | 0.6 | GO:0030991 | intraciliary transport particle A(GO:0030991) |
| 0.1 | 0.6 | GO:0097442 | CA3 pyramidal cell dendrite(GO:0097442) |
| 0.1 | 0.9 | GO:0072687 | meiotic spindle(GO:0072687) |
| 0.1 | 0.4 | GO:0032044 | DSIF complex(GO:0032044) |
| 0.1 | 0.4 | GO:1990246 | uniplex complex(GO:1990246) |
| 0.1 | 1.4 | GO:0005916 | fascia adherens(GO:0005916) |
| 0.1 | 1.4 | GO:0097512 | cardiac myofibril(GO:0097512) |
| 0.1 | 2.3 | GO:0031143 | pseudopodium(GO:0031143) |
| 0.1 | 0.8 | GO:0071953 | elastic fiber(GO:0071953) |
| 0.1 | 0.5 | GO:0042406 | extrinsic component of endoplasmic reticulum membrane(GO:0042406) |
| 0.1 | 0.4 | GO:0000333 | telomerase catalytic core complex(GO:0000333) |
| 0.1 | 0.3 | GO:0005953 | CAAX-protein geranylgeranyltransferase complex(GO:0005953) |
| 0.1 | 0.3 | GO:0042788 | polysomal ribosome(GO:0042788) |
| 0.1 | 2.9 | GO:0000421 | autophagosome membrane(GO:0000421) |
| 0.1 | 0.3 | GO:0070695 | FHF complex(GO:0070695) |
| 0.1 | 0.2 | GO:0005826 | actomyosin contractile ring(GO:0005826) GID complex(GO:0034657) |
| 0.1 | 0.8 | GO:0008290 | F-actin capping protein complex(GO:0008290) |
| 0.1 | 0.2 | GO:0016013 | syntrophin complex(GO:0016013) |
| 0.1 | 0.6 | GO:0045261 | proton-transporting ATP synthase complex, catalytic core F(1)(GO:0045261) |
| 0.1 | 0.2 | GO:0020003 | symbiont-containing vacuole(GO:0020003) symbiont-containing vacuole membrane(GO:0020005) |
| 0.1 | 0.5 | GO:0005610 | laminin-5 complex(GO:0005610) |
| 0.1 | 2.1 | GO:0005868 | cytoplasmic dynein complex(GO:0005868) |
| 0.1 | 0.5 | GO:0097165 | nuclear stress granule(GO:0097165) |
| 0.1 | 1.4 | GO:0001527 | microfibril(GO:0001527) fibril(GO:0043205) |
| 0.1 | 0.3 | GO:0033596 | TSC1-TSC2 complex(GO:0033596) |
| 0.1 | 0.9 | GO:0030914 | STAGA complex(GO:0030914) |
| 0.1 | 1.0 | GO:0005832 | chaperonin-containing T-complex(GO:0005832) |
| 0.1 | 0.2 | GO:0030289 | protein phosphatase 4 complex(GO:0030289) |
| 0.1 | 0.5 | GO:0005583 | fibrillar collagen trimer(GO:0005583) banded collagen fibril(GO:0098643) |
| 0.1 | 0.1 | GO:1903349 | omegasome membrane(GO:1903349) |
| 0.1 | 0.2 | GO:0042721 | mitochondrial inner membrane protein insertion complex(GO:0042721) |
| 0.1 | 1.2 | GO:0044295 | axonal growth cone(GO:0044295) |
| 0.1 | 0.2 | GO:0016938 | kinesin I complex(GO:0016938) |
| 0.1 | 0.2 | GO:1990730 | VCP-NSFL1C complex(GO:1990730) |
| 0.1 | 0.6 | GO:0031012 | extracellular matrix(GO:0031012) |
| 0.1 | 0.5 | GO:0005915 | zonula adherens(GO:0005915) |
| 0.1 | 0.5 | GO:0005955 | calcineurin complex(GO:0005955) |
| 0.1 | 0.3 | GO:0097418 | neurofibrillary tangle(GO:0097418) |
| 0.1 | 0.3 | GO:0097149 | centralspindlin complex(GO:0097149) |
| 0.0 | 0.5 | GO:0070765 | gamma-secretase complex(GO:0070765) |
| 0.0 | 0.2 | GO:0097422 | tubular endosome(GO:0097422) |
| 0.0 | 0.7 | GO:0031527 | filopodium membrane(GO:0031527) |
| 0.0 | 0.4 | GO:0072546 | ER membrane protein complex(GO:0072546) |
| 0.0 | 0.1 | GO:0030430 | host cell cytoplasm(GO:0030430) host cell cytoplasm part(GO:0033655) |
| 0.0 | 1.3 | GO:0030670 | phagocytic vesicle membrane(GO:0030670) |
| 0.0 | 0.6 | GO:0097431 | mitotic spindle pole(GO:0097431) |
| 0.0 | 0.3 | GO:0005784 | Sec61 translocon complex(GO:0005784) translocon complex(GO:0071256) |
| 0.0 | 0.5 | GO:0005869 | dynactin complex(GO:0005869) |
| 0.0 | 0.2 | GO:0032584 | growth cone membrane(GO:0032584) |
| 0.0 | 0.8 | GO:0030665 | clathrin-coated vesicle membrane(GO:0030665) |
| 0.0 | 0.3 | GO:0014802 | terminal cisterna(GO:0014802) |
| 0.0 | 1.0 | GO:0030132 | clathrin coat of coated pit(GO:0030132) |
| 0.0 | 1.6 | GO:0097546 | ciliary base(GO:0097546) |
| 0.0 | 0.2 | GO:0045323 | interleukin-1 receptor complex(GO:0045323) |
| 0.0 | 1.8 | GO:0034364 | high-density lipoprotein particle(GO:0034364) |
| 0.0 | 0.4 | GO:0033018 | sarcoplasmic reticulum lumen(GO:0033018) |
| 0.0 | 0.2 | GO:0071012 | catalytic step 1 spliceosome(GO:0071012) |
| 0.0 | 3.0 | GO:0033116 | endoplasmic reticulum-Golgi intermediate compartment membrane(GO:0033116) |
| 0.0 | 0.3 | GO:0071203 | WASH complex(GO:0071203) |
| 0.0 | 1.7 | GO:0005801 | cis-Golgi network(GO:0005801) |
| 0.0 | 0.2 | GO:0097025 | MPP7-DLG1-LIN7 complex(GO:0097025) |
| 0.0 | 1.1 | GO:0042629 | mast cell granule(GO:0042629) |
| 0.0 | 1.2 | GO:0046658 | anchored component of plasma membrane(GO:0046658) |
| 0.0 | 0.1 | GO:0036128 | CatSper complex(GO:0036128) |
| 0.0 | 1.2 | GO:0005685 | U1 snRNP(GO:0005685) |
| 0.0 | 1.3 | GO:0030134 | ER to Golgi transport vesicle(GO:0030134) |
| 0.0 | 0.5 | GO:0005852 | eukaryotic translation initiation factor 3 complex(GO:0005852) |
| 0.0 | 0.6 | GO:0090665 | dystrophin-associated glycoprotein complex(GO:0016010) glycoprotein complex(GO:0090665) |
| 0.0 | 1.0 | GO:0044322 | endoplasmic reticulum quality control compartment(GO:0044322) |
| 0.0 | 2.0 | GO:0042641 | actomyosin(GO:0042641) |
| 0.0 | 0.2 | GO:0000813 | ESCRT I complex(GO:0000813) |
| 0.0 | 0.8 | GO:0030669 | clathrin-coated endocytic vesicle membrane(GO:0030669) |
| 0.0 | 0.6 | GO:0008540 | proteasome regulatory particle, base subcomplex(GO:0008540) |
| 0.0 | 0.2 | GO:0033503 | HULC complex(GO:0033503) |
| 0.0 | 3.3 | GO:0035578 | azurophil granule lumen(GO:0035578) |
| 0.0 | 0.1 | GO:0016589 | NURF complex(GO:0016589) |
| 0.0 | 0.1 | GO:0070022 | transforming growth factor beta receptor homodimeric complex(GO:0070022) |
| 0.0 | 0.2 | GO:0044614 | nuclear pore cytoplasmic filaments(GO:0044614) |
| 0.0 | 0.1 | GO:0070032 | synaptobrevin 2-SNAP-25-syntaxin-1a-complexin I complex(GO:0070032) |
| 0.0 | 0.2 | GO:0005956 | protein kinase CK2 complex(GO:0005956) |
| 0.0 | 0.8 | GO:0035861 | site of double-strand break(GO:0035861) |
| 0.0 | 0.3 | GO:0042579 | peroxisome(GO:0005777) microbody(GO:0042579) |
| 0.0 | 0.1 | GO:0031501 | mannosyltransferase complex(GO:0031501) |
| 0.0 | 0.3 | GO:0030015 | CCR4-NOT core complex(GO:0030015) |
| 0.0 | 0.4 | GO:0030056 | hemidesmosome(GO:0030056) |
| 0.0 | 0.1 | GO:0000235 | astral microtubule(GO:0000235) aster(GO:0005818) |
| 0.0 | 0.2 | GO:0097443 | sorting endosome(GO:0097443) |
| 0.0 | 0.1 | GO:0000806 | Y chromosome(GO:0000806) |
| 0.0 | 0.2 | GO:1903439 | calcitonin family receptor complex(GO:1903439) amylin receptor complex(GO:1903440) |
| 0.0 | 0.2 | GO:0036057 | filtration diaphragm(GO:0036056) slit diaphragm(GO:0036057) |
| 0.0 | 0.2 | GO:0005787 | signal peptidase complex(GO:0005787) |
| 0.0 | 0.3 | GO:0000815 | ESCRT III complex(GO:0000815) |
| 0.0 | 1.9 | GO:0043202 | lysosomal lumen(GO:0043202) |
| 0.0 | 0.2 | GO:0031083 | BLOC-1 complex(GO:0031083) |
| 0.0 | 2.9 | GO:0031227 | intrinsic component of endoplasmic reticulum membrane(GO:0031227) |
| 0.0 | 0.2 | GO:0072357 | PTW/PP1 phosphatase complex(GO:0072357) |
| 0.0 | 0.3 | GO:0030867 | rough endoplasmic reticulum membrane(GO:0030867) |
| 0.0 | 0.2 | GO:0045254 | pyruvate dehydrogenase complex(GO:0045254) |
| 0.0 | 0.1 | GO:0055087 | Ski complex(GO:0055087) |
| 0.0 | 0.9 | GO:1904115 | axon cytoplasm(GO:1904115) |
| 0.0 | 2.0 | GO:0001750 | photoreceptor outer segment(GO:0001750) |
| 0.0 | 0.1 | GO:0043083 | synaptic cleft(GO:0043083) |
| 0.0 | 0.1 | GO:0005786 | signal recognition particle, endoplasmic reticulum targeting(GO:0005786) signal recognition particle(GO:0048500) |
| 0.0 | 0.1 | GO:1990851 | Wnt-Frizzled-LRP5/6 complex(GO:1990851) |
| 0.0 | 1.4 | GO:0099501 | synaptic vesicle membrane(GO:0030672) exocytic vesicle membrane(GO:0099501) |
| 0.0 | 0.4 | GO:0001772 | immunological synapse(GO:0001772) |
| 0.0 | 0.1 | GO:0043224 | nuclear SCF ubiquitin ligase complex(GO:0043224) |
| 0.0 | 0.1 | GO:0030014 | CCR4-NOT complex(GO:0030014) |
| 0.0 | 0.4 | GO:0000812 | Swr1 complex(GO:0000812) |
| 0.0 | 0.3 | GO:0030286 | dynein complex(GO:0030286) |
| 0.0 | 0.4 | GO:0071141 | SMAD protein complex(GO:0071141) |
| 0.0 | 0.2 | GO:0042105 | alpha-beta T cell receptor complex(GO:0042105) |
| 0.0 | 0.2 | GO:0070652 | HAUS complex(GO:0070652) |
| 0.0 | 0.2 | GO:0044613 | nuclear pore central transport channel(GO:0044613) |
| 0.0 | 0.9 | GO:0005771 | multivesicular body(GO:0005771) |
| 0.0 | 0.1 | GO:0071986 | Ragulator complex(GO:0071986) |
| 0.0 | 0.1 | GO:0044530 | supraspliceosomal complex(GO:0044530) |
| 0.0 | 0.4 | GO:0030057 | desmosome(GO:0030057) |
| 0.0 | 0.1 | GO:0005602 | complement component C1 complex(GO:0005602) |
| 0.0 | 0.2 | GO:0043194 | axon initial segment(GO:0043194) |
| 0.0 | 1.2 | GO:0101003 | ficolin-1-rich granule membrane(GO:0101003) |
| 0.0 | 0.1 | GO:0016593 | Cdc73/Paf1 complex(GO:0016593) |
| 0.0 | 0.3 | GO:0008305 | integrin complex(GO:0008305) |
| 0.0 | 0.3 | GO:0005798 | Golgi-associated vesicle(GO:0005798) |
| 0.0 | 0.3 | GO:0008180 | COP9 signalosome(GO:0008180) |
| 0.0 | 1.9 | GO:0055037 | recycling endosome(GO:0055037) |
| 0.0 | 0.7 | GO:0005881 | cytoplasmic microtubule(GO:0005881) |
| 0.0 | 2.8 | GO:0030133 | transport vesicle(GO:0030133) |
| 0.0 | 1.3 | GO:0005604 | basement membrane(GO:0005604) |
| 0.0 | 3.5 | GO:0005788 | endoplasmic reticulum lumen(GO:0005788) |
| 0.0 | 7.6 | GO:0005925 | focal adhesion(GO:0005925) |
| 0.0 | 1.0 | GO:1904724 | tertiary granule lumen(GO:1904724) |
| 0.0 | 0.1 | GO:0008541 | proteasome regulatory particle, lid subcomplex(GO:0008541) |
| 0.0 | 0.0 | GO:0098845 | postsynaptic endosome(GO:0098845) |
| 0.0 | 0.5 | GO:0045171 | intercellular bridge(GO:0045171) |
| 0.0 | 0.4 | GO:0005859 | muscle myosin complex(GO:0005859) |
| 0.0 | 0.1 | GO:0044447 | axoneme part(GO:0044447) |
| 0.0 | 0.1 | GO:0016461 | unconventional myosin complex(GO:0016461) |
| 0.0 | 0.1 | GO:0070069 | cytochrome complex(GO:0070069) |
| 0.0 | 0.3 | GO:0005697 | telomerase holoenzyme complex(GO:0005697) |
| 0.0 | 0.3 | GO:0000118 | histone deacetylase complex(GO:0000118) |
| 0.0 | 0.2 | GO:0000407 | pre-autophagosomal structure(GO:0000407) |
| 0.0 | 0.3 | GO:0031305 | intrinsic component of mitochondrial inner membrane(GO:0031304) integral component of mitochondrial inner membrane(GO:0031305) |
| 0.0 | 0.1 | GO:0031089 | platelet dense granule lumen(GO:0031089) |
| 0.0 | 0.4 | GO:0005905 | clathrin-coated pit(GO:0005905) |
| 0.0 | 0.7 | GO:0005901 | caveola(GO:0005901) |
| 0.0 | 0.1 | GO:0070187 | telosome(GO:0070187) |
Gene overrepresentation in C2:CP category:
| Log-likelihood per target | Total log-likelihood | Term | Description |
|---|---|---|---|
| 0.2 | 12.9 | SIG REGULATION OF THE ACTIN CYTOSKELETON BY RHO GTPASES | Genes related to regulation of the actin cytoskeleton |
| 0.1 | 2.9 | PID INTEGRIN4 PATHWAY | Alpha6 beta4 integrin-ligand interactions |
| 0.1 | 6.6 | PID FRA PATHWAY | Validated transcriptional targets of AP1 family members Fra1 and Fra2 |
| 0.1 | 5.8 | PID NETRIN PATHWAY | Netrin-mediated signaling events |
| 0.1 | 2.5 | PID INTEGRIN5 PATHWAY | Beta5 beta6 beta7 and beta8 integrin cell surface interactions |
| 0.1 | 2.6 | PID WNT SIGNALING PATHWAY | Wnt signaling network |
| 0.1 | 2.6 | PID HIF1A PATHWAY | Hypoxic and oxygen homeostasis regulation of HIF-1-alpha |
| 0.1 | 5.0 | PID RAC1 REG PATHWAY | Regulation of RAC1 activity |
| 0.1 | 3.6 | NABA COLLAGENS | Genes encoding collagen proteins |
| 0.1 | 0.8 | PID TCR RAS PATHWAY | Ras signaling in the CD4+ TCR pathway |
| 0.1 | 4.6 | PID CDC42 PATHWAY | CDC42 signaling events |
| 0.1 | 2.4 | PID IGF1 PATHWAY | IGF1 pathway |
| 0.1 | 2.0 | PID ALK1 PATHWAY | ALK1 signaling events |
| 0.0 | 1.6 | PID NCADHERIN PATHWAY | N-cadherin signaling events |
| 0.0 | 1.2 | PID ARF 3PATHWAY | Arf1 pathway |
| 0.0 | 1.0 | PID WNT NONCANONICAL PATHWAY | Noncanonical Wnt signaling pathway |
| 0.0 | 0.5 | PID ECADHERIN KERATINOCYTE PATHWAY | E-cadherin signaling in keratinocytes |
| 0.0 | 2.0 | PID A6B1 A6B4 INTEGRIN PATHWAY | a6b1 and a6b4 Integrin signaling |
| 0.0 | 1.6 | PID FAK PATHWAY | Signaling events mediated by focal adhesion kinase |
| 0.0 | 0.5 | PID MET PATHWAY | Signaling events mediated by Hepatocyte Growth Factor Receptor (c-Met) |
| 0.0 | 0.5 | PID WNT CANONICAL PATHWAY | Canonical Wnt signaling pathway |
| 0.0 | 1.0 | PID ERBB2 ERBB3 PATHWAY | ErbB2/ErbB3 signaling events |
| 0.0 | 0.3 | PID PI3K PLC TRK PATHWAY | Trk receptor signaling mediated by PI3K and PLC-gamma |
| 0.0 | 1.6 | PID BMP PATHWAY | BMP receptor signaling |
| 0.0 | 0.4 | SA G2 AND M PHASES | Cdc25 activates the cdc2/cyclin B complex to induce the G2/M transition. |
| 0.0 | 0.5 | ST STAT3 PATHWAY | STAT3 Pathway |
| 0.0 | 2.0 | PID P53 REGULATION PATHWAY | p53 pathway |
| 0.0 | 0.8 | PID MYC PATHWAY | C-MYC pathway |
| 0.0 | 0.2 | PID P38 GAMMA DELTA PATHWAY | Signaling mediated by p38-gamma and p38-delta |
| 0.0 | 2.2 | PID P75 NTR PATHWAY | p75(NTR)-mediated signaling |
| 0.0 | 0.2 | PID VEGFR1 PATHWAY | VEGFR1 specific signals |
| 0.0 | 1.5 | PID TAP63 PATHWAY | Validated transcriptional targets of TAp63 isoforms |
| 0.0 | 0.6 | PID RET PATHWAY | Signaling events regulated by Ret tyrosine kinase |
| 0.0 | 1.2 | PID ENDOTHELIN PATHWAY | Endothelins |
| 0.0 | 0.5 | PID INTEGRIN3 PATHWAY | Beta3 integrin cell surface interactions |
| 0.0 | 7.3 | NABA SECRETED FACTORS | Genes encoding secreted soluble factors |
| 0.0 | 0.4 | PID INSULIN PATHWAY | Insulin Pathway |
| 0.0 | 0.8 | PID ARF6 TRAFFICKING PATHWAY | Arf6 trafficking events |
| 0.0 | 3.8 | NABA ECM GLYCOPROTEINS | Genes encoding structural ECM glycoproteins |
| 0.0 | 0.2 | PID ECADHERIN NASCENT AJ PATHWAY | E-cadherin signaling in the nascent adherens junction |
| 0.0 | 0.1 | PID LPA4 PATHWAY | LPA4-mediated signaling events |
| 0.0 | 0.6 | SIG PIP3 SIGNALING IN CARDIAC MYOCTES | Genes related to PIP3 signaling in cardiac myocytes |
| 0.0 | 0.5 | PID ECADHERIN STABILIZATION PATHWAY | Stabilization and expansion of the E-cadherin adherens junction |
| 0.0 | 0.5 | PID ATM PATHWAY | ATM pathway |
| 0.0 | 0.4 | PID HDAC CLASSIII PATHWAY | Signaling events mediated by HDAC Class III |
| 0.0 | 0.6 | NABA PROTEOGLYCANS | Genes encoding proteoglycans |
| 0.0 | 0.1 | PID NECTIN PATHWAY | Nectin adhesion pathway |
| 0.0 | 0.4 | PID FAS PATHWAY | FAS (CD95) signaling pathway |
| 0.0 | 0.9 | PID TELOMERASE PATHWAY | Regulation of Telomerase |
Gene overrepresentation in C2:CP:REACTOME category:
| Log-likelihood per target | Total log-likelihood | Term | Description |
|---|---|---|---|
| 0.3 | 13.7 | REACTOME SIGNALING BY ROBO RECEPTOR | Genes involved in Signaling by Robo receptor |
| 0.2 | 15.0 | REACTOME SMOOTH MUSCLE CONTRACTION | Genes involved in Smooth Muscle Contraction |
| 0.2 | 0.4 | REACTOME PROCESSING OF CAPPED INTRON CONTAINING PRE MRNA | Genes involved in Processing of Capped Intron-Containing Pre-mRNA |
| 0.1 | 3.9 | REACTOME CELL EXTRACELLULAR MATRIX INTERACTIONS | Genes involved in Cell-extracellular matrix interactions |
| 0.1 | 2.4 | REACTOME CALNEXIN CALRETICULIN CYCLE | Genes involved in Calnexin/calreticulin cycle |
| 0.1 | 2.5 | REACTOME GAP JUNCTION DEGRADATION | Genes involved in Gap junction degradation |
| 0.1 | 2.2 | REACTOME ZINC TRANSPORTERS | Genes involved in Zinc transporters |
| 0.1 | 2.4 | REACTOME PECAM1 INTERACTIONS | Genes involved in PECAM1 interactions |
| 0.1 | 3.4 | REACTOME CS DS DEGRADATION | Genes involved in CS/DS degradation |
| 0.1 | 2.0 | REACTOME SYNTHESIS OF SUBSTRATES IN N GLYCAN BIOSYTHESIS | Genes involved in Synthesis of substrates in N-glycan biosythesis |
| 0.1 | 2.4 | REACTOME GLYCOGEN BREAKDOWN GLYCOGENOLYSIS | Genes involved in Glycogen breakdown (glycogenolysis) |
| 0.1 | 1.8 | REACTOME P130CAS LINKAGE TO MAPK SIGNALING FOR INTEGRINS | Genes involved in p130Cas linkage to MAPK signaling for integrins |
| 0.1 | 0.9 | REACTOME ACTIVATION OF CHAPERONE GENES BY ATF6 ALPHA | Genes involved in Activation of Chaperone Genes by ATF6-alpha |
| 0.1 | 0.7 | REACTOME REGULATION OF THE FANCONI ANEMIA PATHWAY | Genes involved in Regulation of the Fanconi anemia pathway |
| 0.1 | 0.8 | REACTOME REGULATION OF INSULIN SECRETION BY ACETYLCHOLINE | Genes involved in Regulation of Insulin Secretion by Acetylcholine |
| 0.1 | 0.9 | REACTOME GLYCOPROTEIN HORMONES | Genes involved in Glycoprotein hormones |
| 0.1 | 4.1 | REACTOME COLLAGEN FORMATION | Genes involved in Collagen formation |
| 0.1 | 1.5 | REACTOME CRMPS IN SEMA3A SIGNALING | Genes involved in CRMPs in Sema3A signaling |
| 0.1 | 0.6 | REACTOME MEMBRANE BINDING AND TARGETTING OF GAG PROTEINS | Genes involved in Membrane binding and targetting of GAG proteins |
| 0.1 | 2.3 | REACTOME NETRIN1 SIGNALING | Genes involved in Netrin-1 signaling |
| 0.1 | 0.4 | REACTOME FORMATION OF THE HIV1 EARLY ELONGATION COMPLEX | Genes involved in Formation of the HIV-1 Early Elongation Complex |
| 0.1 | 1.1 | REACTOME ACTIVATION OF THE AP1 FAMILY OF TRANSCRIPTION FACTORS | Genes involved in Activation of the AP-1 family of transcription factors |
| 0.1 | 0.6 | REACTOME ERKS ARE INACTIVATED | Genes involved in ERKs are inactivated |
| 0.1 | 3.9 | REACTOME VIF MEDIATED DEGRADATION OF APOBEC3G | Genes involved in Vif-mediated degradation of APOBEC3G |
| 0.1 | 0.2 | REACTOME ACYL CHAIN REMODELLING OF PS | Genes involved in Acyl chain remodelling of PS |
| 0.1 | 0.9 | REACTOME A TETRASACCHARIDE LINKER SEQUENCE IS REQUIRED FOR GAG SYNTHESIS | Genes involved in A tetrasaccharide linker sequence is required for GAG synthesis |
| 0.1 | 0.4 | REACTOME RAF MAP KINASE CASCADE | Genes involved in RAF/MAP kinase cascade |
| 0.0 | 1.4 | REACTOME SIGNALING BY HIPPO | Genes involved in Signaling by Hippo |
| 0.0 | 1.2 | REACTOME REGULATION OF INSULIN LIKE GROWTH FACTOR IGF ACTIVITY BY INSULIN LIKE GROWTH FACTOR BINDING PROTEINS IGFBPS | Genes involved in Regulation of Insulin-like Growth Factor (IGF) Activity by Insulin-like Growth Factor Binding Proteins (IGFBPs) |
| 0.0 | 1.0 | REACTOME PRE NOTCH TRANSCRIPTION AND TRANSLATION | Genes involved in Pre-NOTCH Transcription and Translation |
| 0.0 | 0.7 | REACTOME CTNNB1 PHOSPHORYLATION CASCADE | Genes involved in Beta-catenin phosphorylation cascade |
| 0.0 | 0.2 | REACTOME JNK C JUN KINASES PHOSPHORYLATION AND ACTIVATION MEDIATED BY ACTIVATED HUMAN TAK1 | Genes involved in JNK (c-Jun kinases) phosphorylation and activation mediated by activated human TAK1 |
| 0.0 | 0.6 | REACTOME GAMMA CARBOXYLATION TRANSPORT AND AMINO TERMINAL CLEAVAGE OF PROTEINS | Genes involved in Gamma-carboxylation, transport, and amino-terminal cleavage of proteins |
| 0.0 | 0.8 | REACTOME NEPHRIN INTERACTIONS | Genes involved in Nephrin interactions |
| 0.0 | 1.4 | REACTOME CASPASE MEDIATED CLEAVAGE OF CYTOSKELETAL PROTEINS | Genes involved in Caspase-mediated cleavage of cytoskeletal proteins |
| 0.0 | 0.6 | REACTOME SRP DEPENDENT COTRANSLATIONAL PROTEIN TARGETING TO MEMBRANE | Genes involved in SRP-dependent cotranslational protein targeting to membrane |
| 0.0 | 1.4 | REACTOME GLYCOSPHINGOLIPID METABOLISM | Genes involved in Glycosphingolipid metabolism |
| 0.0 | 0.8 | REACTOME TRAFFICKING OF GLUR2 CONTAINING AMPA RECEPTORS | Genes involved in Trafficking of GluR2-containing AMPA receptors |
| 0.0 | 1.1 | REACTOME SPHINGOLIPID METABOLISM | Genes involved in Sphingolipid metabolism |
| 0.0 | 0.9 | REACTOME INSULIN RECEPTOR RECYCLING | Genes involved in Insulin receptor recycling |
| 0.0 | 0.6 | REACTOME RECYCLING PATHWAY OF L1 | Genes involved in Recycling pathway of L1 |
| 0.0 | 0.3 | REACTOME SYNTHESIS OF PIPS AT THE LATE ENDOSOME MEMBRANE | Genes involved in Synthesis of PIPs at the late endosome membrane |
| 0.0 | 0.9 | REACTOME SYNTHESIS OF PA | Genes involved in Synthesis of PA |
| 0.0 | 0.9 | REACTOME SIGNALING BY NODAL | Genes involved in Signaling by NODAL |
| 0.0 | 2.1 | REACTOME ACTIVATION OF CHAPERONE GENES BY XBP1S | Genes involved in Activation of Chaperone Genes by XBP1(S) |
| 0.0 | 0.5 | REACTOME SYNTHESIS SECRETION AND INACTIVATION OF GIP | Genes involved in Synthesis, Secretion, and Inactivation of Glucose-dependent Insulinotropic Polypeptide (GIP) |
| 0.0 | 0.7 | REACTOME INSULIN SYNTHESIS AND PROCESSING | Genes involved in Insulin Synthesis and Processing |
| 0.0 | 1.2 | REACTOME DARPP 32 EVENTS | Genes involved in DARPP-32 events |
| 0.0 | 0.4 | REACTOME SIGNALING BY NOTCH3 | Genes involved in Signaling by NOTCH3 |
| 0.0 | 0.5 | REACTOME OTHER SEMAPHORIN INTERACTIONS | Genes involved in Other semaphorin interactions |
| 0.0 | 0.1 | REACTOME IRAK2 MEDIATED ACTIVATION OF TAK1 COMPLEX UPON TLR7 8 OR 9 STIMULATION | Genes involved in IRAK2 mediated activation of TAK1 complex upon TLR7/8 or 9 stimulation |
| 0.0 | 0.6 | REACTOME DOWNREGULATION OF ERBB2 ERBB3 SIGNALING | Genes involved in Downregulation of ERBB2:ERBB3 signaling |
| 0.0 | 0.3 | REACTOME TIE2 SIGNALING | Genes involved in Tie2 Signaling |
| 0.0 | 0.1 | REACTOME APC C CDH1 MEDIATED DEGRADATION OF CDC20 AND OTHER APC C CDH1 TARGETED PROTEINS IN LATE MITOSIS EARLY G1 | Genes involved in APC/C:Cdh1 mediated degradation of Cdc20 and other APC/C:Cdh1 targeted proteins in late mitosis/early G1 |
| 0.0 | 0.2 | REACTOME TRANSLOCATION OF ZAP 70 TO IMMUNOLOGICAL SYNAPSE | Genes involved in Translocation of ZAP-70 to Immunological synapse |
| 0.0 | 0.4 | REACTOME IRON UPTAKE AND TRANSPORT | Genes involved in Iron uptake and transport |
| 0.0 | 0.6 | REACTOME PPARA ACTIVATES GENE EXPRESSION | Genes involved in PPARA Activates Gene Expression |
| 0.0 | 1.2 | REACTOME CELL DEATH SIGNALLING VIA NRAGE NRIF AND NADE | Genes involved in Cell death signalling via NRAGE, NRIF and NADE |
| 0.0 | 0.5 | REACTOME FATTY ACYL COA BIOSYNTHESIS | Genes involved in Fatty Acyl-CoA Biosynthesis |
| 0.0 | 0.3 | REACTOME PASSIVE TRANSPORT BY AQUAPORINS | Genes involved in Passive Transport by Aquaporins |
| 0.0 | 0.2 | REACTOME IRAK1 RECRUITS IKK COMPLEX | Genes involved in IRAK1 recruits IKK complex |
| 0.0 | 0.4 | REACTOME METABOLISM OF PORPHYRINS | Genes involved in Metabolism of porphyrins |
| 0.0 | 0.1 | REACTOME BINDING AND ENTRY OF HIV VIRION | Genes involved in Binding and entry of HIV virion |
| 0.0 | 1.0 | REACTOME ION TRANSPORT BY P TYPE ATPASES | Genes involved in Ion transport by P-type ATPases |
| 0.0 | 0.5 | REACTOME OXYGEN DEPENDENT PROLINE HYDROXYLATION OF HYPOXIA INDUCIBLE FACTOR ALPHA | Genes involved in Oxygen-dependent Proline Hydroxylation of Hypoxia-inducible Factor Alpha |
| 0.0 | 0.3 | REACTOME INTRINSIC PATHWAY | Genes involved in Intrinsic Pathway |
| 0.0 | 0.4 | REACTOME CYCLIN A B1 ASSOCIATED EVENTS DURING G2 M TRANSITION | Genes involved in Cyclin A/B1 associated events during G2/M transition |
| 0.0 | 0.6 | REACTOME NEGATIVE REGULATORS OF RIG I MDA5 SIGNALING | Genes involved in Negative regulators of RIG-I/MDA5 signaling |
| 0.0 | 1.9 | REACTOME CLASS B 2 SECRETIN FAMILY RECEPTORS | Genes involved in Class B/2 (Secretin family receptors) |
| 0.0 | 1.6 | REACTOME MHC CLASS II ANTIGEN PRESENTATION | Genes involved in MHC class II antigen presentation |
| 0.0 | 0.5 | REACTOME DEGRADATION OF THE EXTRACELLULAR MATRIX | Genes involved in Degradation of the extracellular matrix |
| 0.0 | 0.7 | REACTOME TRANSPORT TO THE GOLGI AND SUBSEQUENT MODIFICATION | Genes involved in Transport to the Golgi and subsequent modification |
| 0.0 | 0.2 | REACTOME P38MAPK EVENTS | Genes involved in p38MAPK events |
| 0.0 | 1.0 | REACTOME AMINO ACID AND OLIGOPEPTIDE SLC TRANSPORTERS | Genes involved in Amino acid and oligopeptide SLC transporters |
| 0.0 | 0.4 | REACTOME CIRCADIAN CLOCK | Genes involved in Circadian Clock |
| 0.0 | 0.5 | REACTOME SULFUR AMINO ACID METABOLISM | Genes involved in Sulfur amino acid metabolism |
| 0.0 | 0.4 | REACTOME ENERGY DEPENDENT REGULATION OF MTOR BY LKB1 AMPK | Genes involved in Energy dependent regulation of mTOR by LKB1-AMPK |
| 0.0 | 0.3 | REACTOME SIGNALING BY BMP | Genes involved in Signaling by BMP |
| 0.0 | 0.2 | REACTOME INITIAL TRIGGERING OF COMPLEMENT | Genes involved in Initial triggering of complement |
| 0.0 | 0.2 | REACTOME REGULATION OF PYRUVATE DEHYDROGENASE PDH COMPLEX | Genes involved in Regulation of pyruvate dehydrogenase (PDH) complex |
| 0.0 | 1.6 | REACTOME SIGNALING BY RHO GTPASES | Genes involved in Signaling by Rho GTPases |
| 0.0 | 0.4 | REACTOME ADHERENS JUNCTIONS INTERACTIONS | Genes involved in Adherens junctions interactions |
| 0.0 | 0.2 | REACTOME SIGNALING BY FGFR3 MUTANTS | Genes involved in Signaling by FGFR3 mutants |
| 0.0 | 0.2 | REACTOME APOPTOSIS INDUCED DNA FRAGMENTATION | Genes involved in Apoptosis induced DNA fragmentation |
| 0.0 | 1.2 | REACTOME RESPONSE TO ELEVATED PLATELET CYTOSOLIC CA2 | Genes involved in Response to elevated platelet cytosolic Ca2+ |
| 0.0 | 0.2 | REACTOME ADVANCED GLYCOSYLATION ENDPRODUCT RECEPTOR SIGNALING | Genes involved in Advanced glycosylation endproduct receptor signaling |
| 0.0 | 0.4 | REACTOME EFFECTS OF PIP2 HYDROLYSIS | Genes involved in Effects of PIP2 hydrolysis |
| 0.0 | 0.3 | REACTOME G ALPHA Z SIGNALLING EVENTS | Genes involved in G alpha (z) signalling events |
| 0.0 | 0.6 | REACTOME GOLGI ASSOCIATED VESICLE BIOGENESIS | Genes involved in Golgi Associated Vesicle Biogenesis |
| 0.0 | 0.3 | REACTOME KERATAN SULFATE BIOSYNTHESIS | Genes involved in Keratan sulfate biosynthesis |
| 0.0 | 0.2 | REACTOME SIGNAL TRANSDUCTION BY L1 | Genes involved in Signal transduction by L1 |
| 0.0 | 0.2 | REACTOME PROTEOLYTIC CLEAVAGE OF SNARE COMPLEX PROTEINS | Genes involved in Proteolytic cleavage of SNARE complex proteins |
Gene overrepresentation in biological_process category:
| Log-likelihood per target | Total log-likelihood | Term | Description |
|---|---|---|---|
| 1.4 | 10.9 | GO:0003065 | positive regulation of heart rate by epinephrine(GO:0003065) |
| 1.1 | 4.4 | GO:0019046 | release from viral latency(GO:0019046) |
| 1.1 | 13.2 | GO:1900028 | negative regulation of ruffle assembly(GO:1900028) |
| 0.8 | 4.1 | GO:2000542 | negative regulation of gastrulation(GO:2000542) |
| 0.7 | 2.1 | GO:1900158 | negative regulation of osteoclast proliferation(GO:0090291) negative regulation of bone mineralization involved in bone maturation(GO:1900158) |
| 0.5 | 1.5 | GO:0052047 | interaction with other organism via secreted substance involved in symbiotic interaction(GO:0052047) |
| 0.5 | 2.8 | GO:0010724 | regulation of definitive erythrocyte differentiation(GO:0010724) |
| 0.5 | 1.4 | GO:0070213 | protein auto-ADP-ribosylation(GO:0070213) |
| 0.4 | 1.3 | GO:1902309 | regulation of heart rate by hormone(GO:0003064) negative regulation of peptidyl-serine dephosphorylation(GO:1902309) |
| 0.4 | 1.2 | GO:0007439 | ectodermal digestive tract development(GO:0007439) embryonic ectodermal digestive tract development(GO:0048611) |
| 0.4 | 1.2 | GO:0010645 | regulation of cell communication by chemical coupling(GO:0010645) positive regulation of cell communication by chemical coupling(GO:0010652) |
| 0.4 | 1.5 | GO:0019747 | regulation of isoprenoid metabolic process(GO:0019747) |
| 0.4 | 1.1 | GO:0061394 | regulation of transcription from RNA polymerase II promoter in response to arsenic-containing substance(GO:0061394) |
| 0.4 | 0.7 | GO:0001922 | B-1 B cell homeostasis(GO:0001922) |
| 0.3 | 1.4 | GO:0042412 | taurine biosynthetic process(GO:0042412) |
| 0.3 | 0.3 | GO:0061088 | regulation of sequestering of zinc ion(GO:0061088) |
| 0.3 | 0.9 | GO:0060278 | regulation of ovulation(GO:0060278) positive regulation of ovulation(GO:0060279) |
| 0.3 | 2.2 | GO:0089700 | protein kinase D signaling(GO:0089700) |
| 0.3 | 1.2 | GO:0060392 | negative regulation of SMAD protein import into nucleus(GO:0060392) |
| 0.3 | 3.4 | GO:1900747 | negative regulation of vascular endothelial growth factor signaling pathway(GO:1900747) |
| 0.3 | 0.8 | GO:0010621 | negative regulation of transcription by transcription factor localization(GO:0010621) |
| 0.3 | 1.3 | GO:0006015 | 5-phosphoribose 1-diphosphate biosynthetic process(GO:0006015) 5-phosphoribose 1-diphosphate metabolic process(GO:0046391) |
| 0.2 | 0.7 | GO:1900195 | positive regulation of oocyte maturation(GO:1900195) |
| 0.2 | 3.0 | GO:0010739 | positive regulation of protein kinase A signaling(GO:0010739) |
| 0.2 | 0.9 | GO:0045715 | negative regulation of low-density lipoprotein particle receptor biosynthetic process(GO:0045715) |
| 0.2 | 0.9 | GO:0072180 | mesonephric duct morphogenesis(GO:0072180) |
| 0.2 | 0.7 | GO:0090341 | negative regulation of secretion of lysosomal enzymes(GO:0090341) |
| 0.2 | 0.7 | GO:1900060 | negative regulation of sphingolipid biosynthetic process(GO:0090155) negative regulation of ceramide biosynthetic process(GO:1900060) |
| 0.2 | 0.4 | GO:0019348 | dolichol metabolic process(GO:0019348) |
| 0.2 | 0.6 | GO:0018008 | N-terminal peptidyl-glycine N-myristoylation(GO:0018008) peptidyl-glycine modification(GO:0018201) |
| 0.2 | 0.6 | GO:1903542 | negative regulation of exosomal secretion(GO:1903542) |
| 0.2 | 0.2 | GO:1900112 | regulation of histone H3-K9 trimethylation(GO:1900112) |
| 0.2 | 0.6 | GO:0090283 | regulation of protein glycosylation in Golgi(GO:0090283) |
| 0.2 | 0.6 | GO:0032707 | negative regulation of interleukin-23 production(GO:0032707) |
| 0.2 | 2.2 | GO:0006621 | protein retention in ER lumen(GO:0006621) |
| 0.2 | 1.8 | GO:0097084 | vascular smooth muscle cell development(GO:0097084) |
| 0.2 | 0.6 | GO:1902396 | protein localization to bicellular tight junction(GO:1902396) |
| 0.2 | 0.2 | GO:0010265 | SCF complex assembly(GO:0010265) |
| 0.2 | 0.8 | GO:0019859 | pyrimidine nucleobase catabolic process(GO:0006208) thymine catabolic process(GO:0006210) thymine metabolic process(GO:0019859) |
| 0.2 | 0.7 | GO:1902962 | regulation of metalloendopeptidase activity involved in amyloid precursor protein catabolic process(GO:1902962) negative regulation of metalloendopeptidase activity involved in amyloid precursor protein catabolic process(GO:1902963) |
| 0.2 | 0.9 | GO:0033578 | protein glycosylation in Golgi(GO:0033578) |
| 0.2 | 0.5 | GO:0046947 | hydroxylysine metabolic process(GO:0046946) hydroxylysine biosynthetic process(GO:0046947) |
| 0.2 | 0.5 | GO:0006427 | histidyl-tRNA aminoacylation(GO:0006427) |
| 0.2 | 6.0 | GO:0008045 | motor neuron axon guidance(GO:0008045) |
| 0.2 | 0.7 | GO:0003150 | muscular septum morphogenesis(GO:0003150) |
| 0.2 | 1.7 | GO:0097500 | receptor localization to nonmotile primary cilium(GO:0097500) |
| 0.2 | 0.5 | GO:0060666 | dichotomous subdivision of terminal units involved in salivary gland branching(GO:0060666) |
| 0.2 | 1.7 | GO:0010668 | ectodermal cell differentiation(GO:0010668) |
| 0.2 | 0.9 | GO:0018022 | peptidyl-lysine methylation(GO:0018022) |
| 0.2 | 1.4 | GO:0035583 | sequestering of TGFbeta in extracellular matrix(GO:0035583) |
| 0.2 | 3.9 | GO:0033622 | integrin activation(GO:0033622) |
| 0.2 | 0.8 | GO:0097498 | endothelial tube lumen extension(GO:0097498) |
| 0.1 | 1.6 | GO:0033327 | Leydig cell differentiation(GO:0033327) |
| 0.1 | 0.6 | GO:0043983 | histone H4-K12 acetylation(GO:0043983) |
| 0.1 | 0.7 | GO:2000348 | regulation of CD40 signaling pathway(GO:2000348) |
| 0.1 | 0.9 | GO:1903232 | melanosome assembly(GO:1903232) |
| 0.1 | 0.3 | GO:1902263 | apoptotic process involved in embryonic digit morphogenesis(GO:1902263) |
| 0.1 | 0.5 | GO:0045218 | zonula adherens maintenance(GO:0045218) |
| 0.1 | 0.5 | GO:0097325 | melanocyte proliferation(GO:0097325) |
| 0.1 | 0.7 | GO:2001034 | positive regulation of double-strand break repair via nonhomologous end joining(GO:2001034) |
| 0.1 | 2.2 | GO:2000009 | negative regulation of protein localization to cell surface(GO:2000009) |
| 0.1 | 0.5 | GO:1902954 | regulation of early endosome to recycling endosome transport(GO:1902954) |
| 0.1 | 0.6 | GO:0035105 | sterol regulatory element binding protein import into nucleus(GO:0035105) |
| 0.1 | 0.5 | GO:0043932 | ossification involved in bone remodeling(GO:0043932) |
| 0.1 | 1.3 | GO:0060020 | Bergmann glial cell differentiation(GO:0060020) |
| 0.1 | 0.5 | GO:2001206 | positive regulation of osteoclast development(GO:2001206) |
| 0.1 | 1.1 | GO:0007042 | lysosomal lumen acidification(GO:0007042) |
| 0.1 | 0.5 | GO:0043387 | mycotoxin catabolic process(GO:0043387) aflatoxin catabolic process(GO:0046223) organic heteropentacyclic compound catabolic process(GO:1901377) regulation of glutathione biosynthetic process(GO:1903786) positive regulation of glutathione biosynthetic process(GO:1903788) |
| 0.1 | 0.5 | GO:0030035 | microspike assembly(GO:0030035) |
| 0.1 | 3.0 | GO:0006829 | zinc II ion transport(GO:0006829) |
| 0.1 | 0.1 | GO:2000157 | regulation of protein K48-linked deubiquitination(GO:1903093) negative regulation of protein K48-linked deubiquitination(GO:1903094) negative regulation of ubiquitin-specific protease activity(GO:2000157) |
| 0.1 | 1.3 | GO:0050703 | interleukin-1 alpha secretion(GO:0050703) |
| 0.1 | 0.2 | GO:0097202 | activation of cysteine-type endopeptidase activity(GO:0097202) positive regulation of cysteine-type endopeptidase activity(GO:2001056) |
| 0.1 | 0.5 | GO:0035989 | tendon development(GO:0035989) |
| 0.1 | 0.9 | GO:0007288 | sperm axoneme assembly(GO:0007288) |
| 0.1 | 0.5 | GO:0035617 | stress granule disassembly(GO:0035617) |
| 0.1 | 0.7 | GO:1904885 | beta-catenin destruction complex assembly(GO:1904885) |
| 0.1 | 0.5 | GO:1903423 | positive regulation of synaptic vesicle endocytosis(GO:1900244) positive regulation of synaptic vesicle recycling(GO:1903423) |
| 0.1 | 0.8 | GO:0001661 | conditioned taste aversion(GO:0001661) |
| 0.1 | 0.5 | GO:0080009 | mRNA methylation(GO:0080009) |
| 0.1 | 0.4 | GO:0003219 | cardiac right ventricle formation(GO:0003219) |
| 0.1 | 0.6 | GO:1902902 | negative regulation of autophagosome assembly(GO:1902902) |
| 0.1 | 0.3 | GO:0033693 | neurofilament bundle assembly(GO:0033693) |
| 0.1 | 1.1 | GO:0034465 | response to carbon monoxide(GO:0034465) negative regulation of cell volume(GO:0045794) |
| 0.1 | 0.2 | GO:0061428 | negative regulation of transcription from RNA polymerase II promoter in response to hypoxia(GO:0061428) |
| 0.1 | 0.2 | GO:0016139 | glycoside catabolic process(GO:0016139) |
| 0.1 | 1.4 | GO:0061162 | establishment of monopolar cell polarity(GO:0061162) establishment or maintenance of monopolar cell polarity(GO:0061339) |
| 0.1 | 0.1 | GO:0045053 | protein retention in Golgi apparatus(GO:0045053) |
| 0.1 | 0.4 | GO:0042271 | susceptibility to natural killer cell mediated cytotoxicity(GO:0042271) |
| 0.1 | 0.5 | GO:0042374 | phylloquinone metabolic process(GO:0042374) phylloquinone catabolic process(GO:0042376) quinone catabolic process(GO:1901662) |
| 0.1 | 0.1 | GO:0000189 | MAPK import into nucleus(GO:0000189) |
| 0.1 | 0.4 | GO:1902544 | regulation of DNA N-glycosylase activity(GO:1902544) |
| 0.1 | 0.3 | GO:0035964 | COPI-coated vesicle budding(GO:0035964) Golgi transport vesicle coating(GO:0048200) COPI coating of Golgi vesicle(GO:0048205) |
| 0.1 | 0.5 | GO:0016476 | regulation of embryonic cell shape(GO:0016476) |
| 0.1 | 0.3 | GO:0034227 | tRNA thio-modification(GO:0034227) |
| 0.1 | 0.5 | GO:1900748 | positive regulation of vascular endothelial growth factor signaling pathway(GO:1900748) |
| 0.1 | 0.5 | GO:0019418 | sulfide oxidation(GO:0019418) sulfide oxidation, using sulfide:quinone oxidoreductase(GO:0070221) |
| 0.1 | 0.3 | GO:1902630 | regulation of membrane hyperpolarization(GO:1902630) |
| 0.1 | 1.6 | GO:0034384 | high-density lipoprotein particle clearance(GO:0034384) |
| 0.1 | 0.5 | GO:1900193 | regulation of oocyte maturation(GO:1900193) |
| 0.1 | 0.4 | GO:0033299 | secretion of lysosomal enzymes(GO:0033299) |
| 0.1 | 2.2 | GO:0006491 | N-glycan processing(GO:0006491) |
| 0.1 | 0.1 | GO:0034427 | nuclear-transcribed mRNA catabolic process, exonucleolytic, 3'-5'(GO:0034427) |
| 0.1 | 0.9 | GO:0009414 | response to water deprivation(GO:0009414) |
| 0.1 | 0.3 | GO:0044376 | RNA polymerase II complex import to nucleus(GO:0044376) RNA polymerase III complex localization to nucleus(GO:1990022) |
| 0.1 | 1.4 | GO:0060044 | negative regulation of cardiac muscle cell proliferation(GO:0060044) |
| 0.1 | 0.3 | GO:0046477 | glycosylceramide catabolic process(GO:0046477) |
| 0.1 | 1.4 | GO:0001765 | membrane raft assembly(GO:0001765) |
| 0.1 | 0.1 | GO:0031063 | regulation of histone deacetylation(GO:0031063) |
| 0.1 | 0.3 | GO:1903935 | response to sodium arsenite(GO:1903935) cellular response to sodium arsenite(GO:1903936) |
| 0.1 | 0.2 | GO:1905224 | clathrin-coated pit assembly(GO:1905224) |
| 0.1 | 0.5 | GO:0046604 | positive regulation of mitotic centrosome separation(GO:0046604) |
| 0.1 | 1.5 | GO:0032060 | bleb assembly(GO:0032060) |
| 0.1 | 0.2 | GO:1904815 | negative regulation of protein localization to chromosome, telomeric region(GO:1904815) |
| 0.1 | 0.3 | GO:0046502 | uroporphyrinogen III biosynthetic process(GO:0006780) uroporphyrinogen III metabolic process(GO:0046502) |
| 0.1 | 0.2 | GO:0019836 | hemolysis by symbiont of host erythrocytes(GO:0019836) hemolysis in other organism(GO:0044179) hemolysis in other organism involved in symbiotic interaction(GO:0052331) |
| 0.1 | 0.8 | GO:0035721 | intraciliary retrograde transport(GO:0035721) |
| 0.1 | 0.1 | GO:0071422 | succinate transport(GO:0015744) succinate transmembrane transport(GO:0071422) |
| 0.1 | 0.7 | GO:0044341 | sodium-dependent phosphate transport(GO:0044341) |
| 0.1 | 1.3 | GO:0009650 | UV protection(GO:0009650) |
| 0.1 | 0.2 | GO:0090427 | activation of meiosis(GO:0090427) |
| 0.1 | 0.5 | GO:0035507 | regulation of myosin-light-chain-phosphatase activity(GO:0035507) |
| 0.1 | 0.7 | GO:0071787 | endoplasmic reticulum tubular network assembly(GO:0071787) |
| 0.1 | 0.5 | GO:0023021 | termination of signal transduction(GO:0023021) |
| 0.1 | 0.6 | GO:0001878 | response to yeast(GO:0001878) |
| 0.1 | 0.4 | GO:0070682 | proteasome regulatory particle assembly(GO:0070682) |
| 0.1 | 0.3 | GO:0072204 | cell-cell signaling involved in kidney development(GO:0060995) Wnt signaling pathway involved in kidney development(GO:0061289) canonical Wnt signaling pathway involved in metanephric kidney development(GO:0061290) cell-cell signaling involved in metanephros development(GO:0072204) |
| 0.1 | 0.2 | GO:0072229 | carbon dioxide transmembrane transport(GO:0035378) cellular response to mercury ion(GO:0071288) proximal convoluted tubule development(GO:0072019) metanephric proximal convoluted tubule development(GO:0072229) |
| 0.1 | 1.1 | GO:0051386 | regulation of neurotrophin TRK receptor signaling pathway(GO:0051386) |
| 0.1 | 0.9 | GO:0060576 | intestinal epithelial cell development(GO:0060576) |
| 0.1 | 0.1 | GO:0003383 | apical constriction(GO:0003383) |
| 0.1 | 0.1 | GO:0002588 | positive regulation of antigen processing and presentation of peptide or polysaccharide antigen via MHC class II(GO:0002582) positive regulation of antigen processing and presentation of peptide antigen(GO:0002585) positive regulation of antigen processing and presentation of peptide antigen via MHC class II(GO:0002588) |
| 0.1 | 0.6 | GO:1904715 | negative regulation of chaperone-mediated autophagy(GO:1904715) |
| 0.1 | 0.1 | GO:0009794 | regulation of mitotic cell cycle, embryonic(GO:0009794) mitotic cell cycle, embryonic(GO:0045448) |
| 0.1 | 0.3 | GO:0035973 | aggrephagy(GO:0035973) |
| 0.1 | 0.7 | GO:0035330 | regulation of hippo signaling(GO:0035330) |
| 0.1 | 0.1 | GO:0033119 | negative regulation of RNA splicing(GO:0033119) |
| 0.1 | 0.9 | GO:1903830 | magnesium ion transmembrane transport(GO:1903830) |
| 0.1 | 0.2 | GO:1904616 | regulation of actin filament binding(GO:1904529) negative regulation of actin filament binding(GO:1904530) regulation of actin binding(GO:1904616) negative regulation of actin binding(GO:1904617) |
| 0.1 | 0.3 | GO:0003322 | pancreatic A cell development(GO:0003322) |
| 0.1 | 0.4 | GO:0036444 | calcium ion transmembrane import into mitochondrion(GO:0036444) |
| 0.1 | 0.4 | GO:0016255 | attachment of GPI anchor to protein(GO:0016255) |
| 0.1 | 0.6 | GO:0060158 | phospholipase C-activating dopamine receptor signaling pathway(GO:0060158) |
| 0.1 | 0.4 | GO:0097577 | intracellular sequestering of iron ion(GO:0006880) sequestering of iron ion(GO:0097577) |
| 0.1 | 0.3 | GO:0090324 | negative regulation of oxidative phosphorylation(GO:0090324) |
| 0.1 | 0.4 | GO:0021540 | corpus callosum morphogenesis(GO:0021540) |
| 0.1 | 1.1 | GO:0010992 | ubiquitin homeostasis(GO:0010992) |
| 0.1 | 0.9 | GO:0016024 | CDP-diacylglycerol biosynthetic process(GO:0016024) |
| 0.1 | 0.4 | GO:0043401 | steroid hormone mediated signaling pathway(GO:0043401) |
| 0.1 | 0.2 | GO:1904046 | negative regulation of vascular endothelial growth factor production(GO:1904046) |
| 0.1 | 0.2 | GO:0033484 | nitric oxide homeostasis(GO:0033484) |
| 0.1 | 0.8 | GO:0034975 | protein folding in endoplasmic reticulum(GO:0034975) |
| 0.1 | 0.2 | GO:1902037 | negative regulation of hematopoietic stem cell differentiation(GO:1902037) |
| 0.1 | 0.1 | GO:0021904 | dorsal/ventral neural tube patterning(GO:0021904) |
| 0.1 | 0.7 | GO:0045792 | negative regulation of cell size(GO:0045792) |
| 0.1 | 0.4 | GO:0046465 | dolichyl diphosphate biosynthetic process(GO:0006489) dolichyl diphosphate metabolic process(GO:0046465) |
| 0.1 | 0.2 | GO:0002232 | leukocyte chemotaxis involved in inflammatory response(GO:0002232) cell surface pattern recognition receptor signaling pathway(GO:0002752) |
| 0.1 | 0.2 | GO:2001295 | malonyl-CoA biosynthetic process(GO:2001295) |
| 0.1 | 0.6 | GO:0042118 | endothelial cell activation(GO:0042118) |
| 0.1 | 0.4 | GO:1902416 | positive regulation of mRNA binding(GO:1902416) |
| 0.1 | 0.2 | GO:0061187 | regulation of chromatin silencing at rDNA(GO:0061187) negative regulation of chromatin silencing at rDNA(GO:0061188) |
| 0.1 | 0.5 | GO:1904706 | negative regulation of vascular smooth muscle cell proliferation(GO:1904706) |
| 0.1 | 1.0 | GO:0007021 | tubulin complex assembly(GO:0007021) |
| 0.1 | 0.9 | GO:0000338 | protein deneddylation(GO:0000338) |
| 0.1 | 1.7 | GO:0043114 | regulation of vascular permeability(GO:0043114) |
| 0.1 | 0.4 | GO:0060501 | positive regulation of epithelial cell proliferation involved in lung morphogenesis(GO:0060501) |
| 0.1 | 0.1 | GO:0060463 | lung lobe development(GO:0060462) lung lobe morphogenesis(GO:0060463) |
| 0.1 | 0.3 | GO:0010615 | positive regulation of cardiac muscle adaptation(GO:0010615) positive regulation of cardiac muscle hypertrophy in response to stress(GO:1903244) |
| 0.1 | 0.2 | GO:2000535 | regulation of entry of bacterium into host cell(GO:2000535) |
| 0.1 | 0.2 | GO:0014744 | positive regulation of muscle adaptation(GO:0014744) |
| 0.1 | 0.2 | GO:0007525 | somatic muscle development(GO:0007525) |
| 0.1 | 0.5 | GO:0010571 | positive regulation of nuclear cell cycle DNA replication(GO:0010571) |
| 0.1 | 1.4 | GO:0045332 | lipid translocation(GO:0034204) phospholipid translocation(GO:0045332) |
| 0.1 | 1.0 | GO:0044342 | type B pancreatic cell proliferation(GO:0044342) |
| 0.1 | 0.7 | GO:0035372 | protein localization to microtubule(GO:0035372) |
| 0.1 | 0.8 | GO:0045838 | positive regulation of membrane potential(GO:0045838) |
| 0.1 | 0.2 | GO:0071108 | protein K48-linked deubiquitination(GO:0071108) |
| 0.1 | 0.3 | GO:0034626 | fatty acid elongation, saturated fatty acid(GO:0019367) fatty acid elongation, unsaturated fatty acid(GO:0019368) fatty acid elongation, monounsaturated fatty acid(GO:0034625) fatty acid elongation, polyunsaturated fatty acid(GO:0034626) |
| 0.1 | 0.2 | GO:0003402 | planar cell polarity pathway involved in axis elongation(GO:0003402) |
| 0.1 | 0.8 | GO:0097186 | amelogenesis(GO:0097186) |
| 0.1 | 0.4 | GO:2001256 | regulation of store-operated calcium entry(GO:2001256) |
| 0.0 | 0.2 | GO:0032434 | regulation of proteasomal ubiquitin-dependent protein catabolic process(GO:0032434) |
| 0.0 | 0.8 | GO:0030854 | positive regulation of granulocyte differentiation(GO:0030854) |
| 0.0 | 0.0 | GO:0043335 | protein unfolding(GO:0043335) |
| 0.0 | 0.6 | GO:0060445 | branching involved in salivary gland morphogenesis(GO:0060445) |
| 0.0 | 0.2 | GO:0042659 | regulation of cell fate specification(GO:0042659) |
| 0.0 | 0.1 | GO:0030997 | regulation of centriole-centriole cohesion(GO:0030997) |
| 0.0 | 0.2 | GO:0043654 | recognition of apoptotic cell(GO:0043654) |
| 0.0 | 0.2 | GO:0017196 | N-terminal peptidyl-methionine acetylation(GO:0017196) |
| 0.0 | 0.1 | GO:0045955 | negative regulation of calcium ion-dependent exocytosis(GO:0045955) |
| 0.0 | 0.7 | GO:1900364 | negative regulation of mRNA polyadenylation(GO:1900364) |
| 0.0 | 0.2 | GO:1903361 | protein localization to basolateral plasma membrane(GO:1903361) |
| 0.0 | 2.1 | GO:0035987 | endodermal cell differentiation(GO:0035987) |
| 0.0 | 0.3 | GO:0030263 | apoptotic chromosome condensation(GO:0030263) |
| 0.0 | 0.2 | GO:0045022 | early endosome to late endosome transport(GO:0045022) |
| 0.0 | 0.2 | GO:0090045 | positive regulation of deacetylase activity(GO:0090045) |
| 0.0 | 0.3 | GO:1905049 | negative regulation of metallopeptidase activity(GO:1905049) |
| 0.0 | 0.1 | GO:0001172 | transcription, RNA-templated(GO:0001172) |
| 0.0 | 0.0 | GO:1900084 | regulation of peptidyl-tyrosine autophosphorylation(GO:1900084) positive regulation of peptidyl-tyrosine autophosphorylation(GO:1900086) |
| 0.0 | 0.2 | GO:0015992 | hydrogen transport(GO:0006818) proton transport(GO:0015992) |
| 0.0 | 0.2 | GO:0070131 | positive regulation of mitochondrial translation(GO:0070131) |
| 0.0 | 0.0 | GO:0039694 | viral RNA genome replication(GO:0039694) RNA replication(GO:0039703) |
| 0.0 | 0.1 | GO:1903059 | regulation of protein lipidation(GO:1903059) positive regulation of protein lipidation(GO:1903061) regulation of calcium ion-dependent exocytosis of neurotransmitter(GO:1903233) regulation of endoplasmic reticulum tubular network organization(GO:1903371) |
| 0.0 | 0.1 | GO:0006617 | SRP-dependent cotranslational protein targeting to membrane, signal sequence recognition(GO:0006617) |
| 0.0 | 0.2 | GO:0050668 | cellular response to phosphate starvation(GO:0016036) positive regulation of sulfur amino acid metabolic process(GO:0031337) negative regulation of catecholamine metabolic process(GO:0045914) negative regulation of dopamine metabolic process(GO:0045963) positive regulation of homocysteine metabolic process(GO:0050668) |
| 0.0 | 0.5 | GO:0001915 | negative regulation of T cell mediated cytotoxicity(GO:0001915) |
| 0.0 | 0.2 | GO:0045661 | regulation of myoblast differentiation(GO:0045661) |
| 0.0 | 0.1 | GO:0000294 | nuclear-transcribed mRNA catabolic process, endonucleolytic cleavage-dependent decay(GO:0000294) |
| 0.0 | 0.5 | GO:0071550 | death-inducing signaling complex assembly(GO:0071550) |
| 0.0 | 0.1 | GO:0032511 | late endosome to vacuole transport via multivesicular body sorting pathway(GO:0032511) protein targeting to vacuole involved in ubiquitin-dependent protein catabolic process via the multivesicular body sorting pathway(GO:0043328) ubiquitin-dependent endocytosis(GO:0070086) regulation of ubiquitin-dependent endocytosis(GO:2000395) positive regulation of ubiquitin-dependent endocytosis(GO:2000397) |
| 0.0 | 0.3 | GO:0002051 | osteoblast fate commitment(GO:0002051) |
| 0.0 | 0.1 | GO:0043012 | regulation of fusion of sperm to egg plasma membrane(GO:0043012) |
| 0.0 | 0.1 | GO:0046440 | L-lysine catabolic process to acetyl-CoA(GO:0019474) L-lysine catabolic process(GO:0019477) L-lysine metabolic process(GO:0046440) |
| 0.0 | 0.4 | GO:0042249 | establishment of planar polarity of embryonic epithelium(GO:0042249) |
| 0.0 | 0.6 | GO:0043517 | positive regulation of DNA damage response, signal transduction by p53 class mediator(GO:0043517) |
| 0.0 | 0.7 | GO:0042340 | keratan sulfate catabolic process(GO:0042340) |
| 0.0 | 0.2 | GO:0060356 | leucine import(GO:0060356) |
| 0.0 | 0.5 | GO:0003215 | cardiac right ventricle morphogenesis(GO:0003215) |
| 0.0 | 0.2 | GO:0000393 | spliceosomal conformational changes to generate catalytic conformation(GO:0000393) |
| 0.0 | 0.6 | GO:0048243 | norepinephrine secretion(GO:0048243) |
| 0.0 | 0.3 | GO:1904354 | negative regulation of telomere capping(GO:1904354) |
| 0.0 | 0.3 | GO:0001833 | inner cell mass cell proliferation(GO:0001833) |
| 0.0 | 2.3 | GO:0007032 | endosome organization(GO:0007032) |
| 0.0 | 0.3 | GO:0031272 | regulation of pseudopodium assembly(GO:0031272) |
| 0.0 | 0.1 | GO:0070940 | dephosphorylation of RNA polymerase II C-terminal domain(GO:0070940) |
| 0.0 | 0.1 | GO:0034501 | protein localization to kinetochore(GO:0034501) |
| 0.0 | 0.3 | GO:0034316 | negative regulation of Arp2/3 complex-mediated actin nucleation(GO:0034316) |
| 0.0 | 0.1 | GO:0051771 | negative regulation of nitric-oxide synthase biosynthetic process(GO:0051771) |
| 0.0 | 0.3 | GO:0051988 | regulation of attachment of spindle microtubules to kinetochore(GO:0051988) |
| 0.0 | 0.1 | GO:1990822 | basic amino acid transmembrane transport(GO:1990822) |
| 0.0 | 0.2 | GO:0034086 | maintenance of sister chromatid cohesion(GO:0034086) maintenance of mitotic sister chromatid cohesion(GO:0034088) |
| 0.0 | 0.9 | GO:0070886 | positive regulation of calcineurin-NFAT signaling cascade(GO:0070886) |
| 0.0 | 0.5 | GO:0046007 | negative regulation of activated T cell proliferation(GO:0046007) |
| 0.0 | 0.6 | GO:0001921 | positive regulation of receptor recycling(GO:0001921) |
| 0.0 | 0.1 | GO:0010936 | negative regulation of macrophage cytokine production(GO:0010936) |
| 0.0 | 1.3 | GO:0050435 | beta-amyloid metabolic process(GO:0050435) |
| 0.0 | 0.1 | GO:0003409 | optic cup structural organization(GO:0003409) |
| 0.0 | 0.1 | GO:0045901 | positive regulation of translational elongation(GO:0045901) |
| 0.0 | 0.5 | GO:0043562 | cellular response to nitrogen starvation(GO:0006995) cellular response to nitrogen levels(GO:0043562) |
| 0.0 | 0.4 | GO:0045793 | positive regulation of cell size(GO:0045793) |
| 0.0 | 0.5 | GO:0018214 | peptidyl-glutamic acid carboxylation(GO:0017187) protein carboxylation(GO:0018214) |
| 0.0 | 0.2 | GO:1902202 | regulation of hepatocyte growth factor receptor signaling pathway(GO:1902202) |
| 0.0 | 1.6 | GO:0051489 | regulation of filopodium assembly(GO:0051489) |
| 0.0 | 0.4 | GO:0006884 | cell volume homeostasis(GO:0006884) |
| 0.0 | 0.5 | GO:0033539 | fatty acid beta-oxidation using acyl-CoA dehydrogenase(GO:0033539) |
| 0.0 | 0.2 | GO:1902083 | negative regulation of peptidyl-cysteine S-nitrosylation(GO:1902083) |
| 0.0 | 2.2 | GO:0030049 | muscle filament sliding(GO:0030049) actin-myosin filament sliding(GO:0033275) |
| 0.0 | 0.0 | GO:1902952 | positive regulation of dendritic spine maintenance(GO:1902952) |
| 0.0 | 0.1 | GO:0021797 | forebrain anterior/posterior pattern specification(GO:0021797) |
| 0.0 | 0.3 | GO:0007000 | nucleolus organization(GO:0007000) |
| 0.0 | 0.4 | GO:0006449 | regulation of translational termination(GO:0006449) |
| 0.0 | 0.1 | GO:0061484 | hematopoietic stem cell homeostasis(GO:0061484) |
| 0.0 | 0.1 | GO:0003056 | regulation of vascular smooth muscle contraction(GO:0003056) |
| 0.0 | 0.4 | GO:0030308 | negative regulation of cell growth(GO:0030308) |
| 0.0 | 0.2 | GO:0090136 | epithelial cell-cell adhesion(GO:0090136) |
| 0.0 | 0.2 | GO:0046826 | negative regulation of protein export from nucleus(GO:0046826) |
| 0.0 | 0.1 | GO:0002084 | protein depalmitoylation(GO:0002084) |
| 0.0 | 0.2 | GO:0006789 | bilirubin conjugation(GO:0006789) |
| 0.0 | 0.1 | GO:0032661 | regulation of interleukin-18 production(GO:0032661) negative regulation of interleukin-6 biosynthetic process(GO:0045409) |
| 0.0 | 1.5 | GO:0032330 | regulation of chondrocyte differentiation(GO:0032330) |
| 0.0 | 0.6 | GO:0007040 | lysosome organization(GO:0007040) lytic vacuole organization(GO:0080171) |
| 0.0 | 0.2 | GO:0032482 | Rab protein signal transduction(GO:0032482) |
| 0.0 | 0.2 | GO:0097428 | protein maturation by iron-sulfur cluster transfer(GO:0097428) |
| 0.0 | 0.2 | GO:0018202 | peptidyl-diphthamide metabolic process(GO:0017182) peptidyl-diphthamide biosynthetic process from peptidyl-histidine(GO:0017183) peptidyl-histidine modification(GO:0018202) |
| 0.0 | 0.2 | GO:0007256 | activation of JNKK activity(GO:0007256) |
| 0.0 | 0.1 | GO:0042320 | regulation of circadian sleep/wake cycle, REM sleep(GO:0042320) |
| 0.0 | 0.1 | GO:0006104 | succinyl-CoA metabolic process(GO:0006104) |
| 0.0 | 0.1 | GO:0051697 | protein delipidation(GO:0051697) |
| 0.0 | 1.2 | GO:0006893 | Golgi to plasma membrane transport(GO:0006893) |
| 0.0 | 0.5 | GO:0035162 | embryonic hemopoiesis(GO:0035162) |
| 0.0 | 0.3 | GO:0001867 | complement activation, lectin pathway(GO:0001867) |
| 0.0 | 0.1 | GO:0099590 | neurotransmitter receptor internalization(GO:0099590) |
| 0.0 | 0.1 | GO:0021691 | cerebellar Purkinje cell layer maturation(GO:0021691) |
| 0.0 | 0.1 | GO:2000418 | positive regulation of eosinophil migration(GO:2000418) |
| 0.0 | 0.4 | GO:0015937 | coenzyme A biosynthetic process(GO:0015937) |
| 0.0 | 0.1 | GO:0045925 | positive regulation of female receptivity(GO:0045925) |
| 0.0 | 0.2 | GO:0006907 | pinocytosis(GO:0006907) |
| 0.0 | 0.2 | GO:1901741 | positive regulation of myoblast fusion(GO:1901741) |
| 0.0 | 0.2 | GO:2000467 | positive regulation of glycogen (starch) synthase activity(GO:2000467) |
| 0.0 | 0.1 | GO:0045110 | intermediate filament bundle assembly(GO:0045110) |
| 0.0 | 0.3 | GO:0010457 | centriole-centriole cohesion(GO:0010457) |
| 0.0 | 0.1 | GO:1901673 | regulation of mitotic spindle assembly(GO:1901673) |
| 0.0 | 0.2 | GO:0071763 | nuclear membrane organization(GO:0071763) |
| 0.0 | 0.1 | GO:0046952 | ketone body catabolic process(GO:0046952) |
| 0.0 | 0.1 | GO:1990164 | histone H2A phosphorylation(GO:1990164) |
| 0.0 | 2.7 | GO:0007224 | smoothened signaling pathway(GO:0007224) |
| 0.0 | 0.4 | GO:0032456 | endocytic recycling(GO:0032456) |
| 0.0 | 0.6 | GO:2000785 | regulation of autophagosome assembly(GO:2000785) |
| 0.0 | 1.3 | GO:0000381 | regulation of alternative mRNA splicing, via spliceosome(GO:0000381) |
| 0.0 | 0.1 | GO:0050685 | positive regulation of mRNA processing(GO:0050685) |
| 0.0 | 0.6 | GO:0061512 | protein localization to cilium(GO:0061512) |
| 0.0 | 0.2 | GO:0035897 | proteolysis in other organism(GO:0035897) |
| 0.0 | 0.1 | GO:0034201 | response to oleic acid(GO:0034201) |
| 0.0 | 2.2 | GO:0006521 | regulation of cellular amino acid metabolic process(GO:0006521) |
| 0.0 | 0.1 | GO:1903348 | cellular response to lead ion(GO:0071284) positive regulation of bicellular tight junction assembly(GO:1903348) |
| 0.0 | 0.1 | GO:0007197 | adenylate cyclase-inhibiting G-protein coupled acetylcholine receptor signaling pathway(GO:0007197) phospholipase C-activating G-protein coupled acetylcholine receptor signaling pathway(GO:0007207) |
| 0.0 | 0.7 | GO:0051457 | maintenance of protein location in nucleus(GO:0051457) |
| 0.0 | 0.3 | GO:0032802 | low-density lipoprotein particle receptor catabolic process(GO:0032802) |
| 0.0 | 0.1 | GO:0006423 | cysteinyl-tRNA aminoacylation(GO:0006423) |
| 0.0 | 1.5 | GO:0045600 | positive regulation of fat cell differentiation(GO:0045600) |
| 0.0 | 0.5 | GO:0006895 | Golgi to endosome transport(GO:0006895) |
| 0.0 | 0.9 | GO:0046329 | negative regulation of JNK cascade(GO:0046329) |
| 0.0 | 0.0 | GO:0010887 | negative regulation of cholesterol storage(GO:0010887) |
| 0.0 | 0.4 | GO:0031581 | hemidesmosome assembly(GO:0031581) |
| 0.0 | 0.1 | GO:0010519 | negative regulation of phospholipase activity(GO:0010519) |
| 0.0 | 0.1 | GO:0040016 | embryonic cleavage(GO:0040016) |
| 0.0 | 0.9 | GO:0005980 | glycogen catabolic process(GO:0005980) |
| 0.0 | 0.3 | GO:0000291 | nuclear-transcribed mRNA catabolic process, exonucleolytic(GO:0000291) exonucleolytic nuclear-transcribed mRNA catabolic process involved in deadenylation-dependent decay(GO:0043928) |
| 0.0 | 0.3 | GO:0072332 | intrinsic apoptotic signaling pathway by p53 class mediator(GO:0072332) |
| 0.0 | 0.2 | GO:0043249 | erythrocyte maturation(GO:0043249) |
| 0.0 | 0.1 | GO:0046900 | tetrahydrofolylpolyglutamate metabolic process(GO:0046900) |
| 0.0 | 0.3 | GO:0033689 | negative regulation of osteoblast proliferation(GO:0033689) |
| 0.0 | 0.3 | GO:0048255 | mRNA stabilization(GO:0048255) |
| 0.0 | 0.9 | GO:0010862 | positive regulation of pathway-restricted SMAD protein phosphorylation(GO:0010862) |
| 0.0 | 1.9 | GO:0042035 | regulation of cytokine biosynthetic process(GO:0042035) |
| 0.0 | 0.6 | GO:0045599 | negative regulation of fat cell differentiation(GO:0045599) |
| 0.0 | 0.2 | GO:0032472 | Golgi calcium ion transport(GO:0032472) |
| 0.0 | 0.4 | GO:0002244 | hematopoietic progenitor cell differentiation(GO:0002244) |
| 0.0 | 1.0 | GO:0072583 | clathrin-mediated endocytosis(GO:0072583) |
| 0.0 | 0.3 | GO:0048820 | hair follicle maturation(GO:0048820) |
| 0.0 | 0.3 | GO:1990126 | retrograde transport, endosome to plasma membrane(GO:1990126) |
| 0.0 | 1.6 | GO:0030516 | regulation of axon extension(GO:0030516) |
| 0.0 | 0.6 | GO:0060008 | Sertoli cell differentiation(GO:0060008) |
| 0.0 | 0.1 | GO:0050932 | regulation of pigment cell differentiation(GO:0050932) positive regulation of pigment cell differentiation(GO:0050942) |
| 0.0 | 0.5 | GO:0051016 | barbed-end actin filament capping(GO:0051016) |
| 0.0 | 0.1 | GO:0051495 | positive regulation of cytoskeleton organization(GO:0051495) |
| 0.0 | 0.1 | GO:1903818 | globus pallidus development(GO:0021759) positive regulation of voltage-gated potassium channel activity(GO:1903818) |
| 0.0 | 0.2 | GO:0045199 | maintenance of apical/basal cell polarity(GO:0035090) maintenance of epithelial cell apical/basal polarity(GO:0045199) |
| 0.0 | 0.6 | GO:0006582 | melanin metabolic process(GO:0006582) melanin biosynthetic process(GO:0042438) |
| 0.0 | 0.4 | GO:0007250 | activation of NF-kappaB-inducing kinase activity(GO:0007250) |
| 0.0 | 0.1 | GO:0006425 | glutaminyl-tRNA aminoacylation(GO:0006425) |
| 0.0 | 0.6 | GO:0043968 | histone H2A acetylation(GO:0043968) |
| 0.0 | 0.2 | GO:0006490 | oligosaccharide-lipid intermediate biosynthetic process(GO:0006490) |
| 0.0 | 0.1 | GO:0006049 | UDP-N-acetylglucosamine catabolic process(GO:0006049) |
| 0.0 | 0.3 | GO:0043536 | positive regulation of blood vessel endothelial cell migration(GO:0043536) |
| 0.0 | 0.1 | GO:0009438 | methylglyoxal metabolic process(GO:0009438) |
| 0.0 | 0.4 | GO:0051654 | establishment of mitochondrion localization, microtubule-mediated(GO:0034643) mitochondrion transport along microtubule(GO:0047497) establishment of mitochondrion localization(GO:0051654) |
| 0.0 | 0.3 | GO:0016226 | iron-sulfur cluster assembly(GO:0016226) metallo-sulfur cluster assembly(GO:0031163) |
| 0.0 | 0.5 | GO:0007565 | female pregnancy(GO:0007565) |
| 0.0 | 0.1 | GO:0021633 | optic nerve structural organization(GO:0021633) |
| 0.0 | 0.5 | GO:0034389 | lipid particle organization(GO:0034389) |
| 0.0 | 0.2 | GO:0035269 | protein O-linked mannosylation(GO:0035269) |
| 0.0 | 0.3 | GO:0071850 | mitotic cell cycle arrest(GO:0071850) |
| 0.0 | 0.1 | GO:0048213 | Golgi vesicle prefusion complex stabilization(GO:0048213) |
| 0.0 | 0.2 | GO:0006479 | protein methylation(GO:0006479) protein alkylation(GO:0008213) |
| 0.0 | 0.1 | GO:0035407 | histone H3-T11 phosphorylation(GO:0035407) |
| 0.0 | 2.9 | GO:0002576 | platelet degranulation(GO:0002576) |
| 0.0 | 0.1 | GO:0019249 | lactate biosynthetic process(GO:0019249) |
| 0.0 | 0.2 | GO:0060393 | regulation of pathway-restricted SMAD protein phosphorylation(GO:0060393) |
| 0.0 | 0.1 | GO:1904749 | regulation of protein localization to nucleolus(GO:1904749) |
| 0.0 | 0.5 | GO:0007520 | myoblast fusion(GO:0007520) |
| 0.0 | 0.1 | GO:0032526 | response to retinoic acid(GO:0032526) |
| 0.0 | 0.1 | GO:0048711 | positive regulation of astrocyte differentiation(GO:0048711) |
| 0.0 | 0.2 | GO:0006465 | signal peptide processing(GO:0006465) |
| 0.0 | 0.1 | GO:0006114 | glycerol biosynthetic process(GO:0006114) alditol biosynthetic process(GO:0019401) |
| 0.0 | 0.5 | GO:0001825 | blastocyst formation(GO:0001825) |
| 0.0 | 0.1 | GO:0098789 | pre-mRNA cleavage required for polyadenylation(GO:0098789) |
| 0.0 | 0.2 | GO:0086024 | adrenergic receptor signaling pathway involved in positive regulation of heart rate(GO:0086024) |
| 0.0 | 0.2 | GO:0045591 | positive regulation of regulatory T cell differentiation(GO:0045591) |
| 0.0 | 0.1 | GO:1903025 | regulation of RNA polymerase II regulatory region sequence-specific DNA binding(GO:1903025) |
| 0.0 | 0.0 | GO:0006447 | regulation of translational initiation by iron(GO:0006447) |
| 0.0 | 0.1 | GO:0006552 | leucine catabolic process(GO:0006552) |
| 0.0 | 3.0 | GO:0006888 | ER to Golgi vesicle-mediated transport(GO:0006888) |
| 0.0 | 0.0 | GO:0055089 | fatty acid homeostasis(GO:0055089) |
| 0.0 | 0.2 | GO:0070884 | regulation of calcineurin-NFAT signaling cascade(GO:0070884) |
| 0.0 | 0.3 | GO:0000185 | activation of MAPKKK activity(GO:0000185) |
| 0.0 | 0.1 | GO:0002032 | desensitization of G-protein coupled receptor protein signaling pathway by arrestin(GO:0002032) |
| 0.0 | 0.2 | GO:0043162 | ubiquitin-dependent protein catabolic process via the multivesicular body sorting pathway(GO:0043162) |
| 0.0 | 0.1 | GO:0038180 | nerve growth factor signaling pathway(GO:0038180) |
| 0.0 | 0.2 | GO:2000427 | positive regulation of apoptotic cell clearance(GO:2000427) |
| 0.0 | 0.1 | GO:1900363 | regulation of mRNA polyadenylation(GO:1900363) |
| 0.0 | 0.1 | GO:0017062 | respiratory chain complex III assembly(GO:0017062) mitochondrial respiratory chain complex III assembly(GO:0034551) mitochondrial respiratory chain complex III biogenesis(GO:0097033) |
| 0.0 | 0.1 | GO:1904262 | negative regulation of TORC1 signaling(GO:1904262) |
| 0.0 | 0.1 | GO:0006013 | mannose metabolic process(GO:0006013) |
| 0.0 | 0.6 | GO:0032760 | positive regulation of tumor necrosis factor production(GO:0032760) positive regulation of tumor necrosis factor superfamily cytokine production(GO:1903557) |
| 0.0 | 0.0 | GO:0043353 | enucleate erythrocyte differentiation(GO:0043353) |
| 0.0 | 0.2 | GO:0090189 | regulation of branching involved in ureteric bud morphogenesis(GO:0090189) positive regulation of branching involved in ureteric bud morphogenesis(GO:0090190) |
| 0.0 | 0.2 | GO:0034638 | phosphatidylcholine catabolic process(GO:0034638) |
| 0.0 | 0.7 | GO:0007033 | vacuole organization(GO:0007033) |
| 0.0 | 0.3 | GO:0072661 | protein targeting to plasma membrane(GO:0072661) |
| 0.0 | 0.3 | GO:0061003 | positive regulation of dendritic spine morphogenesis(GO:0061003) |
| 0.0 | 0.1 | GO:0071315 | negative regulation of Wnt protein secretion(GO:0061358) cellular response to morphine(GO:0071315) cellular response to isoquinoline alkaloid(GO:0071317) |
| 0.0 | 0.2 | GO:0060211 | regulation of nuclear-transcribed mRNA poly(A) tail shortening(GO:0060211) positive regulation of nuclear-transcribed mRNA poly(A) tail shortening(GO:0060213) |
| 0.0 | 0.1 | GO:0090344 | negative regulation of cell aging(GO:0090344) |
| 0.0 | 0.1 | GO:2000381 | negative regulation of mesoderm development(GO:2000381) |
| 0.0 | 0.1 | GO:0007173 | epidermal growth factor receptor signaling pathway(GO:0007173) |
| 0.0 | 0.2 | GO:0036507 | protein demannosylation(GO:0036507) protein alpha-1,2-demannosylation(GO:0036508) endoplasmic reticulum mannose trimming(GO:1904380) |
| 0.0 | 0.1 | GO:0009730 | detection of carbohydrate stimulus(GO:0009730) detection of hexose stimulus(GO:0009732) detection of monosaccharide stimulus(GO:0034287) detection of glucose(GO:0051594) |
| 0.0 | 0.1 | GO:0035881 | amacrine cell differentiation(GO:0035881) |
| 0.0 | 0.1 | GO:0036034 | mediator complex assembly(GO:0036034) regulation of mediator complex assembly(GO:2001176) positive regulation of mediator complex assembly(GO:2001178) |
| 0.0 | 1.9 | GO:0007156 | homophilic cell adhesion via plasma membrane adhesion molecules(GO:0007156) |
| 0.0 | 0.3 | GO:0051131 | chaperone-mediated protein complex assembly(GO:0051131) |
| 0.0 | 0.1 | GO:0036500 | ATF6-mediated unfolded protein response(GO:0036500) |
| 0.0 | 0.2 | GO:0071340 | skeletal muscle acetylcholine-gated channel clustering(GO:0071340) |
| 0.0 | 0.4 | GO:0048168 | regulation of neuronal synaptic plasticity(GO:0048168) |
| 0.0 | 0.2 | GO:0050812 | regulation of acetyl-CoA biosynthetic process from pyruvate(GO:0010510) regulation of acyl-CoA biosynthetic process(GO:0050812) |
| 0.0 | 0.2 | GO:0006577 | amino-acid betaine metabolic process(GO:0006577) |
| 0.0 | 0.0 | GO:0071786 | endoplasmic reticulum tubular network organization(GO:0071786) |
| 0.0 | 0.9 | GO:0018107 | peptidyl-threonine phosphorylation(GO:0018107) |
| 0.0 | 0.0 | GO:0060967 | negative regulation of posttranscriptional gene silencing(GO:0060149) negative regulation of gene silencing by miRNA(GO:0060965) negative regulation of gene silencing by RNA(GO:0060967) |
| 0.0 | 0.1 | GO:0006782 | protoporphyrinogen IX biosynthetic process(GO:0006782) |
| 0.0 | 0.1 | GO:0045161 | neuronal ion channel clustering(GO:0045161) |
| 0.0 | 0.0 | GO:0071557 | histone H3-K27 demethylation(GO:0071557) |
| 0.0 | 0.0 | GO:0016127 | cholesterol catabolic process(GO:0006707) sterol catabolic process(GO:0016127) |
| 0.0 | 0.2 | GO:0033141 | positive regulation of peptidyl-serine phosphorylation of STAT protein(GO:0033141) |
| 0.0 | 0.1 | GO:0016559 | peroxisome fission(GO:0016559) |
| 0.0 | 0.1 | GO:0071218 | cellular response to misfolded protein(GO:0071218) |
| 0.0 | 0.0 | GO:0048743 | positive regulation of skeletal muscle fiber development(GO:0048743) |
| 0.0 | 0.1 | GO:0009137 | purine nucleoside diphosphate catabolic process(GO:0009137) purine ribonucleoside diphosphate catabolic process(GO:0009181) |
| 0.0 | 0.1 | GO:2000251 | positive regulation of actin cytoskeleton reorganization(GO:2000251) |
| 0.0 | 0.0 | GO:0061537 | glycine secretion(GO:0061536) glycine secretion, neurotransmission(GO:0061537) |
| 0.0 | 0.6 | GO:1901264 | carbohydrate derivative transport(GO:1901264) |
| 0.0 | 0.1 | GO:1904659 | hexose transmembrane transport(GO:0035428) glucose transmembrane transport(GO:1904659) |