Project
A549 cells infected with IAV Analysis Results (GEO series: GSE147507)
Navigation
Downloads
Results for MYB
Z-value: 3.43
Motif logo

Transcription factors associated with MYB
| Gene Symbol | Gene ID | Gene Info |
|---|---|---|
|
MYB
|
ENSG00000118513.14 | MYB proto-oncogene, transcription factor |
Activity-expression correlation:
| Gene | Promoter | Pearson corr. coef. | P-value | Plot |
|---|---|---|---|---|
| MYB | hg19_v2_chr6_+_135502466_135502489 | 0.87 | 1.3e-01 | Click! |
Activity profile of MYB motif
Sorted Z-values of MYB motif
| Promoter | Log-likelihood | Transcript | Gene | Gene Info |
|---|---|---|---|---|
| chr12_-_57914275 | 2.28 |
ENST00000547303.1
ENST00000552740.1 ENST00000547526.1 ENST00000551116.1 ENST00000346473.3 |
DDIT3
|
DNA-damage-inducible transcript 3 |
| chr7_-_127032114 | 1.82 |
ENST00000436992.1
|
ZNF800
|
zinc finger protein 800 |
| chr3_-_88108192 | 1.75 |
ENST00000309534.6
|
CGGBP1
|
CGG triplet repeat binding protein 1 |
| chr13_-_52026730 | 1.72 |
ENST00000420668.2
|
INTS6
|
integrator complex subunit 6 |
| chr5_-_176937351 | 1.64 |
ENST00000377112.4
ENST00000501403.2 ENST00000312943.6 |
DOK3
|
docking protein 3 |
| chr17_-_34207295 | 1.44 |
ENST00000463941.1
ENST00000293272.3 |
CCL5
|
chemokine (C-C motif) ligand 5 |
| chr21_+_44394742 | 1.42 |
ENST00000432907.2
|
PKNOX1
|
PBX/knotted 1 homeobox 1 |
| chr2_+_29033682 | 1.41 |
ENST00000379579.4
ENST00000334056.5 ENST00000449210.1 |
SPDYA
|
speedy/RINGO cell cycle regulator family member A |
| chrX_+_102965835 | 1.37 |
ENST00000319560.6
|
TMEM31
|
transmembrane protein 31 |
| chr1_-_85156090 | 1.29 |
ENST00000605755.1
ENST00000437941.2 |
SSX2IP
|
synovial sarcoma, X breakpoint 2 interacting protein |
| chr7_+_65338312 | 1.21 |
ENST00000434382.2
|
VKORC1L1
|
vitamin K epoxide reductase complex, subunit 1-like 1 |
| chr1_+_154947126 | 1.18 |
ENST00000368439.1
|
CKS1B
|
CDC28 protein kinase regulatory subunit 1B |
| chr1_-_85156216 | 1.17 |
ENST00000342203.3
ENST00000370612.4 |
SSX2IP
|
synovial sarcoma, X breakpoint 2 interacting protein |
| chr19_+_47104553 | 1.15 |
ENST00000598871.1
ENST00000594523.1 |
CALM3
|
calmodulin 3 (phosphorylase kinase, delta) |
| chr17_+_18647326 | 1.13 |
ENST00000395667.1
ENST00000395665.4 ENST00000308799.4 ENST00000301938.4 |
FBXW10
|
F-box and WD repeat domain containing 10 |
| chr9_+_131219179 | 1.12 |
ENST00000372791.3
|
ODF2
|
outer dense fiber of sperm tails 2 |
| chr7_-_151217166 | 1.07 |
ENST00000496004.1
|
RHEB
|
Ras homolog enriched in brain |
| chr4_+_44019074 | 1.06 |
ENST00000512678.1
|
RP11-328N19.1
|
RP11-328N19.1 |
| chr13_+_21714913 | 1.05 |
ENST00000450573.1
ENST00000467636.1 |
SAP18
|
Sin3A-associated protein, 18kDa |
| chr1_-_100598444 | 1.03 |
ENST00000535161.1
ENST00000287482.5 |
SASS6
|
spindle assembly 6 homolog (C. elegans) |
| chr6_+_167412835 | 1.00 |
ENST00000349556.4
|
FGFR1OP
|
FGFR1 oncogene partner |
| chr8_+_17780346 | 1.00 |
ENST00000325083.8
|
PCM1
|
pericentriolar material 1 |
| chr19_+_2164173 | 0.98 |
ENST00000452696.1
|
DOT1L
|
DOT1-like histone H3K79 methyltransferase |
| chr1_-_68962744 | 0.94 |
ENST00000525124.1
|
DEPDC1
|
DEP domain containing 1 |
| chr4_-_4291761 | 0.93 |
ENST00000513174.1
|
LYAR
|
Ly1 antibody reactive |
| chr8_+_17780483 | 0.91 |
ENST00000517730.1
ENST00000518537.1 ENST00000523055.1 ENST00000519253.1 |
PCM1
|
pericentriolar material 1 |
| chr18_+_268148 | 0.91 |
ENST00000581677.1
|
RP11-705O1.8
|
RP11-705O1.8 |
| chr19_-_3029011 | 0.91 |
ENST00000590536.1
ENST00000587137.1 ENST00000455444.2 ENST00000262953.6 |
TLE2
|
transducin-like enhancer of split 2 (E(sp1) homolog, Drosophila) |
| chr10_+_15001430 | 0.90 |
ENST00000407572.1
|
MEIG1
|
meiosis/spermiogenesis associated 1 |
| chr11_-_130184470 | 0.89 |
ENST00000357899.4
ENST00000397753.1 |
ZBTB44
|
zinc finger and BTB domain containing 44 |
| chr11_+_34073757 | 0.89 |
ENST00000532820.1
|
CAPRIN1
|
cell cycle associated protein 1 |
| chr8_+_67782984 | 0.88 |
ENST00000396592.3
ENST00000422365.2 ENST00000492775.1 |
MCMDC2
|
minichromosome maintenance domain containing 2 |
| chr2_+_196521903 | 0.88 |
ENST00000541054.1
|
SLC39A10
|
solute carrier family 39 (zinc transporter), member 10 |
| chr8_-_71519889 | 0.87 |
ENST00000521425.1
|
TRAM1
|
translocation associated membrane protein 1 |
| chr14_+_54863682 | 0.87 |
ENST00000543789.2
ENST00000442975.2 ENST00000458126.2 ENST00000556102.2 |
CDKN3
|
cyclin-dependent kinase inhibitor 3 |
| chr2_-_61245363 | 0.87 |
ENST00000316752.6
|
PUS10
|
pseudouridylate synthase 10 |
| chr17_-_58499766 | 0.87 |
ENST00000588898.1
|
USP32
|
ubiquitin specific peptidase 32 |
| chr14_+_54863667 | 0.86 |
ENST00000335183.6
|
CDKN3
|
cyclin-dependent kinase inhibitor 3 |
| chr11_+_34073872 | 0.86 |
ENST00000530820.1
|
CAPRIN1
|
cell cycle associated protein 1 |
| chrX_+_23682379 | 0.85 |
ENST00000379349.1
|
PRDX4
|
peroxiredoxin 4 |
| chr2_-_61244550 | 0.85 |
ENST00000421319.1
|
PUS10
|
pseudouridylate synthase 10 |
| chr17_-_73781567 | 0.84 |
ENST00000586607.1
|
H3F3B
|
H3 histone, family 3B (H3.3B) |
| chr9_+_4679555 | 0.84 |
ENST00000381858.1
ENST00000381854.3 |
CDC37L1
|
cell division cycle 37-like 1 |
| chr8_+_136470270 | 0.84 |
ENST00000524199.1
|
KHDRBS3
|
KH domain containing, RNA binding, signal transduction associated 3 |
| chr19_-_12251130 | 0.83 |
ENST00000418866.1
ENST00000600335.1 |
ZNF20
|
zinc finger protein 20 |
| chr17_-_49198095 | 0.82 |
ENST00000505279.1
|
SPAG9
|
sperm associated antigen 9 |
| chr10_-_98347063 | 0.80 |
ENST00000443638.1
|
TM9SF3
|
transmembrane 9 superfamily member 3 |
| chr2_-_55277692 | 0.80 |
ENST00000394611.2
|
RTN4
|
reticulon 4 |
| chr8_+_96145974 | 0.80 |
ENST00000315367.3
|
PLEKHF2
|
pleckstrin homology domain containing, family F (with FYVE domain) member 2 |
| chr11_+_34073269 | 0.80 |
ENST00000389645.3
|
CAPRIN1
|
cell cycle associated protein 1 |
| chr11_+_18433840 | 0.79 |
ENST00000541669.1
ENST00000280704.4 |
LDHC
|
lactate dehydrogenase C |
| chr14_+_94640633 | 0.79 |
ENST00000304338.3
|
PPP4R4
|
protein phosphatase 4, regulatory subunit 4 |
| chr10_+_32735177 | 0.78 |
ENST00000545067.1
|
CCDC7
|
coiled-coil domain containing 7 |
| chrX_-_129299638 | 0.78 |
ENST00000535724.1
ENST00000346424.2 |
AIFM1
|
apoptosis-inducing factor, mitochondrion-associated, 1 |
| chr11_+_34073195 | 0.77 |
ENST00000341394.4
|
CAPRIN1
|
cell cycle associated protein 1 |
| chr19_+_1103936 | 0.77 |
ENST00000354171.8
ENST00000589115.1 |
GPX4
|
glutathione peroxidase 4 |
| chr12_+_100967420 | 0.77 |
ENST00000266754.5
ENST00000547754.1 |
GAS2L3
|
growth arrest-specific 2 like 3 |
| chr2_-_176866978 | 0.75 |
ENST00000392540.2
ENST00000409660.1 ENST00000544803.1 ENST00000272748.4 |
KIAA1715
|
KIAA1715 |
| chr10_+_116697946 | 0.74 |
ENST00000298746.3
|
TRUB1
|
TruB pseudouridine (psi) synthase family member 1 |
| chr1_+_154947148 | 0.74 |
ENST00000368436.1
ENST00000308987.5 |
CKS1B
|
CDC28 protein kinase regulatory subunit 1B |
| chr21_-_46237883 | 0.74 |
ENST00000397893.3
|
SUMO3
|
small ubiquitin-like modifier 3 |
| chr14_+_23791159 | 0.74 |
ENST00000557702.1
|
PABPN1
|
poly(A) binding protein, nuclear 1 |
| chr8_+_66556936 | 0.73 |
ENST00000262146.4
|
MTFR1
|
mitochondrial fission regulator 1 |
| chr8_-_101964265 | 0.72 |
ENST00000395958.2
|
YWHAZ
|
tyrosine 3-monooxygenase/tryptophan 5-monooxygenase activation protein, zeta |
| chr6_-_89827720 | 0.72 |
ENST00000452027.2
|
SRSF12
|
serine/arginine-rich splicing factor 12 |
| chr16_-_81110683 | 0.70 |
ENST00000565253.1
ENST00000378611.4 ENST00000299578.5 |
C16orf46
|
chromosome 16 open reading frame 46 |
| chr22_-_22090043 | 0.70 |
ENST00000403503.1
|
YPEL1
|
yippee-like 1 (Drosophila) |
| chr1_+_156308403 | 0.70 |
ENST00000481479.1
ENST00000368252.1 ENST00000466306.1 ENST00000368251.1 |
TSACC
|
TSSK6 activating co-chaperone |
| chr7_-_72992663 | 0.70 |
ENST00000432538.1
|
TBL2
|
transducin (beta)-like 2 |
| chr5_+_151151504 | 0.69 |
ENST00000356245.3
ENST00000507878.2 |
G3BP1
|
GTPase activating protein (SH3 domain) binding protein 1 |
| chr14_+_96968802 | 0.69 |
ENST00000556619.1
ENST00000392990.2 |
PAPOLA
|
poly(A) polymerase alpha |
| chr5_-_149669192 | 0.69 |
ENST00000398376.3
|
CAMK2A
|
calcium/calmodulin-dependent protein kinase II alpha |
| chr1_+_172502336 | 0.69 |
ENST00000263688.3
|
SUCO
|
SUN domain containing ossification factor |
| chr17_-_40264321 | 0.69 |
ENST00000430773.1
ENST00000413196.2 |
DHX58
|
DEXH (Asp-Glu-X-His) box polypeptide 58 |
| chr16_+_19535133 | 0.68 |
ENST00000396212.2
ENST00000381396.5 |
CCP110
|
centriolar coiled coil protein 110kDa |
| chr16_-_58163299 | 0.68 |
ENST00000262498.3
|
C16orf80
|
chromosome 16 open reading frame 80 |
| chr4_+_159593418 | 0.68 |
ENST00000507475.1
ENST00000307738.5 |
ETFDH
|
electron-transferring-flavoprotein dehydrogenase |
| chr19_-_10305302 | 0.68 |
ENST00000592054.1
|
DNMT1
|
DNA (cytosine-5-)-methyltransferase 1 |
| chr17_+_42733803 | 0.68 |
ENST00000409122.2
|
C17orf104
|
chromosome 17 open reading frame 104 |
| chr8_-_101734170 | 0.68 |
ENST00000522387.1
ENST00000518196.1 |
PABPC1
|
poly(A) binding protein, cytoplasmic 1 |
| chr18_-_6929829 | 0.67 |
ENST00000583840.1
ENST00000581571.1 ENST00000578497.1 ENST00000579012.1 |
LINC00668
|
long intergenic non-protein coding RNA 668 |
| chr10_-_46167722 | 0.67 |
ENST00000374366.3
ENST00000344646.5 |
ZFAND4
|
zinc finger, AN1-type domain 4 |
| chr22_-_41252962 | 0.66 |
ENST00000216218.3
|
ST13
|
suppression of tumorigenicity 13 (colon carcinoma) (Hsp70 interacting protein) |
| chr2_-_38830030 | 0.66 |
ENST00000410076.1
|
HNRNPLL
|
heterogeneous nuclear ribonucleoprotein L-like |
| chr18_+_19192228 | 0.66 |
ENST00000300413.5
ENST00000579618.1 ENST00000582475.1 |
SNRPD1
|
small nuclear ribonucleoprotein D1 polypeptide 16kDa |
| chr4_-_141348763 | 0.65 |
ENST00000509477.1
|
CLGN
|
calmegin |
| chr7_+_157129738 | 0.65 |
ENST00000437030.1
|
DNAJB6
|
DnaJ (Hsp40) homolog, subfamily B, member 6 |
| chr19_+_33210645 | 0.65 |
ENST00000444215.2
|
TDRD12
|
tudor domain containing 12 |
| chr17_+_40950797 | 0.65 |
ENST00000588408.1
ENST00000585355.1 |
CNTD1
|
cyclin N-terminal domain containing 1 |
| chr8_+_67976593 | 0.65 |
ENST00000262210.5
ENST00000412460.1 |
CSPP1
|
centrosome and spindle pole associated protein 1 |
| chr7_+_48075108 | 0.65 |
ENST00000420324.1
ENST00000435376.1 ENST00000430738.1 ENST00000348904.3 ENST00000539619.1 |
C7orf57
|
chromosome 7 open reading frame 57 |
| chr17_+_8339340 | 0.65 |
ENST00000580012.1
|
NDEL1
|
nudE neurodevelopment protein 1-like 1 |
| chr5_+_68665608 | 0.65 |
ENST00000509734.1
ENST00000354868.5 ENST00000521422.1 ENST00000354312.3 ENST00000345306.6 |
RAD17
|
RAD17 homolog (S. pombe) |
| chr1_-_211848899 | 0.64 |
ENST00000366998.3
ENST00000540251.1 ENST00000366999.4 |
NEK2
|
NIMA-related kinase 2 |
| chr1_+_179851893 | 0.64 |
ENST00000531630.2
|
TOR1AIP1
|
torsin A interacting protein 1 |
| chr19_-_47104118 | 0.64 |
ENST00000593888.1
ENST00000602017.1 |
AC011551.3
PPP5D1
|
Uncharacterized protein PPP5 tetratricopeptide repeat domain containing 1 |
| chr1_-_156307992 | 0.63 |
ENST00000415548.1
|
CCT3
|
chaperonin containing TCP1, subunit 3 (gamma) |
| chr21_-_15755446 | 0.63 |
ENST00000544452.1
ENST00000285667.3 |
HSPA13
|
heat shock protein 70kDa family, member 13 |
| chr6_-_41040195 | 0.62 |
ENST00000463088.1
ENST00000469104.1 ENST00000486443.1 |
OARD1
|
O-acyl-ADP-ribose deacylase 1 |
| chr14_-_92572894 | 0.62 |
ENST00000532032.1
ENST00000506466.1 ENST00000555381.1 ENST00000557311.1 ENST00000554592.1 ENST00000554672.1 ENST00000553491.1 ENST00000556220.1 ENST00000502250.1 ENST00000503767.1 ENST00000393287.5 ENST00000340660.6 ENST00000545170.1 ENST00000429774.2 |
ATXN3
|
ataxin 3 |
| chr12_-_10875831 | 0.62 |
ENST00000279550.7
ENST00000228251.4 |
YBX3
|
Y box binding protein 3 |
| chr3_-_121379739 | 0.62 |
ENST00000428394.2
ENST00000314583.3 |
HCLS1
|
hematopoietic cell-specific Lyn substrate 1 |
| chr1_+_174969262 | 0.61 |
ENST00000406752.1
ENST00000405362.1 |
CACYBP
|
calcyclin binding protein |
| chr11_-_130184555 | 0.61 |
ENST00000525842.1
|
ZBTB44
|
zinc finger and BTB domain containing 44 |
| chr10_+_32735030 | 0.61 |
ENST00000277657.6
ENST00000362006.5 |
CCDC7
|
coiled-coil domain containing 7 |
| chr2_+_196521845 | 0.60 |
ENST00000359634.5
ENST00000412905.1 |
SLC39A10
|
solute carrier family 39 (zinc transporter), member 10 |
| chr7_-_151217001 | 0.60 |
ENST00000262187.5
|
RHEB
|
Ras homolog enriched in brain |
| chr2_-_55277436 | 0.60 |
ENST00000354474.6
|
RTN4
|
reticulon 4 |
| chr13_-_50510434 | 0.60 |
ENST00000361840.3
|
SPRYD7
|
SPRY domain containing 7 |
| chr6_+_126112001 | 0.59 |
ENST00000392477.2
|
NCOA7
|
nuclear receptor coactivator 7 |
| chr20_-_58508702 | 0.59 |
ENST00000357552.3
ENST00000425931.1 |
SYCP2
|
synaptonemal complex protein 2 |
| chr14_+_54863739 | 0.59 |
ENST00000541304.1
|
CDKN3
|
cyclin-dependent kinase inhibitor 3 |
| chr8_+_96146168 | 0.59 |
ENST00000519516.1
|
PLEKHF2
|
pleckstrin homology domain containing, family F (with FYVE domain) member 2 |
| chr4_-_141348789 | 0.59 |
ENST00000414773.1
|
CLGN
|
calmegin |
| chr17_+_8339164 | 0.59 |
ENST00000582665.1
ENST00000334527.7 ENST00000299734.7 |
NDEL1
|
nudE neurodevelopment protein 1-like 1 |
| chr6_+_126112074 | 0.58 |
ENST00000453302.1
ENST00000417494.1 ENST00000229634.9 |
NCOA7
|
nuclear receptor coactivator 7 |
| chr21_-_43430440 | 0.58 |
ENST00000398505.3
ENST00000310826.5 ENST00000449949.1 ENST00000398499.1 ENST00000398497.2 ENST00000398511.3 |
ZBTB21
|
zinc finger and BTB domain containing 21 |
| chr1_-_26232522 | 0.58 |
ENST00000399728.1
|
STMN1
|
stathmin 1 |
| chrX_-_102941596 | 0.58 |
ENST00000441076.2
ENST00000422355.1 ENST00000442614.1 ENST00000422154.2 ENST00000451301.1 |
MORF4L2
|
mortality factor 4 like 2 |
| chr10_+_103912137 | 0.58 |
ENST00000603742.1
ENST00000488254.2 ENST00000461421.1 ENST00000476468.1 ENST00000370007.5 |
NOLC1
|
nucleolar and coiled-body phosphoprotein 1 |
| chr22_-_23922410 | 0.58 |
ENST00000249053.3
|
IGLL1
|
immunoglobulin lambda-like polypeptide 1 |
| chr14_+_89029366 | 0.58 |
ENST00000555799.1
ENST00000555755.1 ENST00000393514.5 |
ZC3H14
|
zinc finger CCCH-type containing 14 |
| chr9_-_123639304 | 0.57 |
ENST00000436309.1
|
PHF19
|
PHD finger protein 19 |
| chr16_-_46865286 | 0.57 |
ENST00000285697.4
|
C16orf87
|
chromosome 16 open reading frame 87 |
| chr3_-_128712955 | 0.57 |
ENST00000265068.5
|
KIAA1257
|
KIAA1257 |
| chr12_-_57081940 | 0.57 |
ENST00000436399.2
|
PTGES3
|
prostaglandin E synthase 3 (cytosolic) |
| chrX_-_135333514 | 0.57 |
ENST00000370661.1
ENST00000370660.3 |
MAP7D3
|
MAP7 domain containing 3 |
| chr19_-_39826639 | 0.57 |
ENST00000602185.1
ENST00000598034.1 ENST00000601387.1 ENST00000595636.1 ENST00000253054.8 ENST00000594700.1 ENST00000597595.1 |
GMFG
|
glia maturation factor, gamma |
| chr17_+_33914424 | 0.56 |
ENST00000590432.1
|
AP2B1
|
adaptor-related protein complex 2, beta 1 subunit |
| chr16_+_71392616 | 0.56 |
ENST00000349553.5
ENST00000302628.4 ENST00000562305.1 |
CALB2
|
calbindin 2 |
| chr13_-_52027134 | 0.56 |
ENST00000311234.4
ENST00000425000.1 ENST00000463928.1 ENST00000442263.3 ENST00000398119.2 |
INTS6
|
integrator complex subunit 6 |
| chr11_-_67276100 | 0.56 |
ENST00000301488.3
|
CDK2AP2
|
cyclin-dependent kinase 2 associated protein 2 |
| chr3_+_160117418 | 0.56 |
ENST00000465903.1
ENST00000485645.1 ENST00000360111.2 ENST00000472991.1 ENST00000467468.1 ENST00000469762.1 ENST00000489573.1 ENST00000462787.1 ENST00000490207.1 ENST00000485867.1 |
SMC4
|
structural maintenance of chromosomes 4 |
| chr7_+_157130214 | 0.55 |
ENST00000412557.1
ENST00000453383.1 |
DNAJB6
|
DnaJ (Hsp40) homolog, subfamily B, member 6 |
| chr6_+_167412665 | 0.55 |
ENST00000366847.4
|
FGFR1OP
|
FGFR1 oncogene partner |
| chr7_-_72993033 | 0.55 |
ENST00000305632.5
|
TBL2
|
transducin (beta)-like 2 |
| chr2_-_128784846 | 0.55 |
ENST00000259235.3
ENST00000357702.5 ENST00000424298.1 |
SAP130
|
Sin3A-associated protein, 130kDa |
| chr6_-_13711773 | 0.55 |
ENST00000011619.3
|
RANBP9
|
RAN binding protein 9 |
| chr17_+_42733730 | 0.55 |
ENST00000359945.3
ENST00000425535.1 |
C17orf104
|
chromosome 17 open reading frame 104 |
| chr2_-_128785619 | 0.55 |
ENST00000450957.1
|
SAP130
|
Sin3A-associated protein, 130kDa |
| chr8_-_71520513 | 0.54 |
ENST00000262213.2
ENST00000536748.1 ENST00000518678.1 |
TRAM1
|
translocation associated membrane protein 1 |
| chr17_+_72199721 | 0.54 |
ENST00000439590.2
ENST00000311111.6 ENST00000584577.1 ENST00000534490.1 ENST00000528433.2 ENST00000533498.1 |
RPL38
|
ribosomal protein L38 |
| chr18_+_56338618 | 0.54 |
ENST00000348428.3
|
MALT1
|
mucosa associated lymphoid tissue lymphoma translocation gene 1 |
| chr4_-_156298028 | 0.54 |
ENST00000433024.1
ENST00000379248.2 |
MAP9
|
microtubule-associated protein 9 |
| chr13_+_49822041 | 0.54 |
ENST00000538056.1
ENST00000251108.6 ENST00000444959.1 ENST00000429346.1 |
CDADC1
|
cytidine and dCMP deaminase domain containing 1 |
| chr2_-_111435610 | 0.54 |
ENST00000447014.1
ENST00000420328.1 ENST00000535254.1 ENST00000409311.1 ENST00000302759.6 |
BUB1
|
BUB1 mitotic checkpoint serine/threonine kinase |
| chr10_+_31608054 | 0.54 |
ENST00000320985.10
ENST00000361642.5 ENST00000560721.2 ENST00000558440.1 ENST00000424869.1 ENST00000542815.3 |
ZEB1
|
zinc finger E-box binding homeobox 1 |
| chr10_+_92980517 | 0.54 |
ENST00000336126.5
|
PCGF5
|
polycomb group ring finger 5 |
| chr19_-_14224969 | 0.54 |
ENST00000589994.1
|
PRKACA
|
protein kinase, cAMP-dependent, catalytic, alpha |
| chr2_+_9346892 | 0.54 |
ENST00000281419.3
ENST00000315273.4 |
ASAP2
|
ArfGAP with SH3 domain, ankyrin repeat and PH domain 2 |
| chr3_-_123680246 | 0.54 |
ENST00000488653.2
|
CCDC14
|
coiled-coil domain containing 14 |
| chr7_-_123174610 | 0.54 |
ENST00000324698.6
ENST00000434450.1 |
IQUB
|
IQ motif and ubiquitin domain containing |
| chr21_-_46237959 | 0.53 |
ENST00000397898.3
ENST00000411651.2 |
SUMO3
|
small ubiquitin-like modifier 3 |
| chr11_-_68519026 | 0.53 |
ENST00000255087.5
|
MTL5
|
metallothionein-like 5, testis-specific (tesmin) |
| chr1_+_43148059 | 0.53 |
ENST00000321358.7
ENST00000332220.6 |
YBX1
|
Y box binding protein 1 |
| chr10_-_64028466 | 0.53 |
ENST00000395265.1
ENST00000373789.3 ENST00000395260.3 |
RTKN2
|
rhotekin 2 |
| chr1_-_114301755 | 0.53 |
ENST00000393357.2
ENST00000369596.2 ENST00000446739.1 |
PHTF1
|
putative homeodomain transcription factor 1 |
| chr14_+_89029336 | 0.53 |
ENST00000556945.1
ENST00000556158.1 ENST00000557607.1 |
ZC3H14
|
zinc finger CCCH-type containing 14 |
| chr7_+_74072288 | 0.53 |
ENST00000443166.1
|
GTF2I
|
general transcription factor IIi |
| chr1_+_178694408 | 0.52 |
ENST00000324778.5
|
RALGPS2
|
Ral GEF with PH domain and SH3 binding motif 2 |
| chr10_-_92617437 | 0.52 |
ENST00000336152.3
ENST00000277874.6 ENST00000371719.2 |
HTR7
|
5-hydroxytryptamine (serotonin) receptor 7, adenylate cyclase-coupled |
| chr2_+_201390843 | 0.52 |
ENST00000357799.4
ENST00000409203.3 |
SGOL2
|
shugoshin-like 2 (S. pombe) |
| chr19_+_18726786 | 0.52 |
ENST00000594709.1
|
TMEM59L
|
transmembrane protein 59-like |
| chr4_-_159592996 | 0.52 |
ENST00000508457.1
|
C4orf46
|
chromosome 4 open reading frame 46 |
| chr14_+_65007177 | 0.52 |
ENST00000247207.6
|
HSPA2
|
heat shock 70kDa protein 2 |
| chr11_+_85566422 | 0.51 |
ENST00000342404.3
|
CCDC83
|
coiled-coil domain containing 83 |
| chr1_-_38061522 | 0.51 |
ENST00000373062.3
|
GNL2
|
guanine nucleotide binding protein-like 2 (nucleolar) |
| chr1_+_29213678 | 0.51 |
ENST00000347529.3
|
EPB41
|
erythrocyte membrane protein band 4.1 (elliptocytosis 1, RH-linked) |
| chr13_+_25670268 | 0.51 |
ENST00000281589.3
|
PABPC3
|
poly(A) binding protein, cytoplasmic 3 |
| chr17_-_7197881 | 0.50 |
ENST00000007699.5
|
YBX2
|
Y box binding protein 2 |
| chr15_-_93965805 | 0.50 |
ENST00000556708.1
|
RP11-164C12.2
|
RP11-164C12.2 |
| chr2_+_242254679 | 0.50 |
ENST00000428282.1
ENST00000360051.3 |
SEPT2
|
septin 2 |
| chr2_+_202316392 | 0.50 |
ENST00000194530.3
ENST00000392249.2 |
STRADB
|
STE20-related kinase adaptor beta |
| chr16_-_18418092 | 0.50 |
ENST00000545050.1
|
NPIPA8
|
nuclear pore complex interacting protein family, member A8 |
| chr3_+_113667354 | 0.50 |
ENST00000491556.1
|
ZDHHC23
|
zinc finger, DHHC-type containing 23 |
| chr1_-_85155939 | 0.50 |
ENST00000603677.1
|
SSX2IP
|
synovial sarcoma, X breakpoint 2 interacting protein |
| chr20_+_48599506 | 0.49 |
ENST00000244050.2
|
SNAI1
|
snail family zinc finger 1 |
| chr14_+_77564701 | 0.49 |
ENST00000557115.1
|
KIAA1737
|
CLOCK-interacting pacemaker |
| chr18_+_34409069 | 0.49 |
ENST00000543923.1
ENST00000280020.5 ENST00000435985.2 ENST00000592521.1 ENST00000587139.1 |
KIAA1328
|
KIAA1328 |
| chr8_+_182368 | 0.49 |
ENST00000522866.1
ENST00000398612.1 |
ZNF596
|
zinc finger protein 596 |
| chr1_-_68962805 | 0.49 |
ENST00000370966.5
|
DEPDC1
|
DEP domain containing 1 |
| chr1_+_52195542 | 0.49 |
ENST00000462759.1
ENST00000486942.1 |
OSBPL9
|
oxysterol binding protein-like 9 |
| chr11_+_8040739 | 0.49 |
ENST00000534099.1
|
TUB
|
tubby bipartite transcription factor |
| chr12_+_120933904 | 0.49 |
ENST00000550178.1
ENST00000550845.1 ENST00000549989.1 ENST00000552870.1 |
DYNLL1
|
dynein, light chain, LC8-type 1 |
| chr1_+_162602244 | 0.49 |
ENST00000367922.3
ENST00000367921.3 |
DDR2
|
discoidin domain receptor tyrosine kinase 2 |
| chr1_-_226187013 | 0.49 |
ENST00000272091.7
|
SDE2
|
SDE2 telomere maintenance homolog (S. pombe) |
| chr1_+_184020811 | 0.49 |
ENST00000361641.1
|
TSEN15
|
TSEN15 tRNA splicing endonuclease subunit |
| chr6_+_64282447 | 0.49 |
ENST00000370650.2
ENST00000578299.1 |
PTP4A1
|
protein tyrosine phosphatase type IVA, member 1 |
| chr14_+_21785693 | 0.48 |
ENST00000382933.4
ENST00000557351.1 |
RPGRIP1
|
retinitis pigmentosa GTPase regulator interacting protein 1 |
| chr10_-_101945771 | 0.48 |
ENST00000370408.2
ENST00000407654.3 |
ERLIN1
|
ER lipid raft associated 1 |
| chr3_+_113775594 | 0.48 |
ENST00000479882.1
ENST00000493014.1 |
QTRTD1
|
queuine tRNA-ribosyltransferase domain containing 1 |
| chr5_-_157079428 | 0.48 |
ENST00000265007.6
|
SOX30
|
SRY (sex determining region Y)-box 30 |
| chr3_+_31574189 | 0.48 |
ENST00000295770.2
|
STT3B
|
STT3B, subunit of the oligosaccharyltransferase complex (catalytic) |
| chr12_+_100967533 | 0.47 |
ENST00000550295.1
|
GAS2L3
|
growth arrest-specific 2 like 3 |
| chr16_-_28222797 | 0.47 |
ENST00000569951.1
ENST00000565698.1 |
XPO6
|
exportin 6 |
| chr18_-_268019 | 0.47 |
ENST00000261600.6
|
THOC1
|
THO complex 1 |
| chr13_+_113863858 | 0.47 |
ENST00000375440.4
|
CUL4A
|
cullin 4A |
| chr8_-_101734308 | 0.47 |
ENST00000519004.1
ENST00000519363.1 ENST00000520142.1 |
PABPC1
|
poly(A) binding protein, cytoplasmic 1 |
| chr1_+_48688357 | 0.47 |
ENST00000533824.1
ENST00000438567.2 ENST00000236495.5 ENST00000420136.2 |
SLC5A9
|
solute carrier family 5 (sodium/sugar cotransporter), member 9 |
| chr2_-_46385 | 0.47 |
ENST00000327669.4
|
FAM110C
|
family with sequence similarity 110, member C |
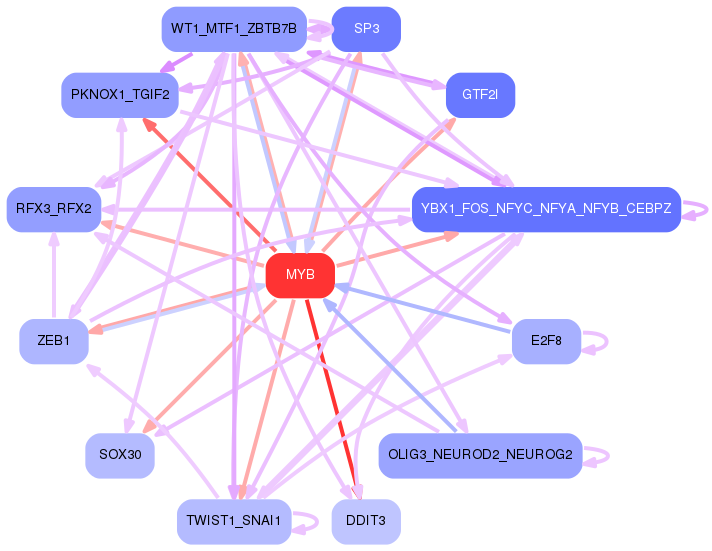
Network of associatons between targets according to the STRING database.

First level regulatory network of MYB
Gene Ontology Analysis
Gene overrepresentation in biological_process category:
| Log-likelihood per target | Total log-likelihood | Term | Description |
|---|---|---|---|
| 0.5 | 1.4 | GO:0033634 | positive regulation of cell-cell adhesion mediated by integrin(GO:0033634) |
| 0.4 | 2.8 | GO:1903026 | negative regulation of RNA polymerase II regulatory region sequence-specific DNA binding(GO:1903026) |
| 0.3 | 0.6 | GO:0032467 | positive regulation of cytokinesis(GO:0032467) |
| 0.3 | 1.6 | GO:1903615 | regulation of protein tyrosine phosphatase activity(GO:1903613) positive regulation of protein tyrosine phosphatase activity(GO:1903615) |
| 0.3 | 1.5 | GO:0032470 | positive regulation of endoplasmic reticulum calcium ion concentration(GO:0032470) |
| 0.3 | 0.9 | GO:1990918 | double-strand break repair involved in meiotic recombination(GO:1990918) |
| 0.3 | 1.1 | GO:0032053 | ciliary basal body organization(GO:0032053) |
| 0.3 | 0.8 | GO:1903566 | positive regulation of protein localization to cilium(GO:1903566) |
| 0.3 | 0.8 | GO:0019516 | lactate oxidation(GO:0019516) |
| 0.2 | 0.7 | GO:0097198 | cell migration involved in vasculogenesis(GO:0035441) histone H3-K36 trimethylation(GO:0097198) |
| 0.2 | 1.0 | GO:0090598 | male genitalia morphogenesis(GO:0048808) male anatomical structure morphogenesis(GO:0090598) |
| 0.2 | 0.7 | GO:1990481 | mRNA pseudouridine synthesis(GO:1990481) |
| 0.2 | 0.7 | GO:1904247 | positive regulation of polynucleotide adenylyltransferase activity(GO:1904247) |
| 0.2 | 1.9 | GO:0022027 | interkinetic nuclear migration(GO:0022027) |
| 0.2 | 0.7 | GO:0006147 | guanine catabolic process(GO:0006147) |
| 0.2 | 0.9 | GO:2000255 | negative regulation of male germ cell proliferation(GO:2000255) |
| 0.2 | 0.6 | GO:0048210 | Golgi vesicle fusion to target membrane(GO:0048210) |
| 0.2 | 0.2 | GO:0010636 | positive regulation of mitochondrial fusion(GO:0010636) |
| 0.2 | 0.6 | GO:0016260 | selenocysteine biosynthetic process(GO:0016260) |
| 0.2 | 0.9 | GO:0001923 | B-1 B cell differentiation(GO:0001923) |
| 0.2 | 1.6 | GO:0099590 | neurotransmitter receptor internalization(GO:0099590) |
| 0.2 | 1.1 | GO:0090074 | negative regulation of protein homodimerization activity(GO:0090074) |
| 0.2 | 0.5 | GO:0090091 | positive regulation of extracellular matrix disassembly(GO:0090091) |
| 0.2 | 1.8 | GO:0071787 | endoplasmic reticulum tubular network assembly(GO:0071787) |
| 0.2 | 0.2 | GO:0060623 | regulation of chromosome condensation(GO:0060623) |
| 0.2 | 1.1 | GO:0090650 | response to oxygen-glucose deprivation(GO:0090649) cellular response to oxygen-glucose deprivation(GO:0090650) |
| 0.2 | 1.2 | GO:0032484 | Ral protein signal transduction(GO:0032484) regulation of Ral protein signal transduction(GO:0032485) |
| 0.1 | 1.2 | GO:0071453 | cellular response to decreased oxygen levels(GO:0036294) cellular response to oxygen levels(GO:0071453) |
| 0.1 | 0.4 | GO:0021718 | superior olivary nucleus development(GO:0021718) superior olivary nucleus maturation(GO:0021722) |
| 0.1 | 1.7 | GO:2000074 | regulation of type B pancreatic cell development(GO:2000074) |
| 0.1 | 0.7 | GO:0039534 | negative regulation of MDA-5 signaling pathway(GO:0039534) |
| 0.1 | 2.5 | GO:2000574 | regulation of microtubule motor activity(GO:2000574) |
| 0.1 | 1.9 | GO:0071763 | nuclear membrane organization(GO:0071763) |
| 0.1 | 0.4 | GO:0051102 | DNA ligation involved in DNA recombination(GO:0051102) |
| 0.1 | 0.5 | GO:0051754 | meiotic sister chromatid cohesion, centromeric(GO:0051754) |
| 0.1 | 0.4 | GO:1901301 | regulation of cargo loading into COPII-coated vesicle(GO:1901301) |
| 0.1 | 0.4 | GO:0043012 | regulation of fusion of sperm to egg plasma membrane(GO:0043012) |
| 0.1 | 0.5 | GO:0009386 | translational attenuation(GO:0009386) |
| 0.1 | 0.4 | GO:0098939 | dendritic transport of mitochondrion(GO:0098939) anterograde dendritic transport of mitochondrion(GO:0098972) |
| 0.1 | 3.0 | GO:0035020 | regulation of Rac protein signal transduction(GO:0035020) |
| 0.1 | 0.6 | GO:0001831 | trophectodermal cellular morphogenesis(GO:0001831) |
| 0.1 | 0.4 | GO:1990051 | activation of protein kinase C activity(GO:1990051) |
| 0.1 | 2.0 | GO:0070389 | chaperone cofactor-dependent protein refolding(GO:0070389) |
| 0.1 | 0.6 | GO:1904693 | midbrain morphogenesis(GO:1904693) |
| 0.1 | 0.2 | GO:0042727 | flavin-containing compound biosynthetic process(GO:0042727) |
| 0.1 | 0.4 | GO:0043634 | polyadenylation-dependent ncRNA catabolic process(GO:0043634) |
| 0.1 | 0.5 | GO:0035668 | TRAM-dependent toll-like receptor signaling pathway(GO:0035668) TRAM-dependent toll-like receptor 4 signaling pathway(GO:0035669) |
| 0.1 | 1.4 | GO:0042373 | vitamin K metabolic process(GO:0042373) |
| 0.1 | 1.2 | GO:0031119 | tRNA pseudouridine synthesis(GO:0031119) |
| 0.1 | 0.4 | GO:1990167 | protein K27-linked deubiquitination(GO:1990167) protein K33-linked deubiquitination(GO:1990168) |
| 0.1 | 0.4 | GO:0031133 | cellular magnesium ion homeostasis(GO:0010961) regulation of axon diameter(GO:0031133) |
| 0.1 | 1.0 | GO:0060715 | syncytiotrophoblast cell differentiation involved in labyrinthine layer development(GO:0060715) |
| 0.1 | 0.9 | GO:0000710 | meiotic mismatch repair(GO:0000710) |
| 0.1 | 0.5 | GO:0014886 | transition between slow and fast fiber(GO:0014886) |
| 0.1 | 3.1 | GO:0016180 | snRNA processing(GO:0016180) |
| 0.1 | 0.4 | GO:0072299 | negative regulation of metanephric glomerulus development(GO:0072299) negative regulation of metanephric glomerular mesangial cell proliferation(GO:0072302) |
| 0.1 | 0.3 | GO:0007198 | adenylate cyclase-inhibiting serotonin receptor signaling pathway(GO:0007198) |
| 0.1 | 0.4 | GO:1900535 | medium-chain fatty-acyl-CoA catabolic process(GO:0036114) long-chain fatty-acyl-CoA catabolic process(GO:0036116) palmitic acid metabolic process(GO:1900533) palmitic acid biosynthetic process(GO:1900535) |
| 0.1 | 0.4 | GO:1905123 | regulation of endosome organization(GO:1904978) regulation of glucosylceramidase activity(GO:1905123) |
| 0.1 | 0.9 | GO:0090309 | positive regulation of methylation-dependent chromatin silencing(GO:0090309) |
| 0.1 | 2.0 | GO:0046602 | regulation of mitotic centrosome separation(GO:0046602) |
| 0.1 | 0.3 | GO:1904562 | phosphatidylinositol 5-phosphate metabolic process(GO:1904562) |
| 0.1 | 0.5 | GO:0043686 | co-translational protein modification(GO:0043686) |
| 0.1 | 0.5 | GO:0045829 | negative regulation of isotype switching(GO:0045829) |
| 0.1 | 0.2 | GO:0048936 | peripheral nervous system neuron axonogenesis(GO:0048936) |
| 0.1 | 0.4 | GO:0097010 | eukaryotic translation initiation factor 4F complex assembly(GO:0097010) |
| 0.1 | 0.8 | GO:0000395 | mRNA 5'-splice site recognition(GO:0000395) |
| 0.1 | 1.0 | GO:2000623 | regulation of nuclear-transcribed mRNA catabolic process, nonsense-mediated decay(GO:2000622) negative regulation of nuclear-transcribed mRNA catabolic process, nonsense-mediated decay(GO:2000623) |
| 0.1 | 0.1 | GO:0060285 | cilium-dependent cell motility(GO:0060285) |
| 0.1 | 0.1 | GO:0046833 | positive regulation of RNA export from nucleus(GO:0046833) |
| 0.1 | 0.6 | GO:1905098 | negative regulation of guanyl-nucleotide exchange factor activity(GO:1905098) |
| 0.1 | 0.2 | GO:0072387 | flavin adenine dinucleotide metabolic process(GO:0072387) |
| 0.1 | 3.3 | GO:0061003 | positive regulation of dendritic spine morphogenesis(GO:0061003) |
| 0.1 | 0.8 | GO:0051013 | microtubule severing(GO:0051013) |
| 0.1 | 0.5 | GO:0060800 | regulation of cell differentiation involved in embryonic placenta development(GO:0060800) |
| 0.1 | 0.4 | GO:0007621 | negative regulation of female receptivity(GO:0007621) |
| 0.1 | 0.1 | GO:1900195 | positive regulation of oocyte maturation(GO:1900195) |
| 0.1 | 0.2 | GO:0080154 | regulation of fertilization(GO:0080154) |
| 0.1 | 0.9 | GO:0007000 | nucleolus organization(GO:0007000) |
| 0.1 | 0.5 | GO:0034729 | histone H3-K79 methylation(GO:0034729) |
| 0.1 | 1.9 | GO:0031441 | negative regulation of mRNA 3'-end processing(GO:0031441) |
| 0.1 | 0.3 | GO:0060151 | peroxisome localization(GO:0060151) microtubule-based peroxisome localization(GO:0060152) |
| 0.1 | 0.6 | GO:0007028 | cytoplasm organization(GO:0007028) |
| 0.1 | 0.1 | GO:0000720 | pyrimidine dimer repair by nucleotide-excision repair(GO:0000720) |
| 0.1 | 0.5 | GO:0070966 | nuclear-transcribed mRNA catabolic process, no-go decay(GO:0070966) |
| 0.1 | 0.9 | GO:0033314 | mitotic DNA replication checkpoint(GO:0033314) |
| 0.1 | 0.5 | GO:0045541 | negative regulation of cholesterol biosynthetic process(GO:0045541) negative regulation of cholesterol metabolic process(GO:0090206) |
| 0.1 | 0.5 | GO:2000819 | regulation of nucleotide-excision repair(GO:2000819) |
| 0.1 | 0.5 | GO:0048752 | semicircular canal morphogenesis(GO:0048752) |
| 0.1 | 0.3 | GO:0036292 | DNA rewinding(GO:0036292) |
| 0.1 | 0.2 | GO:2000864 | estrogen secretion(GO:0035937) estradiol secretion(GO:0035938) regulation of estrogen secretion(GO:2000861) regulation of estradiol secretion(GO:2000864) |
| 0.1 | 0.1 | GO:0061535 | glutamate secretion, neurotransmission(GO:0061535) |
| 0.1 | 0.2 | GO:0090308 | regulation of methylation-dependent chromatin silencing(GO:0090308) |
| 0.1 | 3.7 | GO:0045737 | positive regulation of cyclin-dependent protein serine/threonine kinase activity(GO:0045737) |
| 0.1 | 0.2 | GO:1901994 | meiotic cell cycle phase transition(GO:0044771) regulation of meiotic cell cycle phase transition(GO:1901993) negative regulation of meiotic cell cycle phase transition(GO:1901994) |
| 0.1 | 0.9 | GO:0061179 | negative regulation of insulin secretion involved in cellular response to glucose stimulus(GO:0061179) |
| 0.1 | 0.2 | GO:1904772 | hepatocyte homeostasis(GO:0036333) response to tetrachloromethane(GO:1904772) |
| 0.1 | 0.6 | GO:1904327 | protein localization to cytosolic proteasome complex(GO:1904327) protein localization to cytosolic proteasome complex involved in ERAD pathway(GO:1904379) |
| 0.1 | 0.2 | GO:2000564 | CD8-positive, alpha-beta T cell proliferation(GO:0035740) regulation of CD8-positive, alpha-beta T cell proliferation(GO:2000564) |
| 0.1 | 0.6 | GO:0030854 | positive regulation of granulocyte differentiation(GO:0030854) |
| 0.1 | 0.6 | GO:1903546 | protein localization to photoreceptor outer segment(GO:1903546) |
| 0.1 | 0.3 | GO:0018057 | peptidyl-lysine oxidation(GO:0018057) |
| 0.1 | 0.5 | GO:0007288 | sperm axoneme assembly(GO:0007288) |
| 0.1 | 0.4 | GO:0034154 | toll-like receptor 7 signaling pathway(GO:0034154) |
| 0.1 | 1.0 | GO:0034384 | high-density lipoprotein particle clearance(GO:0034384) |
| 0.1 | 0.5 | GO:0048318 | axial mesoderm development(GO:0048318) |
| 0.1 | 0.3 | GO:1902534 | single-organism membrane invagination(GO:1902534) |
| 0.1 | 0.4 | GO:0035469 | determination of pancreatic left/right asymmetry(GO:0035469) determination of liver left/right asymmetry(GO:0071910) |
| 0.1 | 1.3 | GO:1902083 | negative regulation of peptidyl-cysteine S-nitrosylation(GO:1902083) |
| 0.1 | 0.9 | GO:0001675 | acrosome assembly(GO:0001675) |
| 0.1 | 0.3 | GO:0006172 | ADP biosynthetic process(GO:0006172) |
| 0.1 | 0.3 | GO:0045629 | negative regulation of T-helper 2 cell differentiation(GO:0045629) |
| 0.1 | 0.8 | GO:0007099 | centriole replication(GO:0007099) centriole assembly(GO:0098534) |
| 0.1 | 0.2 | GO:0035281 | pre-miRNA export from nucleus(GO:0035281) |
| 0.1 | 0.3 | GO:0050882 | voluntary musculoskeletal movement(GO:0050882) |
| 0.1 | 0.6 | GO:2000767 | positive regulation of cytoplasmic translation(GO:2000767) |
| 0.1 | 3.1 | GO:0035036 | sperm-egg recognition(GO:0035036) |
| 0.1 | 0.7 | GO:1902455 | negative regulation of stem cell population maintenance(GO:1902455) |
| 0.1 | 1.9 | GO:0034453 | microtubule anchoring(GO:0034453) |
| 0.1 | 0.1 | GO:0071393 | cellular response to progesterone stimulus(GO:0071393) |
| 0.1 | 0.2 | GO:0018076 | N-terminal peptidyl-lysine acetylation(GO:0018076) |
| 0.1 | 0.4 | GO:0043353 | enucleate erythrocyte differentiation(GO:0043353) |
| 0.1 | 0.7 | GO:0038166 | angiotensin-activated signaling pathway(GO:0038166) |
| 0.1 | 0.2 | GO:0044376 | RNA polymerase II complex import to nucleus(GO:0044376) RNA polymerase III complex localization to nucleus(GO:1990022) |
| 0.1 | 0.1 | GO:0097676 | histone H3-K36 dimethylation(GO:0097676) |
| 0.1 | 0.6 | GO:0046477 | glycosylceramide catabolic process(GO:0046477) |
| 0.0 | 0.2 | GO:1901490 | positive regulation of vascular endothelial growth factor signaling pathway(GO:1900748) regulation of lymphangiogenesis(GO:1901490) |
| 0.0 | 0.2 | GO:1904884 | telomerase catalytic core complex assembly(GO:1904868) regulation of telomerase catalytic core complex assembly(GO:1904882) positive regulation of telomerase catalytic core complex assembly(GO:1904884) |
| 0.0 | 0.2 | GO:0046010 | positive regulation of circadian sleep/wake cycle, non-REM sleep(GO:0046010) |
| 0.0 | 0.5 | GO:1903608 | protein localization to cytoplasmic stress granule(GO:1903608) |
| 0.0 | 0.2 | GO:0042412 | cysteine catabolic process(GO:0009093) L-cysteine catabolic process(GO:0019448) taurine biosynthetic process(GO:0042412) L-cysteine metabolic process(GO:0046439) |
| 0.0 | 0.9 | GO:0033539 | fatty acid beta-oxidation using acyl-CoA dehydrogenase(GO:0033539) |
| 0.0 | 0.2 | GO:0001807 | regulation of type IV hypersensitivity(GO:0001807) negative regulation of type IV hypersensitivity(GO:0001808) |
| 0.0 | 0.5 | GO:0006398 | mRNA 3'-end processing by stem-loop binding and cleavage(GO:0006398) |
| 0.0 | 0.2 | GO:0009236 | cobalamin biosynthetic process(GO:0009236) |
| 0.0 | 0.1 | GO:1901976 | regulation of cell cycle checkpoint(GO:1901976) regulation of DNA damage checkpoint(GO:2000001) |
| 0.0 | 0.4 | GO:0061739 | protein lipidation involved in autophagosome assembly(GO:0061739) |
| 0.0 | 0.6 | GO:0032781 | positive regulation of ATPase activity(GO:0032781) |
| 0.0 | 0.2 | GO:2000977 | regulation of primitive erythrocyte differentiation(GO:0010725) eosinophil differentiation(GO:0030222) eosinophil fate commitment(GO:0035854) regulation of forebrain neuron differentiation(GO:2000977) |
| 0.0 | 0.9 | GO:0006388 | tRNA splicing, via endonucleolytic cleavage and ligation(GO:0006388) |
| 0.0 | 0.3 | GO:0097577 | intracellular sequestering of iron ion(GO:0006880) sequestering of iron ion(GO:0097577) |
| 0.0 | 0.5 | GO:2000324 | positive regulation of glucocorticoid receptor signaling pathway(GO:2000324) |
| 0.0 | 0.3 | GO:0051106 | positive regulation of DNA ligation(GO:0051106) |
| 0.0 | 0.4 | GO:0040032 | post-embryonic body morphogenesis(GO:0040032) |
| 0.0 | 0.0 | GO:0006288 | base-excision repair, DNA ligation(GO:0006288) |
| 0.0 | 0.2 | GO:0042713 | sperm ejaculation(GO:0042713) Sertoli cell proliferation(GO:0060011) |
| 0.0 | 0.3 | GO:0061624 | fructose catabolic process(GO:0006001) fructose catabolic process to hydroxyacetone phosphate and glyceraldehyde-3-phosphate(GO:0061624) |
| 0.0 | 0.6 | GO:0006002 | fructose 6-phosphate metabolic process(GO:0006002) |
| 0.0 | 0.4 | GO:0030242 | pexophagy(GO:0030242) |
| 0.0 | 0.1 | GO:1904339 | positive regulation of cell fate specification(GO:0042660) regulation of heart induction(GO:0090381) regulation of heart induction by canonical Wnt signaling pathway(GO:0100012) negative regulation of dopaminergic neuron differentiation(GO:1904339) |
| 0.0 | 0.1 | GO:0006106 | fumarate metabolic process(GO:0006106) aspartate catabolic process(GO:0006533) |
| 0.0 | 0.2 | GO:1902525 | regulation of protein monoubiquitination(GO:1902525) |
| 0.0 | 0.4 | GO:0000492 | box C/D snoRNP assembly(GO:0000492) |
| 0.0 | 0.5 | GO:2000680 | rubidium ion transport(GO:0035826) regulation of rubidium ion transport(GO:2000680) |
| 0.0 | 0.8 | GO:0032515 | negative regulation of phosphoprotein phosphatase activity(GO:0032515) |
| 0.0 | 0.2 | GO:0006696 | ergosterol biosynthetic process(GO:0006696) ergosterol metabolic process(GO:0008204) |
| 0.0 | 0.1 | GO:1903564 | regulation of protein localization to cilium(GO:1903564) |
| 0.0 | 0.5 | GO:0070294 | renal sodium ion absorption(GO:0070294) |
| 0.0 | 0.2 | GO:0060282 | positive regulation of oocyte development(GO:0060282) |
| 0.0 | 0.4 | GO:0035583 | sequestering of TGFbeta in extracellular matrix(GO:0035583) |
| 0.0 | 0.7 | GO:0051988 | regulation of attachment of spindle microtubules to kinetochore(GO:0051988) |
| 0.0 | 0.2 | GO:0060180 | female mating behavior(GO:0060180) |
| 0.0 | 0.4 | GO:0050966 | detection of mechanical stimulus involved in sensory perception of pain(GO:0050966) |
| 0.0 | 0.3 | GO:0051725 | protein de-ADP-ribosylation(GO:0051725) |
| 0.0 | 0.3 | GO:0045204 | MAPK export from nucleus(GO:0045204) |
| 0.0 | 0.1 | GO:0061300 | cerebellum vasculature development(GO:0061300) |
| 0.0 | 0.5 | GO:0007020 | microtubule nucleation(GO:0007020) |
| 0.0 | 0.2 | GO:0035026 | leading edge cell differentiation(GO:0035026) |
| 0.0 | 1.1 | GO:0032967 | positive regulation of collagen metabolic process(GO:0010714) positive regulation of collagen biosynthetic process(GO:0032967) positive regulation of multicellular organismal metabolic process(GO:0044253) |
| 0.0 | 0.9 | GO:2000810 | regulation of bicellular tight junction assembly(GO:2000810) |
| 0.0 | 0.2 | GO:0035865 | cellular response to potassium ion(GO:0035865) |
| 0.0 | 0.2 | GO:0070914 | UV-damage excision repair(GO:0070914) |
| 0.0 | 0.2 | GO:2001034 | positive regulation of double-strand break repair via nonhomologous end joining(GO:2001034) |
| 0.0 | 0.4 | GO:0035721 | intraciliary retrograde transport(GO:0035721) |
| 0.0 | 0.2 | GO:0048619 | embryonic hindgut morphogenesis(GO:0048619) |
| 0.0 | 0.4 | GO:0001561 | fatty acid alpha-oxidation(GO:0001561) |
| 0.0 | 0.2 | GO:2000035 | regulation of stem cell division(GO:2000035) |
| 0.0 | 0.4 | GO:0042487 | regulation of odontogenesis of dentin-containing tooth(GO:0042487) |
| 0.0 | 0.2 | GO:0097029 | mature conventional dendritic cell differentiation(GO:0097029) |
| 0.0 | 0.1 | GO:0010193 | response to ozone(GO:0010193) |
| 0.0 | 0.2 | GO:0046668 | regulation of retinal cell programmed cell death(GO:0046668) |
| 0.0 | 1.3 | GO:0035735 | intraciliary transport involved in cilium morphogenesis(GO:0035735) |
| 0.0 | 0.2 | GO:2000373 | regulation of DNA topoisomerase (ATP-hydrolyzing) activity(GO:2000371) positive regulation of DNA topoisomerase (ATP-hydrolyzing) activity(GO:2000373) |
| 0.0 | 0.8 | GO:1904776 | regulation of protein localization to cell cortex(GO:1904776) positive regulation of protein localization to cell cortex(GO:1904778) |
| 0.0 | 1.2 | GO:0006378 | mRNA polyadenylation(GO:0006378) |
| 0.0 | 0.3 | GO:0030299 | intestinal cholesterol absorption(GO:0030299) intestinal lipid absorption(GO:0098856) |
| 0.0 | 0.3 | GO:1901029 | negative regulation of mitochondrial outer membrane permeabilization involved in apoptotic signaling pathway(GO:1901029) |
| 0.0 | 0.4 | GO:0032025 | response to cobalt ion(GO:0032025) |
| 0.0 | 0.2 | GO:0061055 | myotome development(GO:0061055) |
| 0.0 | 0.6 | GO:0045116 | protein neddylation(GO:0045116) |
| 0.0 | 0.3 | GO:0098789 | pre-mRNA cleavage required for polyadenylation(GO:0098789) positive regulation of RNA binding(GO:1905216) |
| 0.0 | 0.2 | GO:1904751 | positive regulation of protein localization to nucleolus(GO:1904751) |
| 0.0 | 0.5 | GO:0035372 | protein localization to microtubule(GO:0035372) |
| 0.0 | 0.4 | GO:0003351 | epithelial cilium movement(GO:0003351) |
| 0.0 | 0.3 | GO:0007130 | synaptonemal complex assembly(GO:0007130) synaptonemal complex organization(GO:0070193) |
| 0.0 | 1.2 | GO:0042769 | DNA damage response, detection of DNA damage(GO:0042769) |
| 0.0 | 1.6 | GO:0070911 | global genome nucleotide-excision repair(GO:0070911) |
| 0.0 | 0.2 | GO:2000670 | positive regulation of dendritic cell apoptotic process(GO:2000670) |
| 0.0 | 0.4 | GO:0090084 | negative regulation of inclusion body assembly(GO:0090084) |
| 0.0 | 0.1 | GO:0019626 | short-chain fatty acid catabolic process(GO:0019626) |
| 0.0 | 0.1 | GO:0035723 | interleukin-15-mediated signaling pathway(GO:0035723) cellular response to interleukin-15(GO:0071350) |
| 0.0 | 0.3 | GO:0003341 | cilium movement(GO:0003341) |
| 0.0 | 0.6 | GO:0010172 | embryonic body morphogenesis(GO:0010172) |
| 0.0 | 0.2 | GO:0032625 | interleukin-21 production(GO:0032625) interleukin-21 secretion(GO:0072619) |
| 0.0 | 0.3 | GO:0019054 | modulation by virus of host process(GO:0019054) |
| 0.0 | 0.4 | GO:0060965 | negative regulation of gene silencing by miRNA(GO:0060965) |
| 0.0 | 2.1 | GO:0090307 | mitotic spindle assembly(GO:0090307) |
| 0.0 | 0.2 | GO:0006269 | DNA replication, synthesis of RNA primer(GO:0006269) |
| 0.0 | 0.3 | GO:0016075 | rRNA catabolic process(GO:0016075) |
| 0.0 | 0.9 | GO:0043968 | histone H2A acetylation(GO:0043968) |
| 0.0 | 2.0 | GO:0021762 | substantia nigra development(GO:0021762) |
| 0.0 | 0.1 | GO:0071629 | cytoplasm-associated proteasomal ubiquitin-dependent protein catabolic process(GO:0071629) |
| 0.0 | 0.5 | GO:0006910 | phagocytosis, recognition(GO:0006910) |
| 0.0 | 0.1 | GO:1901222 | regulation of NIK/NF-kappaB signaling(GO:1901222) |
| 0.0 | 0.2 | GO:0042276 | error-prone translesion synthesis(GO:0042276) |
| 0.0 | 0.5 | GO:0090161 | Golgi ribbon formation(GO:0090161) |
| 0.0 | 0.3 | GO:1904153 | negative regulation of protein exit from endoplasmic reticulum(GO:0070862) negative regulation of retrograde protein transport, ER to cytosol(GO:1904153) |
| 0.0 | 0.6 | GO:0019511 | peptidyl-proline hydroxylation(GO:0019511) |
| 0.0 | 0.9 | GO:0048025 | negative regulation of mRNA splicing, via spliceosome(GO:0048025) |
| 0.0 | 0.2 | GO:1901098 | positive regulation of autophagosome maturation(GO:1901098) |
| 0.0 | 0.4 | GO:0007158 | neuron cell-cell adhesion(GO:0007158) |
| 0.0 | 0.1 | GO:0051012 | microtubule sliding(GO:0051012) |
| 0.0 | 0.6 | GO:0051014 | actin filament severing(GO:0051014) |
| 0.0 | 0.3 | GO:0070166 | enamel mineralization(GO:0070166) |
| 0.0 | 0.6 | GO:0006986 | response to unfolded protein(GO:0006986) |
| 0.0 | 0.2 | GO:0035494 | SNARE complex disassembly(GO:0035494) |
| 0.0 | 1.1 | GO:0031122 | cytoplasmic microtubule organization(GO:0031122) |
| 0.0 | 0.3 | GO:0035092 | sperm chromatin condensation(GO:0035092) |
| 0.0 | 0.8 | GO:0070286 | axonemal dynein complex assembly(GO:0070286) |
| 0.0 | 0.3 | GO:0030336 | negative regulation of cell migration(GO:0030336) |
| 0.0 | 0.2 | GO:1903288 | regulation of potassium ion import(GO:1903286) positive regulation of potassium ion import(GO:1903288) |
| 0.0 | 0.0 | GO:0007060 | male meiosis chromosome segregation(GO:0007060) |
| 0.0 | 0.4 | GO:2001241 | positive regulation of extrinsic apoptotic signaling pathway in absence of ligand(GO:2001241) |
| 0.0 | 0.3 | GO:0033211 | adiponectin-activated signaling pathway(GO:0033211) |
| 0.0 | 0.4 | GO:0043248 | proteasome assembly(GO:0043248) |
| 0.0 | 0.5 | GO:0035970 | peptidyl-threonine dephosphorylation(GO:0035970) |
| 0.0 | 0.2 | GO:0000389 | mRNA 3'-splice site recognition(GO:0000389) |
| 0.0 | 0.1 | GO:0009098 | branched-chain amino acid biosynthetic process(GO:0009082) leucine biosynthetic process(GO:0009098) valine biosynthetic process(GO:0009099) |
| 0.0 | 0.3 | GO:0048280 | vesicle fusion with Golgi apparatus(GO:0048280) |
| 0.0 | 0.5 | GO:0035563 | positive regulation of chromatin binding(GO:0035563) |
| 0.0 | 0.1 | GO:2000048 | negative regulation of cell-cell adhesion mediated by cadherin(GO:2000048) |
| 0.0 | 0.1 | GO:0072429 | response to intra-S DNA damage checkpoint signaling(GO:0072429) |
| 0.0 | 0.4 | GO:0002741 | positive regulation of cytokine secretion involved in immune response(GO:0002741) |
| 0.0 | 0.5 | GO:0048026 | positive regulation of mRNA splicing, via spliceosome(GO:0048026) |
| 0.0 | 0.1 | GO:1903435 | positive regulation of constitutive secretory pathway(GO:1903435) |
| 0.0 | 0.1 | GO:0035148 | tube formation(GO:0035148) |
| 0.0 | 3.2 | GO:0035335 | peptidyl-tyrosine dephosphorylation(GO:0035335) |
| 0.0 | 1.4 | GO:0000226 | microtubule cytoskeleton organization(GO:0000226) |
| 0.0 | 0.4 | GO:0007638 | mechanosensory behavior(GO:0007638) |
| 0.0 | 0.3 | GO:0015866 | ADP transport(GO:0015866) |
| 0.0 | 0.2 | GO:0000712 | resolution of meiotic recombination intermediates(GO:0000712) |
| 0.0 | 0.7 | GO:0035825 | reciprocal meiotic recombination(GO:0007131) reciprocal DNA recombination(GO:0035825) |
| 0.0 | 0.1 | GO:1901907 | diadenosine polyphosphate catabolic process(GO:0015961) diphosphoinositol polyphosphate metabolic process(GO:0071543) diadenosine pentaphosphate metabolic process(GO:1901906) diadenosine pentaphosphate catabolic process(GO:1901907) diadenosine hexaphosphate metabolic process(GO:1901908) diadenosine hexaphosphate catabolic process(GO:1901909) adenosine 5'-(hexahydrogen pentaphosphate) metabolic process(GO:1901910) adenosine 5'-(hexahydrogen pentaphosphate) catabolic process(GO:1901911) |
| 0.0 | 0.2 | GO:0000819 | sister chromatid segregation(GO:0000819) |
| 0.0 | 0.1 | GO:0032971 | regulation of muscle filament sliding(GO:0032971) |
| 0.0 | 0.6 | GO:0007140 | male meiosis(GO:0007140) |
| 0.0 | 1.3 | GO:0000289 | nuclear-transcribed mRNA poly(A) tail shortening(GO:0000289) |
| 0.0 | 0.3 | GO:0030308 | negative regulation of cell growth(GO:0030308) |
| 0.0 | 0.5 | GO:0016601 | Rac protein signal transduction(GO:0016601) |
| 0.0 | 0.9 | GO:1904837 | beta-catenin-TCF complex assembly(GO:1904837) |
| 0.0 | 0.3 | GO:0046085 | adenosine metabolic process(GO:0046085) |
| 0.0 | 0.2 | GO:0035871 | protein K11-linked deubiquitination(GO:0035871) |
| 0.0 | 0.2 | GO:0070131 | positive regulation of mitochondrial translation(GO:0070131) |
| 0.0 | 0.2 | GO:0098535 | de novo centriole assembly(GO:0098535) |
| 0.0 | 0.2 | GO:1903025 | regulation of RNA polymerase II regulatory region sequence-specific DNA binding(GO:1903025) |
| 0.0 | 0.2 | GO:0032790 | ribosome disassembly(GO:0032790) |
| 0.0 | 0.2 | GO:0002291 | T cell activation via T cell receptor contact with antigen bound to MHC molecule on antigen presenting cell(GO:0002291) |
| 0.0 | 0.4 | GO:0071542 | dopaminergic neuron differentiation(GO:0071542) |
| 0.0 | 0.2 | GO:2000271 | positive regulation of fibroblast apoptotic process(GO:2000271) |
| 0.0 | 0.2 | GO:1904667 | negative regulation of ubiquitin-protein ligase activity involved in mitotic cell cycle(GO:0051436) positive regulation of ubiquitin-protein ligase activity involved in regulation of mitotic cell cycle transition(GO:0051437) regulation of ubiquitin-protein ligase activity involved in mitotic cell cycle(GO:0051439) negative regulation of ubiquitin protein ligase activity(GO:1904667) |
| 0.0 | 0.5 | GO:0042462 | eye photoreceptor cell development(GO:0042462) |
| 0.0 | 0.2 | GO:0016926 | protein desumoylation(GO:0016926) |
| 0.0 | 0.2 | GO:0021960 | anterior commissure morphogenesis(GO:0021960) |
| 0.0 | 0.5 | GO:0016578 | histone deubiquitination(GO:0016578) |
| 0.0 | 0.1 | GO:1900063 | regulation of peroxisome organization(GO:1900063) |
| 0.0 | 0.1 | GO:2000323 | glucocorticoid secretion(GO:0035933) regulation of glucocorticoid receptor signaling pathway(GO:2000322) negative regulation of glucocorticoid receptor signaling pathway(GO:2000323) regulation of glucocorticoid secretion(GO:2000849) |
| 0.0 | 0.3 | GO:0000715 | protein deneddylation(GO:0000338) nucleotide-excision repair, DNA damage recognition(GO:0000715) |
| 0.0 | 0.1 | GO:1902952 | positive regulation of dendritic spine maintenance(GO:1902952) |
| 0.0 | 0.4 | GO:2000369 | regulation of clathrin-mediated endocytosis(GO:2000369) |
| 0.0 | 0.1 | GO:0048165 | ovarian cumulus expansion(GO:0001550) fused antrum stage(GO:0048165) |
| 0.0 | 0.3 | GO:0003094 | glomerular filtration(GO:0003094) |
| 0.0 | 0.9 | GO:0006891 | intra-Golgi vesicle-mediated transport(GO:0006891) |
| 0.0 | 0.1 | GO:0001828 | inner cell mass cellular morphogenesis(GO:0001828) |
| 0.0 | 0.0 | GO:0051097 | negative regulation of helicase activity(GO:0051097) |
| 0.0 | 0.1 | GO:0006290 | pyrimidine dimer repair(GO:0006290) |
| 0.0 | 0.1 | GO:0010603 | regulation of cytoplasmic mRNA processing body assembly(GO:0010603) |
| 0.0 | 1.2 | GO:0018279 | protein N-linked glycosylation via asparagine(GO:0018279) |
| 0.0 | 0.2 | GO:0000463 | maturation of LSU-rRNA from tricistronic rRNA transcript (SSU-rRNA, 5.8S rRNA, LSU-rRNA)(GO:0000463) |
| 0.0 | 0.7 | GO:0006699 | bile acid biosynthetic process(GO:0006699) |
| 0.0 | 0.5 | GO:1904659 | hexose transmembrane transport(GO:0035428) glucose transmembrane transport(GO:1904659) |
| 0.0 | 0.1 | GO:0035799 | ureter maturation(GO:0035799) |
| 0.0 | 0.3 | GO:0050855 | regulation of B cell receptor signaling pathway(GO:0050855) |
| 0.0 | 0.1 | GO:0060539 | diaphragm development(GO:0060539) |
| 0.0 | 0.2 | GO:1902894 | negative regulation of pri-miRNA transcription from RNA polymerase II promoter(GO:1902894) |
| 0.0 | 0.1 | GO:0021564 | vagus nerve development(GO:0021564) |
| 0.0 | 0.2 | GO:0032688 | negative regulation of interferon-beta production(GO:0032688) |
| 0.0 | 0.1 | GO:0031339 | negative regulation of vesicle fusion(GO:0031339) |
| 0.0 | 0.2 | GO:0035306 | positive regulation of dephosphorylation(GO:0035306) positive regulation of protein dephosphorylation(GO:0035307) |
| 0.0 | 0.2 | GO:0002643 | regulation of tolerance induction(GO:0002643) |
| 0.0 | 0.1 | GO:0039663 | fusion of virus membrane with host plasma membrane(GO:0019064) membrane fusion involved in viral entry into host cell(GO:0039663) multi-organism membrane fusion(GO:0044800) |
| 0.0 | 0.4 | GO:0000271 | polysaccharide biosynthetic process(GO:0000271) |
| 0.0 | 0.7 | GO:0000266 | mitochondrial fission(GO:0000266) |
| 0.0 | 0.2 | GO:1904380 | endoplasmic reticulum mannose trimming(GO:1904380) |
| 0.0 | 0.0 | GO:0045773 | positive regulation of axon extension(GO:0045773) |
| 0.0 | 0.1 | GO:0010032 | meiotic chromosome condensation(GO:0010032) |
| 0.0 | 0.3 | GO:0006646 | phosphatidylethanolamine biosynthetic process(GO:0006646) |
| 0.0 | 0.3 | GO:0097435 | fibril organization(GO:0097435) |
| 0.0 | 0.2 | GO:0050832 | defense response to fungus(GO:0050832) |
| 0.0 | 0.2 | GO:0007096 | regulation of exit from mitosis(GO:0007096) |
| 0.0 | 0.3 | GO:0061001 | regulation of dendritic spine morphogenesis(GO:0061001) |
| 0.0 | 0.4 | GO:0007224 | smoothened signaling pathway(GO:0007224) |
| 0.0 | 0.3 | GO:0022011 | myelination in peripheral nervous system(GO:0022011) peripheral nervous system axon ensheathment(GO:0032292) |
| 0.0 | 0.2 | GO:0097150 | neuronal stem cell population maintenance(GO:0097150) |
| 0.0 | 0.1 | GO:0045835 | negative regulation of meiotic nuclear division(GO:0045835) |
| 0.0 | 0.2 | GO:0032516 | positive regulation of phosphoprotein phosphatase activity(GO:0032516) |
| 0.0 | 0.5 | GO:0000387 | spliceosomal snRNP assembly(GO:0000387) |
| 0.0 | 0.1 | GO:0006931 | substrate-dependent cell migration, cell attachment to substrate(GO:0006931) |
| 0.0 | 0.5 | GO:0046785 | microtubule polymerization(GO:0046785) |
| 0.0 | 0.4 | GO:2000300 | regulation of synaptic vesicle exocytosis(GO:2000300) |
| 0.0 | 0.2 | GO:0006123 | mitochondrial electron transport, cytochrome c to oxygen(GO:0006123) |
| 0.0 | 0.2 | GO:0034243 | regulation of transcription elongation from RNA polymerase II promoter(GO:0034243) |
| 0.0 | 0.0 | GO:0032488 | regulation of T cell antigen processing and presentation(GO:0002625) Cdc42 protein signal transduction(GO:0032488) |
| 0.0 | 0.3 | GO:1901099 | negative regulation of signal transduction in absence of ligand(GO:1901099) negative regulation of extrinsic apoptotic signaling pathway in absence of ligand(GO:2001240) |
| 0.0 | 0.2 | GO:2000696 | regulation of epithelial cell differentiation involved in kidney development(GO:2000696) |
| 0.0 | 0.2 | GO:0030214 | hyaluronan catabolic process(GO:0030214) |
| 0.0 | 0.2 | GO:0032291 | central nervous system myelination(GO:0022010) axon ensheathment in central nervous system(GO:0032291) |
| 0.0 | 0.2 | GO:0045008 | depyrimidination(GO:0045008) |
| 0.0 | 0.8 | GO:0015701 | bicarbonate transport(GO:0015701) |
| 0.0 | 0.1 | GO:0048569 | post-embryonic organ development(GO:0048569) |
| 0.0 | 0.3 | GO:0007340 | acrosome reaction(GO:0007340) |
Gene overrepresentation in cellular_component category:
| Log-likelihood per target | Total log-likelihood | Term | Description |
|---|---|---|---|
| 0.8 | 2.3 | GO:1990622 | CHOP-ATF3 complex(GO:1990622) |
| 0.3 | 1.5 | GO:0060053 | neurofilament cytoskeleton(GO:0060053) |
| 0.2 | 1.0 | GO:0042571 | immunoglobulin complex, circulating(GO:0042571) |
| 0.2 | 3.1 | GO:0032039 | integrator complex(GO:0032039) |
| 0.2 | 1.7 | GO:0036128 | CatSper complex(GO:0036128) |
| 0.2 | 0.9 | GO:0032449 | CBM complex(GO:0032449) |
| 0.2 | 0.5 | GO:0001534 | radial spoke(GO:0001534) |
| 0.2 | 0.9 | GO:0032301 | MutSalpha complex(GO:0032301) |
| 0.2 | 0.5 | GO:0098843 | postsynaptic endocytic zone(GO:0098843) postsynaptic endocytic zone membrane(GO:0098844) |
| 0.2 | 1.2 | GO:0098536 | deuterosome(GO:0098536) |
| 0.2 | 0.7 | GO:1990923 | PET complex(GO:1990923) |
| 0.2 | 6.7 | GO:0034451 | centriolar satellite(GO:0034451) |
| 0.2 | 0.2 | GO:0005795 | Golgi stack(GO:0005795) |
| 0.1 | 1.2 | GO:0071204 | histone pre-mRNA 3'end processing complex(GO:0071204) |
| 0.1 | 0.3 | GO:0005956 | protein kinase CK2 complex(GO:0005956) |
| 0.1 | 0.4 | GO:0016533 | cyclin-dependent protein kinase 5 holoenzyme complex(GO:0016533) |
| 0.1 | 1.0 | GO:0061574 | ASAP complex(GO:0061574) |
| 0.1 | 0.4 | GO:0032937 | SREBP-SCAP-Insig complex(GO:0032937) |
| 0.1 | 0.3 | GO:0032279 | asymmetric synapse(GO:0032279) symmetric synapse(GO:0032280) |
| 0.1 | 0.3 | GO:0031372 | UBC13-MMS2 complex(GO:0031372) |
| 0.1 | 0.6 | GO:1990635 | proximal dendrite(GO:1990635) |
| 0.1 | 0.5 | GO:0000942 | condensed nuclear chromosome outer kinetochore(GO:0000942) |
| 0.1 | 1.2 | GO:0001520 | outer dense fiber(GO:0001520) |
| 0.1 | 0.2 | GO:0034098 | VCP-NPL4-UFD1 AAA ATPase complex(GO:0034098) |
| 0.1 | 1.5 | GO:0005818 | astral microtubule(GO:0000235) aster(GO:0005818) |
| 0.1 | 0.7 | GO:0034715 | pICln-Sm protein complex(GO:0034715) |
| 0.1 | 0.5 | GO:0043625 | delta DNA polymerase complex(GO:0043625) |
| 0.1 | 0.3 | GO:0008043 | intracellular ferritin complex(GO:0008043) ferritin complex(GO:0070288) |
| 0.1 | 0.3 | GO:0005846 | nuclear cap binding complex(GO:0005846) |
| 0.1 | 1.3 | GO:0042405 | nuclear inclusion body(GO:0042405) |
| 0.1 | 1.7 | GO:0031095 | platelet dense tubular network membrane(GO:0031095) |
| 0.1 | 1.5 | GO:0008250 | oligosaccharyltransferase complex(GO:0008250) |
| 0.1 | 0.2 | GO:1990716 | axonemal central apparatus(GO:1990716) |
| 0.1 | 0.4 | GO:0005958 | DNA-dependent protein kinase-DNA ligase 4 complex(GO:0005958) |
| 0.1 | 0.2 | GO:0071821 | FANCM-MHF complex(GO:0071821) |
| 0.1 | 0.3 | GO:0071546 | pi-body(GO:0071546) |
| 0.1 | 0.2 | GO:0005595 | collagen type XII trimer(GO:0005595) |
| 0.1 | 0.8 | GO:0031089 | platelet dense granule lumen(GO:0031089) |
| 0.1 | 0.4 | GO:0005726 | perichromatin fibrils(GO:0005726) |
| 0.1 | 0.2 | GO:0097453 | mesaxon(GO:0097453) ensheathing process(GO:1990015) |
| 0.1 | 0.2 | GO:0042565 | RNA nuclear export complex(GO:0042565) |
| 0.1 | 0.9 | GO:0031464 | Cul4A-RING E3 ubiquitin ligase complex(GO:0031464) |
| 0.1 | 4.7 | GO:0010494 | cytoplasmic stress granule(GO:0010494) |
| 0.1 | 2.2 | GO:0070822 | Sin3-type complex(GO:0070822) |
| 0.1 | 1.3 | GO:0030877 | beta-catenin destruction complex(GO:0030877) |
| 0.1 | 2.0 | GO:0071782 | endoplasmic reticulum tubular network(GO:0071782) |
| 0.1 | 0.2 | GO:1990423 | RZZ complex(GO:1990423) |
| 0.1 | 0.9 | GO:0030126 | COPI vesicle coat(GO:0030126) |
| 0.0 | 0.4 | GO:0002177 | manchette(GO:0002177) |
| 0.0 | 0.8 | GO:0097227 | sperm annulus(GO:0097227) |
| 0.0 | 0.4 | GO:0030991 | intraciliary transport particle A(GO:0030991) |
| 0.0 | 0.4 | GO:0000801 | central element(GO:0000801) |
| 0.0 | 0.8 | GO:0014731 | spectrin-associated cytoskeleton(GO:0014731) |
| 0.0 | 1.0 | GO:0000800 | lateral element(GO:0000800) |
| 0.0 | 0.2 | GO:0034673 | inhibin-betaglycan-ActRII complex(GO:0034673) |
| 0.0 | 0.7 | GO:0002199 | zona pellucida receptor complex(GO:0002199) |
| 0.0 | 1.3 | GO:0030992 | intraciliary transport particle B(GO:0030992) |
| 0.0 | 0.4 | GO:0000125 | PCAF complex(GO:0000125) |
| 0.0 | 0.5 | GO:0031088 | platelet dense granule membrane(GO:0031088) |
| 0.0 | 1.3 | GO:0005697 | telomerase holoenzyme complex(GO:0005697) |
| 0.0 | 0.2 | GO:0071001 | U4/U6 snRNP(GO:0071001) |
| 0.0 | 1.1 | GO:1903293 | protein serine/threonine phosphatase complex(GO:0008287) phosphatase complex(GO:1903293) |
| 0.0 | 0.1 | GO:0071547 | piP-body(GO:0071547) |
| 0.0 | 2.0 | GO:0097546 | ciliary base(GO:0097546) |
| 0.0 | 0.7 | GO:0030897 | HOPS complex(GO:0030897) |
| 0.0 | 0.2 | GO:1990730 | VCP-NSFL1C complex(GO:1990730) |
| 0.0 | 0.4 | GO:0071541 | eukaryotic translation initiation factor 3 complex, eIF3m(GO:0071541) |
| 0.0 | 0.9 | GO:0097542 | ciliary tip(GO:0097542) |
| 0.0 | 0.2 | GO:0070937 | CRD-mediated mRNA stability complex(GO:0070937) |
| 0.0 | 0.4 | GO:0000347 | THO complex(GO:0000347) THO complex part of transcription export complex(GO:0000445) |
| 0.0 | 0.7 | GO:0001527 | microfibril(GO:0001527) fibril(GO:0043205) |
| 0.0 | 0.2 | GO:0097058 | CRLF-CLCF1 complex(GO:0097058) |
| 0.0 | 1.1 | GO:0097228 | sperm principal piece(GO:0097228) |
| 0.0 | 0.2 | GO:0032133 | chromosome passenger complex(GO:0032133) |
| 0.0 | 2.3 | GO:0000307 | cyclin-dependent protein kinase holoenzyme complex(GO:0000307) |
| 0.0 | 0.3 | GO:0072487 | MSL complex(GO:0072487) |
| 0.0 | 0.3 | GO:0008541 | proteasome regulatory particle, lid subcomplex(GO:0008541) |
| 0.0 | 0.7 | GO:0034045 | pre-autophagosomal structure membrane(GO:0034045) |
| 0.0 | 0.8 | GO:0005721 | pericentric heterochromatin(GO:0005721) |
| 0.0 | 2.0 | GO:0005801 | cis-Golgi network(GO:0005801) |
| 0.0 | 0.9 | GO:0031011 | Ino80 complex(GO:0031011) DNA helicase complex(GO:0033202) |
| 0.0 | 0.4 | GO:1990023 | mitotic spindle midzone(GO:1990023) |
| 0.0 | 0.5 | GO:0032391 | photoreceptor connecting cilium(GO:0032391) |
| 0.0 | 1.0 | GO:0034364 | high-density lipoprotein particle(GO:0034364) |
| 0.0 | 1.0 | GO:0030867 | rough endoplasmic reticulum membrane(GO:0030867) |
| 0.0 | 0.2 | GO:0035976 | AP1 complex(GO:0035976) |
| 0.0 | 0.3 | GO:0000796 | condensin complex(GO:0000796) |
| 0.0 | 0.9 | GO:0031304 | intrinsic component of mitochondrial inner membrane(GO:0031304) integral component of mitochondrial inner membrane(GO:0031305) |
| 0.0 | 2.7 | GO:0031514 | motile cilium(GO:0031514) |
| 0.0 | 0.6 | GO:0031045 | dense core granule(GO:0031045) |
| 0.0 | 0.8 | GO:1902562 | NuA4 histone acetyltransferase complex(GO:0035267) H4/H2A histone acetyltransferase complex(GO:0043189) H4 histone acetyltransferase complex(GO:1902562) |
| 0.0 | 0.1 | GO:1990851 | Wnt-Frizzled-LRP5/6 complex(GO:1990851) |
| 0.0 | 0.1 | GO:0031251 | PAN complex(GO:0031251) |
| 0.0 | 0.1 | GO:0042406 | extrinsic component of endoplasmic reticulum membrane(GO:0042406) |
| 0.0 | 0.2 | GO:0005672 | transcription factor TFIIA complex(GO:0005672) |
| 0.0 | 0.6 | GO:0030014 | CCR4-NOT complex(GO:0030014) |
| 0.0 | 0.1 | GO:0048787 | presynaptic active zone membrane(GO:0048787) |
| 0.0 | 0.2 | GO:0070545 | PeBoW complex(GO:0070545) |
| 0.0 | 0.8 | GO:0044298 | neuronal cell body membrane(GO:0032809) cell body membrane(GO:0044298) |
| 0.0 | 0.1 | GO:0031510 | SUMO activating enzyme complex(GO:0031510) |
| 0.0 | 0.9 | GO:0035371 | microtubule plus-end(GO:0035371) |
| 0.0 | 0.4 | GO:0030285 | integral component of synaptic vesicle membrane(GO:0030285) intrinsic component of synaptic vesicle membrane(GO:0098563) |
| 0.0 | 2.8 | GO:0000776 | kinetochore(GO:0000776) |
| 0.0 | 0.3 | GO:0016461 | unconventional myosin complex(GO:0016461) |
| 0.0 | 0.2 | GO:0000788 | nuclear nucleosome(GO:0000788) |
| 0.0 | 0.4 | GO:0016281 | eukaryotic translation initiation factor 4F complex(GO:0016281) |
| 0.0 | 0.3 | GO:0034663 | endoplasmic reticulum chaperone complex(GO:0034663) |
| 0.0 | 1.7 | GO:0101003 | ficolin-1-rich granule membrane(GO:0101003) |
| 0.0 | 0.5 | GO:0036020 | endolysosome membrane(GO:0036020) |
| 0.0 | 0.1 | GO:0016514 | SWI/SNF complex(GO:0016514) |
| 0.0 | 0.1 | GO:0048476 | Holliday junction resolvase complex(GO:0048476) |
| 0.0 | 0.3 | GO:0000177 | cytoplasmic exosome (RNase complex)(GO:0000177) |
| 0.0 | 0.4 | GO:0005685 | U1 snRNP(GO:0005685) |
| 0.0 | 0.4 | GO:0032839 | dendrite cytoplasm(GO:0032839) |
| 0.0 | 0.2 | GO:0097014 | axoneme(GO:0005930) ciliary plasm(GO:0097014) |
| 0.0 | 0.1 | GO:0071011 | precatalytic spliceosome(GO:0071011) |
| 0.0 | 0.6 | GO:0005819 | spindle(GO:0005819) |
| 0.0 | 0.2 | GO:0097470 | ribbon synapse(GO:0097470) |
| 0.0 | 0.2 | GO:0070652 | HAUS complex(GO:0070652) |
| 0.0 | 0.2 | GO:0045120 | pronucleus(GO:0045120) |
| 0.0 | 1.6 | GO:0005814 | centriole(GO:0005814) |
| 0.0 | 1.5 | GO:0005637 | nuclear inner membrane(GO:0005637) |
| 0.0 | 0.9 | GO:0005790 | smooth endoplasmic reticulum(GO:0005790) |
| 0.0 | 0.1 | GO:0000502 | proteasome complex(GO:0000502) |
| 0.0 | 1.1 | GO:0043195 | terminal bouton(GO:0043195) |
| 0.0 | 1.8 | GO:0017053 | transcriptional repressor complex(GO:0017053) |
| 0.0 | 1.5 | GO:0001669 | acrosomal vesicle(GO:0001669) |
| 0.0 | 0.4 | GO:0042101 | T cell receptor complex(GO:0042101) |
| 0.0 | 0.3 | GO:0005736 | DNA-directed RNA polymerase I complex(GO:0005736) |
| 0.0 | 0.8 | GO:0005834 | heterotrimeric G-protein complex(GO:0005834) |
| 0.0 | 0.5 | GO:0071339 | MLL1/2 complex(GO:0044665) MLL1 complex(GO:0071339) |
| 0.0 | 0.1 | GO:0035631 | CD40 receptor complex(GO:0035631) |
| 0.0 | 0.2 | GO:0032587 | ruffle membrane(GO:0032587) |
| 0.0 | 0.0 | GO:0035838 | growing cell tip(GO:0035838) |
| 0.0 | 0.9 | GO:1904724 | tertiary granule lumen(GO:1904724) |
| 0.0 | 0.7 | GO:0015030 | Cajal body(GO:0015030) |
| 0.0 | 0.2 | GO:0031254 | uropod(GO:0001931) cell trailing edge(GO:0031254) |
| 0.0 | 0.1 | GO:0016602 | CCAAT-binding factor complex(GO:0016602) |
| 0.0 | 0.1 | GO:0042382 | paraspeckles(GO:0042382) |
Gene overrepresentation in molecular_function category:
| Log-likelihood per target | Total log-likelihood | Term | Description |
|---|---|---|---|
| 0.4 | 1.5 | GO:0070012 | oligopeptidase activity(GO:0070012) |
| 0.3 | 0.9 | GO:0004174 | electron-transferring-flavoprotein dehydrogenase activity(GO:0004174) oxidoreductase activity, acting on the CH-NH group of donors, quinone or similar compound as acceptor(GO:0016649) |
| 0.3 | 1.6 | GO:0030292 | protein tyrosine kinase inhibitor activity(GO:0030292) |
| 0.3 | 0.8 | GO:0031775 | lutropin-choriogonadotropic hormone receptor binding(GO:0031775) calcium-transporting ATPase activity involved in regulation of cardiac muscle cell membrane potential(GO:0086039) |
| 0.3 | 1.4 | GO:0016900 | oxidoreductase activity, acting on the CH-OH group of donors, disulfide as acceptor(GO:0016900) vitamin-K-epoxide reductase (warfarin-sensitive) activity(GO:0047057) |
| 0.3 | 1.9 | GO:0061575 | cyclin-dependent protein serine/threonine kinase activator activity(GO:0061575) |
| 0.2 | 0.7 | GO:0008892 | guanine deaminase activity(GO:0008892) |
| 0.2 | 0.7 | GO:0071207 | histone pre-mRNA stem-loop binding(GO:0071207) |
| 0.2 | 1.4 | GO:0031730 | CCR5 chemokine receptor binding(GO:0031730) |
| 0.2 | 1.0 | GO:0050220 | prostaglandin-E synthase activity(GO:0050220) |
| 0.2 | 0.6 | GO:0004756 | selenide, water dikinase activity(GO:0004756) phosphotransferase activity, paired acceptors(GO:0016781) |
| 0.2 | 0.9 | GO:0032143 | single thymine insertion binding(GO:0032143) |
| 0.2 | 0.5 | GO:0031798 | type 1 metabotropic glutamate receptor binding(GO:0031798) |
| 0.1 | 0.9 | GO:0000213 | tRNA-intron endonuclease activity(GO:0000213) |
| 0.1 | 0.4 | GO:0016534 | cyclin-dependent protein kinase 5 activator activity(GO:0016534) |
| 0.1 | 1.7 | GO:0004652 | polynucleotide adenylyltransferase activity(GO:0004652) |
| 0.1 | 0.3 | GO:0003960 | NADPH:quinone reductase activity(GO:0003960) |
| 0.1 | 1.1 | GO:0005158 | insulin receptor binding(GO:0005158) |
| 0.1 | 1.7 | GO:0031386 | protein tag(GO:0031386) |
| 0.1 | 0.6 | GO:0031208 | POZ domain binding(GO:0031208) |
| 0.1 | 0.5 | GO:0061628 | H3K27me3 modified histone binding(GO:0061628) |
| 0.1 | 0.7 | GO:0032558 | adenyl deoxyribonucleotide binding(GO:0032558) dATP binding(GO:0032564) |
| 0.1 | 0.9 | GO:0008379 | thioredoxin peroxidase activity(GO:0008379) |
| 0.1 | 2.0 | GO:0008140 | cAMP response element binding protein binding(GO:0008140) |
| 0.1 | 2.0 | GO:0009982 | pseudouridine synthase activity(GO:0009982) |
| 0.1 | 1.1 | GO:0016174 | NAD(P)H oxidase activity(GO:0016174) |
| 0.1 | 0.5 | GO:0000386 | second spliceosomal transesterification activity(GO:0000386) |
| 0.1 | 0.3 | GO:0004566 | beta-glucuronidase activity(GO:0004566) |
| 0.1 | 1.1 | GO:0008568 | microtubule-severing ATPase activity(GO:0008568) |
| 0.1 | 0.4 | GO:0051765 | inositol tetrakisphosphate kinase activity(GO:0051765) |
| 0.1 | 0.3 | GO:0034736 | sterol O-acyltransferase activity(GO:0004772) cholesterol O-acyltransferase activity(GO:0034736) |
| 0.1 | 1.1 | GO:0034987 | immunoglobulin receptor binding(GO:0034987) |
| 0.1 | 3.7 | GO:0008143 | poly(A) binding(GO:0008143) |
| 0.1 | 0.3 | GO:0050146 | nucleoside phosphotransferase activity(GO:0050146) |
| 0.1 | 4.5 | GO:0001671 | ATPase activator activity(GO:0001671) |
| 0.1 | 0.6 | GO:0004719 | protein-L-isoaspartate (D-aspartate) O-methyltransferase activity(GO:0004719) |
| 0.1 | 1.5 | GO:0004579 | dolichyl-diphosphooligosaccharide-protein glycotransferase activity(GO:0004579) |
| 0.1 | 0.4 | GO:0034057 | RNA strand-exchange activity(GO:0034057) |
| 0.1 | 0.3 | GO:0005220 | inositol 1,4,5-trisphosphate-sensitive calcium-release channel activity(GO:0005220) |
| 0.1 | 1.1 | GO:0005078 | MAP-kinase scaffold activity(GO:0005078) |
| 0.1 | 0.4 | GO:0044729 | hemi-methylated DNA-binding(GO:0044729) |
| 0.1 | 0.8 | GO:0004459 | L-lactate dehydrogenase activity(GO:0004459) |
| 0.1 | 0.8 | GO:0070739 | protein-glutamic acid ligase activity(GO:0070739) |
| 0.1 | 0.5 | GO:0050733 | RS domain binding(GO:0050733) |
| 0.1 | 0.4 | GO:0004306 | ethanolamine-phosphate cytidylyltransferase activity(GO:0004306) |
| 0.1 | 0.6 | GO:0003886 | DNA (cytosine-5-)-methyltransferase activity(GO:0003886) |
| 0.1 | 0.7 | GO:0008494 | translation activator activity(GO:0008494) |
| 0.1 | 0.7 | GO:0001042 | RNA polymerase I core binding(GO:0001042) |
| 0.1 | 0.7 | GO:1990446 | U1 snRNP binding(GO:1990446) |
| 0.1 | 0.6 | GO:0033170 | DNA clamp loader activity(GO:0003689) protein-DNA loading ATPase activity(GO:0033170) |
| 0.1 | 0.5 | GO:0005412 | glucose:sodium symporter activity(GO:0005412) |
| 0.1 | 0.2 | GO:0090631 | pre-miRNA transporter activity(GO:0090631) |
| 0.1 | 0.8 | GO:0046975 | histone methyltransferase activity (H3-K36 specific)(GO:0046975) |
| 0.1 | 0.3 | GO:0042806 | fucose binding(GO:0042806) |
| 0.1 | 0.4 | GO:0042610 | CD8 receptor binding(GO:0042610) |
| 0.1 | 0.4 | GO:0010997 | anaphase-promoting complex binding(GO:0010997) |
| 0.1 | 2.2 | GO:0051959 | dynein light intermediate chain binding(GO:0051959) |
| 0.1 | 0.3 | GO:0004322 | ferroxidase activity(GO:0004322) oxidoreductase activity, oxidizing metal ions, oxygen as acceptor(GO:0016724) |
| 0.1 | 0.2 | GO:0030350 | iron-responsive element binding(GO:0030350) |
| 0.0 | 0.4 | GO:0003747 | translation release factor activity(GO:0003747) translation termination factor activity(GO:0008079) |
| 0.0 | 0.2 | GO:0036435 | K48-linked polyubiquitin binding(GO:0036435) |
| 0.0 | 0.2 | GO:0034647 | histone demethylase activity (H3-trimethyl-K4 specific)(GO:0034647) |
| 0.0 | 0.2 | GO:0004983 | neuropeptide Y receptor activity(GO:0004983) |
| 0.0 | 0.2 | GO:0070579 | methylcytosine dioxygenase activity(GO:0070579) |
| 0.0 | 0.3 | GO:0000285 | 1-phosphatidylinositol-3-phosphate 5-kinase activity(GO:0000285) |
| 0.0 | 0.6 | GO:1990380 | Lys48-specific deubiquitinase activity(GO:1990380) |
| 0.0 | 0.4 | GO:0030023 | extracellular matrix constituent conferring elasticity(GO:0030023) |
| 0.0 | 0.2 | GO:0005471 | ATP:ADP antiporter activity(GO:0005471) adenine transmembrane transporter activity(GO:0015207) |
| 0.0 | 0.3 | GO:0019213 | deacetylase activity(GO:0019213) |
| 0.0 | 0.1 | GO:0004040 | amidase activity(GO:0004040) |
| 0.0 | 0.0 | GO:0004800 | thyroxine 5'-deiodinase activity(GO:0004800) |
| 0.0 | 0.3 | GO:0070097 | delta-catenin binding(GO:0070097) |
| 0.0 | 0.5 | GO:0019784 | NEDD8-specific protease activity(GO:0019784) |
| 0.0 | 0.1 | GO:0080130 | L-phenylalanine aminotransferase activity(GO:0070546) L-phenylalanine:2-oxoglutarate aminotransferase activity(GO:0080130) |
| 0.0 | 0.2 | GO:0003896 | DNA primase activity(GO:0003896) |
| 0.0 | 0.8 | GO:0004691 | cAMP-dependent protein kinase activity(GO:0004691) |
| 0.0 | 0.4 | GO:0036042 | long-chain fatty acyl-CoA binding(GO:0036042) |
| 0.0 | 2.7 | GO:0008138 | protein tyrosine/serine/threonine phosphatase activity(GO:0008138) |
| 0.0 | 0.2 | GO:0008263 | pyrimidine-specific mismatch base pair DNA N-glycosylase activity(GO:0008263) |
| 0.0 | 0.3 | GO:0004656 | procollagen-proline 4-dioxygenase activity(GO:0004656) procollagen-proline dioxygenase activity(GO:0019798) |
| 0.0 | 1.0 | GO:0070402 | NADPH binding(GO:0070402) |
| 0.0 | 1.2 | GO:0035257 | nuclear hormone receptor binding(GO:0035257) hormone receptor binding(GO:0051427) |
| 0.0 | 0.1 | GO:0036487 | nitric-oxide synthase inhibitor activity(GO:0036487) |
| 0.0 | 0.2 | GO:0004514 | nicotinate-nucleotide diphosphorylase (carboxylating) activity(GO:0004514) |
| 0.0 | 0.4 | GO:0003720 | telomerase activity(GO:0003720) RNA-directed DNA polymerase activity(GO:0003964) |
| 0.0 | 0.5 | GO:0038062 | protein tyrosine kinase collagen receptor activity(GO:0038062) |
| 0.0 | 0.5 | GO:0003910 | DNA ligase (ATP) activity(GO:0003910) |
| 0.0 | 0.1 | GO:0060001 | minus-end directed microfilament motor activity(GO:0060001) |
| 0.0 | 0.3 | GO:0051378 | amine binding(GO:0043176) serotonin binding(GO:0051378) |
| 0.0 | 0.3 | GO:0004720 | protein-lysine 6-oxidase activity(GO:0004720) |
| 0.0 | 0.4 | GO:0001075 | transcription factor activity, RNA polymerase II core promoter sequence-specific binding involved in preinitiation complex assembly(GO:0001075) |
| 0.0 | 0.1 | GO:0019948 | SUMO activating enzyme activity(GO:0019948) |
| 0.0 | 0.3 | GO:0070087 | chromo shadow domain binding(GO:0070087) |
| 0.0 | 0.4 | GO:0051430 | corticotropin-releasing hormone receptor 1 binding(GO:0051430) |
| 0.0 | 0.4 | GO:0015252 | hydrogen ion channel activity(GO:0015252) |
| 0.0 | 0.8 | GO:0008510 | sodium:bicarbonate symporter activity(GO:0008510) |
| 0.0 | 0.6 | GO:0009931 | calcium-dependent protein serine/threonine kinase activity(GO:0009931) |
| 0.0 | 0.6 | GO:0043022 | ribosome binding(GO:0043022) |
| 0.0 | 0.2 | GO:0030020 | extracellular matrix structural constituent conferring tensile strength(GO:0030020) |
| 0.0 | 0.3 | GO:0000340 | RNA 7-methylguanosine cap binding(GO:0000340) |
| 0.0 | 1.8 | GO:0008536 | Ran GTPase binding(GO:0008536) |
| 0.0 | 0.2 | GO:0098821 | BMP receptor activity(GO:0098821) |
| 0.0 | 0.5 | GO:0001135 | transcription factor activity, RNA polymerase II transcription factor recruiting(GO:0001135) |
| 0.0 | 0.8 | GO:0008483 | transaminase activity(GO:0008483) |
| 0.0 | 0.1 | GO:0042289 | MHC class II protein binding(GO:0042289) |
| 0.0 | 0.4 | GO:0035612 | AP-2 adaptor complex binding(GO:0035612) |
| 0.0 | 0.3 | GO:0004332 | fructose-bisphosphate aldolase activity(GO:0004332) |
| 0.0 | 1.1 | GO:0080025 | phosphatidylinositol-3,5-bisphosphate binding(GO:0080025) |
| 0.0 | 0.4 | GO:0030976 | thiamine pyrophosphate binding(GO:0030976) |
| 0.0 | 0.1 | GO:0031893 | vasopressin receptor binding(GO:0031893) |
| 0.0 | 0.8 | GO:0001965 | G-protein alpha-subunit binding(GO:0001965) |
| 0.0 | 0.2 | GO:0032405 | MutLalpha complex binding(GO:0032405) |
| 0.0 | 0.2 | GO:0035473 | lipase binding(GO:0035473) |
| 0.0 | 0.3 | GO:0031072 | heat shock protein binding(GO:0031072) |
| 0.0 | 0.1 | GO:0004722 | protein serine/threonine phosphatase activity(GO:0004722) |
| 0.0 | 0.2 | GO:0030374 | ligand-dependent nuclear receptor transcription coactivator activity(GO:0030374) |
| 0.0 | 1.2 | GO:0044183 | protein binding involved in protein folding(GO:0044183) |
| 0.0 | 0.4 | GO:0097109 | neuroligin family protein binding(GO:0097109) |
| 0.0 | 0.2 | GO:0008321 | Ral guanyl-nucleotide exchange factor activity(GO:0008321) |
| 0.0 | 0.4 | GO:0035925 | mRNA 3'-UTR AU-rich region binding(GO:0035925) |
| 0.0 | 0.1 | GO:0005110 | frizzled-2 binding(GO:0005110) |
| 0.0 | 0.2 | GO:0035174 | histone serine kinase activity(GO:0035174) |
| 0.0 | 2.3 | GO:0019003 | GDP binding(GO:0019003) |
| 0.0 | 0.2 | GO:0005250 | A-type (transient outward) potassium channel activity(GO:0005250) |
| 0.0 | 0.6 | GO:0005388 | calcium-transporting ATPase activity(GO:0005388) |
| 0.0 | 0.4 | GO:0051428 | peptide hormone receptor binding(GO:0051428) |
| 0.0 | 0.6 | GO:0003756 | protein disulfide isomerase activity(GO:0003756) intramolecular oxidoreductase activity, transposing S-S bonds(GO:0016864) |
| 0.0 | 0.2 | GO:0004468 | lysine N-acetyltransferase activity, acting on acetyl phosphate as donor(GO:0004468) |
| 0.0 | 1.1 | GO:0031369 | translation initiation factor binding(GO:0031369) |
| 0.0 | 0.5 | GO:0035615 | clathrin adaptor activity(GO:0035615) endocytic adaptor activity(GO:0098748) |
| 0.0 | 0.1 | GO:0032129 | histone deacetylase activity (H3-K9 specific)(GO:0032129) NAD-dependent histone deacetylase activity (H3-K9 specific)(GO:0046969) |
| 0.0 | 1.0 | GO:0070840 | dynein complex binding(GO:0070840) |
| 0.0 | 0.2 | GO:0016618 | hydroxypyruvate reductase activity(GO:0016618) glyoxylate reductase (NADP) activity(GO:0030267) |
| 0.0 | 0.4 | GO:0070064 | proline-rich region binding(GO:0070064) |
| 0.0 | 0.2 | GO:0031697 | beta-1 adrenergic receptor binding(GO:0031697) |
| 0.0 | 0.7 | GO:0034061 | DNA polymerase activity(GO:0034061) |
| 0.0 | 0.8 | GO:0005545 | 1-phosphatidylinositol binding(GO:0005545) |
| 0.0 | 0.1 | GO:0039552 | RIG-I binding(GO:0039552) |
| 0.0 | 0.7 | GO:0050811 | GABA receptor binding(GO:0050811) |
| 0.0 | 0.0 | GO:0030337 | DNA polymerase processivity factor activity(GO:0030337) |
| 0.0 | 0.3 | GO:0015217 | ATP transmembrane transporter activity(GO:0005347) ADP transmembrane transporter activity(GO:0015217) |
| 0.0 | 0.5 | GO:0043014 | alpha-tubulin binding(GO:0043014) |
| 0.0 | 0.2 | GO:0046976 | histone methyltransferase activity (H3-K27 specific)(GO:0046976) |
| 0.0 | 0.2 | GO:0031543 | peptidyl-proline dioxygenase activity(GO:0031543) |
| 0.0 | 0.1 | GO:0004096 | catalase activity(GO:0004096) |
| 0.0 | 0.3 | GO:0070324 | thyroid hormone binding(GO:0070324) |
| 0.0 | 0.3 | GO:0030957 | Tat protein binding(GO:0030957) |
| 0.0 | 0.2 | GO:0030621 | U4 snRNA binding(GO:0030621) |
| 0.0 | 0.1 | GO:0008486 | endopolyphosphatase activity(GO:0000298) diphosphoinositol-polyphosphate diphosphatase activity(GO:0008486) bis(5'-adenosyl)-hexaphosphatase activity(GO:0034431) bis(5'-adenosyl)-pentaphosphatase activity(GO:0034432) inositol diphosphate tetrakisphosphate diphosphatase activity(GO:0052840) inositol bisdiphosphate tetrakisphosphate diphosphatase activity(GO:0052841) inositol diphosphate pentakisphosphate diphosphatase activity(GO:0052842) inositol-1-diphosphate-2,3,4,5,6-pentakisphosphate diphosphatase activity(GO:0052843) inositol-3-diphosphate-1,2,4,5,6-pentakisphosphate diphosphatase activity(GO:0052844) inositol-5-diphosphate-1,2,3,4,6-pentakisphosphate diphosphatase activity(GO:0052845) inositol-1,5-bisdiphosphate-2,3,4,6-tetrakisphosphate 1-diphosphatase activity(GO:0052846) inositol-1,5-bisdiphosphate-2,3,4,6-tetrakisphosphate 5-diphosphatase activity(GO:0052847) inositol-3,5-bisdiphosphate-2,3,4,6-tetrakisphosphate 5-diphosphatase activity(GO:0052848) |
| 0.0 | 0.3 | GO:0036310 | annealing helicase activity(GO:0036310) |
| 0.0 | 0.2 | GO:0043426 | MRF binding(GO:0043426) |
| 0.0 | 0.4 | GO:0036312 | phosphatidylinositol 3-kinase regulatory subunit binding(GO:0036312) |
| 0.0 | 0.2 | GO:0005127 | ciliary neurotrophic factor receptor binding(GO:0005127) |
| 0.0 | 1.1 | GO:0050699 | WW domain binding(GO:0050699) |
| 0.0 | 0.1 | GO:0035501 | MH1 domain binding(GO:0035501) |
| 0.0 | 0.7 | GO:0015248 | sterol transporter activity(GO:0015248) |
| 0.0 | 0.8 | GO:0047485 | protein N-terminus binding(GO:0047485) |
| 0.0 | 0.4 | GO:0008331 | high voltage-gated calcium channel activity(GO:0008331) |
| 0.0 | 0.2 | GO:0004190 | aspartic-type endopeptidase activity(GO:0004190) aspartic-type peptidase activity(GO:0070001) |
| 0.0 | 0.7 | GO:0004003 | ATP-dependent DNA helicase activity(GO:0004003) |
| 0.0 | 0.1 | GO:0042043 | neurexin family protein binding(GO:0042043) |
| 0.0 | 0.2 | GO:0030674 | protein binding, bridging(GO:0030674) |
| 0.0 | 0.2 | GO:0033691 | sialic acid binding(GO:0033691) |
| 0.0 | 0.5 | GO:0017081 | chloride channel regulator activity(GO:0017081) |
| 0.0 | 0.6 | GO:0015631 | tubulin binding(GO:0015631) |
| 0.0 | 0.8 | GO:0071889 | 14-3-3 protein binding(GO:0071889) |
| 0.0 | 0.3 | GO:0004017 | adenylate kinase activity(GO:0004017) |
| 0.0 | 0.1 | GO:0043023 | ribosomal large subunit binding(GO:0043023) |
| 0.0 | 0.4 | GO:0097602 | cullin family protein binding(GO:0097602) |
| 0.0 | 0.3 | GO:0001054 | RNA polymerase I activity(GO:0001054) |
| 0.0 | 0.3 | GO:0001871 | pattern binding(GO:0001871) polysaccharide binding(GO:0030247) |
| 0.0 | 0.1 | GO:0043274 | phospholipase binding(GO:0043274) |
| 0.0 | 0.5 | GO:0004222 | metalloendopeptidase activity(GO:0004222) |
| 0.0 | 0.8 | GO:0070412 | R-SMAD binding(GO:0070412) |
| 0.0 | 0.4 | GO:0070008 | serine-type exopeptidase activity(GO:0070008) |
| 0.0 | 0.2 | GO:0016723 | oxidoreductase activity, oxidizing metal ions, NAD or NADP as acceptor(GO:0016723) |
| 0.0 | 0.2 | GO:0035613 | RNA stem-loop binding(GO:0035613) |
| 0.0 | 0.3 | GO:0070566 | adenylyltransferase activity(GO:0070566) |
| 0.0 | 0.4 | GO:0051087 | chaperone binding(GO:0051087) |
| 0.0 | 0.1 | GO:0003906 | DNA-(apurinic or apyrimidinic site) lyase activity(GO:0003906) |
| 0.0 | 0.1 | GO:0005025 | transforming growth factor beta receptor activity, type I(GO:0005025) |
| 0.0 | 0.0 | GO:0004769 | steroid delta-isomerase activity(GO:0004769) |
| 0.0 | 0.1 | GO:0005212 | structural constituent of eye lens(GO:0005212) |
| 0.0 | 3.3 | GO:0008017 | microtubule binding(GO:0008017) |
| 0.0 | 0.5 | GO:0005385 | zinc ion transmembrane transporter activity(GO:0005385) |
| 0.0 | 1.0 | GO:0004407 | histone deacetylase activity(GO:0004407) |
| 0.0 | 0.3 | GO:0005247 | voltage-gated chloride channel activity(GO:0005247) |
| 0.0 | 0.0 | GO:0097322 | 7SK snRNA binding(GO:0097322) |
| 0.0 | 0.2 | GO:1904264 | ubiquitin protein ligase activity involved in ERAD pathway(GO:1904264) |
| 0.0 | 1.2 | GO:0004843 | thiol-dependent ubiquitin-specific protease activity(GO:0004843) |
| 0.0 | 0.0 | GO:0019912 | cyclin-dependent protein kinase activating kinase activity(GO:0019912) |
| 0.0 | 0.1 | GO:0008821 | crossover junction endodeoxyribonuclease activity(GO:0008821) |
| 0.0 | 0.1 | GO:0017091 | AU-rich element binding(GO:0017091) |
| 0.0 | 1.5 | GO:0019888 | protein phosphatase regulator activity(GO:0019888) |
| 0.0 | 0.2 | GO:0008188 | neuropeptide receptor activity(GO:0008188) |
| 0.0 | 1.2 | GO:0003725 | double-stranded RNA binding(GO:0003725) |
| 0.0 | 1.1 | GO:0003777 | microtubule motor activity(GO:0003777) |
| 0.0 | 0.1 | GO:0035591 | signaling adaptor activity(GO:0035591) |
| 0.0 | 0.2 | GO:0008198 | ferrous iron binding(GO:0008198) |
Gene overrepresentation in C2:CP category:
| Log-likelihood per target | Total log-likelihood | Term | Description |
|---|---|---|---|
| 0.0 | 2.5 | PID LIS1 PATHWAY | Lissencephaly gene (LIS1) in neuronal migration and development |
| 0.0 | 2.9 | PID FOXM1 PATHWAY | FOXM1 transcription factor network |
| 0.0 | 0.1 | PID PI3KCI AKT PATHWAY | Class I PI3K signaling events mediated by Akt |
| 0.0 | 3.9 | PID PLK1 PATHWAY | PLK1 signaling events |
| 0.0 | 1.1 | PID DNA PK PATHWAY | DNA-PK pathway in nonhomologous end joining |
| 0.0 | 2.9 | PID P38 ALPHA BETA DOWNSTREAM PATHWAY | Signaling mediated by p38-alpha and p38-beta |
| 0.0 | 1.0 | PID BARD1 PATHWAY | BARD1 signaling events |
| 0.0 | 1.2 | PID TCR CALCIUM PATHWAY | Calcium signaling in the CD4+ TCR pathway |
| 0.0 | 0.3 | ST TUMOR NECROSIS FACTOR PATHWAY | Tumor Necrosis Factor Pathway. |
| 0.0 | 1.2 | PID ATM PATHWAY | ATM pathway |
| 0.0 | 1.0 | ST WNT CA2 CYCLIC GMP PATHWAY | Wnt/Ca2+/cyclic GMP signaling. |
| 0.0 | 0.9 | PID SYNDECAN 2 PATHWAY | Syndecan-2-mediated signaling events |
| 0.0 | 0.6 | PID P38 GAMMA DELTA PATHWAY | Signaling mediated by p38-gamma and p38-delta |
| 0.0 | 3.0 | PID TELOMERASE PATHWAY | Regulation of Telomerase |
| 0.0 | 0.3 | PID ANGIOPOIETIN RECEPTOR PATHWAY | Angiopoietin receptor Tie2-mediated signaling |
| 0.0 | 1.8 | PID ARF6 TRAFFICKING PATHWAY | Arf6 trafficking events |
| 0.0 | 1.7 | PID RB 1PATHWAY | Regulation of retinoblastoma protein |
| 0.0 | 0.9 | PID NFKAPPAB CANONICAL PATHWAY | Canonical NF-kappaB pathway |
| 0.0 | 2.2 | PID MTOR 4PATHWAY | mTOR signaling pathway |
| 0.0 | 1.2 | PID SYNDECAN 4 PATHWAY | Syndecan-4-mediated signaling events |
| 0.0 | 0.4 | PID SYNDECAN 3 PATHWAY | Syndecan-3-mediated signaling events |
| 0.0 | 0.5 | PID P53 REGULATION PATHWAY | p53 pathway |
| 0.0 | 0.2 | ST G ALPHA S PATHWAY | G alpha s Pathway |
| 0.0 | 0.2 | PID ERB GENOMIC PATHWAY | Validated nuclear estrogen receptor beta network |
| 0.0 | 0.6 | SIG PIP3 SIGNALING IN CARDIAC MYOCTES | Genes related to PIP3 signaling in cardiac myocytes |
| 0.0 | 1.1 | PID AP1 PATHWAY | AP-1 transcription factor network |
| 0.0 | 0.7 | PID AURORA B PATHWAY | Aurora B signaling |
| 0.0 | 0.8 | PID RAS PATHWAY | Regulation of Ras family activation |
| 0.0 | 1.1 | PID ERA GENOMIC PATHWAY | Validated nuclear estrogen receptor alpha network |
| 0.0 | 0.4 | SA FAS SIGNALING | The TNF-type receptor Fas induces apoptosis on ligand binding. |
| 0.0 | 0.2 | PID CD8 TCR PATHWAY | TCR signaling in naïve CD8+ T cells |
Gene overrepresentation in C2:CP:REACTOME category:
| Log-likelihood per target | Total log-likelihood | Term | Description |
|---|---|---|---|
| 0.2 | 2.4 | REACTOME ACTIVATION OF CHAPERONE GENES BY ATF6 ALPHA | Genes involved in Activation of Chaperone Genes by ATF6-alpha |
| 0.1 | 2.9 | REACTOME PROCESSING OF INTRONLESS PRE MRNAS | Genes involved in Processing of Intronless Pre-mRNAs |
| 0.1 | 1.9 | REACTOME MTORC1 MEDIATED SIGNALLING | Genes involved in mTORC1-mediated signalling |
| 0.1 | 1.7 | REACTOME PLATELET CALCIUM HOMEOSTASIS | Genes involved in Platelet calcium homeostasis |
| 0.1 | 1.1 | REACTOME PURINE CATABOLISM | Genes involved in Purine catabolism |
| 0.1 | 2.2 | REACTOME DEADENYLATION OF MRNA | Genes involved in Deadenylation of mRNA |
| 0.1 | 1.6 | REACTOME RAS ACTIVATION UOPN CA2 INFUX THROUGH NMDA RECEPTOR | Genes involved in Ras activation uopn Ca2+ infux through NMDA receptor |
| 0.0 | 5.1 | REACTOME LOSS OF NLP FROM MITOTIC CENTROSOMES | Genes involved in Loss of Nlp from mitotic centrosomes |
| 0.0 | 0.2 | REACTOME BINDING AND ENTRY OF HIV VIRION | Genes involved in Binding and entry of HIV virion |
| 0.0 | 0.4 | REACTOME SYNTHESIS SECRETION AND DEACYLATION OF GHRELIN | Genes involved in Synthesis, Secretion, and Deacylation of Ghrelin |
| 0.0 | 1.4 | REACTOME CHEMOKINE RECEPTORS BIND CHEMOKINES | Genes involved in Chemokine receptors bind chemokines |
| 0.0 | 5.6 | REACTOME MITOTIC PROMETAPHASE | Genes involved in Mitotic Prometaphase |
| 0.0 | 0.4 | REACTOME REGULATION OF THE FANCONI ANEMIA PATHWAY | Genes involved in Regulation of the Fanconi anemia pathway |
| 0.0 | 0.5 | REACTOME PROCESSING OF CAPPED INTRONLESS PRE MRNA | Genes involved in Processing of Capped Intronless Pre-mRNA |
| 0.0 | 1.9 | REACTOME G1 PHASE | Genes involved in G1 Phase |
| 0.0 | 0.2 | REACTOME KINESINS | Genes involved in Kinesins |
| 0.0 | 0.5 | REACTOME REMOVAL OF THE FLAP INTERMEDIATE FROM THE C STRAND | Genes involved in Removal of the Flap Intermediate from the C-strand |
| 0.0 | 0.7 | REACTOME ANTIVIRAL MECHANISM BY IFN STIMULATED GENES | Genes involved in Antiviral mechanism by IFN-stimulated genes |
| 0.0 | 1.0 | REACTOME PREFOLDIN MEDIATED TRANSFER OF SUBSTRATE TO CCT TRIC | Genes involved in Prefoldin mediated transfer of substrate to CCT/TriC |
| 0.0 | 0.2 | REACTOME SEROTONIN RECEPTORS | Genes involved in Serotonin receptors |
| 0.0 | 0.9 | REACTOME REGULATION OF KIT SIGNALING | Genes involved in Regulation of KIT signaling |
| 0.0 | 0.5 | REACTOME CYCLIN A B1 ASSOCIATED EVENTS DURING G2 M TRANSITION | Genes involved in Cyclin A/B1 associated events during G2/M transition |
| 0.0 | 0.5 | REACTOME IKK COMPLEX RECRUITMENT MEDIATED BY RIP1 | Genes involved in IKK complex recruitment mediated by RIP1 |
| 0.0 | 1.1 | REACTOME DOWNSTREAM TCR SIGNALING | Genes involved in Downstream TCR signaling |
| 0.0 | 0.9 | REACTOME CHOLESTEROL BIOSYNTHESIS | Genes involved in Cholesterol biosynthesis |
| 0.0 | 0.6 | REACTOME MRNA SPLICING MINOR PATHWAY | Genes involved in mRNA Splicing - Minor Pathway |
| 0.0 | 0.3 | REACTOME SYNTHESIS OF PIPS AT THE LATE ENDOSOME MEMBRANE | Genes involved in Synthesis of PIPs at the late endosome membrane |
| 0.0 | 0.7 | REACTOME CELL EXTRACELLULAR MATRIX INTERACTIONS | Genes involved in Cell-extracellular matrix interactions |
| 0.0 | 3.5 | REACTOME SRP DEPENDENT COTRANSLATIONAL PROTEIN TARGETING TO MEMBRANE | Genes involved in SRP-dependent cotranslational protein targeting to membrane |
| 0.0 | 0.5 | REACTOME REGULATION OF AMPK ACTIVITY VIA LKB1 | Genes involved in Regulation of AMPK activity via LKB1 |
| 0.0 | 0.5 | REACTOME RETROGRADE NEUROTROPHIN SIGNALLING | Genes involved in Retrograde neurotrophin signalling |
| 0.0 | 0.2 | REACTOME MICRORNA MIRNA BIOGENESIS | Genes involved in MicroRNA (miRNA) Biogenesis |
| 0.0 | 0.3 | REACTOME SYNTHESIS OF SUBSTRATES IN N GLYCAN BIOSYTHESIS | Genes involved in Synthesis of substrates in N-glycan biosythesis |
| 0.0 | 0.6 | REACTOME RNA POL III TRANSCRIPTION INITIATION FROM TYPE 3 PROMOTER | Genes involved in RNA Polymerase III Transcription Initiation From Type 3 Promoter |
| 0.0 | 0.2 | REACTOME CTNNB1 PHOSPHORYLATION CASCADE | Genes involved in Beta-catenin phosphorylation cascade |
| 0.0 | 0.3 | REACTOME HYALURONAN UPTAKE AND DEGRADATION | Genes involved in Hyaluronan uptake and degradation |
| 0.0 | 0.5 | REACTOME ZINC TRANSPORTERS | Genes involved in Zinc transporters |
| 0.0 | 1.5 | REACTOME NOTCH1 INTRACELLULAR DOMAIN REGULATES TRANSCRIPTION | Genes involved in NOTCH1 Intracellular Domain Regulates Transcription |
| 0.0 | 0.2 | REACTOME INTEGRATION OF PROVIRUS | Genes involved in Integration of provirus |
| 0.0 | 0.2 | REACTOME PRE NOTCH TRANSCRIPTION AND TRANSLATION | Genes involved in Pre-NOTCH Transcription and Translation |
| 0.0 | 0.3 | REACTOME SYNTHESIS OF PE | Genes involved in Synthesis of PE |
| 0.0 | 0.1 | REACTOME RAF MAP KINASE CASCADE | Genes involved in RAF/MAP kinase cascade |
| 0.0 | 0.4 | REACTOME CRMPS IN SEMA3A SIGNALING | Genes involved in CRMPs in Sema3A signaling |
| 0.0 | 0.3 | REACTOME TGF BETA RECEPTOR SIGNALING IN EMT EPITHELIAL TO MESENCHYMAL TRANSITION | Genes involved in TGF-beta receptor signaling in EMT (epithelial to mesenchymal transition) |
| 0.0 | 0.2 | REACTOME POST CHAPERONIN TUBULIN FOLDING PATHWAY | Genes involved in Post-chaperonin tubulin folding pathway |
| 0.0 | 1.7 | REACTOME MEIOSIS | Genes involved in Meiosis |
| 0.0 | 0.2 | REACTOME FANCONI ANEMIA PATHWAY | Genes involved in Fanconi Anemia pathway |
| 0.0 | 1.1 | REACTOME MRNA SPLICING | Genes involved in mRNA Splicing |
| 0.0 | 0.2 | REACTOME RESOLUTION OF AP SITES VIA THE SINGLE NUCLEOTIDE REPLACEMENT PATHWAY | Genes involved in Resolution of AP sites via the single-nucleotide replacement pathway |
| 0.0 | 0.3 | REACTOME SIGNAL TRANSDUCTION BY L1 | Genes involved in Signal transduction by L1 |
| 0.0 | 0.4 | REACTOME YAP1 AND WWTR1 TAZ STIMULATED GENE EXPRESSION | Genes involved in YAP1- and WWTR1 (TAZ)-stimulated gene expression |
| 0.0 | 0.3 | REACTOME PROSTACYCLIN SIGNALLING THROUGH PROSTACYCLIN RECEPTOR | Genes involved in Prostacyclin signalling through prostacyclin receptor |
| 0.0 | 0.5 | REACTOME BASIGIN INTERACTIONS | Genes involved in Basigin interactions |