Project
A549 cells infected with IAV Analysis Results (GEO series: GSE147507)
Navigation
Downloads
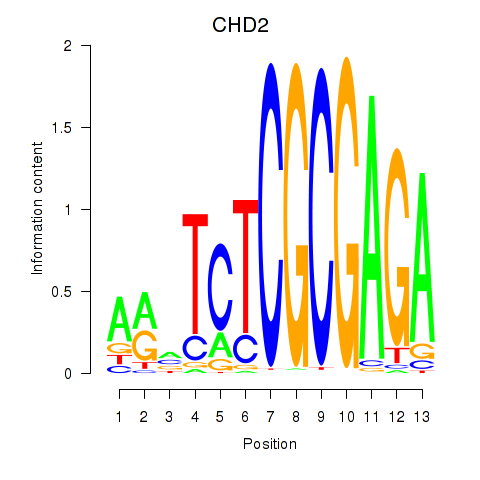
Results for ZBTB33_CHD2
Z-value: 3.15
Motif logo

Transcription factors associated with ZBTB33_CHD2
| Gene Symbol | Gene ID | Gene Info |
|---|---|---|
|
ZBTB33
|
ENSG00000177485.6 | zinc finger and BTB domain containing 33 |
|
CHD2
|
ENSG00000173575.14 | chromodomain helicase DNA binding protein 2 |
Activity-expression correlation:
| Gene | Promoter | Pearson corr. coef. | P-value | Plot |
|---|---|---|---|---|
| ZBTB33 | hg19_v2_chrX_+_119384607_119384720 | 1.00 | 1.7e-03 | Click! |
| CHD2 | hg19_v2_chr15_+_93447675_93447703 | 0.79 | 2.1e-01 | Click! |
Activity profile of ZBTB33_CHD2 motif
Sorted Z-values of ZBTB33_CHD2 motif
Network of associatons between targets according to the STRING database.

First level regulatory network of ZBTB33_CHD2
Gene Ontology Analysis
Gene overrepresentation in biological_process category:
| Log-likelihood per target | Total log-likelihood | Term | Description |
|---|---|---|---|
| 0.8 | 2.3 | GO:0035508 | positive regulation of myosin-light-chain-phosphatase activity(GO:0035508) |
| 0.5 | 0.5 | GO:0006851 | mitochondrial calcium ion transport(GO:0006851) |
| 0.5 | 2.0 | GO:0006422 | aspartyl-tRNA aminoacylation(GO:0006422) |
| 0.4 | 1.7 | GO:0032915 | positive regulation of transforming growth factor beta2 production(GO:0032915) |
| 0.4 | 1.5 | GO:1902683 | positive regulation of long-term neuronal synaptic plasticity(GO:0048170) regulation of receptor localization to synapse(GO:1902683) |
| 0.3 | 1.8 | GO:0070537 | histone H2A K63-linked deubiquitination(GO:0070537) |
| 0.3 | 0.9 | GO:0007076 | mitotic chromosome condensation(GO:0007076) |
| 0.3 | 1.1 | GO:1990167 | protein K27-linked deubiquitination(GO:1990167) protein K33-linked deubiquitination(GO:1990168) |
| 0.3 | 1.1 | GO:0035522 | monoubiquitinated histone deubiquitination(GO:0035521) monoubiquitinated histone H2A deubiquitination(GO:0035522) |
| 0.3 | 1.1 | GO:0031508 | pericentric heterochromatin assembly(GO:0031508) |
| 0.3 | 2.1 | GO:1905068 | positive regulation of ephrin receptor signaling pathway(GO:1901189) positive regulation of canonical Wnt signaling pathway involved in cardiac muscle cell fate commitment(GO:1901297) positive regulation of canonical Wnt signaling pathway involved in heart development(GO:1905068) |
| 0.3 | 0.8 | GO:0000967 | endonucleolytic cleavage to generate mature 5'-end of SSU-rRNA from (SSU-rRNA, 5.8S rRNA, LSU-rRNA)(GO:0000472) rRNA 5'-end processing(GO:0000967) ncRNA 5'-end processing(GO:0034471) |
| 0.2 | 1.5 | GO:0016476 | regulation of embryonic cell shape(GO:0016476) |
| 0.2 | 0.7 | GO:0071048 | nuclear mRNA surveillance of spliceosomal pre-mRNA splicing(GO:0071030) nuclear retention of unspliced pre-mRNA at the site of transcription(GO:0071048) |
| 0.2 | 1.1 | GO:0051083 | 'de novo' cotranslational protein folding(GO:0051083) |
| 0.2 | 2.9 | GO:1901409 | positive regulation of phosphorylation of RNA polymerase II C-terminal domain(GO:1901409) |
| 0.2 | 0.8 | GO:0046947 | hydroxylysine metabolic process(GO:0046946) hydroxylysine biosynthetic process(GO:0046947) |
| 0.2 | 3.2 | GO:1901838 | positive regulation of transcription of nuclear large rRNA transcript from RNA polymerase I promoter(GO:1901838) |
| 0.2 | 0.9 | GO:0001831 | trophectodermal cellular morphogenesis(GO:0001831) |
| 0.2 | 0.2 | GO:0072717 | cellular response to actinomycin D(GO:0072717) |
| 0.2 | 0.6 | GO:0031204 | posttranslational protein targeting to membrane, translocation(GO:0031204) |
| 0.2 | 0.5 | GO:0090158 | endoplasmic reticulum membrane organization(GO:0090158) |
| 0.2 | 0.8 | GO:0070682 | proteasome regulatory particle assembly(GO:0070682) |
| 0.2 | 0.6 | GO:1990637 | response to prolactin(GO:1990637) |
| 0.2 | 0.5 | GO:0097156 | fasciculation of motor neuron axon(GO:0097156) |
| 0.1 | 1.0 | GO:0033484 | nitric oxide homeostasis(GO:0033484) |
| 0.1 | 1.2 | GO:1902255 | positive regulation of intrinsic apoptotic signaling pathway by p53 class mediator(GO:1902255) |
| 0.1 | 0.1 | GO:0014839 | myoblast migration involved in skeletal muscle regeneration(GO:0014839) |
| 0.1 | 0.4 | GO:0007387 | anterior compartment pattern formation(GO:0007387) posterior compartment specification(GO:0007388) |
| 0.1 | 0.5 | GO:0036292 | DNA rewinding(GO:0036292) |
| 0.1 | 0.7 | GO:0032911 | negative regulation of transforming growth factor beta1 production(GO:0032911) |
| 0.1 | 0.5 | GO:0018312 | peptidyl-serine ADP-ribosylation(GO:0018312) |
| 0.1 | 0.7 | GO:0071651 | positive regulation of chemokine (C-C motif) ligand 5 production(GO:0071651) |
| 0.1 | 1.0 | GO:0061470 | T follicular helper cell differentiation(GO:0061470) |
| 0.1 | 0.5 | GO:1903778 | protein localization to vacuolar membrane(GO:1903778) |
| 0.1 | 0.3 | GO:1904404 | cellular response to vitamin B1(GO:0071301) response to formaldehyde(GO:1904404) |
| 0.1 | 1.2 | GO:2000288 | positive regulation of myoblast proliferation(GO:2000288) |
| 0.1 | 0.3 | GO:0097198 | cell migration involved in vasculogenesis(GO:0035441) histone H3-K36 trimethylation(GO:0097198) |
| 0.1 | 2.1 | GO:0034501 | protein localization to kinetochore(GO:0034501) |
| 0.1 | 0.4 | GO:2000176 | regulation of pro-T cell differentiation(GO:2000174) positive regulation of pro-T cell differentiation(GO:2000176) |
| 0.1 | 1.0 | GO:0051415 | interphase microtubule nucleation by interphase microtubule organizing center(GO:0051415) microtubule nucleation by microtubule organizing center(GO:0051418) |
| 0.1 | 0.4 | GO:0071043 | CUT catabolic process(GO:0071034) CUT metabolic process(GO:0071043) |
| 0.1 | 0.3 | GO:0006433 | glutamyl-tRNA aminoacylation(GO:0006424) prolyl-tRNA aminoacylation(GO:0006433) |
| 0.1 | 0.3 | GO:1990519 | pyrimidine nucleotide transport(GO:0006864) mitochondrial pyrimidine nucleotide import(GO:1990519) |
| 0.1 | 0.3 | GO:0002188 | translation reinitiation(GO:0002188) |
| 0.1 | 0.5 | GO:0006620 | posttranslational protein targeting to membrane(GO:0006620) |
| 0.1 | 0.5 | GO:0031291 | Ran protein signal transduction(GO:0031291) |
| 0.1 | 0.3 | GO:0014016 | neuroblast differentiation(GO:0014016) |
| 0.1 | 1.0 | GO:0006890 | retrograde vesicle-mediated transport, Golgi to ER(GO:0006890) |
| 0.1 | 0.9 | GO:0006398 | mRNA 3'-end processing by stem-loop binding and cleavage(GO:0006398) |
| 0.1 | 0.4 | GO:0060032 | notochord regression(GO:0060032) |
| 0.1 | 0.4 | GO:1901073 | N-acetylglucosamine biosynthetic process(GO:0006045) glucosamine-containing compound biosynthetic process(GO:1901073) |
| 0.1 | 0.4 | GO:0046504 | ether lipid biosynthetic process(GO:0008611) glycerol ether biosynthetic process(GO:0046504) ether biosynthetic process(GO:1901503) |
| 0.1 | 0.3 | GO:0032455 | nerve growth factor processing(GO:0032455) |
| 0.1 | 0.3 | GO:0042264 | peptidyl-aspartic acid hydroxylation(GO:0042264) |
| 0.1 | 0.8 | GO:0060699 | regulation of endoribonuclease activity(GO:0060699) |
| 0.1 | 1.4 | GO:0036500 | ATF6-mediated unfolded protein response(GO:0036500) |
| 0.1 | 2.2 | GO:0003334 | keratinocyte development(GO:0003334) |
| 0.1 | 0.3 | GO:0006617 | SRP-dependent cotranslational protein targeting to membrane, signal sequence recognition(GO:0006617) |
| 0.1 | 0.2 | GO:0036369 | transcription factor catabolic process(GO:0036369) |
| 0.1 | 0.2 | GO:2000646 | positive regulation of receptor catabolic process(GO:2000646) |
| 0.1 | 0.2 | GO:1904815 | negative regulation of protein localization to chromosome, telomeric region(GO:1904815) |
| 0.1 | 0.2 | GO:0003220 | left ventricular cardiac muscle tissue morphogenesis(GO:0003220) cell proliferation involved in heart valve morphogenesis(GO:0003249) regulation of cell proliferation involved in heart valve morphogenesis(GO:0003250) |
| 0.1 | 0.3 | GO:1903722 | negative regulation of exosomal secretion(GO:1903542) regulation of centriole elongation(GO:1903722) |
| 0.1 | 0.4 | GO:0003350 | pulmonary myocardium development(GO:0003350) |
| 0.1 | 0.3 | GO:0043504 | mitochondrial DNA repair(GO:0043504) |
| 0.1 | 0.2 | GO:0070318 | positive regulation of G0 to G1 transition(GO:0070318) |
| 0.1 | 0.5 | GO:0051012 | microtubule sliding(GO:0051012) |
| 0.1 | 0.2 | GO:0060931 | sinoatrial node cell development(GO:0060931) |
| 0.1 | 0.5 | GO:0033133 | positive regulation of glucokinase activity(GO:0033133) positive regulation of hexokinase activity(GO:1903301) |
| 0.1 | 0.4 | GO:1903361 | protein localization to basolateral plasma membrane(GO:1903361) |
| 0.1 | 0.5 | GO:0038195 | urokinase plasminogen activator signaling pathway(GO:0038195) |
| 0.1 | 0.4 | GO:1903862 | positive regulation of oxidative phosphorylation(GO:1903862) |
| 0.1 | 0.3 | GO:1904806 | regulation of protein oxidation(GO:1904806) positive regulation of protein oxidation(GO:1904808) |
| 0.1 | 0.2 | GO:0007113 | endomitotic cell cycle(GO:0007113) |
| 0.1 | 0.3 | GO:0060979 | vasculogenesis involved in coronary vascular morphogenesis(GO:0060979) |
| 0.1 | 0.2 | GO:0051562 | negative regulation of mitochondrial calcium ion concentration(GO:0051562) |
| 0.1 | 0.1 | GO:0006286 | base-excision repair, base-free sugar-phosphate removal(GO:0006286) |
| 0.1 | 0.4 | GO:0035990 | tendon cell differentiation(GO:0035990) tendon formation(GO:0035992) |
| 0.1 | 0.2 | GO:0071264 | regulation of eIF2 alpha phosphorylation by amino acid starvation(GO:0060733) regulation of translational initiation in response to starvation(GO:0071262) positive regulation of translational initiation in response to starvation(GO:0071264) |
| 0.1 | 0.2 | GO:0015842 | aminergic neurotransmitter loading into synaptic vesicle(GO:0015842) sequestering of neurotransmitter(GO:0042137) |
| 0.1 | 0.2 | GO:0035621 | ER to Golgi ceramide transport(GO:0035621) |
| 0.1 | 0.5 | GO:0070966 | nuclear-transcribed mRNA catabolic process, no-go decay(GO:0070966) |
| 0.1 | 0.3 | GO:0048698 | negative regulation of collateral sprouting in absence of injury(GO:0048698) |
| 0.1 | 0.1 | GO:0035880 | embryonic nail plate morphogenesis(GO:0035880) |
| 0.1 | 0.5 | GO:0035520 | monoubiquitinated protein deubiquitination(GO:0035520) |
| 0.1 | 0.3 | GO:0061626 | lateral mesodermal cell fate commitment(GO:0048372) lateral mesodermal cell fate specification(GO:0048377) regulation of lateral mesodermal cell fate specification(GO:0048378) BMP signaling pathway involved in heart development(GO:0061312) pharyngeal arch artery morphogenesis(GO:0061626) |
| 0.1 | 0.4 | GO:0048388 | endosomal lumen acidification(GO:0048388) |
| 0.1 | 0.5 | GO:0042780 | tRNA 3'-end processing(GO:0042780) |
| 0.1 | 1.1 | GO:0010501 | RNA secondary structure unwinding(GO:0010501) |
| 0.1 | 1.0 | GO:1904871 | regulation of protein localization to Cajal body(GO:1904869) positive regulation of protein localization to Cajal body(GO:1904871) |
| 0.1 | 0.2 | GO:1901301 | regulation of cargo loading into COPII-coated vesicle(GO:1901301) |
| 0.1 | 0.4 | GO:0045204 | MAPK export from nucleus(GO:0045204) |
| 0.1 | 0.5 | GO:0006983 | ER overload response(GO:0006983) |
| 0.1 | 0.6 | GO:0000389 | mRNA 3'-splice site recognition(GO:0000389) |
| 0.1 | 2.0 | GO:0042776 | mitochondrial ATP synthesis coupled proton transport(GO:0042776) |
| 0.1 | 0.2 | GO:0033140 | negative regulation of peptidyl-serine phosphorylation of STAT protein(GO:0033140) |
| 0.1 | 0.4 | GO:0006102 | isocitrate metabolic process(GO:0006102) |
| 0.1 | 0.3 | GO:0015917 | aminophospholipid transport(GO:0015917) |
| 0.1 | 0.3 | GO:0048478 | replication fork protection(GO:0048478) |
| 0.1 | 0.6 | GO:0010032 | meiotic chromosome condensation(GO:0010032) |
| 0.1 | 0.2 | GO:0097187 | dentinogenesis(GO:0097187) |
| 0.1 | 0.2 | GO:0051866 | general adaptation syndrome(GO:0051866) |
| 0.1 | 0.2 | GO:0033504 | floor plate development(GO:0033504) |
| 0.1 | 0.2 | GO:1904434 | positive regulation of iron ion transport(GO:0034758) positive regulation of iron ion transmembrane transport(GO:0034761) regulation of iron ion import(GO:1900390) regulation of ferrous iron import into cell(GO:1903989) positive regulation of ferrous iron import into cell(GO:1903991) regulation of ferrous iron binding(GO:1904432) positive regulation of ferrous iron binding(GO:1904434) regulation of transferrin receptor binding(GO:1904435) positive regulation of transferrin receptor binding(GO:1904437) regulation of ferrous iron import across plasma membrane(GO:1904438) positive regulation of ferrous iron import across plasma membrane(GO:1904440) |
| 0.1 | 0.3 | GO:0042701 | progesterone secretion(GO:0042701) |
| 0.0 | 0.4 | GO:0072402 | response to cell cycle checkpoint signaling(GO:0072396) response to DNA integrity checkpoint signaling(GO:0072402) response to DNA damage checkpoint signaling(GO:0072423) |
| 0.0 | 1.5 | GO:0033962 | cytoplasmic mRNA processing body assembly(GO:0033962) |
| 0.0 | 0.4 | GO:0001920 | negative regulation of receptor recycling(GO:0001920) |
| 0.0 | 0.2 | GO:2001279 | regulation of prostaglandin biosynthetic process(GO:0031392) regulation of unsaturated fatty acid biosynthetic process(GO:2001279) |
| 0.0 | 0.2 | GO:0060743 | epithelial cell maturation involved in prostate gland development(GO:0060743) |
| 0.0 | 0.7 | GO:0060287 | epithelial cilium movement involved in determination of left/right asymmetry(GO:0060287) |
| 0.0 | 0.1 | GO:0045900 | negative regulation of translational elongation(GO:0045900) |
| 0.0 | 2.7 | GO:0070979 | protein K11-linked ubiquitination(GO:0070979) |
| 0.0 | 0.3 | GO:1904751 | positive regulation of protein localization to nucleolus(GO:1904751) |
| 0.0 | 0.2 | GO:0032713 | negative regulation of interleukin-4 production(GO:0032713) |
| 0.0 | 0.3 | GO:1900194 | negative regulation of oocyte maturation(GO:1900194) |
| 0.0 | 0.4 | GO:0006552 | leucine catabolic process(GO:0006552) |
| 0.0 | 0.3 | GO:0090267 | positive regulation of mitotic cell cycle spindle assembly checkpoint(GO:0090267) |
| 0.0 | 0.2 | GO:0006382 | adenosine to inosine editing(GO:0006382) |
| 0.0 | 0.2 | GO:1990022 | RNA polymerase II complex import to nucleus(GO:0044376) RNA polymerase III complex localization to nucleus(GO:1990022) |
| 0.0 | 0.3 | GO:0034146 | toll-like receptor 5 signaling pathway(GO:0034146) |
| 0.0 | 0.2 | GO:0071596 | ubiquitin-dependent protein catabolic process via the N-end rule pathway(GO:0071596) |
| 0.0 | 0.5 | GO:0070816 | phosphorylation of RNA polymerase II C-terminal domain(GO:0070816) |
| 0.0 | 0.2 | GO:1902510 | regulation of apoptotic DNA fragmentation(GO:1902510) |
| 0.0 | 0.1 | GO:0021861 | forebrain radial glial cell differentiation(GO:0021861) |
| 0.0 | 1.0 | GO:0006474 | N-terminal protein amino acid acetylation(GO:0006474) |
| 0.0 | 0.1 | GO:0071140 | resolution of recombination intermediates(GO:0071139) resolution of mitotic recombination intermediates(GO:0071140) |
| 0.0 | 0.2 | GO:1903381 | neuron intrinsic apoptotic signaling pathway in response to endoplasmic reticulum stress(GO:0036483) regulation of endoplasmic reticulum stress-induced neuron intrinsic apoptotic signaling pathway(GO:1903381) negative regulation of endoplasmic reticulum stress-induced neuron intrinsic apoptotic signaling pathway(GO:1903382) |
| 0.0 | 0.2 | GO:2001038 | regulation of cellular response to drug(GO:2001038) |
| 0.0 | 2.4 | GO:0000413 | protein peptidyl-prolyl isomerization(GO:0000413) |
| 0.0 | 0.2 | GO:0014886 | transition between slow and fast fiber(GO:0014886) |
| 0.0 | 0.3 | GO:1902741 | interferon-alpha secretion(GO:0072642) regulation of interferon-alpha secretion(GO:1902739) positive regulation of interferon-alpha secretion(GO:1902741) |
| 0.0 | 0.7 | GO:0051315 | attachment of mitotic spindle microtubules to kinetochore(GO:0051315) |
| 0.0 | 0.4 | GO:0022618 | ribonucleoprotein complex assembly(GO:0022618) |
| 0.0 | 0.2 | GO:0010216 | maintenance of DNA methylation(GO:0010216) |
| 0.0 | 1.8 | GO:0045494 | photoreceptor cell maintenance(GO:0045494) |
| 0.0 | 0.4 | GO:0010265 | SCF complex assembly(GO:0010265) |
| 0.0 | 0.2 | GO:0021849 | neuroblast division in subventricular zone(GO:0021849) |
| 0.0 | 0.2 | GO:0090031 | positive regulation of steroid hormone biosynthetic process(GO:0090031) |
| 0.0 | 0.3 | GO:1903433 | regulation of constitutive secretory pathway(GO:1903433) |
| 0.0 | 0.2 | GO:0045054 | constitutive secretory pathway(GO:0045054) |
| 0.0 | 0.1 | GO:0035519 | positive regulation of T cell anergy(GO:0002669) positive regulation of lymphocyte anergy(GO:0002913) protein K29-linked ubiquitination(GO:0035519) |
| 0.0 | 0.2 | GO:0019065 | receptor-mediated endocytosis of virus by host cell(GO:0019065) endocytosis involved in viral entry into host cell(GO:0075509) |
| 0.0 | 0.3 | GO:0051684 | maintenance of Golgi location(GO:0051684) |
| 0.0 | 0.3 | GO:0032020 | ISG15-protein conjugation(GO:0032020) |
| 0.0 | 0.5 | GO:0015074 | DNA integration(GO:0015074) |
| 0.0 | 1.1 | GO:0000470 | maturation of LSU-rRNA(GO:0000470) |
| 0.0 | 0.2 | GO:0043932 | ossification involved in bone remodeling(GO:0043932) |
| 0.0 | 0.3 | GO:0000056 | ribosomal small subunit export from nucleus(GO:0000056) |
| 0.0 | 0.2 | GO:0006001 | fructose catabolic process(GO:0006001) fructose catabolic process to hydroxyacetone phosphate and glyceraldehyde-3-phosphate(GO:0061624) |
| 0.0 | 1.0 | GO:0010996 | response to auditory stimulus(GO:0010996) |
| 0.0 | 0.2 | GO:1902775 | mitochondrial large ribosomal subunit assembly(GO:1902775) |
| 0.0 | 0.6 | GO:0001682 | tRNA 5'-leader removal(GO:0001682) |
| 0.0 | 0.2 | GO:0030309 | poly-N-acetyllactosamine metabolic process(GO:0030309) poly-N-acetyllactosamine biosynthetic process(GO:0030311) |
| 0.0 | 0.2 | GO:0085020 | protein K6-linked ubiquitination(GO:0085020) |
| 0.0 | 0.2 | GO:0000738 | DNA catabolic process, exonucleolytic(GO:0000738) |
| 0.0 | 0.2 | GO:1903347 | negative regulation of bicellular tight junction assembly(GO:1903347) |
| 0.0 | 0.1 | GO:0035625 | regulation of epinephrine secretion(GO:0014060) negative regulation of epinephrine secretion(GO:0032811) epidermal growth factor-activated receptor transactivation by G-protein coupled receptor signaling pathway(GO:0035625) epinephrine secretion(GO:0048242) |
| 0.0 | 0.1 | GO:0032289 | central nervous system myelin formation(GO:0032289) |
| 0.0 | 0.5 | GO:0070070 | proton-transporting V-type ATPase complex assembly(GO:0070070) vacuolar proton-transporting V-type ATPase complex assembly(GO:0070072) |
| 0.0 | 0.2 | GO:1903070 | negative regulation of ER-associated ubiquitin-dependent protein catabolic process(GO:1903070) |
| 0.0 | 0.1 | GO:0072365 | regulation of cellular ketone metabolic process by negative regulation of transcription from RNA polymerase II promoter(GO:0072365) |
| 0.0 | 0.6 | GO:0019614 | catechol-containing compound catabolic process(GO:0019614) catecholamine catabolic process(GO:0042424) |
| 0.0 | 0.5 | GO:0042354 | fucose catabolic process(GO:0019317) L-fucose metabolic process(GO:0042354) L-fucose catabolic process(GO:0042355) |
| 0.0 | 0.4 | GO:0045040 | protein import into mitochondrial outer membrane(GO:0045040) |
| 0.0 | 0.2 | GO:0043353 | enucleate erythrocyte differentiation(GO:0043353) |
| 0.0 | 0.2 | GO:0018057 | peptidyl-lysine oxidation(GO:0018057) |
| 0.0 | 0.2 | GO:0033512 | L-lysine catabolic process to acetyl-CoA via saccharopine(GO:0033512) L-kynurenine metabolic process(GO:0097052) |
| 0.0 | 0.2 | GO:0098728 | germ-line stem cell division(GO:0042078) male germ-line stem cell asymmetric division(GO:0048133) germline stem cell asymmetric division(GO:0098728) |
| 0.0 | 4.0 | GO:0002181 | cytoplasmic translation(GO:0002181) |
| 0.0 | 0.4 | GO:0034720 | histone H3-K4 demethylation(GO:0034720) |
| 0.0 | 0.1 | GO:0045787 | positive regulation of cell cycle(GO:0045787) |
| 0.0 | 0.1 | GO:2000234 | positive regulation of ribosome biogenesis(GO:0090070) positive regulation of rRNA processing(GO:2000234) |
| 0.0 | 0.4 | GO:0051096 | positive regulation of helicase activity(GO:0051096) |
| 0.0 | 0.1 | GO:0003169 | coronary vein morphogenesis(GO:0003169) regulation of protein kinase D signaling(GO:1903570) positive regulation of protein kinase D signaling(GO:1903572) |
| 0.0 | 0.6 | GO:0090110 | cargo loading into COPII-coated vesicle(GO:0090110) |
| 0.0 | 0.1 | GO:0034976 | response to endoplasmic reticulum stress(GO:0034976) |
| 0.0 | 0.1 | GO:0019521 | aldonic acid metabolic process(GO:0019520) D-gluconate metabolic process(GO:0019521) |
| 0.0 | 0.2 | GO:0036159 | inner dynein arm assembly(GO:0036159) |
| 0.0 | 0.1 | GO:0043311 | regulation of eosinophil degranulation(GO:0043309) positive regulation of eosinophil degranulation(GO:0043311) positive regulation of eosinophil activation(GO:1902568) |
| 0.0 | 0.2 | GO:0044565 | dendritic cell proliferation(GO:0044565) |
| 0.0 | 0.3 | GO:2000042 | negative regulation of double-strand break repair via homologous recombination(GO:2000042) |
| 0.0 | 0.1 | GO:0070901 | mitochondrial tRNA methylation(GO:0070901) |
| 0.0 | 0.0 | GO:0021539 | subthalamus development(GO:0021539) |
| 0.0 | 0.6 | GO:0006054 | N-acetylneuraminate metabolic process(GO:0006054) |
| 0.0 | 0.7 | GO:0007098 | centrosome cycle(GO:0007098) |
| 0.0 | 0.2 | GO:0000395 | mRNA 5'-splice site recognition(GO:0000395) |
| 0.0 | 0.2 | GO:0018343 | protein farnesylation(GO:0018343) |
| 0.0 | 0.2 | GO:2001295 | malonyl-CoA biosynthetic process(GO:2001295) |
| 0.0 | 0.9 | GO:0070987 | error-free translesion synthesis(GO:0070987) |
| 0.0 | 0.1 | GO:0017185 | peptidyl-lysine hydroxylation(GO:0017185) |
| 0.0 | 0.5 | GO:0001833 | inner cell mass cell proliferation(GO:0001833) |
| 0.0 | 0.1 | GO:0018153 | isopeptide cross-linking via N6-(L-isoglutamyl)-L-lysine(GO:0018153) isopeptide cross-linking(GO:0018262) |
| 0.0 | 0.1 | GO:0006742 | NADP catabolic process(GO:0006742) pyridine nucleotide catabolic process(GO:0019364) |
| 0.0 | 0.1 | GO:0006272 | leading strand elongation(GO:0006272) |
| 0.0 | 0.2 | GO:0030950 | establishment or maintenance of actin cytoskeleton polarity(GO:0030950) |
| 0.0 | 1.1 | GO:0006622 | protein targeting to lysosome(GO:0006622) |
| 0.0 | 0.4 | GO:0002566 | somatic diversification of immune receptors via somatic mutation(GO:0002566) somatic hypermutation of immunoglobulin genes(GO:0016446) |
| 0.0 | 0.1 | GO:0030718 | germ-line stem cell population maintenance(GO:0030718) |
| 0.0 | 0.2 | GO:0033387 | putrescine biosynthetic process from ornithine(GO:0033387) |
| 0.0 | 1.5 | GO:0035735 | intraciliary transport involved in cilium morphogenesis(GO:0035735) |
| 0.0 | 0.1 | GO:0043137 | DNA replication, removal of RNA primer(GO:0043137) |
| 0.0 | 0.2 | GO:0040032 | post-embryonic body morphogenesis(GO:0040032) regulation of parathyroid hormone secretion(GO:2000828) |
| 0.0 | 0.5 | GO:0090141 | positive regulation of mitochondrial fission(GO:0090141) |
| 0.0 | 0.2 | GO:0071352 | cellular response to interleukin-2(GO:0071352) |
| 0.0 | 0.4 | GO:0033539 | fatty acid beta-oxidation using acyl-CoA dehydrogenase(GO:0033539) |
| 0.0 | 0.1 | GO:0072369 | regulation of lipid transport by positive regulation of transcription from RNA polymerase II promoter(GO:0072369) |
| 0.0 | 0.2 | GO:0048386 | positive regulation of retinoic acid receptor signaling pathway(GO:0048386) |
| 0.0 | 1.0 | GO:0010738 | regulation of protein kinase A signaling(GO:0010738) |
| 0.0 | 0.2 | GO:0070995 | NADPH oxidation(GO:0070995) |
| 0.0 | 0.2 | GO:0051967 | negative regulation of synaptic transmission, glutamatergic(GO:0051967) |
| 0.0 | 0.0 | GO:0046122 | purine deoxyribonucleoside metabolic process(GO:0046122) |
| 0.0 | 0.9 | GO:0043666 | regulation of phosphoprotein phosphatase activity(GO:0043666) |
| 0.0 | 0.1 | GO:2000048 | negative regulation of cell-cell adhesion mediated by cadherin(GO:2000048) |
| 0.0 | 0.2 | GO:0038028 | insulin receptor signaling pathway via phosphatidylinositol 3-kinase(GO:0038028) |
| 0.0 | 0.2 | GO:1903608 | protein localization to cytoplasmic stress granule(GO:1903608) |
| 0.0 | 0.2 | GO:0045347 | negative regulation of MHC class II biosynthetic process(GO:0045347) |
| 0.0 | 1.0 | GO:0006692 | prostanoid metabolic process(GO:0006692) prostaglandin metabolic process(GO:0006693) |
| 0.0 | 0.2 | GO:0015798 | myo-inositol transport(GO:0015798) |
| 0.0 | 0.1 | GO:0051581 | negative regulation of neurotransmitter uptake(GO:0051581) serotonin uptake(GO:0051610) regulation of serotonin uptake(GO:0051611) negative regulation of serotonin uptake(GO:0051612) |
| 0.0 | 0.3 | GO:2001205 | negative regulation of osteoclast development(GO:2001205) |
| 0.0 | 0.1 | GO:0035459 | cargo loading into vesicle(GO:0035459) |
| 0.0 | 0.1 | GO:1901350 | cell-cell signaling involved in cell-cell junction organization(GO:1901350) |
| 0.0 | 0.0 | GO:0051891 | septum primum development(GO:0003284) septum secundum development(GO:0003285) atrial septum primum morphogenesis(GO:0003289) positive regulation of cardioblast differentiation(GO:0051891) |
| 0.0 | 0.2 | GO:0010890 | positive regulation of sequestering of triglyceride(GO:0010890) |
| 0.0 | 0.2 | GO:0048625 | myoblast fate commitment(GO:0048625) |
| 0.0 | 0.1 | GO:1900113 | negative regulation of histone H3-K9 trimethylation(GO:1900113) |
| 0.0 | 0.2 | GO:0097084 | vascular smooth muscle cell development(GO:0097084) |
| 0.0 | 0.8 | GO:0071174 | mitotic spindle checkpoint(GO:0071174) |
| 0.0 | 0.2 | GO:0021694 | cerebellar Purkinje cell layer formation(GO:0021694) cerebellar Purkinje cell differentiation(GO:0021702) |
| 0.0 | 0.2 | GO:0000492 | box C/D snoRNP assembly(GO:0000492) |
| 0.0 | 0.2 | GO:0000479 | endonucleolytic cleavage involved in rRNA processing(GO:0000478) endonucleolytic cleavage of tricistronic rRNA transcript (SSU-rRNA, 5.8S rRNA, LSU-rRNA)(GO:0000479) |
| 0.0 | 0.2 | GO:0010571 | positive regulation of nuclear cell cycle DNA replication(GO:0010571) |
| 0.0 | 0.3 | GO:0032688 | negative regulation of interferon-beta production(GO:0032688) |
| 0.0 | 0.0 | GO:1901727 | positive regulation of histone deacetylase activity(GO:1901727) |
| 0.0 | 0.2 | GO:0071896 | protein localization to adherens junction(GO:0071896) |
| 0.0 | 0.4 | GO:0032101 | regulation of response to external stimulus(GO:0032101) |
| 0.0 | 0.3 | GO:0061684 | chaperone-mediated autophagy(GO:0061684) regulation of chaperone-mediated autophagy(GO:1904714) |
| 0.0 | 0.2 | GO:0060282 | positive regulation of oocyte development(GO:0060282) |
| 0.0 | 1.6 | GO:0006826 | iron ion transport(GO:0006826) |
| 0.0 | 0.2 | GO:1900623 | regulation of monocyte aggregation(GO:1900623) positive regulation of monocyte aggregation(GO:1900625) |
| 0.0 | 0.0 | GO:0000965 | mitochondrial RNA 3'-end processing(GO:0000965) |
| 0.0 | 0.1 | GO:1902908 | regulation of monophenol monooxygenase activity(GO:0032771) positive regulation of monophenol monooxygenase activity(GO:0032773) negative regulation of transforming growth factor beta2 production(GO:0032912) negative regulation of catagen(GO:0051796) regulation of hair cycle by canonical Wnt signaling pathway(GO:0060901) regulation of melanosome transport(GO:1902908) positive regulation of melanosome transport(GO:1902910) |
| 0.0 | 0.4 | GO:0007250 | activation of NF-kappaB-inducing kinase activity(GO:0007250) |
| 0.0 | 0.1 | GO:0042713 | sperm ejaculation(GO:0042713) |
| 0.0 | 0.2 | GO:0090037 | positive regulation of protein kinase C signaling(GO:0090037) |
| 0.0 | 0.4 | GO:0031297 | replication fork processing(GO:0031297) |
| 0.0 | 0.2 | GO:0033143 | regulation of intracellular steroid hormone receptor signaling pathway(GO:0033143) |
| 0.0 | 0.2 | GO:0021869 | forebrain ventricular zone progenitor cell division(GO:0021869) |
| 0.0 | 0.1 | GO:0001927 | exocyst assembly(GO:0001927) |
| 0.0 | 0.7 | GO:0006359 | regulation of transcription from RNA polymerase III promoter(GO:0006359) |
| 0.0 | 0.2 | GO:0048280 | vesicle fusion with Golgi apparatus(GO:0048280) |
| 0.0 | 2.0 | GO:0070126 | mitochondrial translational termination(GO:0070126) |
| 0.0 | 0.1 | GO:0000103 | sulfate assimilation(GO:0000103) |
| 0.0 | 0.3 | GO:0051256 | mitotic spindle midzone assembly(GO:0051256) |
| 0.0 | 0.1 | GO:0046391 | 5-phosphoribose 1-diphosphate biosynthetic process(GO:0006015) 5-phosphoribose 1-diphosphate metabolic process(GO:0046391) |
| 0.0 | 0.3 | GO:0002643 | regulation of tolerance induction(GO:0002643) |
| 0.0 | 0.1 | GO:0045648 | positive regulation of erythrocyte differentiation(GO:0045648) |
| 0.0 | 0.5 | GO:0044342 | type B pancreatic cell proliferation(GO:0044342) |
| 0.0 | 0.4 | GO:0040020 | regulation of meiotic nuclear division(GO:0040020) |
| 0.0 | 0.3 | GO:0070493 | thrombin receptor signaling pathway(GO:0070493) |
| 0.0 | 0.4 | GO:0009083 | branched-chain amino acid catabolic process(GO:0009083) |
| 0.0 | 0.5 | GO:0010971 | positive regulation of G2/M transition of mitotic cell cycle(GO:0010971) |
| 0.0 | 0.4 | GO:0060441 | epithelial tube branching involved in lung morphogenesis(GO:0060441) |
| 0.0 | 0.1 | GO:0009257 | 10-formyltetrahydrofolate biosynthetic process(GO:0009257) |
| 0.0 | 0.4 | GO:0016254 | preassembly of GPI anchor in ER membrane(GO:0016254) |
| 0.0 | 0.7 | GO:0005980 | glycogen catabolic process(GO:0005980) |
| 0.0 | 0.1 | GO:0032752 | response to molecule of fungal origin(GO:0002238) serotonin production involved in inflammatory response(GO:0002351) serotonin secretion involved in inflammatory response(GO:0002442) serotonin secretion by platelet(GO:0002554) interleukin-3 production(GO:0032632) regulation of interleukin-3 production(GO:0032672) positive regulation of interleukin-3 production(GO:0032752) interleukin-3 biosynthetic process(GO:0042223) regulation of interleukin-3 biosynthetic process(GO:0045399) positive regulation of interleukin-3 biosynthetic process(GO:0045401) positive regulation of gamma-delta T cell differentiation(GO:0045588) cellular response to molecule of fungal origin(GO:0071226) |
| 0.0 | 0.3 | GO:0019511 | peptidyl-proline hydroxylation(GO:0019511) |
| 0.0 | 0.6 | GO:2000179 | positive regulation of neural precursor cell proliferation(GO:2000179) |
| 0.0 | 0.1 | GO:0006177 | GMP biosynthetic process(GO:0006177) |
| 0.0 | 0.2 | GO:0001829 | trophectodermal cell differentiation(GO:0001829) |
| 0.0 | 0.1 | GO:0048105 | establishment of body hair or bristle planar orientation(GO:0048104) establishment of body hair planar orientation(GO:0048105) |
| 0.0 | 0.2 | GO:0071392 | cellular response to estradiol stimulus(GO:0071392) |
| 0.0 | 0.5 | GO:0060334 | regulation of interferon-gamma-mediated signaling pathway(GO:0060334) |
| 0.0 | 0.9 | GO:0042059 | negative regulation of epidermal growth factor receptor signaling pathway(GO:0042059) |
| 0.0 | 0.4 | GO:0048490 | anterograde synaptic vesicle transport(GO:0048490) synaptic vesicle cytoskeletal transport(GO:0099514) synaptic vesicle transport along microtubule(GO:0099517) |
| 0.0 | 0.6 | GO:0007030 | Golgi organization(GO:0007030) |
| 0.0 | 0.8 | GO:0007218 | neuropeptide signaling pathway(GO:0007218) |
| 0.0 | 0.0 | GO:0045575 | basophil activation involved in immune response(GO:0002276) basophil activation(GO:0045575) |
| 0.0 | 0.3 | GO:0000338 | protein deneddylation(GO:0000338) |
| 0.0 | 0.2 | GO:0009407 | toxin catabolic process(GO:0009407) secondary metabolite catabolic process(GO:0090487) |
| 0.0 | 0.2 | GO:0090084 | negative regulation of inclusion body assembly(GO:0090084) |
| 0.0 | 0.0 | GO:0043585 | nose morphogenesis(GO:0043585) |
| 0.0 | 0.0 | GO:0035933 | glucocorticoid secretion(GO:0035933) regulation of glucocorticoid secretion(GO:2000849) |
| 0.0 | 0.2 | GO:0014829 | vascular smooth muscle contraction(GO:0014829) |
| 0.0 | 0.2 | GO:0071763 | nuclear membrane organization(GO:0071763) |
| 0.0 | 0.1 | GO:2001270 | regulation of cysteine-type endopeptidase activity involved in execution phase of apoptosis(GO:2001270) negative regulation of cysteine-type endopeptidase activity involved in execution phase of apoptosis(GO:2001271) |
| 0.0 | 0.2 | GO:0048096 | chromatin-mediated maintenance of transcription(GO:0048096) |
| 0.0 | 0.8 | GO:0045540 | regulation of cholesterol biosynthetic process(GO:0045540) |
| 0.0 | 1.3 | GO:0030433 | ER-associated ubiquitin-dependent protein catabolic process(GO:0030433) |
| 0.0 | 0.1 | GO:0019626 | short-chain fatty acid catabolic process(GO:0019626) |
| 0.0 | 0.4 | GO:0032418 | lysosome localization(GO:0032418) |
| 0.0 | 0.0 | GO:0002949 | tRNA threonylcarbamoyladenosine modification(GO:0002949) |
| 0.0 | 0.2 | GO:0097264 | self proteolysis(GO:0097264) |
| 0.0 | 0.4 | GO:0019054 | modulation by virus of host process(GO:0019054) |
| 0.0 | 0.1 | GO:0010499 | proteasomal ubiquitin-independent protein catabolic process(GO:0010499) |
| 0.0 | 0.2 | GO:0050812 | regulation of acetyl-CoA biosynthetic process from pyruvate(GO:0010510) regulation of acyl-CoA biosynthetic process(GO:0050812) |
| 0.0 | 0.1 | GO:0071313 | cellular response to caffeine(GO:0071313) |
| 0.0 | 1.0 | GO:0009301 | snRNA transcription(GO:0009301) snRNA transcription from RNA polymerase II promoter(GO:0042795) |
| 0.0 | 0.2 | GO:0048853 | forebrain morphogenesis(GO:0048853) |
| 0.0 | 0.1 | GO:0016584 | nucleosome positioning(GO:0016584) |
| 0.0 | 0.1 | GO:0010807 | regulation of synaptic vesicle priming(GO:0010807) |
| 0.0 | 0.2 | GO:0061099 | negative regulation of protein tyrosine kinase activity(GO:0061099) |
| 0.0 | 0.1 | GO:0048538 | thymus development(GO:0048538) |
| 0.0 | 0.7 | GO:0051291 | protein heterooligomerization(GO:0051291) |
| 0.0 | 0.2 | GO:0042755 | eating behavior(GO:0042755) |
| 0.0 | 0.1 | GO:2000210 | positive regulation of anoikis(GO:2000210) |
| 0.0 | 0.2 | GO:0006376 | mRNA splice site selection(GO:0006376) |
| 0.0 | 1.1 | GO:0010921 | regulation of phosphatase activity(GO:0010921) |
| 0.0 | 0.1 | GO:0001672 | regulation of chromatin assembly or disassembly(GO:0001672) |
| 0.0 | 0.1 | GO:0010569 | regulation of double-strand break repair via homologous recombination(GO:0010569) |
Gene overrepresentation in cellular_component category:
| Log-likelihood per target | Total log-likelihood | Term | Description |
|---|---|---|---|
| 0.4 | 1.1 | GO:0034455 | t-UTP complex(GO:0034455) |
| 0.3 | 0.8 | GO:0030689 | Noc complex(GO:0030689) |
| 0.2 | 0.7 | GO:0070685 | macropinocytic cup(GO:0070685) |
| 0.2 | 2.1 | GO:0002193 | MAML1-RBP-Jkappa- ICN1 complex(GO:0002193) |
| 0.2 | 0.5 | GO:0002944 | cyclin K-CDK12 complex(GO:0002944) |
| 0.2 | 3.2 | GO:0000940 | condensed chromosome outer kinetochore(GO:0000940) |
| 0.2 | 0.5 | GO:1990716 | axonemal central apparatus(GO:1990716) |
| 0.2 | 2.0 | GO:0070531 | BRCA1-A complex(GO:0070531) |
| 0.2 | 1.1 | GO:0000275 | mitochondrial proton-transporting ATP synthase complex, catalytic core F(1)(GO:0000275) |
| 0.1 | 1.6 | GO:0000836 | Hrd1p ubiquitin ligase complex(GO:0000836) |
| 0.1 | 1.9 | GO:0000796 | condensin complex(GO:0000796) |
| 0.1 | 2.3 | GO:0072357 | PTW/PP1 phosphatase complex(GO:0072357) |
| 0.1 | 0.9 | GO:1990726 | Lsm1-7-Pat1 complex(GO:1990726) |
| 0.1 | 1.1 | GO:0008274 | gamma-tubulin large complex(GO:0000931) gamma-tubulin ring complex(GO:0008274) |
| 0.1 | 0.5 | GO:0043291 | RAVE complex(GO:0043291) |
| 0.1 | 0.4 | GO:0035101 | FACT complex(GO:0035101) |
| 0.1 | 3.3 | GO:0030992 | intraciliary transport particle B(GO:0030992) |
| 0.1 | 0.7 | GO:0005956 | protein kinase CK2 complex(GO:0005956) |
| 0.1 | 2.4 | GO:0017101 | aminoacyl-tRNA synthetase multienzyme complex(GO:0017101) |
| 0.1 | 0.9 | GO:0005827 | polar microtubule(GO:0005827) |
| 0.1 | 1.5 | GO:0060077 | inhibitory synapse(GO:0060077) |
| 0.1 | 0.1 | GO:1902636 | kinociliary basal body(GO:1902636) |
| 0.1 | 0.9 | GO:0032777 | Piccolo NuA4 histone acetyltransferase complex(GO:0032777) |
| 0.1 | 0.8 | GO:0000015 | phosphopyruvate hydratase complex(GO:0000015) |
| 0.1 | 0.2 | GO:0031414 | N-terminal protein acetyltransferase complex(GO:0031414) |
| 0.1 | 0.5 | GO:0034991 | nuclear meiotic cohesin complex(GO:0034991) |
| 0.1 | 1.2 | GO:0000176 | nuclear exosome (RNase complex)(GO:0000176) |
| 0.1 | 0.2 | GO:0005668 | RNA polymerase transcription factor SL1 complex(GO:0005668) |
| 0.1 | 0.8 | GO:0016602 | CCAAT-binding factor complex(GO:0016602) |
| 0.1 | 0.2 | GO:0034657 | GID complex(GO:0034657) |
| 0.1 | 1.5 | GO:0097227 | sperm annulus(GO:0097227) |
| 0.1 | 0.4 | GO:0002169 | 3-methylcrotonyl-CoA carboxylase complex, mitochondrial(GO:0002169) methylcrotonoyl-CoA carboxylase complex(GO:1905202) |
| 0.1 | 0.4 | GO:0005726 | perichromatin fibrils(GO:0005726) |
| 0.1 | 1.2 | GO:0000276 | mitochondrial proton-transporting ATP synthase complex, coupling factor F(o)(GO:0000276) |
| 0.1 | 0.6 | GO:0005655 | nucleolar ribonuclease P complex(GO:0005655) |
| 0.1 | 0.2 | GO:1990723 | cytoplasmic periphery of the nuclear pore complex(GO:1990723) |
| 0.1 | 0.6 | GO:0030688 | preribosome, small subunit precursor(GO:0030688) |
| 0.1 | 0.7 | GO:0031211 | serine C-palmitoyltransferase complex(GO:0017059) endoplasmic reticulum palmitoyltransferase complex(GO:0031211) |
| 0.1 | 1.0 | GO:0002199 | zona pellucida receptor complex(GO:0002199) |
| 0.1 | 0.3 | GO:0000444 | MIS12/MIND type complex(GO:0000444) |
| 0.1 | 0.2 | GO:0036396 | MIS complex(GO:0036396) mRNA editing complex(GO:0045293) |
| 0.1 | 2.6 | GO:0080008 | Cul4-RING E3 ubiquitin ligase complex(GO:0080008) |
| 0.1 | 0.7 | GO:0000164 | protein phosphatase type 1 complex(GO:0000164) |
| 0.1 | 0.4 | GO:0032389 | MutLalpha complex(GO:0032389) |
| 0.1 | 0.3 | GO:0034673 | inhibin-betaglycan-ActRII complex(GO:0034673) |
| 0.1 | 0.3 | GO:0030897 | HOPS complex(GO:0030897) |
| 0.1 | 1.2 | GO:0005671 | Ada2/Gcn5/Ada3 transcription activator complex(GO:0005671) |
| 0.0 | 0.1 | GO:0032279 | asymmetric synapse(GO:0032279) symmetric synapse(GO:0032280) |
| 0.0 | 0.1 | GO:0005674 | transcription factor TFIIF complex(GO:0005674) |
| 0.0 | 0.2 | GO:0071942 | XPC complex(GO:0071942) |
| 0.0 | 0.2 | GO:0032937 | SREBP-SCAP-Insig complex(GO:0032937) |
| 0.0 | 0.6 | GO:0070937 | CRD-mediated mRNA stability complex(GO:0070937) |
| 0.0 | 0.9 | GO:0044754 | autolysosome(GO:0044754) |
| 0.0 | 0.5 | GO:0005672 | transcription factor TFIIA complex(GO:0005672) |
| 0.0 | 0.2 | GO:0071204 | histone pre-mRNA 3'end processing complex(GO:0071204) |
| 0.0 | 0.3 | GO:1990452 | Parkin-FBXW7-Cul1 ubiquitin ligase complex(GO:1990452) |
| 0.0 | 0.8 | GO:0008540 | proteasome regulatory particle, base subcomplex(GO:0008540) |
| 0.0 | 0.2 | GO:0005965 | protein farnesyltransferase complex(GO:0005965) |
| 0.0 | 0.2 | GO:0031251 | PAN complex(GO:0031251) |
| 0.0 | 0.3 | GO:0031415 | NatA complex(GO:0031415) |
| 0.0 | 0.3 | GO:0002177 | manchette(GO:0002177) |
| 0.0 | 0.2 | GO:0000778 | condensed nuclear chromosome kinetochore(GO:0000778) |
| 0.0 | 0.6 | GO:1990712 | HFE-transferrin receptor complex(GO:1990712) |
| 0.0 | 2.0 | GO:0016592 | mediator complex(GO:0016592) |
| 0.0 | 0.5 | GO:0000800 | lateral element(GO:0000800) |
| 0.0 | 0.5 | GO:0000322 | storage vacuole(GO:0000322) |
| 0.0 | 0.1 | GO:0030893 | meiotic cohesin complex(GO:0030893) |
| 0.0 | 1.2 | GO:0000314 | organellar small ribosomal subunit(GO:0000314) mitochondrial small ribosomal subunit(GO:0005763) |
| 0.0 | 0.2 | GO:0036156 | inner dynein arm(GO:0036156) |
| 0.0 | 0.9 | GO:0005689 | U12-type spliceosomal complex(GO:0005689) |
| 0.0 | 0.2 | GO:1990031 | pinceau fiber(GO:1990031) |
| 0.0 | 0.3 | GO:0032541 | cortical endoplasmic reticulum(GO:0032541) |
| 0.0 | 0.2 | GO:0032444 | activin responsive factor complex(GO:0032444) |
| 0.0 | 0.9 | GO:0005852 | eukaryotic translation initiation factor 3 complex(GO:0005852) |
| 0.0 | 0.8 | GO:0031201 | SNARE complex(GO:0031201) |
| 0.0 | 0.3 | GO:0031616 | spindle pole centrosome(GO:0031616) |
| 0.0 | 0.8 | GO:0005721 | pericentric heterochromatin(GO:0005721) |
| 0.0 | 0.2 | GO:0034719 | SMN-Sm protein complex(GO:0034719) |
| 0.0 | 0.2 | GO:0070695 | FHF complex(GO:0070695) |
| 0.0 | 0.3 | GO:0036128 | CatSper complex(GO:0036128) |
| 0.0 | 1.7 | GO:0035861 | site of double-strand break(GO:0035861) |
| 0.0 | 1.0 | GO:0035145 | exon-exon junction complex(GO:0035145) |
| 0.0 | 0.5 | GO:0071438 | invadopodium membrane(GO:0071438) |
| 0.0 | 0.7 | GO:0005847 | mRNA cleavage and polyadenylation specificity factor complex(GO:0005847) |
| 0.0 | 0.1 | GO:1990423 | RZZ complex(GO:1990423) |
| 0.0 | 0.2 | GO:0034274 | Atg12-Atg5-Atg16 complex(GO:0034274) |
| 0.0 | 0.3 | GO:0005786 | signal recognition particle, endoplasmic reticulum targeting(GO:0005786) |
| 0.0 | 0.4 | GO:0097025 | MPP7-DLG1-LIN7 complex(GO:0097025) |
| 0.0 | 0.1 | GO:0032002 | interleukin-28 receptor complex(GO:0032002) |
| 0.0 | 1.0 | GO:0005680 | anaphase-promoting complex(GO:0005680) |
| 0.0 | 3.0 | GO:0022625 | cytosolic large ribosomal subunit(GO:0022625) |
| 0.0 | 0.1 | GO:0070044 | synaptobrevin 2-SNAP-25-syntaxin-1a complex(GO:0070044) |
| 0.0 | 0.1 | GO:1990425 | junctional membrane complex(GO:0030314) ryanodine receptor complex(GO:1990425) |
| 0.0 | 0.4 | GO:0030126 | COPI vesicle coat(GO:0030126) |
| 0.0 | 0.6 | GO:0030127 | COPII vesicle coat(GO:0030127) |
| 0.0 | 0.1 | GO:0031213 | RSF complex(GO:0031213) |
| 0.0 | 0.2 | GO:0030868 | smooth endoplasmic reticulum membrane(GO:0030868) smooth endoplasmic reticulum part(GO:0097425) |
| 0.0 | 0.2 | GO:0097443 | sorting endosome(GO:0097443) |
| 0.0 | 0.4 | GO:0030123 | AP-3 adaptor complex(GO:0030123) |
| 0.0 | 0.1 | GO:0035032 | phosphatidylinositol 3-kinase complex, class III(GO:0035032) |
| 0.0 | 0.8 | GO:0031083 | BLOC-1 complex(GO:0031083) |
| 0.0 | 0.3 | GO:0005853 | eukaryotic translation elongation factor 1 complex(GO:0005853) |
| 0.0 | 0.7 | GO:0033202 | Ino80 complex(GO:0031011) DNA helicase complex(GO:0033202) |
| 0.0 | 0.9 | GO:0034451 | centriolar satellite(GO:0034451) |
| 0.0 | 0.7 | GO:0030687 | preribosome, large subunit precursor(GO:0030687) |
| 0.0 | 0.1 | GO:1990769 | proximal neuron projection(GO:1990769) |
| 0.0 | 1.2 | GO:0001917 | photoreceptor inner segment(GO:0001917) |
| 0.0 | 0.1 | GO:0060187 | cell pole(GO:0060187) |
| 0.0 | 5.1 | GO:0005681 | spliceosomal complex(GO:0005681) |
| 0.0 | 0.3 | GO:0031298 | replication fork protection complex(GO:0031298) |
| 0.0 | 0.2 | GO:0035692 | macrophage migration inhibitory factor receptor complex(GO:0035692) |
| 0.0 | 0.2 | GO:0045254 | pyruvate dehydrogenase complex(GO:0045254) |
| 0.0 | 0.1 | GO:0008537 | proteasome activator complex(GO:0008537) |
| 0.0 | 0.6 | GO:0005844 | polysome(GO:0005844) |
| 0.0 | 1.1 | GO:0000786 | nucleosome(GO:0000786) |
| 0.0 | 0.2 | GO:0070083 | clathrin-sculpted monoamine transport vesicle(GO:0070081) clathrin-sculpted monoamine transport vesicle membrane(GO:0070083) |
| 0.0 | 0.2 | GO:0033391 | chromatoid body(GO:0033391) |
| 0.0 | 0.4 | GO:0034518 | mRNA cap binding complex(GO:0005845) RNA cap binding complex(GO:0034518) |
| 0.0 | 1.3 | GO:0031941 | filamentous actin(GO:0031941) |
| 0.0 | 0.2 | GO:0005663 | DNA replication factor C complex(GO:0005663) |
| 0.0 | 0.2 | GO:0016012 | sarcoglycan complex(GO:0016012) |
| 0.0 | 0.2 | GO:0070652 | HAUS complex(GO:0070652) |
| 0.0 | 0.3 | GO:0035631 | CD40 receptor complex(GO:0035631) |
| 0.0 | 4.1 | GO:0036464 | cytoplasmic ribonucleoprotein granule(GO:0036464) |
| 0.0 | 0.3 | GO:0090543 | Flemming body(GO:0090543) |
| 0.0 | 0.1 | GO:0005971 | ribonucleoside-diphosphate reductase complex(GO:0005971) |
| 0.0 | 0.4 | GO:0030686 | 90S preribosome(GO:0030686) |
| 0.0 | 2.1 | GO:0016605 | PML body(GO:0016605) |
| 0.0 | 0.1 | GO:0008024 | cyclin/CDK positive transcription elongation factor complex(GO:0008024) |
| 0.0 | 0.2 | GO:0097470 | ribbon synapse(GO:0097470) |
| 0.0 | 0.2 | GO:0070187 | telosome(GO:0070187) |
| 0.0 | 0.6 | GO:0000421 | autophagosome membrane(GO:0000421) |
| 0.0 | 0.3 | GO:0016281 | eukaryotic translation initiation factor 4F complex(GO:0016281) |
| 0.0 | 0.1 | GO:0005964 | phosphorylase kinase complex(GO:0005964) |
| 0.0 | 0.2 | GO:0000124 | SAGA complex(GO:0000124) |
| 0.0 | 0.2 | GO:0035770 | ribonucleoprotein granule(GO:0035770) |
| 0.0 | 0.1 | GO:0008622 | epsilon DNA polymerase complex(GO:0008622) |
| 0.0 | 0.1 | GO:0002189 | ribose phosphate diphosphokinase complex(GO:0002189) |
| 0.0 | 0.0 | GO:0001534 | radial spoke(GO:0001534) |
| 0.0 | 0.1 | GO:0070436 | Grb2-EGFR complex(GO:0070436) |
| 0.0 | 0.1 | GO:0019815 | B cell receptor complex(GO:0019815) |
| 0.0 | 0.1 | GO:0016600 | flotillin complex(GO:0016600) |
| 0.0 | 0.4 | GO:0030134 | ER to Golgi transport vesicle(GO:0030134) |
| 0.0 | 0.9 | GO:0033116 | endoplasmic reticulum-Golgi intermediate compartment membrane(GO:0033116) |
| 0.0 | 2.5 | GO:0005795 | Golgi stack(GO:0005795) |
| 0.0 | 1.2 | GO:0018995 | host(GO:0018995) host cell(GO:0043657) |
| 0.0 | 0.1 | GO:0016272 | prefoldin complex(GO:0016272) |
| 0.0 | 0.2 | GO:0032039 | integrator complex(GO:0032039) |
| 0.0 | 0.1 | GO:0031462 | Cul2-RING ubiquitin ligase complex(GO:0031462) |
Gene overrepresentation in molecular_function category:
| Log-likelihood per target | Total log-likelihood | Term | Description |
|---|---|---|---|
| 0.5 | 1.6 | GO:0030350 | iron-responsive element binding(GO:0030350) |
| 0.5 | 1.6 | GO:0030626 | U12 snRNA binding(GO:0030626) |
| 0.3 | 2.0 | GO:0004815 | aspartate-tRNA ligase activity(GO:0004815) |
| 0.3 | 1.5 | GO:0005105 | type 1 fibroblast growth factor receptor binding(GO:0005105) |
| 0.3 | 1.2 | GO:0071987 | WD40-repeat domain binding(GO:0071987) |
| 0.3 | 2.1 | GO:0044547 | DNA topoisomerase binding(GO:0044547) |
| 0.3 | 1.0 | GO:1904455 | ubiquitin-specific protease activity involved in negative regulation of ERAD pathway(GO:1904455) |
| 0.2 | 2.3 | GO:0043515 | kinetochore binding(GO:0043515) |
| 0.2 | 0.8 | GO:0033823 | procollagen-lysine 5-dioxygenase activity(GO:0008475) procollagen glucosyltransferase activity(GO:0033823) |
| 0.2 | 0.9 | GO:0031208 | POZ domain binding(GO:0031208) |
| 0.2 | 0.8 | GO:0000386 | second spliceosomal transesterification activity(GO:0000386) |
| 0.2 | 0.6 | GO:0004449 | isocitrate dehydrogenase (NAD+) activity(GO:0004449) |
| 0.2 | 0.6 | GO:0036033 | mediator complex binding(GO:0036033) |
| 0.1 | 0.9 | GO:0047522 | 13-prostaglandin reductase activity(GO:0036132) 15-oxoprostaglandin 13-oxidase activity(GO:0047522) |
| 0.1 | 2.0 | GO:0016018 | cyclosporin A binding(GO:0016018) |
| 0.1 | 0.5 | GO:1990404 | protein ADP-ribosylase activity(GO:1990404) |
| 0.1 | 0.3 | GO:0061663 | NEDD8 ligase activity(GO:0061663) |
| 0.1 | 0.3 | GO:0004597 | peptide-aspartate beta-dioxygenase activity(GO:0004597) |
| 0.1 | 0.3 | GO:0004827 | glutamate-tRNA ligase activity(GO:0004818) proline-tRNA ligase activity(GO:0004827) |
| 0.1 | 2.1 | GO:0000150 | recombinase activity(GO:0000150) |
| 0.1 | 4.1 | GO:0070530 | K63-linked polyubiquitin binding(GO:0070530) |
| 0.1 | 0.3 | GO:0015218 | pyrimidine nucleotide transmembrane transporter activity(GO:0015218) |
| 0.1 | 0.4 | GO:0032427 | GBD domain binding(GO:0032427) |
| 0.1 | 0.7 | GO:0061649 | ubiquitinated histone binding(GO:0061649) |
| 0.1 | 1.1 | GO:0043023 | ribosomal large subunit binding(GO:0043023) |
| 0.1 | 0.3 | GO:0033265 | choline binding(GO:0033265) |
| 0.1 | 0.7 | GO:0004758 | serine C-palmitoyltransferase activity(GO:0004758) C-palmitoyltransferase activity(GO:0016454) |
| 0.1 | 0.8 | GO:0003747 | translation release factor activity(GO:0003747) translation termination factor activity(GO:0008079) |
| 0.1 | 4.2 | GO:0048027 | mRNA 5'-UTR binding(GO:0048027) |
| 0.1 | 0.3 | GO:0008384 | IkappaB kinase activity(GO:0008384) |
| 0.1 | 0.5 | GO:0017060 | 3-galactosyl-N-acetylglucosaminide 4-alpha-L-fucosyltransferase activity(GO:0017060) |
| 0.1 | 0.4 | GO:0004803 | transposase activity(GO:0004803) |
| 0.1 | 0.3 | GO:0003774 | motor activity(GO:0003774) |
| 0.1 | 1.7 | GO:0008140 | cAMP response element binding protein binding(GO:0008140) |
| 0.1 | 0.8 | GO:0004634 | phosphopyruvate hydratase activity(GO:0004634) |
| 0.1 | 0.9 | GO:1990825 | sequence-specific mRNA binding(GO:1990825) |
| 0.1 | 0.2 | GO:0090541 | MIT domain binding(GO:0090541) |
| 0.1 | 0.2 | GO:0036328 | VEGF-C-activated receptor activity(GO:0036328) |
| 0.1 | 0.2 | GO:0030627 | pre-mRNA 5'-splice site binding(GO:0030627) |
| 0.1 | 0.7 | GO:0004865 | protein serine/threonine phosphatase inhibitor activity(GO:0004865) |
| 0.1 | 0.4 | GO:0004965 | G-protein coupled GABA receptor activity(GO:0004965) |
| 0.1 | 0.5 | GO:0004906 | interferon-gamma receptor activity(GO:0004906) |
| 0.1 | 0.2 | GO:0051377 | mannose-ethanolamine phosphotransferase activity(GO:0051377) |
| 0.1 | 0.4 | GO:0080019 | fatty-acyl-CoA reductase (alcohol-forming) activity(GO:0080019) |
| 0.1 | 0.2 | GO:0071207 | histone pre-mRNA stem-loop binding(GO:0071207) |
| 0.1 | 0.4 | GO:0004485 | methylcrotonoyl-CoA carboxylase activity(GO:0004485) |
| 0.1 | 2.1 | GO:0046933 | proton-transporting ATP synthase activity, rotational mechanism(GO:0046933) |
| 0.1 | 0.5 | GO:0030377 | urokinase plasminogen activator receptor activity(GO:0030377) |
| 0.1 | 1.6 | GO:1904264 | ubiquitin protein ligase activity involved in ERAD pathway(GO:1904264) |
| 0.1 | 0.2 | GO:0019781 | NEDD8 activating enzyme activity(GO:0019781) |
| 0.1 | 0.2 | GO:0004739 | pyruvate dehydrogenase (acetyl-transferring) activity(GO:0004739) |
| 0.1 | 0.2 | GO:0070123 | transforming growth factor beta receptor activity, type III(GO:0070123) |
| 0.1 | 0.1 | GO:0070815 | peptidyl-lysine 5-dioxygenase activity(GO:0070815) |
| 0.1 | 2.9 | GO:0016538 | cyclin-dependent protein serine/threonine kinase regulator activity(GO:0016538) |
| 0.1 | 0.3 | GO:0031685 | adenosine receptor binding(GO:0031685) |
| 0.1 | 0.2 | GO:0047536 | 2-aminoadipate transaminase activity(GO:0047536) |
| 0.1 | 0.4 | GO:0072320 | volume-sensitive chloride channel activity(GO:0072320) |
| 0.1 | 0.2 | GO:0072510 | ferric iron transmembrane transporter activity(GO:0015091) trivalent inorganic cation transmembrane transporter activity(GO:0072510) |
| 0.1 | 0.9 | GO:0004402 | histone acetyltransferase activity(GO:0004402) |
| 0.1 | 0.6 | GO:0032135 | DNA insertion or deletion binding(GO:0032135) |
| 0.1 | 0.5 | GO:0016206 | catechol O-methyltransferase activity(GO:0016206) |
| 0.1 | 0.2 | GO:0001160 | transcription termination site sequence-specific DNA binding(GO:0001147) transcription termination site DNA binding(GO:0001160) |
| 0.1 | 0.3 | GO:0047757 | chondroitin-glucuronate 5-epimerase activity(GO:0047757) |
| 0.1 | 0.2 | GO:0004983 | neuropeptide Y receptor activity(GO:0004983) |
| 0.1 | 1.0 | GO:0004596 | peptide alpha-N-acetyltransferase activity(GO:0004596) |
| 0.1 | 0.2 | GO:0005365 | myo-inositol transmembrane transporter activity(GO:0005365) |
| 0.1 | 0.5 | GO:0048039 | ubiquinone binding(GO:0048039) |
| 0.1 | 0.4 | GO:0030060 | L-malate dehydrogenase activity(GO:0030060) |
| 0.1 | 0.2 | GO:0004461 | lactose synthase activity(GO:0004461) |
| 0.0 | 0.8 | GO:0005172 | vascular endothelial growth factor receptor binding(GO:0005172) |
| 0.0 | 0.6 | GO:0090599 | alpha-glucosidase activity(GO:0090599) |
| 0.0 | 0.4 | GO:0034648 | histone demethylase activity (H3-dimethyl-K4 specific)(GO:0034648) |
| 0.0 | 0.2 | GO:0070180 | large ribosomal subunit rRNA binding(GO:0070180) |
| 0.0 | 0.1 | GO:0004938 | alpha2-adrenergic receptor activity(GO:0004938) |
| 0.0 | 0.3 | GO:0008504 | monoamine transmembrane transporter activity(GO:0008504) |
| 0.0 | 0.3 | GO:0098821 | BMP receptor activity(GO:0098821) |
| 0.0 | 2.3 | GO:0071889 | 14-3-3 protein binding(GO:0071889) |
| 0.0 | 0.2 | GO:0019976 | interleukin-2 receptor activity(GO:0004911) interleukin-2 binding(GO:0019976) |
| 0.0 | 0.7 | GO:0034452 | dynactin binding(GO:0034452) |
| 0.0 | 0.2 | GO:0030292 | protein tyrosine kinase inhibitor activity(GO:0030292) |
| 0.0 | 0.2 | GO:0097322 | 7SK snRNA binding(GO:0097322) |
| 0.0 | 1.8 | GO:0043015 | gamma-tubulin binding(GO:0043015) |
| 0.0 | 0.5 | GO:0005005 | transmembrane-ephrin receptor activity(GO:0005005) |
| 0.0 | 0.2 | GO:0004660 | protein farnesyltransferase activity(GO:0004660) |
| 0.0 | 0.4 | GO:0042296 | ISG15 transferase activity(GO:0042296) |
| 0.0 | 0.2 | GO:0017089 | glycolipid transporter activity(GO:0017089) ceramide binding(GO:0097001) |
| 0.0 | 0.3 | GO:0004331 | 6-phosphofructo-2-kinase activity(GO:0003873) fructose-2,6-bisphosphate 2-phosphatase activity(GO:0004331) |
| 0.0 | 0.2 | GO:0019776 | Atg8 ligase activity(GO:0019776) |
| 0.0 | 0.3 | GO:0019798 | procollagen-proline 4-dioxygenase activity(GO:0004656) procollagen-proline dioxygenase activity(GO:0019798) |
| 0.0 | 0.1 | GO:0005173 | stem cell factor receptor binding(GO:0005173) |
| 0.0 | 1.8 | GO:0061631 | ubiquitin conjugating enzyme activity(GO:0061631) |
| 0.0 | 0.6 | GO:0004526 | ribonuclease P activity(GO:0004526) |
| 0.0 | 0.2 | GO:0008532 | N-acetyllactosaminide beta-1,3-N-acetylglucosaminyltransferase activity(GO:0008532) |
| 0.0 | 0.1 | GO:0004492 | methylmalonyl-CoA decarboxylase activity(GO:0004492) |
| 0.0 | 0.4 | GO:0097016 | L27 domain binding(GO:0097016) |
| 0.0 | 0.3 | GO:0016941 | natriuretic peptide receptor activity(GO:0016941) |
| 0.0 | 0.2 | GO:0034511 | U3 snoRNA binding(GO:0034511) |
| 0.0 | 0.1 | GO:0048763 | calcium-induced calcium release activity(GO:0048763) |
| 0.0 | 1.0 | GO:0030515 | snoRNA binding(GO:0030515) |
| 0.0 | 0.3 | GO:0046975 | histone methyltransferase activity (H3-K36 specific)(GO:0046975) |
| 0.0 | 0.4 | GO:0043199 | sulfate binding(GO:0043199) |
| 0.0 | 0.2 | GO:0016421 | CoA carboxylase activity(GO:0016421) |
| 0.0 | 0.2 | GO:0043522 | leucine zipper domain binding(GO:0043522) |
| 0.0 | 0.5 | GO:0008353 | RNA polymerase II carboxy-terminal domain kinase activity(GO:0008353) |
| 0.0 | 0.2 | GO:0050610 | oxidoreductase activity, acting on a sulfur group of donors, quinone or similar compound as acceptor(GO:0016672) glutathione dehydrogenase (ascorbate) activity(GO:0045174) methylarsonate reductase activity(GO:0050610) |
| 0.0 | 0.1 | GO:0004045 | aminoacyl-tRNA hydrolase activity(GO:0004045) |
| 0.0 | 0.3 | GO:0008312 | 7S RNA binding(GO:0008312) |
| 0.0 | 1.3 | GO:0000175 | 3'-5'-exoribonuclease activity(GO:0000175) |
| 0.0 | 0.4 | GO:0071933 | Arp2/3 complex binding(GO:0071933) |
| 0.0 | 0.1 | GO:0004487 | methylenetetrahydrofolate dehydrogenase (NAD+) activity(GO:0004487) |
| 0.0 | 0.1 | GO:0051021 | GDP-dissociation inhibitor binding(GO:0051021) Rho GDP-dissociation inhibitor binding(GO:0051022) |
| 0.0 | 1.0 | GO:0005487 | nucleocytoplasmic transporter activity(GO:0005487) |
| 0.0 | 0.2 | GO:0016618 | hydroxypyruvate reductase activity(GO:0016618) glyoxylate reductase (NADP) activity(GO:0030267) |
| 0.0 | 0.8 | GO:0008157 | protein phosphatase 1 binding(GO:0008157) |
| 0.0 | 1.3 | GO:0048487 | beta-tubulin binding(GO:0048487) |
| 0.0 | 0.1 | GO:0009019 | tRNA (guanine-N1-)-methyltransferase activity(GO:0009019) |
| 0.0 | 0.1 | GO:0004020 | adenylylsulfate kinase activity(GO:0004020) sulfate adenylyltransferase activity(GO:0004779) sulfate adenylyltransferase (ATP) activity(GO:0004781) |
| 0.0 | 1.0 | GO:0044183 | protein binding involved in protein folding(GO:0044183) |
| 0.0 | 0.1 | GO:0051731 | polynucleotide 5'-hydroxyl-kinase activity(GO:0051731) |
| 0.0 | 0.2 | GO:0047429 | nucleoside-triphosphate diphosphatase activity(GO:0047429) |
| 0.0 | 0.2 | GO:0035005 | 1-phosphatidylinositol-4-phosphate 3-kinase activity(GO:0035005) |
| 0.0 | 0.5 | GO:0008409 | 5'-3' exonuclease activity(GO:0008409) |
| 0.0 | 1.2 | GO:0005484 | SNAP receptor activity(GO:0005484) |
| 0.0 | 0.9 | GO:0008139 | nuclear localization sequence binding(GO:0008139) |
| 0.0 | 0.4 | GO:0003836 | beta-galactoside (CMP) alpha-2,3-sialyltransferase activity(GO:0003836) |
| 0.0 | 0.1 | GO:0008457 | beta-galactosyl-N-acetylglucosaminylgalactosylglucosyl-ceramide beta-1,3-acetylglucosaminyltransferase activity(GO:0008457) lactosylceramide 1,3-N-acetyl-beta-D-glucosaminyltransferase activity(GO:0047256) |
| 0.0 | 0.2 | GO:0016174 | NAD(P)H oxidase activity(GO:0016174) |
| 0.0 | 0.3 | GO:0000400 | four-way junction DNA binding(GO:0000400) |
| 0.0 | 0.1 | GO:0039706 | co-receptor binding(GO:0039706) |
| 0.0 | 0.2 | GO:0018479 | benzaldehyde dehydrogenase (NAD+) activity(GO:0018479) |
| 0.0 | 0.2 | GO:0043533 | inositol 1,3,4,5 tetrakisphosphate binding(GO:0043533) |
| 0.0 | 0.2 | GO:0003964 | telomerase activity(GO:0003720) RNA-directed DNA polymerase activity(GO:0003964) |
| 0.0 | 0.2 | GO:0045236 | CXCR chemokine receptor binding(GO:0045236) |
| 0.0 | 0.2 | GO:0015288 | porin activity(GO:0015288) |
| 0.0 | 0.1 | GO:0005483 | soluble NSF attachment protein activity(GO:0005483) |
| 0.0 | 0.2 | GO:0051430 | corticotropin-releasing hormone receptor 1 binding(GO:0051430) |
| 0.0 | 0.5 | GO:0004806 | triglyceride lipase activity(GO:0004806) |
| 0.0 | 0.3 | GO:0005149 | interleukin-1 receptor binding(GO:0005149) |
| 0.0 | 0.1 | GO:0004523 | RNA-DNA hybrid ribonuclease activity(GO:0004523) |
| 0.0 | 0.2 | GO:0004720 | protein-lysine 6-oxidase activity(GO:0004720) |
| 0.0 | 0.1 | GO:0010997 | anaphase-promoting complex binding(GO:0010997) |
| 0.0 | 0.4 | GO:0030215 | semaphorin receptor binding(GO:0030215) |
| 0.0 | 0.3 | GO:0052629 | phosphatidylinositol-3,5-bisphosphate 3-phosphatase activity(GO:0052629) |
| 0.0 | 1.5 | GO:0050681 | androgen receptor binding(GO:0050681) |
| 0.0 | 0.2 | GO:0031386 | protein tag(GO:0031386) |
| 0.0 | 0.1 | GO:0031752 | D5 dopamine receptor binding(GO:0031752) |
| 0.0 | 0.2 | GO:0086083 | cell adhesive protein binding involved in bundle of His cell-Purkinje myocyte communication(GO:0086083) |
| 0.0 | 0.7 | GO:0017147 | Wnt-protein binding(GO:0017147) |
| 0.0 | 0.0 | GO:0061711 | N(6)-L-threonylcarbamoyladenine synthase(GO:0061711) |
| 0.0 | 0.6 | GO:0017025 | TBP-class protein binding(GO:0017025) |
| 0.0 | 0.1 | GO:0035529 | NADH pyrophosphatase activity(GO:0035529) |
| 0.0 | 0.1 | GO:0004748 | ribonucleoside-diphosphate reductase activity, thioredoxin disulfide as acceptor(GO:0004748) oxidoreductase activity, acting on CH or CH2 groups, disulfide as acceptor(GO:0016728) ribonucleoside-diphosphate reductase activity(GO:0061731) |
| 0.0 | 0.4 | GO:0003995 | acyl-CoA dehydrogenase activity(GO:0003995) |
| 0.0 | 0.2 | GO:0033170 | DNA clamp loader activity(GO:0003689) protein-DNA loading ATPase activity(GO:0033170) |
| 0.0 | 0.2 | GO:0043014 | alpha-tubulin binding(GO:0043014) |
| 0.0 | 0.1 | GO:0061133 | endopeptidase activator activity(GO:0061133) |
| 0.0 | 0.4 | GO:0008536 | Ran GTPase binding(GO:0008536) |
| 0.0 | 0.1 | GO:0008273 | calcium, potassium:sodium antiporter activity(GO:0008273) |
| 0.0 | 0.0 | GO:0004821 | histidine-tRNA ligase activity(GO:0004821) |
| 0.0 | 0.4 | GO:0005165 | neurotrophin receptor binding(GO:0005165) |
| 0.0 | 0.6 | GO:0051879 | Hsp90 protein binding(GO:0051879) |
| 0.0 | 0.1 | GO:0004689 | phosphorylase kinase activity(GO:0004689) |
| 0.0 | 0.4 | GO:0005092 | GDP-dissociation inhibitor activity(GO:0005092) |
| 0.0 | 0.1 | GO:0035368 | selenocysteine insertion sequence binding(GO:0035368) |
| 0.0 | 0.1 | GO:0004920 | interleukin-10 receptor activity(GO:0004920) |
| 0.0 | 0.2 | GO:0008494 | translation activator activity(GO:0008494) |
| 0.0 | 0.1 | GO:0004699 | calcium-independent protein kinase C activity(GO:0004699) |
| 0.0 | 0.8 | GO:0005160 | transforming growth factor beta receptor binding(GO:0005160) |
| 0.0 | 0.1 | GO:0008297 | single-stranded DNA exodeoxyribonuclease activity(GO:0008297) |
| 0.0 | 0.1 | GO:0008821 | crossover junction endodeoxyribonuclease activity(GO:0008821) |
| 0.0 | 0.0 | GO:0042975 | peroxisome proliferator activated receptor binding(GO:0042975) |
| 0.0 | 0.4 | GO:0005086 | ARF guanyl-nucleotide exchange factor activity(GO:0005086) |
| 0.0 | 1.1 | GO:0003743 | translation initiation factor activity(GO:0003743) |
| 0.0 | 0.1 | GO:0017176 | phosphatidylinositol N-acetylglucosaminyltransferase activity(GO:0017176) |
| 0.0 | 1.3 | GO:0008565 | protein transporter activity(GO:0008565) |
| 0.0 | 0.0 | GO:0042015 | interleukin-20 binding(GO:0042015) |
| 0.0 | 0.1 | GO:0030023 | extracellular matrix constituent conferring elasticity(GO:0030023) |
| 0.0 | 0.1 | GO:0004551 | nucleotide diphosphatase activity(GO:0004551) |
| 0.0 | 0.2 | GO:0035259 | glucocorticoid receptor binding(GO:0035259) |
| 0.0 | 0.1 | GO:0003810 | protein-glutamine gamma-glutamyltransferase activity(GO:0003810) |
| 0.0 | 2.2 | GO:0001078 | transcriptional repressor activity, RNA polymerase II core promoter proximal region sequence-specific binding(GO:0001078) |
| 0.0 | 0.5 | GO:0003755 | peptidyl-prolyl cis-trans isomerase activity(GO:0003755) |
| 0.0 | 0.2 | GO:0001205 | transcriptional activator activity, RNA polymerase II distal enhancer sequence-specific binding(GO:0001205) |
| 0.0 | 0.2 | GO:0045294 | alpha-catenin binding(GO:0045294) |
| 0.0 | 0.1 | GO:1903136 | cuprous ion binding(GO:1903136) |
| 0.0 | 0.9 | GO:0000980 | RNA polymerase II distal enhancer sequence-specific DNA binding(GO:0000980) |
Gene overrepresentation in C2:CP category:
| Log-likelihood per target | Total log-likelihood | Term | Description |
|---|---|---|---|
| 0.1 | 5.5 | PID AURORA B PATHWAY | Aurora B signaling |
| 0.0 | 4.4 | PID RHOA PATHWAY | RhoA signaling pathway |
| 0.0 | 3.3 | PID ATM PATHWAY | ATM pathway |
| 0.0 | 0.3 | ST IL 13 PATHWAY | Interleukin 13 (IL-13) Pathway |
| 0.0 | 2.8 | PID HES HEY PATHWAY | Notch-mediated HES/HEY network |
| 0.0 | 1.8 | PID NFKAPPAB CANONICAL PATHWAY | Canonical NF-kappaB pathway |
| 0.0 | 0.2 | PID BARD1 PATHWAY | BARD1 signaling events |
| 0.0 | 0.7 | PID DNA PK PATHWAY | DNA-PK pathway in nonhomologous end joining |
| 0.0 | 0.2 | PID AVB3 INTEGRIN PATHWAY | Integrins in angiogenesis |
| 0.0 | 1.2 | PID SMAD2 3PATHWAY | Regulation of cytoplasmic and nuclear SMAD2/3 signaling |
| 0.0 | 0.2 | PID CERAMIDE PATHWAY | Ceramide signaling pathway |
| 0.0 | 0.7 | PID VEGFR1 PATHWAY | VEGFR1 specific signals |
| 0.0 | 0.3 | PID VEGF VEGFR PATHWAY | VEGF and VEGFR signaling network |
| 0.0 | 0.5 | PID ARF6 DOWNSTREAM PATHWAY | Arf6 downstream pathway |
| 0.0 | 0.2 | PID RANBP2 PATHWAY | Sumoylation by RanBP2 regulates transcriptional repression |
| 0.0 | 1.4 | PID DELTA NP63 PATHWAY | Validated transcriptional targets of deltaNp63 isoforms |
| 0.0 | 0.9 | PID WNT NONCANONICAL PATHWAY | Noncanonical Wnt signaling pathway |
| 0.0 | 0.6 | ST GA12 PATHWAY | G alpha 12 Pathway |
| 0.0 | 0.6 | PID IL2 PI3K PATHWAY | IL2 signaling events mediated by PI3K |
| 0.0 | 0.3 | PID IL3 PATHWAY | IL3-mediated signaling events |
| 0.0 | 0.5 | PID EPHA FWDPATHWAY | EPHA forward signaling |
| 0.0 | 1.5 | PID MYC ACTIV PATHWAY | Validated targets of C-MYC transcriptional activation |
| 0.0 | 0.3 | PID BETA CATENIN DEG PATHWAY | Degradation of beta catenin |
| 0.0 | 0.2 | PID ERB GENOMIC PATHWAY | Validated nuclear estrogen receptor beta network |
Gene overrepresentation in C2:CP:REACTOME category:
| Log-likelihood per target | Total log-likelihood | Term | Description |
|---|---|---|---|
| 0.1 | 2.1 | REACTOME NOTCH HLH TRANSCRIPTION PATHWAY | Genes involved in Notch-HLH transcription pathway |
| 0.1 | 2.3 | REACTOME FORMATION OF ATP BY CHEMIOSMOTIC COUPLING | Genes involved in Formation of ATP by chemiosmotic coupling |
| 0.1 | 1.6 | REACTOME ACTIVATION OF CHAPERONES BY ATF6 ALPHA | Genes involved in Activation of Chaperones by ATF6-alpha |
| 0.1 | 0.2 | REACTOME TRANSPORT OF MATURE TRANSCRIPT TO CYTOPLASM | Genes involved in Transport of Mature Transcript to Cytoplasm |
| 0.1 | 4.7 | REACTOME TRANSCRIPTIONAL ACTIVITY OF SMAD2 SMAD3 SMAD4 HETEROTRIMER | Genes involved in Transcriptional activity of SMAD2/SMAD3:SMAD4 heterotrimer |
| 0.0 | 0.5 | REACTOME IRAK2 MEDIATED ACTIVATION OF TAK1 COMPLEX UPON TLR7 8 OR 9 STIMULATION | Genes involved in IRAK2 mediated activation of TAK1 complex upon TLR7/8 or 9 stimulation |
| 0.0 | 1.6 | REACTOME INHIBITION OF THE PROTEOLYTIC ACTIVITY OF APC C REQUIRED FOR THE ONSET OF ANAPHASE BY MITOTIC SPINDLE CHECKPOINT COMPONENTS | Genes involved in Inhibition of the proteolytic activity of APC/C required for the onset of anaphase by mitotic spindle checkpoint components |
| 0.0 | 1.2 | REACTOME ACTIVATION OF THE AP1 FAMILY OF TRANSCRIPTION FACTORS | Genes involved in Activation of the AP-1 family of transcription factors |
| 0.0 | 0.9 | REACTOME MRNA DECAY BY 5 TO 3 EXORIBONUCLEASE | Genes involved in mRNA Decay by 5' to 3' Exoribonuclease |
| 0.0 | 0.4 | REACTOME MTORC1 MEDIATED SIGNALLING | Genes involved in mTORC1-mediated signalling |
| 0.0 | 0.4 | REACTOME MRNA DECAY BY 3 TO 5 EXORIBONUCLEASE | Genes involved in mRNA Decay by 3' to 5' Exoribonuclease |
| 0.0 | 0.7 | REACTOME REGULATION OF IFNG SIGNALING | Genes involved in Regulation of IFNG signaling |
| 0.0 | 1.5 | REACTOME SIGNALING BY FGFR1 FUSION MUTANTS | Genes involved in Signaling by FGFR1 fusion mutants |
| 0.0 | 1.2 | REACTOME CYTOSOLIC TRNA AMINOACYLATION | Genes involved in Cytosolic tRNA aminoacylation |
| 0.0 | 1.8 | REACTOME MRNA 3 END PROCESSING | Genes involved in mRNA 3'-end processing |
| 0.0 | 0.2 | REACTOME VIF MEDIATED DEGRADATION OF APOBEC3G | Genes involved in Vif-mediated degradation of APOBEC3G |
| 0.0 | 0.8 | REACTOME BRANCHED CHAIN AMINO ACID CATABOLISM | Genes involved in Branched-chain amino acid catabolism |
| 0.0 | 0.3 | REACTOME P75NTR RECRUITS SIGNALLING COMPLEXES | Genes involved in p75NTR recruits signalling complexes |
| 0.0 | 1.3 | REACTOME EGFR DOWNREGULATION | Genes involved in EGFR downregulation |
| 0.0 | 0.9 | REACTOME HOMOLOGOUS RECOMBINATION REPAIR OF REPLICATION INDEPENDENT DOUBLE STRAND BREAKS | Genes involved in Homologous recombination repair of replication-independent double-strand breaks |
| 0.0 | 0.9 | REACTOME KERATAN SULFATE BIOSYNTHESIS | Genes involved in Keratan sulfate biosynthesis |
| 0.0 | 0.1 | REACTOME G BETA GAMMA SIGNALLING THROUGH PI3KGAMMA | Genes involved in G beta:gamma signalling through PI3Kgamma |
| 0.0 | 0.6 | REACTOME AKT PHOSPHORYLATES TARGETS IN THE CYTOSOL | Genes involved in AKT phosphorylates targets in the cytosol |
| 0.0 | 1.0 | REACTOME FORMATION OF TUBULIN FOLDING INTERMEDIATES BY CCT TRIC | Genes involved in Formation of tubulin folding intermediates by CCT/TriC |
| 0.0 | 0.7 | REACTOME GLYCOGEN BREAKDOWN GLYCOGENOLYSIS | Genes involved in Glycogen breakdown (glycogenolysis) |
| 0.0 | 0.3 | REACTOME COPI MEDIATED TRANSPORT | Genes involved in COPI Mediated Transport |
| 0.0 | 0.4 | REACTOME APOPTOTIC CLEAVAGE OF CELL ADHESION PROTEINS | Genes involved in Apoptotic cleavage of cell adhesion proteins |
| 0.0 | 0.5 | REACTOME RECRUITMENT OF NUMA TO MITOTIC CENTROSOMES | Genes involved in Recruitment of NuMA to mitotic centrosomes |
| 0.0 | 0.6 | REACTOME ANTIGEN PRESENTATION FOLDING ASSEMBLY AND PEPTIDE LOADING OF CLASS I MHC | Genes involved in Antigen Presentation: Folding, assembly and peptide loading of class I MHC |
| 0.0 | 1.8 | REACTOME GOLGI ASSOCIATED VESICLE BIOGENESIS | Genes involved in Golgi Associated Vesicle Biogenesis |
| 0.0 | 1.0 | REACTOME DEADENYLATION OF MRNA | Genes involved in Deadenylation of mRNA |
| 0.0 | 0.2 | REACTOME NOREPINEPHRINE NEUROTRANSMITTER RELEASE CYCLE | Genes involved in Norepinephrine Neurotransmitter Release Cycle |
| 0.0 | 0.4 | REACTOME FORMATION OF THE TERNARY COMPLEX AND SUBSEQUENTLY THE 43S COMPLEX | Genes involved in Formation of the ternary complex, and subsequently, the 43S complex |
| 0.0 | 0.8 | REACTOME POST TRANSLATIONAL MODIFICATION SYNTHESIS OF GPI ANCHORED PROTEINS | Genes involved in Post-translational modification: synthesis of GPI-anchored proteins |
| 0.0 | 0.5 | REACTOME PROTEOLYTIC CLEAVAGE OF SNARE COMPLEX PROTEINS | Genes involved in Proteolytic cleavage of SNARE complex proteins |
| 0.0 | 0.9 | REACTOME TRANSPORT OF RIBONUCLEOPROTEINS INTO THE HOST NUCLEUS | Genes involved in Transport of Ribonucleoproteins into the Host Nucleus |
| 0.0 | 0.3 | REACTOME SYNTHESIS SECRETION AND DEACYLATION OF GHRELIN | Genes involved in Synthesis, Secretion, and Deacylation of Ghrelin |
| 0.0 | 0.3 | REACTOME VEGF LIGAND RECEPTOR INTERACTIONS | Genes involved in VEGF ligand-receptor interactions |
| 0.0 | 0.3 | REACTOME PROLACTIN RECEPTOR SIGNALING | Genes involved in Prolactin receptor signaling |
| 0.0 | 1.0 | REACTOME RNA POL II TRANSCRIPTION PRE INITIATION AND PROMOTER OPENING | Genes involved in RNA Polymerase II Transcription Pre-Initiation And Promoter Opening |
| 0.0 | 0.2 | REACTOME FORMATION OF INCISION COMPLEX IN GG NER | Genes involved in Formation of incision complex in GG-NER |
| 0.0 | 1.9 | REACTOME CELL CYCLE CHECKPOINTS | Genes involved in Cell Cycle Checkpoints |
| 0.0 | 2.1 | REACTOME PEPTIDE CHAIN ELONGATION | Genes involved in Peptide chain elongation |
| 0.0 | 0.2 | REACTOME REGULATION OF ORNITHINE DECARBOXYLASE ODC | Genes involved in Regulation of ornithine decarboxylase (ODC) |
| 0.0 | 0.2 | REACTOME ETHANOL OXIDATION | Genes involved in Ethanol oxidation |
| 0.0 | 0.3 | REACTOME RNA POL III TRANSCRIPTION TERMINATION | Genes involved in RNA Polymerase III Transcription Termination |
| 0.0 | 0.5 | REACTOME CIRCADIAN REPRESSION OF EXPRESSION BY REV ERBA | Genes involved in Circadian Repression of Expression by REV-ERBA |
| 0.0 | 0.7 | REACTOME HOST INTERACTIONS OF HIV FACTORS | Genes involved in Host Interactions of HIV factors |
| 0.0 | 0.2 | REACTOME REGULATION OF PYRUVATE DEHYDROGENASE PDH COMPLEX | Genes involved in Regulation of pyruvate dehydrogenase (PDH) complex |
| 0.0 | 1.0 | REACTOME RESPIRATORY ELECTRON TRANSPORT | Genes involved in Respiratory electron transport |
| 0.0 | 0.2 | REACTOME CD28 DEPENDENT PI3K AKT SIGNALING | Genes involved in CD28 dependent PI3K/Akt signaling |