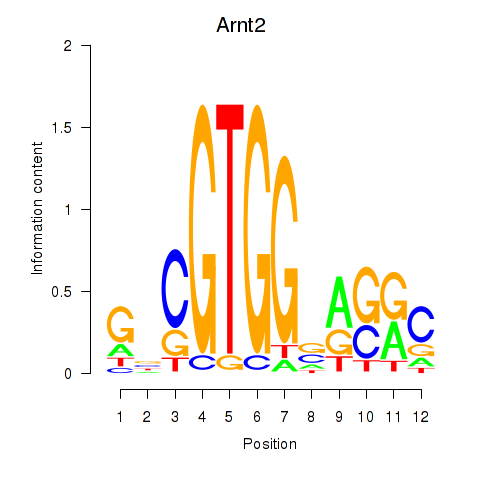
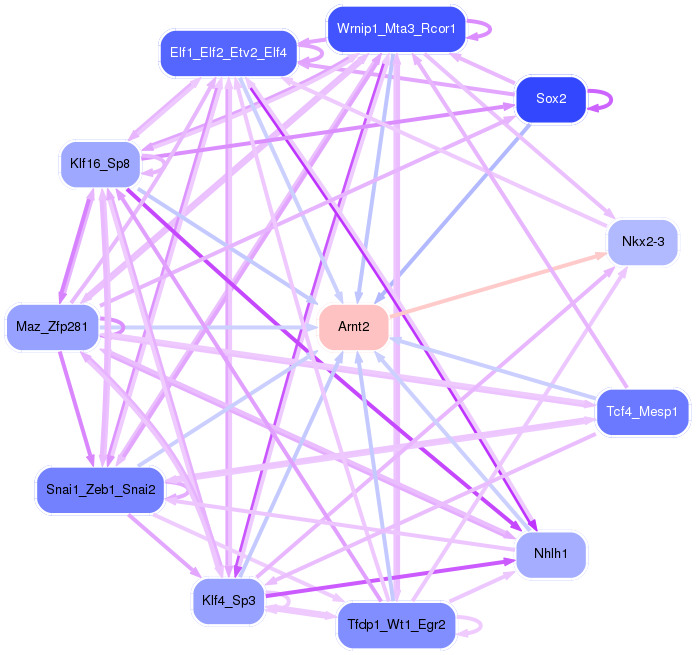
Motif ID: Arnt2
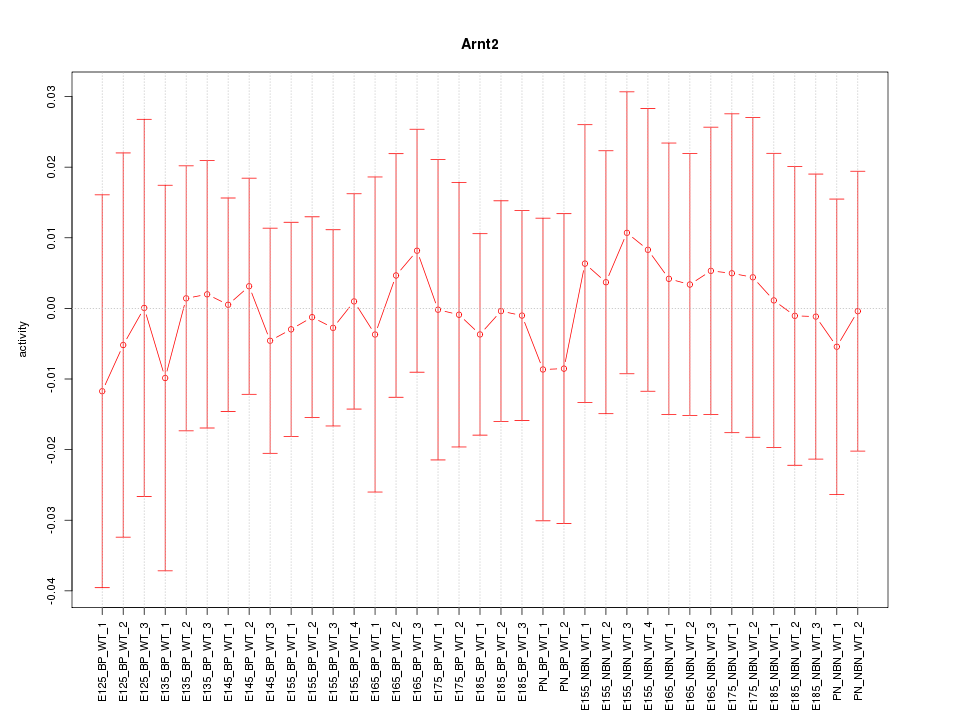
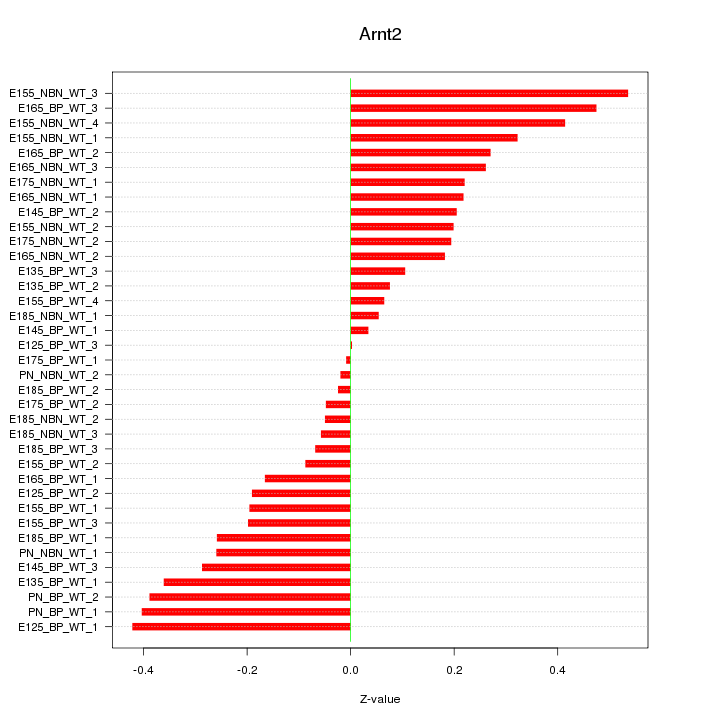
Z-value: 0.244
Transcription factors associated with Arnt2:
| Gene Symbol | Entrez ID | Gene Name |
|---|---|---|
| Arnt2 | ENSMUSG00000015709.8 | Arnt2 |
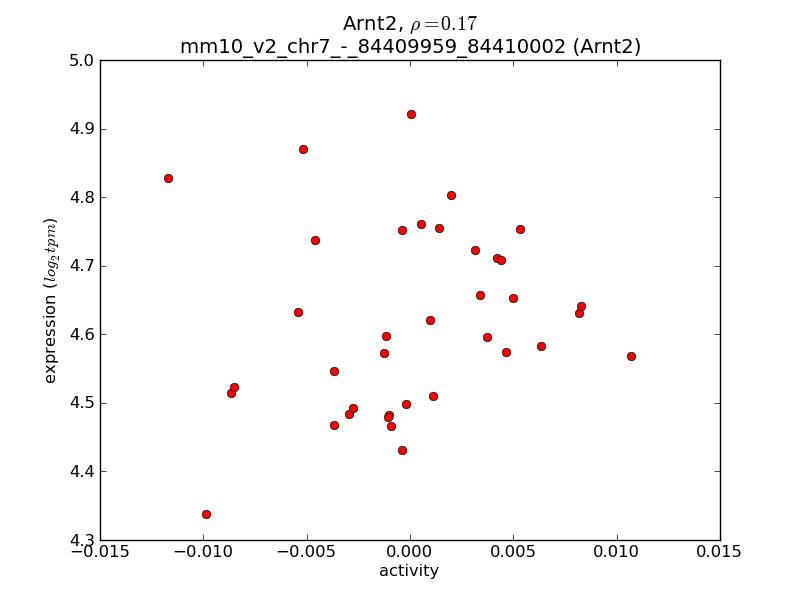
Activity-expression correlation:
| Gene Symbol | Promoter | Pearson corr. coef. | P-value | Plot |
|---|---|---|---|---|
| Arnt2 | mm10_v2_chr7_-_84409959_84410002 | 0.17 | 3.3e-01 | Click! |

Top targets:
Gene overrepresentation in biological_process category:
| Log-likelihood per target | Total log-likelihood | Term | Description |
|---|---|---|---|
| 0.2 | 0.7 | GO:0071336 | white fat cell proliferation(GO:0070343) regulation of white fat cell proliferation(GO:0070350) regulation of hair follicle cell proliferation(GO:0071336) positive regulation of hair follicle cell proliferation(GO:0071338) |
| 0.2 | 0.6 | GO:1990523 | bone regeneration(GO:1990523) |
| 0.2 | 0.5 | GO:0033364 | mast cell secretory granule organization(GO:0033364) |
| 0.2 | 0.5 | GO:0010814 | substance P catabolic process(GO:0010814) calcitonin catabolic process(GO:0010816) endothelin maturation(GO:0034959) |
| 0.1 | 0.6 | GO:0072318 | clathrin coat disassembly(GO:0072318) |
| 0.1 | 0.4 | GO:0032485 | regulation of Ral protein signal transduction(GO:0032485) |
| 0.1 | 0.3 | GO:1902031 | regulation of NADP metabolic process(GO:1902031) |
| 0.1 | 0.3 | GO:1903361 | protein localization to basolateral plasma membrane(GO:1903361) |
| 0.0 | 0.1 | GO:1901608 | regulation of vesicle transport along microtubule(GO:1901608) |
| 0.0 | 0.7 | GO:0046854 | phosphatidylinositol phosphorylation(GO:0046854) |
| 0.0 | 0.6 | GO:0031571 | mitotic G1 DNA damage checkpoint(GO:0031571) |
| 0.0 | 0.1 | GO:0007023 | post-chaperonin tubulin folding pathway(GO:0007023) |
| 0.0 | 0.1 | GO:0002317 | plasma cell differentiation(GO:0002317) |
| 0.0 | 0.0 | GO:0009838 | abscission(GO:0009838) |
| 0.0 | 0.1 | GO:0098937 | dendritic transport(GO:0098935) anterograde dendritic transport(GO:0098937) |
| 0.0 | 0.2 | GO:0033327 | Leydig cell differentiation(GO:0033327) |
| 0.0 | 0.3 | GO:0070536 | protein K63-linked deubiquitination(GO:0070536) |
Gene overrepresentation in cellular_component category:
| Log-likelihood per target | Total log-likelihood | Term | Description |
|---|---|---|---|
| 0.1 | 0.5 | GO:0033093 | Weibel-Palade body(GO:0033093) |
| 0.0 | 0.3 | GO:0097025 | MPP7-DLG1-LIN7 complex(GO:0097025) |
| 0.0 | 0.6 | GO:1990635 | proximal dendrite(GO:1990635) |
| 0.0 | 0.6 | GO:0031527 | filopodium membrane(GO:0031527) |
| 0.0 | 0.2 | GO:0030057 | desmosome(GO:0030057) |
| 0.0 | 0.1 | GO:0098554 | cytoplasmic side of endoplasmic reticulum membrane(GO:0098554) |
| 0.0 | 0.3 | GO:0070822 | Sin3-type complex(GO:0070822) |
Gene overrepresentation in molecular_function category:
| Log-likelihood per target | Total log-likelihood | Term | Description |
|---|---|---|---|
| 0.2 | 0.7 | GO:0004441 | inositol-1,4-bisphosphate 1-phosphatase activity(GO:0004441) |
| 0.2 | 0.7 | GO:0005111 | type 2 fibroblast growth factor receptor binding(GO:0005111) |
| 0.1 | 0.3 | GO:0004473 | malic enzyme activity(GO:0004470) malate dehydrogenase (decarboxylating) (NAD+) activity(GO:0004471) malate dehydrogenase (decarboxylating) (NADP+) activity(GO:0004473) |
| 0.1 | 0.4 | GO:0008321 | Ral guanyl-nucleotide exchange factor activity(GO:0008321) |
| 0.1 | 0.3 | GO:0097016 | L27 domain binding(GO:0097016) |
| 0.0 | 0.6 | GO:0042813 | Wnt-activated receptor activity(GO:0042813) |
| 0.0 | 0.6 | GO:0070064 | proline-rich region binding(GO:0070064) |
| 0.0 | 0.1 | GO:2001070 | starch binding(GO:2001070) |
Gene overrepresentation in C2:CP category:
| Log-likelihood per target | Total log-likelihood | Term | Description |
|---|---|---|---|
| 0.0 | 0.6 | PID_WNT_SIGNALING_PATHWAY | Wnt signaling network |
Gene overrepresentation in C2:CP:REACTOME category:
| Log-likelihood per target | Total log-likelihood | Term | Description |
|---|---|---|---|
| 0.1 | 0.7 | REACTOME_FGFR1_LIGAND_BINDING_AND_ACTIVATION | Genes involved in FGFR1 ligand binding and activation |
| 0.0 | 0.6 | REACTOME_LYSOSOME_VESICLE_BIOGENESIS | Genes involved in Lysosome Vesicle Biogenesis |