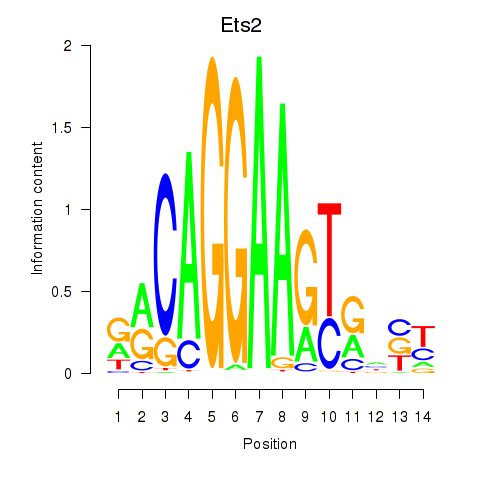
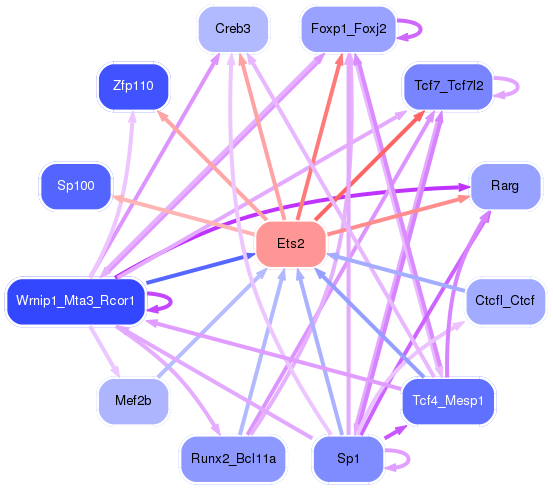
Motif ID: Ets2
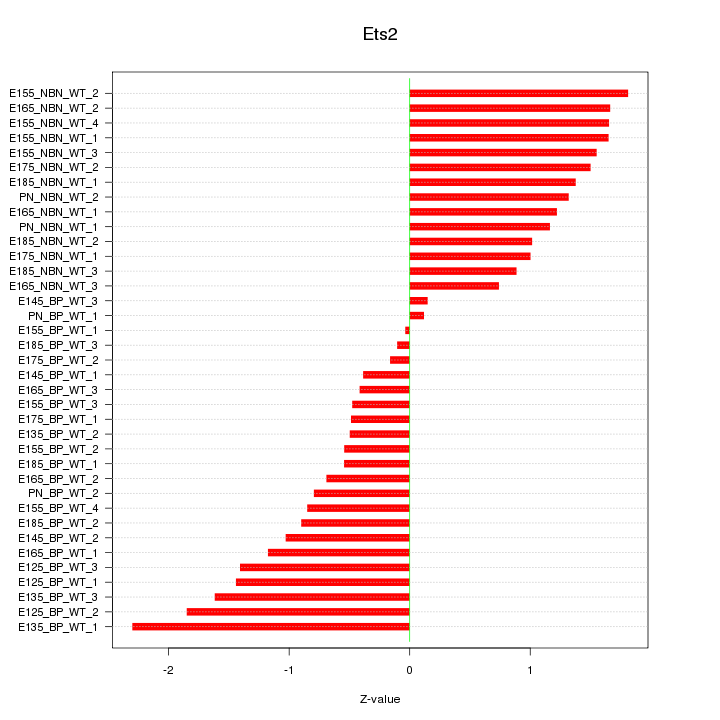
Z-value: 1.141
Transcription factors associated with Ets2:
| Gene Symbol | Entrez ID | Gene Name |
|---|---|---|
| Ets2 | ENSMUSG00000022895.8 | Ets2 |
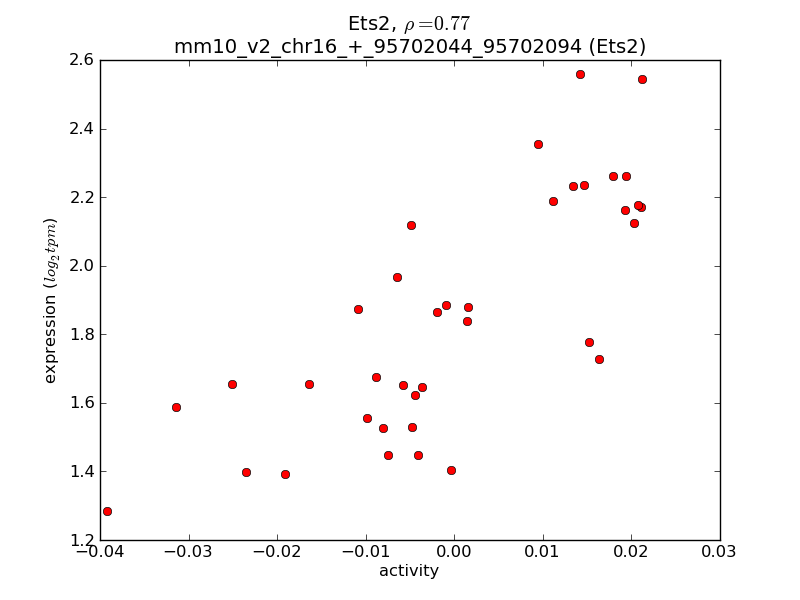
Activity-expression correlation:
| Gene Symbol | Promoter | Pearson corr. coef. | P-value | Plot |
|---|---|---|---|---|
| Ets2 | mm10_v2_chr16_+_95702044_95702094 | 0.77 | 1.9e-08 | Click! |

Top targets:
Gene overrepresentation in biological_process category:
| Log-likelihood per target | Total log-likelihood | Term | Description |
|---|---|---|---|
| 2.0 | 22.5 | GO:2000580 | positive regulation of microtubule motor activity(GO:2000576) regulation of ATP-dependent microtubule motor activity, plus-end-directed(GO:2000580) positive regulation of ATP-dependent microtubule motor activity, plus-end-directed(GO:2000582) |
| 1.2 | 4.9 | GO:1904425 | negative regulation of GTP binding(GO:1904425) |
| 0.9 | 3.6 | GO:0060316 | positive regulation of ryanodine-sensitive calcium-release channel activity(GO:0060316) |
| 0.9 | 2.7 | GO:0016998 | cell wall macromolecule catabolic process(GO:0016998) |
| 0.8 | 2.5 | GO:0019085 | early viral transcription(GO:0019085) |
| 0.8 | 2.5 | GO:0032497 | detection of lipopolysaccharide(GO:0032497) |
| 0.8 | 1.6 | GO:0035990 | tendon cell differentiation(GO:0035990) tendon formation(GO:0035992) |
| 0.8 | 2.4 | GO:1905072 | detection of oxygen(GO:0003032) cardiac jelly development(GO:1905072) |
| 0.8 | 2.4 | GO:0002765 | immune response-inhibiting signal transduction(GO:0002765) positive regulation of dendritic cell apoptotic process(GO:2000670) |
| 0.8 | 12.5 | GO:0021902 | commitment of neuronal cell to specific neuron type in forebrain(GO:0021902) |
| 0.7 | 7.9 | GO:0090232 | positive regulation of spindle checkpoint(GO:0090232) |
| 0.7 | 3.6 | GO:0010637 | diet induced thermogenesis(GO:0002024) negative regulation of mitochondrial fusion(GO:0010637) |
| 0.7 | 2.0 | GO:0006597 | spermine biosynthetic process(GO:0006597) |
| 0.6 | 3.1 | GO:0098706 | ferric iron import into cell(GO:0097461) ferric iron import across plasma membrane(GO:0098706) |
| 0.6 | 3.6 | GO:0043654 | recognition of apoptotic cell(GO:0043654) |
| 0.6 | 5.3 | GO:0036371 | protein localization to M-band(GO:0036309) protein localization to T-tubule(GO:0036371) |
| 0.6 | 3.9 | GO:0060267 | positive regulation of respiratory burst(GO:0060267) |
| 0.5 | 3.3 | GO:1902998 | macrophage proliferation(GO:0061517) microglial cell proliferation(GO:0061518) regulation of neuronal signal transduction(GO:1902847) positive regulation of neurofibrillary tangle assembly(GO:1902998) |
| 0.5 | 1.1 | GO:0034137 | positive regulation of toll-like receptor 2 signaling pathway(GO:0034137) |
| 0.5 | 2.1 | GO:0072737 | response to diamide(GO:0072737) cellular response to diamide(GO:0072738) |
| 0.5 | 1.9 | GO:0086042 | cardiac muscle cell-cardiac muscle cell adhesion(GO:0086042) |
| 0.5 | 1.4 | GO:0035635 | entry of bacterium into host cell(GO:0035635) regulation of entry of bacterium into host cell(GO:2000535) |
| 0.4 | 2.6 | GO:0002681 | somatic diversification of T cell receptor genes(GO:0002568) somatic recombination of T cell receptor gene segments(GO:0002681) T cell receptor V(D)J recombination(GO:0033153) |
| 0.4 | 2.2 | GO:0015871 | astrocyte activation involved in immune response(GO:0002265) choline transport(GO:0015871) |
| 0.4 | 3.8 | GO:0099590 | neurotransmitter receptor internalization(GO:0099590) |
| 0.4 | 3.6 | GO:0030259 | lipid glycosylation(GO:0030259) |
| 0.4 | 1.6 | GO:0003430 | growth plate cartilage chondrocyte growth(GO:0003430) |
| 0.4 | 2.0 | GO:1902412 | regulation of mitotic cytokinesis(GO:1902412) |
| 0.4 | 1.1 | GO:0036092 | phosphatidylinositol-3-phosphate biosynthetic process(GO:0036092) |
| 0.4 | 1.1 | GO:0019046 | positive regulation of transcription from RNA polymerase II promoter involved in unfolded protein response(GO:0006990) establishment of viral latency(GO:0019043) release from viral latency(GO:0019046) |
| 0.3 | 3.8 | GO:0002281 | macrophage activation involved in immune response(GO:0002281) |
| 0.3 | 2.0 | GO:1901552 | positive regulation of endothelial cell development(GO:1901552) positive regulation of establishment of endothelial barrier(GO:1903142) |
| 0.3 | 1.3 | GO:0061739 | protein lipidation involved in autophagosome assembly(GO:0061739) |
| 0.3 | 1.6 | GO:0050861 | positive regulation of B cell receptor signaling pathway(GO:0050861) |
| 0.3 | 1.9 | GO:0046645 | positive regulation of gamma-delta T cell differentiation(GO:0045588) positive regulation of gamma-delta T cell activation(GO:0046645) |
| 0.3 | 0.9 | GO:0008612 | peptidyl-lysine modification to peptidyl-hypusine(GO:0008612) |
| 0.3 | 0.9 | GO:0043323 | positive regulation of natural killer cell degranulation(GO:0043323) |
| 0.3 | 1.2 | GO:0090309 | positive regulation of methylation-dependent chromatin silencing(GO:0090309) |
| 0.3 | 1.1 | GO:0018307 | tRNA wobble position uridine thiolation(GO:0002143) enzyme active site formation(GO:0018307) |
| 0.3 | 1.1 | GO:0090365 | regulation of mRNA modification(GO:0090365) |
| 0.3 | 1.1 | GO:0060709 | glycogen cell differentiation involved in embryonic placenta development(GO:0060709) |
| 0.3 | 0.8 | GO:0070488 | neutrophil aggregation(GO:0070488) |
| 0.3 | 3.3 | GO:0000185 | activation of MAPKKK activity(GO:0000185) |
| 0.2 | 4.2 | GO:0010669 | epithelial structure maintenance(GO:0010669) |
| 0.2 | 0.7 | GO:0046122 | purine deoxyribonucleoside metabolic process(GO:0046122) |
| 0.2 | 0.7 | GO:0010936 | negative regulation of macrophage cytokine production(GO:0010936) |
| 0.2 | 0.7 | GO:2000564 | CD8-positive, alpha-beta T cell proliferation(GO:0035740) negative regulation of regulatory T cell differentiation(GO:0045590) regulation of CD8-positive, alpha-beta T cell proliferation(GO:2000564) |
| 0.2 | 1.9 | GO:1901727 | positive regulation of histone deacetylase activity(GO:1901727) |
| 0.2 | 1.0 | GO:0006624 | vacuolar protein processing(GO:0006624) |
| 0.2 | 1.6 | GO:0021886 | female meiosis I(GO:0007144) hypothalamus gonadotrophin-releasing hormone neuron differentiation(GO:0021886) hypothalamus gonadotrophin-releasing hormone neuron development(GO:0021888) |
| 0.2 | 2.0 | GO:0038203 | TORC2 signaling(GO:0038203) |
| 0.2 | 1.1 | GO:1902455 | negative regulation of stem cell population maintenance(GO:1902455) |
| 0.2 | 2.9 | GO:1901898 | regulation of cell communication by electrical coupling involved in cardiac conduction(GO:1901844) negative regulation of relaxation of cardiac muscle(GO:1901898) |
| 0.2 | 1.3 | GO:0071787 | endoplasmic reticulum tubular network assembly(GO:0071787) |
| 0.2 | 1.3 | GO:0070166 | enamel mineralization(GO:0070166) |
| 0.2 | 0.2 | GO:1901668 | regulation of superoxide dismutase activity(GO:1901668) |
| 0.2 | 2.1 | GO:0061470 | interleukin-21 production(GO:0032625) T follicular helper cell differentiation(GO:0061470) interleukin-21 secretion(GO:0072619) |
| 0.2 | 6.7 | GO:0001937 | negative regulation of endothelial cell proliferation(GO:0001937) |
| 0.2 | 0.4 | GO:0019086 | late viral transcription(GO:0019086) |
| 0.2 | 3.0 | GO:0036296 | cellular response to increased oxygen levels(GO:0036295) response to increased oxygen levels(GO:0036296) |
| 0.2 | 1.1 | GO:0017185 | peptidyl-lysine hydroxylation(GO:0017185) |
| 0.2 | 0.4 | GO:0051771 | negative regulation of nitric-oxide synthase biosynthetic process(GO:0051771) |
| 0.2 | 0.7 | GO:0015867 | ATP transport(GO:0015867) |
| 0.2 | 1.7 | GO:0071578 | zinc II ion transmembrane import(GO:0071578) |
| 0.2 | 0.5 | GO:0002946 | tRNA C5-cytosine methylation(GO:0002946) |
| 0.2 | 1.3 | GO:0001574 | ganglioside biosynthetic process(GO:0001574) |
| 0.2 | 1.7 | GO:0030049 | muscle filament sliding(GO:0030049) |
| 0.2 | 1.0 | GO:2000210 | positive regulation of anoikis(GO:2000210) |
| 0.2 | 3.0 | GO:0006054 | N-acetylneuraminate metabolic process(GO:0006054) |
| 0.2 | 0.7 | GO:0016240 | autophagosome docking(GO:0016240) |
| 0.2 | 1.4 | GO:0045048 | protein insertion into ER membrane(GO:0045048) |
| 0.2 | 0.5 | GO:0044313 | protein K6-linked deubiquitination(GO:0044313) |
| 0.2 | 0.9 | GO:0035469 | determination of pancreatic left/right asymmetry(GO:0035469) |
| 0.1 | 2.5 | GO:0015693 | magnesium ion transport(GO:0015693) |
| 0.1 | 1.5 | GO:0019511 | peptidyl-proline hydroxylation(GO:0019511) |
| 0.1 | 1.3 | GO:0002042 | cell migration involved in sprouting angiogenesis(GO:0002042) |
| 0.1 | 1.1 | GO:1901970 | positive regulation of mitotic metaphase/anaphase transition(GO:0045842) positive regulation of mitotic sister chromatid separation(GO:1901970) positive regulation of metaphase/anaphase transition of cell cycle(GO:1902101) |
| 0.1 | 1.0 | GO:1990009 | retinal cell apoptotic process(GO:1990009) |
| 0.1 | 0.4 | GO:0006436 | tryptophanyl-tRNA aminoacylation(GO:0006436) |
| 0.1 | 2.6 | GO:0014067 | negative regulation of phosphatidylinositol 3-kinase signaling(GO:0014067) |
| 0.1 | 1.2 | GO:0018095 | protein polyglutamylation(GO:0018095) |
| 0.1 | 0.5 | GO:0017183 | peptidyl-diphthamide metabolic process(GO:0017182) peptidyl-diphthamide biosynthetic process from peptidyl-histidine(GO:0017183) |
| 0.1 | 0.9 | GO:1903026 | negative regulation of RNA polymerase II regulatory region sequence-specific DNA binding(GO:1903026) |
| 0.1 | 0.9 | GO:0070447 | positive regulation of oligodendrocyte progenitor proliferation(GO:0070447) |
| 0.1 | 0.5 | GO:0060666 | dichotomous subdivision of terminal units involved in salivary gland branching(GO:0060666) |
| 0.1 | 0.9 | GO:0023035 | CD40 signaling pathway(GO:0023035) protein linear polyubiquitination(GO:0097039) |
| 0.1 | 4.3 | GO:0048791 | calcium ion-regulated exocytosis of neurotransmitter(GO:0048791) |
| 0.1 | 0.4 | GO:1902512 | positive regulation of apoptotic DNA fragmentation(GO:1902512) |
| 0.1 | 0.5 | GO:0006121 | mitochondrial electron transport, succinate to ubiquinone(GO:0006121) |
| 0.1 | 3.1 | GO:0048268 | clathrin coat assembly(GO:0048268) |
| 0.1 | 1.2 | GO:0034497 | protein localization to pre-autophagosomal structure(GO:0034497) |
| 0.1 | 0.8 | GO:0017196 | N-terminal peptidyl-methionine acetylation(GO:0017196) |
| 0.1 | 0.4 | GO:0046368 | GDP-L-fucose metabolic process(GO:0046368) |
| 0.1 | 1.1 | GO:0061299 | retina vasculature morphogenesis in camera-type eye(GO:0061299) |
| 0.1 | 0.8 | GO:2000574 | regulation of microtubule motor activity(GO:2000574) |
| 0.1 | 0.7 | GO:0016255 | attachment of GPI anchor to protein(GO:0016255) |
| 0.1 | 0.4 | GO:1902774 | late endosome to lysosome transport(GO:1902774) |
| 0.1 | 0.6 | GO:0070294 | renal sodium ion transport(GO:0003096) renal sodium ion absorption(GO:0070294) |
| 0.1 | 0.8 | GO:0050882 | voluntary musculoskeletal movement(GO:0050882) |
| 0.1 | 0.8 | GO:0036444 | calcium ion transmembrane import into mitochondrion(GO:0036444) |
| 0.1 | 5.5 | GO:0060395 | SMAD protein signal transduction(GO:0060395) |
| 0.1 | 0.3 | GO:0006438 | valyl-tRNA aminoacylation(GO:0006438) |
| 0.1 | 2.1 | GO:0007095 | mitotic G2 DNA damage checkpoint(GO:0007095) |
| 0.1 | 1.2 | GO:1900119 | positive regulation of execution phase of apoptosis(GO:1900119) |
| 0.1 | 1.4 | GO:0000479 | endonucleolytic cleavage of tricistronic rRNA transcript (SSU-rRNA, 5.8S rRNA, LSU-rRNA)(GO:0000479) |
| 0.1 | 1.2 | GO:0070995 | NADPH oxidation(GO:0070995) |
| 0.1 | 0.4 | GO:0071630 | nucleus-associated proteasomal ubiquitin-dependent protein catabolic process(GO:0071630) |
| 0.1 | 0.3 | GO:1901069 | guanosine-containing compound catabolic process(GO:1901069) |
| 0.1 | 0.5 | GO:0006384 | transcription initiation from RNA polymerase III promoter(GO:0006384) |
| 0.1 | 1.0 | GO:0019368 | fatty acid elongation, saturated fatty acid(GO:0019367) fatty acid elongation, unsaturated fatty acid(GO:0019368) fatty acid elongation, monounsaturated fatty acid(GO:0034625) fatty acid elongation, polyunsaturated fatty acid(GO:0034626) |
| 0.1 | 3.3 | GO:0034314 | Arp2/3 complex-mediated actin nucleation(GO:0034314) |
| 0.1 | 0.6 | GO:0048102 | autophagic cell death(GO:0048102) |
| 0.1 | 0.3 | GO:0019276 | UDP-N-acetylgalactosamine metabolic process(GO:0019276) |
| 0.1 | 0.3 | GO:0060715 | syncytiotrophoblast cell differentiation involved in labyrinthine layer development(GO:0060715) |
| 0.1 | 1.2 | GO:0033234 | negative regulation of protein sumoylation(GO:0033234) |
| 0.1 | 0.8 | GO:0048149 | behavioral response to ethanol(GO:0048149) |
| 0.1 | 0.8 | GO:0006123 | mitochondrial electron transport, cytochrome c to oxygen(GO:0006123) |
| 0.1 | 0.2 | GO:0071492 | cellular response to UV-A(GO:0071492) |
| 0.1 | 1.0 | GO:0060363 | cranial suture morphogenesis(GO:0060363) |
| 0.1 | 0.3 | GO:0002457 | T cell antigen processing and presentation(GO:0002457) |
| 0.1 | 0.5 | GO:0036438 | maintenance of lens transparency(GO:0036438) |
| 0.1 | 1.5 | GO:0006622 | protein targeting to lysosome(GO:0006622) |
| 0.1 | 0.5 | GO:0045650 | negative regulation of macrophage differentiation(GO:0045650) negative regulation of cell cycle checkpoint(GO:1901977) negative regulation of DNA damage checkpoint(GO:2000002) |
| 0.1 | 0.8 | GO:0060136 | embryonic process involved in female pregnancy(GO:0060136) |
| 0.1 | 0.3 | GO:0010756 | positive regulation of plasminogen activation(GO:0010756) |
| 0.1 | 0.9 | GO:0021942 | radial glia guided migration of Purkinje cell(GO:0021942) |
| 0.1 | 0.7 | GO:0000290 | deadenylation-dependent decapping of nuclear-transcribed mRNA(GO:0000290) |
| 0.1 | 0.3 | GO:0045213 | neurotransmitter receptor metabolic process(GO:0045213) |
| 0.1 | 2.2 | GO:0035235 | ionotropic glutamate receptor signaling pathway(GO:0035235) |
| 0.1 | 0.6 | GO:0061042 | vascular wound healing(GO:0061042) |
| 0.1 | 0.4 | GO:0046415 | urate metabolic process(GO:0046415) |
| 0.1 | 4.5 | GO:0003073 | regulation of systemic arterial blood pressure(GO:0003073) |
| 0.1 | 13.7 | GO:0007266 | Rho protein signal transduction(GO:0007266) |
| 0.1 | 0.2 | GO:1903028 | regulation of opsonization(GO:1903027) positive regulation of opsonization(GO:1903028) |
| 0.1 | 0.6 | GO:0006488 | dolichol-linked oligosaccharide biosynthetic process(GO:0006488) |
| 0.1 | 1.3 | GO:0071157 | negative regulation of cell cycle arrest(GO:0071157) |
| 0.1 | 0.7 | GO:1902083 | negative regulation of peptidyl-cysteine S-nitrosylation(GO:1902083) |
| 0.1 | 1.5 | GO:0032011 | ARF protein signal transduction(GO:0032011) regulation of ARF protein signal transduction(GO:0032012) |
| 0.1 | 1.2 | GO:0031442 | positive regulation of mRNA 3'-end processing(GO:0031442) |
| 0.1 | 0.2 | GO:0009174 | UMP biosynthetic process(GO:0006222) pyrimidine ribonucleoside monophosphate metabolic process(GO:0009173) pyrimidine ribonucleoside monophosphate biosynthetic process(GO:0009174) UMP metabolic process(GO:0046049) |
| 0.1 | 2.0 | GO:0050873 | brown fat cell differentiation(GO:0050873) |
| 0.1 | 0.6 | GO:1901998 | toxin transport(GO:1901998) |
| 0.1 | 1.2 | GO:2000369 | regulation of clathrin-mediated endocytosis(GO:2000369) |
| 0.1 | 0.5 | GO:0070234 | positive regulation of T cell apoptotic process(GO:0070234) |
| 0.0 | 0.6 | GO:0032703 | negative regulation of interleukin-2 production(GO:0032703) |
| 0.0 | 2.0 | GO:0006376 | mRNA splice site selection(GO:0006376) |
| 0.0 | 0.7 | GO:0039703 | viral RNA genome replication(GO:0039694) RNA replication(GO:0039703) |
| 0.0 | 0.6 | GO:0006491 | N-glycan processing(GO:0006491) |
| 0.0 | 0.3 | GO:0006102 | isocitrate metabolic process(GO:0006102) |
| 0.0 | 0.7 | GO:0006817 | phosphate ion transport(GO:0006817) |
| 0.0 | 2.3 | GO:2000649 | regulation of sodium ion transmembrane transporter activity(GO:2000649) |
| 0.0 | 0.9 | GO:0045725 | positive regulation of glycogen biosynthetic process(GO:0045725) positive regulation of glycogen metabolic process(GO:0070875) |
| 0.0 | 0.4 | GO:0045792 | negative regulation of cell size(GO:0045792) |
| 0.0 | 0.3 | GO:2000491 | positive regulation of hepatic stellate cell activation(GO:2000491) |
| 0.0 | 0.3 | GO:0090037 | positive regulation of protein kinase C signaling(GO:0090037) |
| 0.0 | 1.8 | GO:0006890 | retrograde vesicle-mediated transport, Golgi to ER(GO:0006890) |
| 0.0 | 0.3 | GO:0031642 | negative regulation of myelination(GO:0031642) |
| 0.0 | 0.8 | GO:0046686 | response to cadmium ion(GO:0046686) |
| 0.0 | 0.8 | GO:0015991 | energy coupled proton transmembrane transport, against electrochemical gradient(GO:0015988) ATP hydrolysis coupled proton transport(GO:0015991) |
| 0.0 | 0.3 | GO:0006621 | protein retention in ER lumen(GO:0006621) |
| 0.0 | 0.2 | GO:1901165 | positive regulation of trophoblast cell migration(GO:1901165) |
| 0.0 | 0.4 | GO:0045618 | positive regulation of keratinocyte differentiation(GO:0045618) |
| 0.0 | 0.6 | GO:0042790 | transcription of nuclear large rRNA transcript from RNA polymerase I promoter(GO:0042790) |
| 0.0 | 0.4 | GO:0060976 | coronary vasculature development(GO:0060976) |
| 0.0 | 0.6 | GO:0006308 | DNA catabolic process(GO:0006308) |
| 0.0 | 0.9 | GO:0032469 | endoplasmic reticulum calcium ion homeostasis(GO:0032469) |
| 0.0 | 0.1 | GO:0002949 | tRNA threonylcarbamoyladenosine modification(GO:0002949) |
| 0.0 | 1.0 | GO:0045022 | early endosome to late endosome transport(GO:0045022) |
| 0.0 | 2.3 | GO:0032091 | negative regulation of protein binding(GO:0032091) |
| 0.0 | 0.3 | GO:0019243 | methylglyoxal catabolic process to D-lactate via S-lactoyl-glutathione(GO:0019243) methylglyoxal catabolic process(GO:0051596) methylglyoxal catabolic process to lactate(GO:0061727) |
| 0.0 | 0.8 | GO:0002089 | lens morphogenesis in camera-type eye(GO:0002089) |
| 0.0 | 0.7 | GO:2000401 | regulation of lymphocyte migration(GO:2000401) |
| 0.0 | 1.3 | GO:0000381 | regulation of alternative mRNA splicing, via spliceosome(GO:0000381) |
| 0.0 | 0.6 | GO:0000731 | DNA synthesis involved in DNA repair(GO:0000731) |
| 0.0 | 0.8 | GO:0032008 | positive regulation of TOR signaling(GO:0032008) |
| 0.0 | 3.1 | GO:0016579 | protein deubiquitination(GO:0016579) |
| 0.0 | 1.7 | GO:0032543 | mitochondrial translation(GO:0032543) |
| 0.0 | 1.3 | GO:2001238 | positive regulation of extrinsic apoptotic signaling pathway(GO:2001238) |
| 0.0 | 0.7 | GO:0000413 | protein peptidyl-prolyl isomerization(GO:0000413) |
| 0.0 | 0.5 | GO:0010800 | positive regulation of peptidyl-threonine phosphorylation(GO:0010800) |
| 0.0 | 0.7 | GO:0061099 | negative regulation of protein tyrosine kinase activity(GO:0061099) |
| 0.0 | 0.2 | GO:0090502 | RNA phosphodiester bond hydrolysis, endonucleolytic(GO:0090502) |
| 0.0 | 0.4 | GO:0006903 | vesicle targeting(GO:0006903) |
| 0.0 | 0.6 | GO:0007257 | activation of JUN kinase activity(GO:0007257) |
| 0.0 | 0.4 | GO:0009072 | aromatic amino acid family metabolic process(GO:0009072) |
| 0.0 | 0.7 | GO:0097031 | NADH dehydrogenase complex assembly(GO:0010257) mitochondrial respiratory chain complex I assembly(GO:0032981) mitochondrial respiratory chain complex I biogenesis(GO:0097031) |
| 0.0 | 1.4 | GO:0001889 | liver development(GO:0001889) |
| 0.0 | 1.1 | GO:0016525 | negative regulation of angiogenesis(GO:0016525) |
| 0.0 | 0.2 | GO:0090161 | Golgi ribbon formation(GO:0090161) |
| 0.0 | 0.1 | GO:0043201 | response to leucine(GO:0043201) cellular response to leucine(GO:0071233) |
| 0.0 | 0.1 | GO:0010726 | positive regulation of hydrogen peroxide metabolic process(GO:0010726) positive regulation of mitochondrial outer membrane permeabilization involved in apoptotic signaling pathway(GO:1901030) |
| 0.0 | 1.4 | GO:0042273 | ribosomal large subunit biogenesis(GO:0042273) |
| 0.0 | 0.4 | GO:0099517 | anterograde synaptic vesicle transport(GO:0048490) synaptic vesicle cytoskeletal transport(GO:0099514) synaptic vesicle transport along microtubule(GO:0099517) |
| 0.0 | 0.7 | GO:0045761 | regulation of adenylate cyclase activity(GO:0045761) |
| 0.0 | 0.1 | GO:0009249 | protein lipoylation(GO:0009249) |
| 0.0 | 1.0 | GO:0022900 | electron transport chain(GO:0022900) |
| 0.0 | 0.2 | GO:0090110 | cargo loading into COPII-coated vesicle(GO:0090110) |
| 0.0 | 0.6 | GO:0007566 | embryo implantation(GO:0007566) |
| 0.0 | 0.1 | GO:0009615 | response to virus(GO:0009615) |
| 0.0 | 0.4 | GO:0045879 | negative regulation of smoothened signaling pathway(GO:0045879) |
| 0.0 | 0.3 | GO:0030488 | tRNA methylation(GO:0030488) |
| 0.0 | 0.1 | GO:0010032 | meiotic chromosome condensation(GO:0010032) |
| 0.0 | 0.1 | GO:1900364 | negative regulation of mRNA 3'-end processing(GO:0031441) regulation of mRNA polyadenylation(GO:1900363) negative regulation of mRNA polyadenylation(GO:1900364) |
| 0.0 | 0.4 | GO:0000154 | rRNA modification(GO:0000154) |
| 0.0 | 0.2 | GO:0000028 | ribosomal small subunit assembly(GO:0000028) |
| 0.0 | 1.4 | GO:1904892 | regulation of JAK-STAT cascade(GO:0046425) regulation of STAT cascade(GO:1904892) |
| 0.0 | 0.3 | GO:0048488 | synaptic vesicle endocytosis(GO:0048488) |
| 0.0 | 0.0 | GO:0060263 | regulation of respiratory burst(GO:0060263) |
| 0.0 | 1.3 | GO:0030010 | establishment of cell polarity(GO:0030010) |
| 0.0 | 0.1 | GO:0016559 | peroxisome fission(GO:0016559) |
| 0.0 | 0.2 | GO:0006656 | phosphatidylcholine biosynthetic process(GO:0006656) |
| 0.0 | 0.8 | GO:0006513 | protein monoubiquitination(GO:0006513) |
| 0.0 | 0.0 | GO:0032534 | regulation of microvillus assembly(GO:0032534) |
| 0.0 | 0.4 | GO:0043154 | negative regulation of cysteine-type endopeptidase activity involved in apoptotic process(GO:0043154) |
| 0.0 | 1.2 | GO:0010977 | negative regulation of neuron projection development(GO:0010977) |
Gene overrepresentation in cellular_component category:
| Log-likelihood per target | Total log-likelihood | Term | Description |
|---|---|---|---|
| 7.5 | 22.5 | GO:1990257 | piccolo-bassoon transport vesicle(GO:1990257) |
| 1.7 | 6.7 | GO:0031092 | platelet alpha granule membrane(GO:0031092) |
| 1.1 | 4.3 | GO:1990769 | proximal neuron projection(GO:1990769) |
| 0.8 | 2.4 | GO:0034666 | integrin alpha2-beta1 complex(GO:0034666) |
| 0.6 | 1.8 | GO:0099631 | postsynaptic endocytic zone cytoplasmic component(GO:0099631) |
| 0.5 | 2.7 | GO:0048237 | rough endoplasmic reticulum lumen(GO:0048237) |
| 0.5 | 2.7 | GO:0033093 | Weibel-Palade body(GO:0033093) |
| 0.5 | 3.1 | GO:0097443 | sorting endosome(GO:0097443) |
| 0.5 | 3.3 | GO:0034366 | spherical high-density lipoprotein particle(GO:0034366) |
| 0.4 | 3.8 | GO:0033180 | proton-transporting V-type ATPase, V1 domain(GO:0033180) |
| 0.4 | 2.5 | GO:0046696 | lipopolysaccharide receptor complex(GO:0046696) |
| 0.4 | 0.4 | GO:0098799 | outer mitochondrial membrane protein complex(GO:0098799) |
| 0.4 | 1.1 | GO:0034272 | phosphatidylinositol 3-kinase complex, class III, type I(GO:0034271) phosphatidylinositol 3-kinase complex, class III, type II(GO:0034272) |
| 0.3 | 1.7 | GO:0031258 | lamellipodium membrane(GO:0031258) |
| 0.3 | 4.1 | GO:0005885 | Arp2/3 protein complex(GO:0005885) |
| 0.3 | 2.0 | GO:0000235 | astral microtubule(GO:0000235) |
| 0.3 | 1.2 | GO:1990415 | Pex17p-Pex14p docking complex(GO:1990415) peroxisomal importomer complex(GO:1990429) |
| 0.3 | 0.9 | GO:0005899 | insulin receptor complex(GO:0005899) |
| 0.3 | 2.0 | GO:0071439 | clathrin complex(GO:0071439) |
| 0.3 | 1.1 | GO:0019034 | viral replication complex(GO:0019034) |
| 0.2 | 7.9 | GO:0055038 | recycling endosome membrane(GO:0055038) |
| 0.2 | 0.9 | GO:0071797 | LUBAC complex(GO:0071797) |
| 0.2 | 0.7 | GO:0020018 | ciliary pocket(GO:0020016) ciliary pocket membrane(GO:0020018) |
| 0.2 | 1.7 | GO:0070765 | gamma-secretase complex(GO:0070765) |
| 0.2 | 1.1 | GO:0043020 | NADPH oxidase complex(GO:0043020) |
| 0.2 | 0.6 | GO:0043625 | delta DNA polymerase complex(GO:0043625) |
| 0.2 | 0.8 | GO:0005745 | m-AAA complex(GO:0005745) |
| 0.2 | 1.4 | GO:0033588 | Elongator holoenzyme complex(GO:0033588) |
| 0.2 | 2.9 | GO:0008250 | oligosaccharyltransferase complex(GO:0008250) |
| 0.2 | 1.5 | GO:0031313 | extrinsic component of endosome membrane(GO:0031313) |
| 0.2 | 5.3 | GO:0031430 | M band(GO:0031430) |
| 0.2 | 1.4 | GO:0032584 | growth cone membrane(GO:0032584) |
| 0.2 | 3.2 | GO:0000421 | autophagosome membrane(GO:0000421) |
| 0.1 | 1.0 | GO:0071818 | BAT3 complex(GO:0071818) ER membrane insertion complex(GO:0072379) |
| 0.1 | 1.5 | GO:0030688 | preribosome, small subunit precursor(GO:0030688) |
| 0.1 | 3.6 | GO:0001891 | phagocytic cup(GO:0001891) |
| 0.1 | 5.8 | GO:0030131 | clathrin adaptor complex(GO:0030131) |
| 0.1 | 0.4 | GO:0005774 | vacuolar membrane(GO:0005774) |
| 0.1 | 1.7 | GO:0016461 | unconventional myosin complex(GO:0016461) |
| 0.1 | 3.0 | GO:0005605 | basal lamina(GO:0005605) |
| 0.1 | 0.6 | GO:0032777 | Piccolo NuA4 histone acetyltransferase complex(GO:0032777) |
| 0.1 | 2.0 | GO:0031932 | TORC2 complex(GO:0031932) |
| 0.1 | 0.5 | GO:0032280 | symmetric synapse(GO:0032280) |
| 0.1 | 0.8 | GO:0019907 | cyclin-dependent protein kinase activating kinase holoenzyme complex(GO:0019907) |
| 0.1 | 0.4 | GO:0005965 | protein farnesyltransferase complex(GO:0005965) |
| 0.1 | 1.0 | GO:0032937 | SREBP-SCAP-Insig complex(GO:0032937) |
| 0.1 | 1.1 | GO:0061574 | ASAP complex(GO:0061574) |
| 0.1 | 0.8 | GO:0070695 | FHF complex(GO:0070695) |
| 0.1 | 0.8 | GO:0060293 | P granule(GO:0043186) pole plasm(GO:0045495) germ plasm(GO:0060293) |
| 0.1 | 0.8 | GO:0030123 | AP-3 adaptor complex(GO:0030123) |
| 0.1 | 0.9 | GO:0097433 | dense body(GO:0097433) HFE-transferrin receptor complex(GO:1990712) |
| 0.1 | 0.7 | GO:0042765 | GPI-anchor transamidase complex(GO:0042765) |
| 0.1 | 0.7 | GO:1990726 | Lsm1-7-Pat1 complex(GO:1990726) |
| 0.1 | 1.1 | GO:0061700 | GATOR2 complex(GO:0061700) |
| 0.1 | 2.0 | GO:0098984 | asymmetric synapse(GO:0032279) neuron to neuron synapse(GO:0098984) |
| 0.1 | 2.9 | GO:0030687 | preribosome, large subunit precursor(GO:0030687) |
| 0.1 | 0.8 | GO:0060053 | neurofilament cytoskeleton(GO:0060053) |
| 0.1 | 0.4 | GO:0097441 | basilar dendrite(GO:0097441) |
| 0.1 | 1.2 | GO:0034045 | pre-autophagosomal structure membrane(GO:0034045) |
| 0.1 | 2.1 | GO:0001741 | XY body(GO:0001741) |
| 0.1 | 1.9 | GO:0000242 | pericentriolar material(GO:0000242) |
| 0.1 | 1.0 | GO:0005862 | muscle thin filament tropomyosin(GO:0005862) |
| 0.1 | 2.6 | GO:0032420 | stereocilium(GO:0032420) |
| 0.1 | 0.4 | GO:0016602 | CCAAT-binding factor complex(GO:0016602) |
| 0.1 | 2.9 | GO:0005891 | voltage-gated calcium channel complex(GO:0005891) |
| 0.1 | 1.4 | GO:0034451 | centriolar satellite(GO:0034451) |
| 0.1 | 1.0 | GO:0012507 | ER to Golgi transport vesicle membrane(GO:0012507) |
| 0.1 | 0.4 | GO:0038201 | TOR complex(GO:0038201) |
| 0.1 | 1.2 | GO:0044224 | juxtaparanode region of axon(GO:0044224) |
| 0.1 | 2.0 | GO:0000314 | organellar small ribosomal subunit(GO:0000314) mitochondrial small ribosomal subunit(GO:0005763) |
| 0.1 | 2.6 | GO:0005719 | nuclear euchromatin(GO:0005719) |
| 0.1 | 5.6 | GO:0000118 | histone deacetylase complex(GO:0000118) |
| 0.1 | 0.2 | GO:0035061 | interchromatin granule(GO:0035061) |
| 0.1 | 1.3 | GO:0071782 | endoplasmic reticulum tubular network(GO:0071782) |
| 0.1 | 0.8 | GO:0005869 | dynactin complex(GO:0005869) |
| 0.1 | 3.8 | GO:0031463 | Cul3-RING ubiquitin ligase complex(GO:0031463) |
| 0.1 | 0.4 | GO:0043195 | terminal bouton(GO:0043195) |
| 0.1 | 6.6 | GO:0031225 | anchored component of membrane(GO:0031225) |
| 0.1 | 1.3 | GO:0005721 | pericentric heterochromatin(GO:0005721) |
| 0.1 | 2.5 | GO:0005834 | heterotrimeric G-protein complex(GO:0005834) |
| 0.0 | 0.3 | GO:0070847 | core mediator complex(GO:0070847) |
| 0.0 | 0.3 | GO:0044233 | ER-mitochondrion membrane contact site(GO:0044233) |
| 0.0 | 3.6 | GO:0005604 | basement membrane(GO:0005604) |
| 0.0 | 0.4 | GO:0016593 | Cdc73/Paf1 complex(GO:0016593) |
| 0.0 | 0.5 | GO:0000347 | THO complex(GO:0000347) THO complex part of transcription export complex(GO:0000445) |
| 0.0 | 1.8 | GO:0030173 | integral component of Golgi membrane(GO:0030173) |
| 0.0 | 0.3 | GO:0000127 | transcription factor TFIIIC complex(GO:0000127) |
| 0.0 | 0.4 | GO:0005892 | acetylcholine-gated channel complex(GO:0005892) |
| 0.0 | 0.3 | GO:0000812 | Swr1 complex(GO:0000812) |
| 0.0 | 0.4 | GO:0048188 | Set1C/COMPASS complex(GO:0048188) |
| 0.0 | 0.7 | GO:0016327 | apicolateral plasma membrane(GO:0016327) |
| 0.0 | 0.5 | GO:0005868 | cytoplasmic dynein complex(GO:0005868) |
| 0.0 | 0.5 | GO:0031588 | nucleotide-activated protein kinase complex(GO:0031588) |
| 0.0 | 0.4 | GO:0005751 | mitochondrial respiratory chain complex IV(GO:0005751) |
| 0.0 | 1.1 | GO:0016235 | aggresome(GO:0016235) |
| 0.0 | 0.4 | GO:0030126 | COPI vesicle coat(GO:0030126) |
| 0.0 | 0.2 | GO:0000172 | ribonuclease MRP complex(GO:0000172) |
| 0.0 | 0.6 | GO:0030673 | axolemma(GO:0030673) |
| 0.0 | 2.7 | GO:0043204 | perikaryon(GO:0043204) |
| 0.0 | 0.2 | GO:0005742 | mitochondrial outer membrane translocase complex(GO:0005742) |
| 0.0 | 0.0 | GO:0071920 | cleavage body(GO:0071920) |
| 0.0 | 1.3 | GO:0000315 | organellar large ribosomal subunit(GO:0000315) mitochondrial large ribosomal subunit(GO:0005762) |
| 0.0 | 0.9 | GO:0097014 | axoneme(GO:0005930) ciliary plasm(GO:0097014) |
| 0.0 | 4.0 | GO:0009897 | external side of plasma membrane(GO:0009897) |
| 0.0 | 4.9 | GO:0000139 | Golgi membrane(GO:0000139) |
| 0.0 | 0.4 | GO:0005849 | mRNA cleavage factor complex(GO:0005849) |
| 0.0 | 0.7 | GO:0005905 | clathrin-coated pit(GO:0005905) |
| 0.0 | 0.4 | GO:0005764 | lytic vacuole(GO:0000323) lysosome(GO:0005764) |
| 0.0 | 3.9 | GO:0045211 | postsynaptic membrane(GO:0045211) |
| 0.0 | 2.0 | GO:0005840 | ribosome(GO:0005840) |
| 0.0 | 0.9 | GO:0010494 | cytoplasmic stress granule(GO:0010494) |
| 0.0 | 0.2 | GO:0044300 | cerebellar mossy fiber(GO:0044300) |
| 0.0 | 0.7 | GO:0045271 | mitochondrial respiratory chain complex I(GO:0005747) NADH dehydrogenase complex(GO:0030964) respiratory chain complex I(GO:0045271) |
| 0.0 | 2.2 | GO:0097708 | cytoplasmic vesicle(GO:0031410) intracellular vesicle(GO:0097708) |
| 0.0 | 0.9 | GO:0005901 | caveola(GO:0005901) |
| 0.0 | 2.1 | GO:0098852 | lysosomal membrane(GO:0005765) lytic vacuole membrane(GO:0098852) |
| 0.0 | 0.5 | GO:0008021 | synaptic vesicle(GO:0008021) |
Gene overrepresentation in molecular_function category:
| Log-likelihood per target | Total log-likelihood | Term | Description |
|---|---|---|---|
| 1.3 | 22.5 | GO:0045504 | dynein heavy chain binding(GO:0045504) |
| 1.2 | 3.6 | GO:0015038 | glutathione disulfide oxidoreductase activity(GO:0015038) |
| 0.9 | 1.8 | GO:0004515 | nicotinamide-nucleotide adenylyltransferase activity(GO:0000309) nicotinate-nucleotide adenylyltransferase activity(GO:0004515) |
| 0.9 | 2.7 | GO:0003796 | lysozyme activity(GO:0003796) |
| 0.8 | 2.5 | GO:0001875 | lipopolysaccharide receptor activity(GO:0001875) |
| 0.8 | 2.4 | GO:0005128 | erythropoietin receptor binding(GO:0005128) |
| 0.6 | 3.0 | GO:0003835 | beta-galactoside alpha-2,6-sialyltransferase activity(GO:0003835) |
| 0.6 | 2.3 | GO:0004111 | creatine kinase activity(GO:0004111) |
| 0.5 | 2.0 | GO:0019808 | polyamine binding(GO:0019808) |
| 0.5 | 1.4 | GO:0015140 | malate transmembrane transporter activity(GO:0015140) |
| 0.5 | 2.4 | GO:0005534 | galactose binding(GO:0005534) |
| 0.5 | 1.9 | GO:0034511 | U3 snoRNA binding(GO:0034511) |
| 0.4 | 1.3 | GO:0001888 | glucuronyl-galactosyl-proteoglycan 4-alpha-N-acetylglucosaminyltransferase activity(GO:0001888) |
| 0.4 | 5.3 | GO:0004576 | oligosaccharyl transferase activity(GO:0004576) dolichyl-diphosphooligosaccharide-protein glycotransferase activity(GO:0004579) |
| 0.4 | 2.7 | GO:0001849 | complement component C1q binding(GO:0001849) |
| 0.4 | 1.9 | GO:0042610 | CD8 receptor binding(GO:0042610) |
| 0.4 | 1.9 | GO:0086080 | protein binding involved in heterotypic cell-cell adhesion(GO:0086080) |
| 0.4 | 3.3 | GO:0030274 | LIM domain binding(GO:0030274) |
| 0.3 | 2.0 | GO:0015277 | kainate selective glutamate receptor activity(GO:0015277) |
| 0.3 | 1.0 | GO:0022865 | transmembrane electron transfer carrier(GO:0022865) |
| 0.3 | 1.2 | GO:0070740 | tubulin-glutamic acid ligase activity(GO:0070740) |
| 0.3 | 2.2 | GO:0042500 | aspartic endopeptidase activity, intramembrane cleaving(GO:0042500) |
| 0.3 | 2.7 | GO:0019865 | immunoglobulin binding(GO:0019865) |
| 0.3 | 1.1 | GO:0016175 | superoxide-generating NADPH oxidase activity(GO:0016175) |
| 0.3 | 2.0 | GO:0035612 | AP-2 adaptor complex binding(GO:0035612) |
| 0.2 | 0.7 | GO:0015228 | coenzyme A transmembrane transporter activity(GO:0015228) adenosine 3',5'-bisphosphate transmembrane transporter activity(GO:0071077) AMP transmembrane transporter activity(GO:0080122) |
| 0.2 | 0.7 | GO:0005436 | sodium:phosphate symporter activity(GO:0005436) sodium:inorganic phosphate symporter activity(GO:0015319) |
| 0.2 | 1.1 | GO:0004792 | thiosulfate sulfurtransferase activity(GO:0004792) |
| 0.2 | 7.4 | GO:0050750 | low-density lipoprotein particle receptor binding(GO:0050750) |
| 0.2 | 1.1 | GO:0004430 | 1-phosphatidylinositol 4-kinase activity(GO:0004430) |
| 0.2 | 0.6 | GO:0001042 | RNA polymerase I core binding(GO:0001042) |
| 0.2 | 1.0 | GO:0005166 | neurotrophin p75 receptor binding(GO:0005166) |
| 0.2 | 0.6 | GO:0004534 | transcription termination site sequence-specific DNA binding(GO:0001147) transcription termination site DNA binding(GO:0001160) 5'-3' exoribonuclease activity(GO:0004534) |
| 0.2 | 14.2 | GO:0030276 | clathrin binding(GO:0030276) |
| 0.2 | 1.3 | GO:0001665 | alpha-N-acetylgalactosaminide alpha-2,6-sialyltransferase activity(GO:0001665) |
| 0.2 | 0.8 | GO:0070012 | oligopeptidase activity(GO:0070012) |
| 0.2 | 0.7 | GO:0019136 | deoxynucleoside kinase activity(GO:0019136) |
| 0.2 | 0.7 | GO:0052743 | inositol tetrakisphosphate phosphatase activity(GO:0052743) |
| 0.2 | 3.8 | GO:0046961 | proton-transporting ATPase activity, rotational mechanism(GO:0046961) |
| 0.2 | 1.0 | GO:0016936 | galactoside binding(GO:0016936) |
| 0.2 | 0.5 | GO:0000992 | polymerase III regulatory region sequence-specific DNA binding(GO:0000992) RNA polymerase III type 1 promoter sequence-specific DNA binding(GO:0001002) RNA polymerase III type 2 promoter sequence-specific DNA binding(GO:0001003) |
| 0.2 | 0.5 | GO:0008109 | N-acetyllactosaminide beta-1,6-N-acetylglucosaminyltransferase activity(GO:0008109) |
| 0.2 | 1.2 | GO:0003886 | DNA (cytosine-5-)-methyltransferase activity(GO:0003886) |
| 0.2 | 6.2 | GO:0043015 | gamma-tubulin binding(GO:0043015) |
| 0.1 | 1.5 | GO:0031543 | peptidyl-proline dioxygenase activity(GO:0031543) |
| 0.1 | 0.6 | GO:0097003 | adipokinetic hormone receptor activity(GO:0097003) |
| 0.1 | 0.4 | GO:0004830 | tryptophan-tRNA ligase activity(GO:0004830) |
| 0.1 | 0.8 | GO:0050786 | arachidonic acid binding(GO:0050544) RAGE receptor binding(GO:0050786) |
| 0.1 | 0.9 | GO:0015091 | ferric iron transmembrane transporter activity(GO:0015091) trivalent inorganic cation transmembrane transporter activity(GO:0072510) |
| 0.1 | 0.4 | GO:0004660 | protein farnesyltransferase activity(GO:0004660) |
| 0.1 | 0.4 | GO:0001716 | L-amino-acid oxidase activity(GO:0001716) |
| 0.1 | 0.6 | GO:0050265 | RNA uridylyltransferase activity(GO:0050265) |
| 0.1 | 2.9 | GO:0004115 | 3',5'-cyclic-AMP phosphodiesterase activity(GO:0004115) |
| 0.1 | 0.7 | GO:0003923 | GPI-anchor transamidase activity(GO:0003923) |
| 0.1 | 7.6 | GO:0005518 | collagen binding(GO:0005518) |
| 0.1 | 0.3 | GO:0004449 | isocitrate dehydrogenase (NAD+) activity(GO:0004449) |
| 0.1 | 1.5 | GO:0034450 | ubiquitin-ubiquitin ligase activity(GO:0034450) |
| 0.1 | 0.4 | GO:0008240 | tripeptidyl-peptidase activity(GO:0008240) |
| 0.1 | 0.9 | GO:0043023 | ribosomal large subunit binding(GO:0043023) |
| 0.1 | 2.8 | GO:0008432 | JUN kinase binding(GO:0008432) |
| 0.1 | 1.1 | GO:0008140 | cAMP response element binding protein binding(GO:0008140) |
| 0.1 | 0.3 | GO:0008534 | oxidized purine nucleobase lesion DNA N-glycosylase activity(GO:0008534) |
| 0.1 | 6.5 | GO:0015459 | potassium channel regulator activity(GO:0015459) |
| 0.1 | 1.0 | GO:0009922 | fatty acid elongase activity(GO:0009922) 3-oxo-arachidoyl-CoA synthase activity(GO:0102336) 3-oxo-cerotoyl-CoA synthase activity(GO:0102337) 3-oxo-lignoceronyl-CoA synthase activity(GO:0102338) |
| 0.1 | 2.1 | GO:0004709 | MAP kinase kinase kinase activity(GO:0004709) |
| 0.1 | 0.4 | GO:0000179 | rRNA (adenine-N6,N6-)-dimethyltransferase activity(GO:0000179) |
| 0.1 | 0.4 | GO:0015143 | urate transmembrane transporter activity(GO:0015143) salt transmembrane transporter activity(GO:1901702) |
| 0.1 | 1.1 | GO:0005225 | volume-sensitive anion channel activity(GO:0005225) |
| 0.1 | 1.6 | GO:0043274 | phospholipase binding(GO:0043274) |
| 0.1 | 1.0 | GO:0015643 | toxic substance binding(GO:0015643) |
| 0.1 | 1.6 | GO:0003708 | retinoic acid receptor activity(GO:0003708) |
| 0.1 | 3.2 | GO:0004683 | calmodulin-dependent protein kinase activity(GO:0004683) |
| 0.1 | 0.6 | GO:0003993 | acid phosphatase activity(GO:0003993) |
| 0.1 | 0.3 | GO:0004832 | valine-tRNA ligase activity(GO:0004832) |
| 0.1 | 0.5 | GO:0019869 | chloride channel inhibitor activity(GO:0019869) |
| 0.1 | 2.3 | GO:0017080 | sodium channel regulator activity(GO:0017080) |
| 0.1 | 1.1 | GO:0030235 | nitric-oxide synthase regulator activity(GO:0030235) |
| 0.1 | 0.3 | GO:0046923 | ER retention sequence binding(GO:0046923) |
| 0.1 | 1.8 | GO:0008376 | acetylgalactosaminyltransferase activity(GO:0008376) |
| 0.1 | 2.1 | GO:0019843 | rRNA binding(GO:0019843) |
| 0.1 | 0.5 | GO:0008607 | phosphorylase kinase regulator activity(GO:0008607) |
| 0.1 | 7.2 | GO:0008013 | beta-catenin binding(GO:0008013) |
| 0.1 | 1.6 | GO:0005086 | ARF guanyl-nucleotide exchange factor activity(GO:0005086) |
| 0.1 | 1.8 | GO:0030676 | Rac guanyl-nucleotide exchange factor activity(GO:0030676) |
| 0.1 | 17.8 | GO:0005096 | GTPase activator activity(GO:0005096) |
| 0.1 | 0.2 | GO:0070051 | fibrinogen binding(GO:0070051) |
| 0.1 | 6.5 | GO:0008565 | protein transporter activity(GO:0008565) |
| 0.1 | 0.7 | GO:0000339 | RNA cap binding(GO:0000339) |
| 0.1 | 0.5 | GO:0016428 | tRNA (cytosine-5-)-methyltransferase activity(GO:0016428) |
| 0.1 | 0.7 | GO:0008179 | adenylate cyclase binding(GO:0008179) |
| 0.1 | 1.2 | GO:0080025 | phosphatidylinositol-3,5-bisphosphate binding(GO:0080025) |
| 0.1 | 1.4 | GO:0004012 | phospholipid-translocating ATPase activity(GO:0004012) |
| 0.1 | 0.6 | GO:0030306 | ADP-ribosylation factor binding(GO:0030306) |
| 0.1 | 0.4 | GO:0016775 | phosphotransferase activity, nitrogenous group as acceptor(GO:0016775) |
| 0.1 | 1.8 | GO:0008307 | structural constituent of muscle(GO:0008307) |
| 0.1 | 0.8 | GO:0004596 | peptide alpha-N-acetyltransferase activity(GO:0004596) |
| 0.0 | 0.3 | GO:0043141 | ATP-dependent 5'-3' DNA helicase activity(GO:0043141) |
| 0.0 | 0.2 | GO:0004045 | aminoacyl-tRNA hydrolase activity(GO:0004045) |
| 0.0 | 2.9 | GO:0005200 | structural constituent of cytoskeleton(GO:0005200) |
| 0.0 | 0.1 | GO:0070892 | lipoteichoic acid receptor activity(GO:0070892) |
| 0.0 | 1.2 | GO:0005164 | tumor necrosis factor receptor binding(GO:0005164) |
| 0.0 | 0.3 | GO:0052629 | phosphatidylinositol-3,5-bisphosphate 3-phosphatase activity(GO:0052629) |
| 0.0 | 0.4 | GO:0003958 | NADPH-hemoprotein reductase activity(GO:0003958) |
| 0.0 | 0.5 | GO:0071933 | Arp2/3 complex binding(GO:0071933) |
| 0.0 | 4.0 | GO:0004843 | thiol-dependent ubiquitin-specific protease activity(GO:0004843) |
| 0.0 | 0.1 | GO:0016979 | lipoate-protein ligase activity(GO:0016979) |
| 0.0 | 0.7 | GO:0005044 | scavenger receptor activity(GO:0005044) |
| 0.0 | 1.9 | GO:0036002 | pre-mRNA binding(GO:0036002) |
| 0.0 | 0.3 | GO:0004416 | hydroxyacylglutathione hydrolase activity(GO:0004416) |
| 0.0 | 0.2 | GO:0004849 | uridine kinase activity(GO:0004849) |
| 0.0 | 0.4 | GO:0070628 | proteasome binding(GO:0070628) |
| 0.0 | 0.7 | GO:0097602 | cullin family protein binding(GO:0097602) |
| 0.0 | 0.5 | GO:0035004 | 1-phosphatidylinositol-3-kinase activity(GO:0016303) phosphatidylinositol 3-kinase activity(GO:0035004) phosphatidylinositol kinase activity(GO:0052742) |
| 0.0 | 0.2 | GO:0043531 | ADP binding(GO:0043531) |
| 0.0 | 0.6 | GO:0003841 | 1-acylglycerol-3-phosphate O-acyltransferase activity(GO:0003841) |
| 0.0 | 0.2 | GO:0016018 | cyclosporin A binding(GO:0016018) |
| 0.0 | 0.6 | GO:0003887 | DNA-directed DNA polymerase activity(GO:0003887) |
| 0.0 | 0.2 | GO:0005504 | fatty acid binding(GO:0005504) |
| 0.0 | 0.4 | GO:0016709 | oxidoreductase activity, acting on paired donors, with incorporation or reduction of molecular oxygen, NAD(P)H as one donor, and incorporation of one atom of oxygen(GO:0016709) |
| 0.0 | 1.9 | GO:0004222 | metalloendopeptidase activity(GO:0004222) |
| 0.0 | 0.8 | GO:0001671 | ATPase activator activity(GO:0001671) |
| 0.0 | 1.5 | GO:0016765 | transferase activity, transferring alkyl or aryl (other than methyl) groups(GO:0016765) |
| 0.0 | 0.3 | GO:0034185 | apolipoprotein binding(GO:0034185) |
| 0.0 | 0.7 | GO:0016859 | peptidyl-prolyl cis-trans isomerase activity(GO:0003755) cis-trans isomerase activity(GO:0016859) |
| 0.0 | 6.3 | GO:0031625 | ubiquitin protein ligase binding(GO:0031625) |
| 0.0 | 0.4 | GO:0004129 | cytochrome-c oxidase activity(GO:0004129) heme-copper terminal oxidase activity(GO:0015002) oxidoreductase activity, acting on a heme group of donors(GO:0016675) oxidoreductase activity, acting on a heme group of donors, oxygen as acceptor(GO:0016676) |
| 0.0 | 0.1 | GO:0016748 | succinyltransferase activity(GO:0016748) |
| 0.0 | 1.1 | GO:0004714 | transmembrane receptor protein tyrosine kinase activity(GO:0004714) |
| 0.0 | 1.1 | GO:0004722 | protein serine/threonine phosphatase activity(GO:0004722) |
| 0.0 | 1.6 | GO:0005125 | cytokine activity(GO:0005125) |
| 0.0 | 0.3 | GO:0016423 | tRNA (guanine) methyltransferase activity(GO:0016423) |
| 0.0 | 0.4 | GO:0032266 | phosphatidylinositol-3-phosphate binding(GO:0032266) |
| 0.0 | 0.8 | GO:0016836 | hydro-lyase activity(GO:0016836) |
| 0.0 | 0.2 | GO:0031957 | very long-chain fatty acid-CoA ligase activity(GO:0031957) |
| 0.0 | 0.2 | GO:0004526 | ribonuclease P activity(GO:0004526) |
| 0.0 | 0.5 | GO:0005484 | SNAP receptor activity(GO:0005484) |
| 0.0 | 0.4 | GO:0000993 | RNA polymerase II core binding(GO:0000993) |
| 0.0 | 0.7 | GO:0030374 | ligand-dependent nuclear receptor transcription coactivator activity(GO:0030374) |
| 0.0 | 1.5 | GO:0047485 | protein N-terminus binding(GO:0047485) |
| 0.0 | 2.2 | GO:0003735 | structural constituent of ribosome(GO:0003735) |
| 0.0 | 0.0 | GO:0031996 | thioesterase binding(GO:0031996) |
| 0.0 | 0.0 | GO:0033677 | DNA/RNA helicase activity(GO:0033677) |
| 0.0 | 0.6 | GO:0044325 | ion channel binding(GO:0044325) |
| 0.0 | 0.3 | GO:0043027 | cysteine-type endopeptidase inhibitor activity involved in apoptotic process(GO:0043027) |
| 0.0 | 0.4 | GO:0000980 | RNA polymerase II distal enhancer sequence-specific DNA binding(GO:0000980) |
| 0.0 | 0.0 | GO:0046899 | nucleoside triphosphate adenylate kinase activity(GO:0046899) |
| 0.0 | 1.2 | GO:0003705 | transcription factor activity, RNA polymerase II distal enhancer sequence-specific binding(GO:0003705) |
| 0.0 | 0.7 | GO:0051082 | unfolded protein binding(GO:0051082) |
Gene overrepresentation in C2:CP category:
| Log-likelihood per target | Total log-likelihood | Term | Description |
|---|---|---|---|
| 0.2 | 1.1 | PID_RAC1_PATHWAY | RAC1 signaling pathway |
| 0.1 | 4.2 | PID_GLYPICAN_1PATHWAY | Glypican 1 network |
| 0.1 | 1.4 | ST_INTERFERON_GAMMA_PATHWAY | Interferon gamma pathway. |
| 0.1 | 10.6 | PID_HIF1_TFPATHWAY | HIF-1-alpha transcription factor network |
| 0.1 | 1.7 | PID_SYNDECAN_3_PATHWAY | Syndecan-3-mediated signaling events |
| 0.1 | 3.2 | PID_TOLL_ENDOGENOUS_PATHWAY | Endogenous TLR signaling |
| 0.1 | 7.3 | PID_RAC1_REG_PATHWAY | Regulation of RAC1 activity |
| 0.1 | 3.0 | NABA_BASEMENT_MEMBRANES | Genes encoding structural components of basement membranes |
| 0.1 | 1.9 | PID_S1P_S1P2_PATHWAY | S1P2 pathway |
| 0.1 | 2.2 | PID_ARF_3PATHWAY | Arf1 pathway |
| 0.1 | 2.6 | PID_AURORA_A_PATHWAY | Aurora A signaling |
| 0.1 | 9.0 | NABA_ECM_GLYCOPROTEINS | Genes encoding structural ECM glycoproteins |
| 0.1 | 2.1 | PID_P38_MKK3_6PATHWAY | p38 MAPK signaling pathway |
| 0.1 | 1.1 | ST_G_ALPHA_S_PATHWAY | G alpha s Pathway |
| 0.1 | 0.9 | SA_B_CELL_RECEPTOR_COMPLEXES | Antigen binding to B cell receptors activates protein tyrosine kinases, such as the Src family, which ultimate activate MAP kinases. |
| 0.1 | 1.1 | ST_TUMOR_NECROSIS_FACTOR_PATHWAY | Tumor Necrosis Factor Pathway. |
| 0.1 | 1.4 | PID_TRAIL_PATHWAY | TRAIL signaling pathway |
| 0.1 | 2.8 | PID_RHOA_REG_PATHWAY | Regulation of RhoA activity |
| 0.1 | 2.3 | PID_INSULIN_PATHWAY | Insulin Pathway |
| 0.1 | 2.0 | PID_NCADHERIN_PATHWAY | N-cadherin signaling events |
| 0.0 | 1.5 | PID_BCR_5PATHWAY | BCR signaling pathway |
| 0.0 | 4.3 | PID_PDGFRB_PATHWAY | PDGFR-beta signaling pathway |
| 0.0 | 2.5 | PID_MTOR_4PATHWAY | mTOR signaling pathway |
| 0.0 | 1.6 | PID_RETINOIC_ACID_PATHWAY | Retinoic acid receptors-mediated signaling |
| 0.0 | 0.7 | PID_IL12_STAT4_PATHWAY | IL12 signaling mediated by STAT4 |
| 0.0 | 2.9 | PID_P53_REGULATION_PATHWAY | p53 pathway |
| 0.0 | 2.3 | PID_TRKR_PATHWAY | Neurotrophic factor-mediated Trk receptor signaling |
| 0.0 | 2.6 | PID_BETA_CATENIN_NUC_PATHWAY | Regulation of nuclear beta catenin signaling and target gene transcription |
| 0.0 | 1.4 | PID_MYC_REPRESS_PATHWAY | Validated targets of C-MYC transcriptional repression |
| 0.0 | 0.4 | PID_HIF1A_PATHWAY | Hypoxic and oxygen homeostasis regulation of HIF-1-alpha |
| 0.0 | 0.3 | PID_SYNDECAN_2_PATHWAY | Syndecan-2-mediated signaling events |
| 0.0 | 1.2 | PID_ERA_GENOMIC_PATHWAY | Validated nuclear estrogen receptor alpha network |
| 0.0 | 0.2 | PID_INTEGRIN_CS_PATHWAY | Integrin family cell surface interactions |
| 0.0 | 1.6 | NABA_ECM_AFFILIATED | Genes encoding proteins affiliated structurally or functionally to extracellular matrix proteins |
| 0.0 | 0.3 | PID_ILK_PATHWAY | Integrin-linked kinase signaling |
| 0.0 | 0.1 | PID_CD40_PATHWAY | CD40/CD40L signaling |
Gene overrepresentation in C2:CP:REACTOME category:
| Log-likelihood per target | Total log-likelihood | Term | Description |
|---|---|---|---|
| 0.4 | 5.0 | REACTOME_PLATELET_ADHESION_TO_EXPOSED_COLLAGEN | Genes involved in Platelet Adhesion to exposed collagen |
| 0.3 | 6.1 | REACTOME_IMMUNOREGULATORY_INTERACTIONS_BETWEEN_A_LYMPHOID_AND_A_NON_LYMPHOID_CELL | Genes involved in Immunoregulatory interactions between a Lymphoid and a non-Lymphoid cell |
| 0.3 | 1.9 | REACTOME_TRANSLOCATION_OF_ZAP_70_TO_IMMUNOLOGICAL_SYNAPSE | Genes involved in Translocation of ZAP-70 to Immunological synapse |
| 0.3 | 5.6 | REACTOME_RETROGRADE_NEUROTROPHIN_SIGNALLING | Genes involved in Retrograde neurotrophin signalling |
| 0.2 | 24.4 | REACTOME_MHC_CLASS_II_ANTIGEN_PRESENTATION | Genes involved in MHC class II antigen presentation |
| 0.2 | 4.3 | REACTOME_IONOTROPIC_ACTIVITY_OF_KAINATE_RECEPTORS | Genes involved in Ionotropic activity of Kainate Receptors |
| 0.2 | 2.5 | REACTOME_IKK_COMPLEX_RECRUITMENT_MEDIATED_BY_RIP1 | Genes involved in IKK complex recruitment mediated by RIP1 |
| 0.2 | 3.0 | REACTOME_ADVANCED_GLYCOSYLATION_ENDPRODUCT_RECEPTOR_SIGNALING | Genes involved in Advanced glycosylation endproduct receptor signaling |
| 0.2 | 4.9 | REACTOME_LATENT_INFECTION_OF_HOMO_SAPIENS_WITH_MYCOBACTERIUM_TUBERCULOSIS | Genes involved in Latent infection of Homo sapiens with Mycobacterium tuberculosis |
| 0.2 | 2.5 | REACTOME_SYNTHESIS_OF_PIPS_AT_THE_EARLY_ENDOSOME_MEMBRANE | Genes involved in Synthesis of PIPs at the early endosome membrane |
| 0.1 | 2.5 | REACTOME_TRAFFICKING_OF_GLUR2_CONTAINING_AMPA_RECEPTORS | Genes involved in Trafficking of GluR2-containing AMPA receptors |
| 0.1 | 3.6 | REACTOME_GLUTATHIONE_CONJUGATION | Genes involved in Glutathione conjugation |
| 0.1 | 2.0 | REACTOME_METABOLISM_OF_POLYAMINES | Genes involved in Metabolism of polyamines |
| 0.1 | 1.1 | REACTOME_SYNTHESIS_OF_PIPS_AT_THE_GOLGI_MEMBRANE | Genes involved in Synthesis of PIPs at the Golgi membrane |
| 0.1 | 3.5 | REACTOME_SMOOTH_MUSCLE_CONTRACTION | Genes involved in Smooth Muscle Contraction |
| 0.1 | 1.7 | REACTOME_ZINC_TRANSPORTERS | Genes involved in Zinc transporters |
| 0.1 | 7.9 | REACTOME_RESPONSE_TO_ELEVATED_PLATELET_CYTOSOLIC_CA2_ | Genes involved in Response to elevated platelet cytosolic Ca2+ |
| 0.1 | 1.7 | REACTOME_NRIF_SIGNALS_CELL_DEATH_FROM_THE_NUCLEUS | Genes involved in NRIF signals cell death from the nucleus |
| 0.1 | 7.4 | REACTOME_NRAGE_SIGNALS_DEATH_THROUGH_JNK | Genes involved in NRAGE signals death through JNK |
| 0.1 | 2.7 | REACTOME_G_BETA_GAMMA_SIGNALLING_THROUGH_PLC_BETA | Genes involved in G beta:gamma signalling through PLC beta |
| 0.1 | 1.1 | REACTOME_NEGATIVE_REGULATION_OF_THE_PI3K_AKT_NETWORK | Genes involved in Negative regulation of the PI3K/AKT network |
| 0.1 | 2.9 | REACTOME_DARPP_32_EVENTS | Genes involved in DARPP-32 events |
| 0.1 | 7.6 | REACTOME_SIGNALING_BY_RHO_GTPASES | Genes involved in Signaling by Rho GTPases |
| 0.1 | 0.7 | REACTOME_PROTEOLYTIC_CLEAVAGE_OF_SNARE_COMPLEX_PROTEINS | Genes involved in Proteolytic cleavage of SNARE complex proteins |
| 0.1 | 2.0 | REACTOME_ADHERENS_JUNCTIONS_INTERACTIONS | Genes involved in Adherens junctions interactions |
| 0.1 | 4.1 | REACTOME_REGULATION_OF_INSULIN_SECRETION | Genes involved in Regulation of Insulin Secretion |
| 0.1 | 0.6 | REACTOME_REMOVAL_OF_THE_FLAP_INTERMEDIATE_FROM_THE_C_STRAND | Genes involved in Removal of the Flap Intermediate from the C-strand |
| 0.1 | 1.0 | REACTOME_PURINE_SALVAGE | Genes involved in Purine salvage |
| 0.0 | 1.4 | REACTOME_GLUCONEOGENESIS | Genes involved in Gluconeogenesis |
| 0.0 | 0.7 | REACTOME_MRNA_DECAY_BY_5_TO_3_EXORIBONUCLEASE | Genes involved in mRNA Decay by 5' to 3' Exoribonuclease |
| 0.0 | 1.8 | REACTOME_TRANSPORT_OF_VITAMINS_NUCLEOSIDES_AND_RELATED_MOLECULES | Genes involved in Transport of vitamins, nucleosides, and related molecules |
| 0.0 | 0.4 | REACTOME_FACILITATIVE_NA_INDEPENDENT_GLUCOSE_TRANSPORTERS | Genes involved in Facilitative Na+-independent glucose transporters |
| 0.0 | 1.0 | REACTOME_SYNTHESIS_OF_VERY_LONG_CHAIN_FATTY_ACYL_COAS | Genes involved in Synthesis of very long-chain fatty acyl-CoAs |
| 0.0 | 1.7 | REACTOME_MRNA_3_END_PROCESSING | Genes involved in mRNA 3'-end processing |
| 0.0 | 0.5 | REACTOME_REGULATION_OF_RHEB_GTPASE_ACTIVITY_BY_AMPK | Genes involved in Regulation of Rheb GTPase activity by AMPK |
| 0.0 | 1.7 | REACTOME_INTERFERON_GAMMA_SIGNALING | Genes involved in Interferon gamma signaling |
| 0.0 | 0.4 | REACTOME_COPI_MEDIATED_TRANSPORT | Genes involved in COPI Mediated Transport |
| 0.0 | 0.8 | REACTOME_METABOLISM_OF_PORPHYRINS | Genes involved in Metabolism of porphyrins |
| 0.0 | 0.1 | REACTOME_GENERATION_OF_SECOND_MESSENGER_MOLECULES | Genes involved in Generation of second messenger molecules |
| 0.0 | 0.4 | REACTOME_AKT_PHOSPHORYLATES_TARGETS_IN_THE_CYTOSOL | Genes involved in AKT phosphorylates targets in the cytosol |
| 0.0 | 1.4 | REACTOME_ION_TRANSPORT_BY_P_TYPE_ATPASES | Genes involved in Ion transport by P-type ATPases |
| 0.0 | 2.9 | REACTOME_ASPARAGINE_N_LINKED_GLYCOSYLATION | Genes involved in Asparagine N-linked glycosylation |
| 0.0 | 1.2 | REACTOME_VOLTAGE_GATED_POTASSIUM_CHANNELS | Genes involved in Voltage gated Potassium channels |
| 0.0 | 0.8 | REACTOME_CYTOSOLIC_TRNA_AMINOACYLATION | Genes involved in Cytosolic tRNA aminoacylation |
| 0.0 | 1.2 | REACTOME_ASSOCIATION_OF_TRIC_CCT_WITH_TARGET_PROTEINS_DURING_BIOSYNTHESIS | Genes involved in Association of TriC/CCT with target proteins during biosynthesis |
| 0.0 | 0.9 | REACTOME_PEROXISOMAL_LIPID_METABOLISM | Genes involved in Peroxisomal lipid metabolism |
| 0.0 | 0.4 | REACTOME_ELONGATION_ARREST_AND_RECOVERY | Genes involved in Elongation arrest and recovery |
| 0.0 | 0.7 | REACTOME_REGULATORY_RNA_PATHWAYS | Genes involved in Regulatory RNA pathways |
| 0.0 | 1.4 | REACTOME_LOSS_OF_NLP_FROM_MITOTIC_CENTROSOMES | Genes involved in Loss of Nlp from mitotic centrosomes |
| 0.0 | 0.5 | REACTOME_OTHER_SEMAPHORIN_INTERACTIONS | Genes involved in Other semaphorin interactions |
| 0.0 | 0.7 | REACTOME_POST_TRANSLATIONAL_MODIFICATION_SYNTHESIS_OF_GPI_ANCHORED_PROTEINS | Genes involved in Post-translational modification: synthesis of GPI-anchored proteins |
| 0.0 | 0.7 | REACTOME_SYNTHESIS_OF_PA | Genes involved in Synthesis of PA |
| 0.0 | 0.4 | REACTOME_CITRIC_ACID_CYCLE_TCA_CYCLE | Genes involved in Citric acid cycle (TCA cycle) |
| 0.0 | 0.7 | REACTOME_ACTIVATION_OF_CHAPERONE_GENES_BY_XBP1S | Genes involved in Activation of Chaperone Genes by XBP1(S) |
| 0.0 | 0.3 | REACTOME_EXTENSION_OF_TELOMERES | Genes involved in Extension of Telomeres |
| 0.0 | 0.4 | REACTOME_PTM_GAMMA_CARBOXYLATION_HYPUSINE_FORMATION_AND_ARYLSULFATASE_ACTIVATION | Genes involved in PTM: gamma carboxylation, hypusine formation and arylsulfatase activation |
| 0.0 | 0.4 | REACTOME_SYNTHESIS_AND_INTERCONVERSION_OF_NUCLEOTIDE_DI_AND_TRIPHOSPHATES | Genes involved in Synthesis and interconversion of nucleotide di- and triphosphates |
| 0.0 | 0.8 | REACTOME_NUCLEAR_RECEPTOR_TRANSCRIPTION_PATHWAY | Genes involved in Nuclear Receptor transcription pathway |
| 0.0 | 0.3 | REACTOME_ERK_MAPK_TARGETS | Genes involved in ERK/MAPK targets |