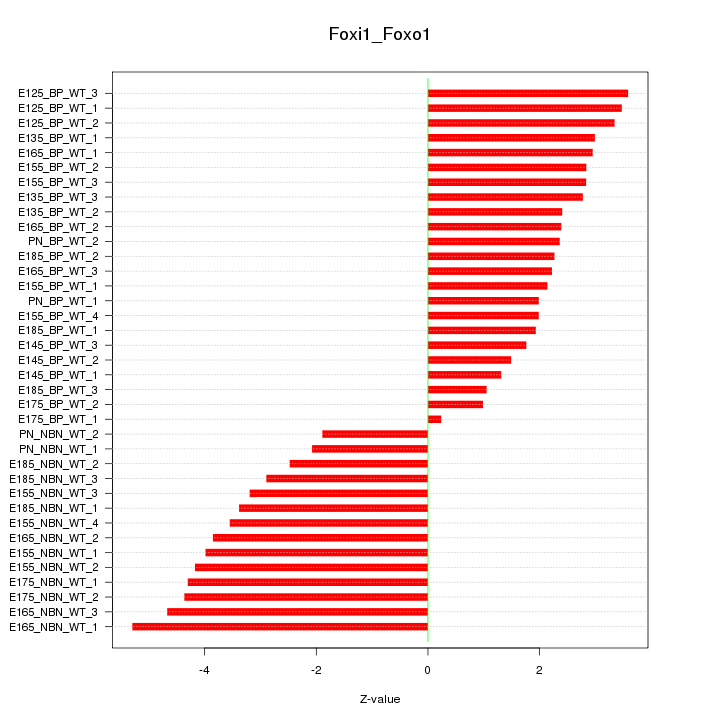
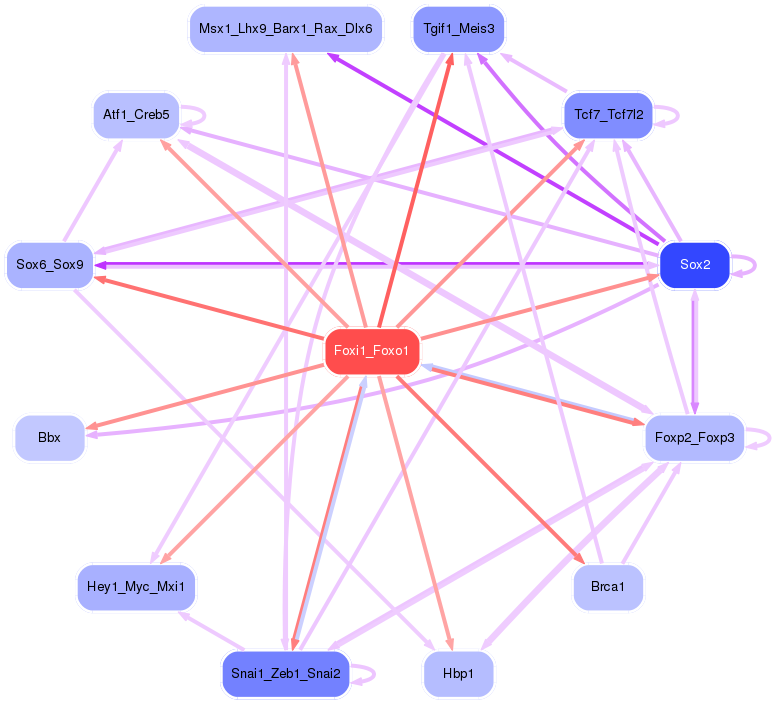
Motif ID: Foxi1_Foxo1
Z-value: 2.951
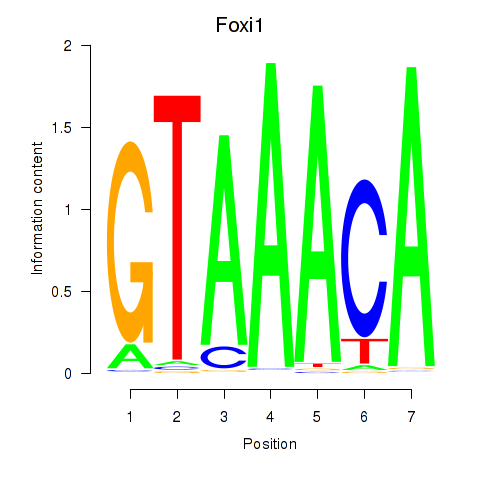
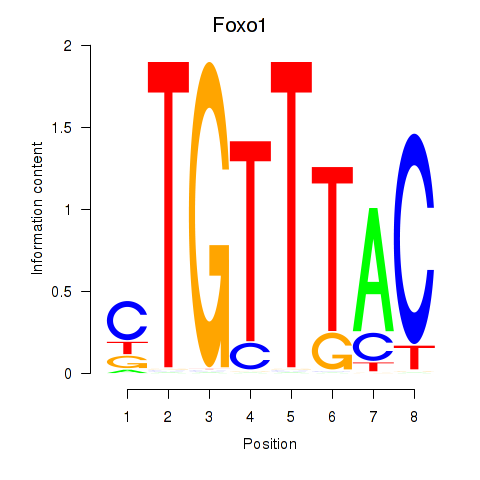
Transcription factors associated with Foxi1_Foxo1:
| Gene Symbol | Entrez ID | Gene Name |
|---|---|---|
| Foxi1 | ENSMUSG00000047861.2 | Foxi1 |
| Foxo1 | ENSMUSG00000044167.5 | Foxo1 |
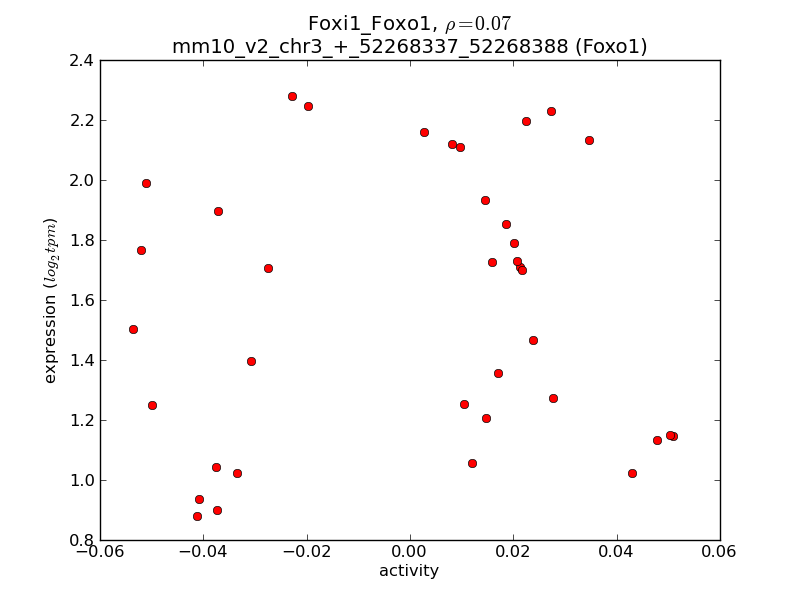
Activity-expression correlation:
| Gene Symbol | Promoter | Pearson corr. coef. | P-value | Plot |
|---|---|---|---|---|
| Foxo1 | mm10_v2_chr3_+_52268337_52268388 | 0.07 | 6.7e-01 | Click! |


Top targets:
Gene overrepresentation in biological_process category:
| Log-likelihood per target | Total log-likelihood | Term | Description |
|---|---|---|---|
| 8.7 | 52.4 | GO:0021797 | forebrain anterior/posterior pattern specification(GO:0021797) |
| 5.8 | 17.5 | GO:2000620 | positive regulation of histone H4-K16 acetylation(GO:2000620) |
| 5.5 | 11.1 | GO:1902263 | apoptotic process involved in embryonic digit morphogenesis(GO:1902263) |
| 4.8 | 14.5 | GO:0090425 | hepatocyte cell migration(GO:0002194) branching involved in pancreas morphogenesis(GO:0061114) acinar cell differentiation(GO:0090425) positive regulation of forebrain neuron differentiation(GO:2000979) |
| 4.8 | 52.9 | GO:0060539 | diaphragm development(GO:0060539) |
| 4.5 | 22.6 | GO:0030951 | establishment or maintenance of microtubule cytoskeleton polarity(GO:0030951) |
| 3.9 | 62.4 | GO:0048387 | negative regulation of retinoic acid receptor signaling pathway(GO:0048387) |
| 3.9 | 11.6 | GO:1902310 | positive regulation of peptidyl-serine dephosphorylation(GO:1902310) |
| 3.7 | 18.5 | GO:0015671 | oxygen transport(GO:0015671) |
| 3.6 | 10.9 | GO:0035574 | histone H4-K20 demethylation(GO:0035574) |
| 3.6 | 64.9 | GO:0051988 | regulation of attachment of spindle microtubules to kinetochore(GO:0051988) |
| 3.5 | 38.6 | GO:0007221 | positive regulation of transcription of Notch receptor target(GO:0007221) |
| 3.2 | 9.7 | GO:2000373 | regulation of DNA topoisomerase (ATP-hydrolyzing) activity(GO:2000371) positive regulation of DNA topoisomerase (ATP-hydrolyzing) activity(GO:2000373) |
| 3.2 | 13.0 | GO:0021698 | cerebellar cortex structural organization(GO:0021698) |
| 3.0 | 26.7 | GO:0010745 | negative regulation of macrophage derived foam cell differentiation(GO:0010745) |
| 2.9 | 14.6 | GO:0071699 | olfactory placode formation(GO:0030910) olfactory placode development(GO:0071698) olfactory placode morphogenesis(GO:0071699) |
| 2.8 | 14.0 | GO:0001561 | fatty acid alpha-oxidation(GO:0001561) |
| 2.7 | 8.0 | GO:0045658 | regulation of neutrophil differentiation(GO:0045658) negative regulation of neutrophil differentiation(GO:0045659) |
| 2.6 | 7.9 | GO:1904211 | membrane protein proteolysis involved in retrograde protein transport, ER to cytosol(GO:1904211) |
| 2.6 | 10.5 | GO:0035262 | gonad morphogenesis(GO:0035262) |
| 2.6 | 31.1 | GO:0060013 | righting reflex(GO:0060013) |
| 2.6 | 7.7 | GO:0045819 | plasmacytoid dendritic cell activation(GO:0002270) positive regulation of glycogen catabolic process(GO:0045819) |
| 2.5 | 12.4 | GO:0042891 | antibiotic transport(GO:0042891) dipeptide transport(GO:0042938) |
| 2.4 | 26.9 | GO:2000741 | positive regulation of mesenchymal stem cell differentiation(GO:2000741) |
| 2.4 | 14.6 | GO:0072513 | positive regulation of secondary heart field cardioblast proliferation(GO:0072513) |
| 2.4 | 31.1 | GO:0006977 | DNA damage response, signal transduction by p53 class mediator resulting in cell cycle arrest(GO:0006977) |
| 2.4 | 26.0 | GO:0048934 | peripheral nervous system neuron differentiation(GO:0048934) peripheral nervous system neuron development(GO:0048935) |
| 2.3 | 4.6 | GO:0072076 | nephrogenic mesenchyme development(GO:0072076) |
| 2.3 | 6.9 | GO:0051754 | meiotic sister chromatid cohesion, centromeric(GO:0051754) |
| 2.3 | 16.0 | GO:1903715 | regulation of aerobic respiration(GO:1903715) |
| 2.3 | 6.8 | GO:1900108 | negative regulation of nodal signaling pathway(GO:1900108) |
| 2.2 | 8.9 | GO:0000415 | negative regulation of histone H3-K36 methylation(GO:0000415) |
| 2.2 | 33.1 | GO:0035970 | peptidyl-threonine dephosphorylation(GO:0035970) |
| 2.1 | 17.0 | GO:0048625 | myoblast fate commitment(GO:0048625) |
| 2.1 | 8.3 | GO:0060838 | lymphatic endothelial cell fate commitment(GO:0060838) |
| 2.0 | 4.0 | GO:0045085 | negative regulation of interleukin-2 biosynthetic process(GO:0045085) |
| 2.0 | 6.0 | GO:0042320 | regulation of circadian sleep/wake cycle, REM sleep(GO:0042320) circadian sleep/wake cycle, REM sleep(GO:0042747) positive regulation of circadian sleep/wake cycle, sleep(GO:0045938) |
| 1.9 | 17.4 | GO:0070236 | negative regulation of activation-induced cell death of T cells(GO:0070236) |
| 1.9 | 3.8 | GO:0045409 | negative regulation of interleukin-6 biosynthetic process(GO:0045409) |
| 1.9 | 5.7 | GO:2000158 | positive regulation of ubiquitin-specific protease activity(GO:2000158) |
| 1.9 | 15.1 | GO:0015074 | DNA integration(GO:0015074) |
| 1.8 | 3.6 | GO:0002069 | columnar/cuboidal epithelial cell maturation(GO:0002069) |
| 1.7 | 5.2 | GO:0002191 | cap-dependent translational initiation(GO:0002191) |
| 1.7 | 10.0 | GO:0036089 | cleavage furrow formation(GO:0036089) |
| 1.7 | 1.7 | GO:1905066 | regulation of canonical Wnt signaling pathway involved in cardiac muscle cell fate commitment(GO:1901295) positive regulation of heart induction(GO:1901321) regulation of canonical Wnt signaling pathway involved in heart development(GO:1905066) |
| 1.6 | 6.5 | GO:0060032 | notochord regression(GO:0060032) |
| 1.6 | 1.6 | GO:0002643 | regulation of tolerance induction(GO:0002643) |
| 1.6 | 4.8 | GO:0036388 | pre-replicative complex assembly involved in nuclear cell cycle DNA replication(GO:0006267) pre-replicative complex assembly(GO:0036388) DNA replication preinitiation complex assembly(GO:0071163) pre-replicative complex assembly involved in cell cycle DNA replication(GO:1902299) |
| 1.6 | 17.2 | GO:0045602 | negative regulation of endothelial cell differentiation(GO:0045602) |
| 1.5 | 1.5 | GO:0032275 | luteinizing hormone secretion(GO:0032275) |
| 1.5 | 7.7 | GO:0034441 | plasma lipoprotein particle oxidation(GO:0034441) |
| 1.5 | 4.5 | GO:0038027 | apolipoprotein A-I-mediated signaling pathway(GO:0038027) |
| 1.5 | 7.5 | GO:0060836 | lymphatic endothelial cell differentiation(GO:0060836) |
| 1.5 | 4.5 | GO:0021691 | cerebellar Purkinje cell layer maturation(GO:0021691) |
| 1.5 | 4.5 | GO:0006553 | lysine metabolic process(GO:0006553) |
| 1.5 | 4.4 | GO:0045004 | DNA replication proofreading(GO:0045004) |
| 1.5 | 4.4 | GO:0032696 | negative regulation of interleukin-13 production(GO:0032696) trachea submucosa development(GO:0061152) trachea gland development(GO:0061153) odontoblast differentiation(GO:0071895) regulation of estrogen receptor binding(GO:0071898) negative regulation of estrogen receptor binding(GO:0071899) |
| 1.5 | 4.4 | GO:1903070 | negative regulation of ER-associated ubiquitin-dependent protein catabolic process(GO:1903070) |
| 1.4 | 4.3 | GO:0044028 | DNA hypomethylation(GO:0044028) hypomethylation of CpG island(GO:0044029) |
| 1.4 | 13.0 | GO:1900169 | regulation of glucocorticoid mediated signaling pathway(GO:1900169) |
| 1.3 | 1.3 | GO:0072431 | signal transduction involved in mitotic G1 DNA damage checkpoint(GO:0072431) intracellular signal transduction involved in G1 DNA damage checkpoint(GO:1902400) |
| 1.3 | 10.6 | GO:0035726 | common myeloid progenitor cell proliferation(GO:0035726) |
| 1.3 | 11.7 | GO:0046602 | regulation of mitotic centrosome separation(GO:0046602) |
| 1.3 | 12.5 | GO:0002315 | marginal zone B cell differentiation(GO:0002315) |
| 1.3 | 8.8 | GO:0034770 | histone H4-K20 methylation(GO:0034770) |
| 1.2 | 7.5 | GO:0003383 | apical constriction(GO:0003383) |
| 1.2 | 11.1 | GO:0098700 | neurotransmitter loading into synaptic vesicle(GO:0098700) |
| 1.2 | 3.7 | GO:1903225 | negative regulation of endodermal cell differentiation(GO:1903225) |
| 1.2 | 3.7 | GO:0042908 | xenobiotic transport(GO:0042908) |
| 1.2 | 4.8 | GO:0002667 | lymphocyte anergy(GO:0002249) regulation of T cell anergy(GO:0002667) T cell anergy(GO:0002870) regulation of lymphocyte anergy(GO:0002911) |
| 1.2 | 4.7 | GO:0071105 | response to interleukin-9(GO:0071104) response to interleukin-11(GO:0071105) |
| 1.2 | 25.9 | GO:0051482 | positive regulation of cytosolic calcium ion concentration involved in phospholipase C-activating G-protein coupled signaling pathway(GO:0051482) |
| 1.2 | 21.2 | GO:0040034 | regulation of development, heterochronic(GO:0040034) |
| 1.2 | 1.2 | GO:0060681 | branch elongation involved in ureteric bud branching(GO:0060681) |
| 1.1 | 19.2 | GO:0070102 | interleukin-6-mediated signaling pathway(GO:0070102) |
| 1.1 | 5.6 | GO:2000271 | positive regulation of fibroblast apoptotic process(GO:2000271) |
| 1.1 | 3.3 | GO:0060382 | regulation of DNA strand elongation(GO:0060382) |
| 1.1 | 3.3 | GO:1904879 | positive regulation of calcium ion transmembrane transport via high voltage-gated calcium channel(GO:1904879) |
| 1.1 | 8.7 | GO:0070317 | negative regulation of G0 to G1 transition(GO:0070317) |
| 1.1 | 2.1 | GO:0035934 | corticosterone secretion(GO:0035934) regulation of corticosterone secretion(GO:2000852) |
| 1.1 | 10.6 | GO:0042095 | interferon-gamma biosynthetic process(GO:0042095) |
| 1.0 | 3.1 | GO:0097350 | neutrophil clearance(GO:0097350) |
| 1.0 | 8.4 | GO:0072615 | interleukin-17 secretion(GO:0072615) |
| 1.0 | 5.2 | GO:0046501 | protoporphyrinogen IX metabolic process(GO:0046501) |
| 1.0 | 1.0 | GO:0044830 | modulation by host of viral RNA genome replication(GO:0044830) |
| 1.0 | 3.1 | GO:0044778 | meiotic DNA integrity checkpoint(GO:0044778) |
| 1.0 | 6.9 | GO:0010032 | meiotic chromosome condensation(GO:0010032) |
| 1.0 | 2.9 | GO:0015938 | coenzyme A catabolic process(GO:0015938) nucleoside bisphosphate catabolic process(GO:0033869) ribonucleoside bisphosphate catabolic process(GO:0034031) purine nucleoside bisphosphate catabolic process(GO:0034034) acetyl-CoA catabolic process(GO:0046356) |
| 1.0 | 2.9 | GO:0090327 | negative regulation of locomotion involved in locomotory behavior(GO:0090327) |
| 1.0 | 13.4 | GO:0051451 | myoblast migration(GO:0051451) |
| 0.9 | 4.7 | GO:0071557 | histone H3-K27 demethylation(GO:0071557) |
| 0.9 | 5.5 | GO:0070345 | negative regulation of fat cell proliferation(GO:0070345) |
| 0.9 | 2.8 | GO:0071649 | negative regulation of acute inflammatory response to antigenic stimulus(GO:0002865) regulation of adenylate cyclase activity involved in G-protein coupled receptor signaling pathway(GO:0010578) positive regulation of adenylate cyclase activity involved in G-protein coupled receptor signaling pathway(GO:0010579) regulation of chemokine (C-C motif) ligand 5 production(GO:0071649) positive regulation of somatostatin secretion(GO:0090274) |
| 0.9 | 2.8 | GO:0021546 | rhombomere development(GO:0021546) |
| 0.9 | 15.5 | GO:0008608 | attachment of spindle microtubules to kinetochore(GO:0008608) |
| 0.9 | 1.8 | GO:0001661 | conditioned taste aversion(GO:0001661) |
| 0.9 | 4.5 | GO:0035022 | positive regulation of Rac protein signal transduction(GO:0035022) |
| 0.9 | 10.7 | GO:0051574 | positive regulation of histone H3-K9 methylation(GO:0051574) |
| 0.9 | 9.7 | GO:0021796 | cerebral cortex regionalization(GO:0021796) |
| 0.9 | 6.1 | GO:0030174 | regulation of DNA-dependent DNA replication initiation(GO:0030174) |
| 0.9 | 1.7 | GO:0006566 | threonine metabolic process(GO:0006566) |
| 0.9 | 2.6 | GO:2000096 | regulation of Wnt signaling pathway, planar cell polarity pathway(GO:2000095) positive regulation of Wnt signaling pathway, planar cell polarity pathway(GO:2000096) |
| 0.9 | 3.4 | GO:0060316 | positive regulation of ryanodine-sensitive calcium-release channel activity(GO:0060316) |
| 0.8 | 5.0 | GO:0034080 | CENP-A containing nucleosome assembly(GO:0034080) CENP-A containing chromatin organization(GO:0061641) |
| 0.8 | 14.1 | GO:2001224 | positive regulation of neuron migration(GO:2001224) |
| 0.8 | 3.3 | GO:0006014 | D-ribose metabolic process(GO:0006014) |
| 0.8 | 3.3 | GO:0043490 | malate-aspartate shuttle(GO:0043490) |
| 0.8 | 4.1 | GO:0072530 | purine-containing compound transmembrane transport(GO:0072530) |
| 0.8 | 11.3 | GO:0072189 | ureter development(GO:0072189) |
| 0.8 | 4.0 | GO:0000237 | leptotene(GO:0000237) |
| 0.8 | 24.7 | GO:0042462 | eye photoreceptor cell development(GO:0042462) |
| 0.8 | 0.8 | GO:0002385 | organ or tissue specific immune response(GO:0002251) mucosal immune response(GO:0002385) |
| 0.8 | 3.2 | GO:0070125 | mitochondrial translational elongation(GO:0070125) |
| 0.8 | 2.3 | GO:0046340 | diacylglycerol catabolic process(GO:0046340) |
| 0.8 | 6.2 | GO:0002318 | myeloid progenitor cell differentiation(GO:0002318) |
| 0.8 | 0.8 | GO:0035482 | gastric motility(GO:0035482) gastric emptying(GO:0035483) |
| 0.8 | 3.1 | GO:2000324 | positive regulation of glucocorticoid receptor signaling pathway(GO:2000324) |
| 0.8 | 3.1 | GO:0006545 | glycine biosynthetic process(GO:0006545) |
| 0.8 | 5.3 | GO:0035948 | positive regulation of gluconeogenesis by positive regulation of transcription from RNA polymerase II promoter(GO:0035948) regulation of cellular ketone metabolic process by positive regulation of transcription from RNA polymerase II promoter(GO:0072366) |
| 0.7 | 6.7 | GO:0071763 | nuclear membrane organization(GO:0071763) |
| 0.7 | 2.2 | GO:0006030 | chitin metabolic process(GO:0006030) chitin catabolic process(GO:0006032) |
| 0.7 | 2.2 | GO:1902730 | positive regulation of proteoglycan biosynthetic process(GO:1902730) |
| 0.7 | 2.2 | GO:0031990 | RNA import into nucleus(GO:0006404) mRNA export from nucleus in response to heat stress(GO:0031990) |
| 0.7 | 3.6 | GO:0036151 | phosphatidylcholine acyl-chain remodeling(GO:0036151) |
| 0.7 | 2.9 | GO:0030043 | actin filament fragmentation(GO:0030043) |
| 0.7 | 2.1 | GO:0000821 | regulation of arginine metabolic process(GO:0000821) |
| 0.7 | 2.1 | GO:1904719 | excitatory chemical synaptic transmission(GO:0098976) positive regulation of AMPA glutamate receptor clustering(GO:1904719) |
| 0.7 | 7.1 | GO:0060179 | male mating behavior(GO:0060179) |
| 0.7 | 2.8 | GO:0055071 | cellular manganese ion homeostasis(GO:0030026) Golgi calcium ion homeostasis(GO:0032468) manganese ion homeostasis(GO:0055071) |
| 0.7 | 6.2 | GO:0070874 | negative regulation of glycogen biosynthetic process(GO:0045719) negative regulation of glycogen metabolic process(GO:0070874) |
| 0.7 | 1.4 | GO:0018076 | N-terminal peptidyl-lysine acetylation(GO:0018076) |
| 0.7 | 2.0 | GO:1903722 | regulation of centriole elongation(GO:1903722) |
| 0.7 | 2.0 | GO:0042905 | 9-cis-retinoic acid biosynthetic process(GO:0042904) 9-cis-retinoic acid metabolic process(GO:0042905) |
| 0.7 | 4.7 | GO:0019254 | carnitine metabolic process, CoA-linked(GO:0019254) |
| 0.7 | 24.4 | GO:0003301 | physiological muscle hypertrophy(GO:0003298) physiological cardiac muscle hypertrophy(GO:0003301) cell growth involved in cardiac muscle cell development(GO:0061049) |
| 0.6 | 5.2 | GO:1901386 | negative regulation of voltage-gated calcium channel activity(GO:1901386) |
| 0.6 | 3.2 | GO:0072429 | response to intra-S DNA damage checkpoint signaling(GO:0072429) |
| 0.6 | 5.1 | GO:0060235 | lens induction in camera-type eye(GO:0060235) |
| 0.6 | 12.8 | GO:0045780 | positive regulation of bone resorption(GO:0045780) positive regulation of bone remodeling(GO:0046852) |
| 0.6 | 2.5 | GO:1903003 | positive regulation of protein deubiquitination(GO:1903003) |
| 0.6 | 3.1 | GO:0035469 | determination of pancreatic left/right asymmetry(GO:0035469) |
| 0.6 | 1.2 | GO:0090118 | receptor-mediated endocytosis of low-density lipoprotein particle involved in cholesterol transport(GO:0090118) |
| 0.6 | 7.3 | GO:0001675 | acrosome assembly(GO:0001675) |
| 0.6 | 14.6 | GO:1904355 | positive regulation of telomere capping(GO:1904355) |
| 0.6 | 8.5 | GO:0060159 | regulation of dopamine receptor signaling pathway(GO:0060159) |
| 0.6 | 1.8 | GO:2000642 | negative regulation of early endosome to late endosome transport(GO:2000642) |
| 0.6 | 6.0 | GO:0051967 | negative regulation of synaptic transmission, glutamatergic(GO:0051967) |
| 0.6 | 16.6 | GO:0006270 | DNA replication initiation(GO:0006270) |
| 0.6 | 0.6 | GO:0090024 | negative regulation of granulocyte chemotaxis(GO:0071623) negative regulation of neutrophil chemotaxis(GO:0090024) |
| 0.6 | 2.4 | GO:0043973 | histone H3-K4 acetylation(GO:0043973) |
| 0.6 | 4.7 | GO:0033210 | leptin-mediated signaling pathway(GO:0033210) |
| 0.6 | 1.2 | GO:2000851 | positive regulation of cortisol secretion(GO:0051464) positive regulation of glucocorticoid secretion(GO:2000851) |
| 0.6 | 1.2 | GO:0016102 | retinoic acid biosynthetic process(GO:0002138) diterpenoid biosynthetic process(GO:0016102) terpenoid biosynthetic process(GO:0016114) |
| 0.6 | 6.3 | GO:0006228 | UTP biosynthetic process(GO:0006228) |
| 0.6 | 1.1 | GO:0071921 | establishment of sister chromatid cohesion(GO:0034085) cohesin loading(GO:0071921) regulation of cohesin loading(GO:0071922) |
| 0.6 | 0.6 | GO:1904173 | regulation of histone demethylase activity (H3-K4 specific)(GO:1904173) |
| 0.6 | 1.7 | GO:0045410 | positive regulation of interleukin-6 biosynthetic process(GO:0045410) |
| 0.6 | 2.2 | GO:0038163 | thrombopoietin-mediated signaling pathway(GO:0038163) |
| 0.6 | 9.9 | GO:0046069 | cGMP catabolic process(GO:0046069) |
| 0.5 | 3.3 | GO:2000270 | negative regulation of fibroblast apoptotic process(GO:2000270) |
| 0.5 | 2.1 | GO:0046719 | regulation of macrophage fusion(GO:0034239) regulation by virus of viral protein levels in host cell(GO:0046719) |
| 0.5 | 1.6 | GO:0032918 | polyamine acetylation(GO:0032917) spermidine acetylation(GO:0032918) |
| 0.5 | 1.1 | GO:1902071 | regulation of hypoxia-inducible factor-1alpha signaling pathway(GO:1902071) |
| 0.5 | 3.7 | GO:0070423 | nucleotide-binding oligomerization domain containing signaling pathway(GO:0070423) nucleotide-binding oligomerization domain containing 2 signaling pathway(GO:0070431) |
| 0.5 | 3.7 | GO:0015670 | carbon dioxide transport(GO:0015670) |
| 0.5 | 1.5 | GO:0072592 | oxygen metabolic process(GO:0072592) |
| 0.5 | 6.7 | GO:0090435 | protein localization to nuclear envelope(GO:0090435) |
| 0.5 | 3.0 | GO:0009235 | cobalamin metabolic process(GO:0009235) |
| 0.5 | 0.5 | GO:0070171 | negative regulation of tooth mineralization(GO:0070171) |
| 0.5 | 3.0 | GO:0034587 | piRNA metabolic process(GO:0034587) |
| 0.5 | 1.5 | GO:0006285 | base-excision repair, AP site formation(GO:0006285) |
| 0.5 | 1.4 | GO:0035937 | estrogen secretion(GO:0035937) estradiol secretion(GO:0035938) regulation of estrogen secretion(GO:2000861) regulation of estradiol secretion(GO:2000864) |
| 0.5 | 2.3 | GO:0051684 | maintenance of Golgi location(GO:0051684) |
| 0.5 | 24.2 | GO:0006940 | regulation of smooth muscle contraction(GO:0006940) |
| 0.5 | 10.5 | GO:0034508 | centromere complex assembly(GO:0034508) |
| 0.5 | 1.4 | GO:0060854 | patterning of lymph vessels(GO:0060854) |
| 0.4 | 4.5 | GO:0036158 | outer dynein arm assembly(GO:0036158) |
| 0.4 | 1.8 | GO:0070269 | pyroptosis(GO:0070269) |
| 0.4 | 6.7 | GO:0042407 | cristae formation(GO:0042407) |
| 0.4 | 1.8 | GO:2000675 | negative regulation of type B pancreatic cell apoptotic process(GO:2000675) |
| 0.4 | 0.9 | GO:0060741 | prostate gland stromal morphogenesis(GO:0060741) |
| 0.4 | 6.8 | GO:1901741 | positive regulation of myoblast fusion(GO:1901741) |
| 0.4 | 0.4 | GO:0007113 | endomitotic cell cycle(GO:0007113) |
| 0.4 | 0.8 | GO:0060596 | regulation of transcription from RNA polymerase II promoter involved in myocardial precursor cell differentiation(GO:0003256) mammary placode formation(GO:0060596) |
| 0.4 | 6.3 | GO:0038063 | collagen-activated tyrosine kinase receptor signaling pathway(GO:0038063) collagen-activated signaling pathway(GO:0038065) |
| 0.4 | 1.2 | GO:0000414 | regulation of histone H3-K36 methylation(GO:0000414) |
| 0.4 | 1.7 | GO:0006363 | termination of RNA polymerase I transcription(GO:0006363) |
| 0.4 | 1.2 | GO:0021998 | neural plate mediolateral regionalization(GO:0021998) mesoderm structural organization(GO:0048338) paraxial mesoderm structural organization(GO:0048352) regulation of cardiac ventricle development(GO:1904412) positive regulation of cardiac ventricle development(GO:1904414) |
| 0.4 | 1.2 | GO:0097274 | urea homeostasis(GO:0097274) |
| 0.4 | 0.8 | GO:0045349 | interferon-alpha biosynthetic process(GO:0045349) regulation of interferon-alpha biosynthetic process(GO:0045354) |
| 0.4 | 1.6 | GO:0046950 | cellular ketone body metabolic process(GO:0046950) |
| 0.4 | 2.0 | GO:0060051 | negative regulation of protein glycosylation(GO:0060051) |
| 0.4 | 1.6 | GO:0030091 | protein repair(GO:0030091) |
| 0.4 | 1.2 | GO:2000269 | regulation of fibroblast apoptotic process(GO:2000269) |
| 0.4 | 2.0 | GO:0008655 | pyrimidine-containing compound salvage(GO:0008655) pyrimidine nucleoside salvage(GO:0043097) |
| 0.4 | 2.4 | GO:0098734 | protein depalmitoylation(GO:0002084) negative regulation of Golgi to plasma membrane protein transport(GO:0042997) negative regulation of establishment of protein localization to plasma membrane(GO:0090005) macromolecule depalmitoylation(GO:0098734) |
| 0.4 | 1.6 | GO:0046909 | intermembrane transport(GO:0046909) protein transport from ciliary membrane to plasma membrane(GO:1903445) |
| 0.4 | 1.2 | GO:0006269 | DNA replication, synthesis of RNA primer(GO:0006269) |
| 0.4 | 1.2 | GO:0060392 | maintenance of gastrointestinal epithelium(GO:0030277) negative regulation of SMAD protein import into nucleus(GO:0060392) |
| 0.4 | 1.2 | GO:1903774 | positive regulation of viral budding via host ESCRT complex(GO:1903774) |
| 0.4 | 1.5 | GO:0070535 | histone H2A K63-linked ubiquitination(GO:0070535) |
| 0.4 | 2.3 | GO:0001821 | histamine secretion(GO:0001821) histamine production involved in inflammatory response(GO:0002349) histamine secretion involved in inflammatory response(GO:0002441) histamine secretion by mast cell(GO:0002553) |
| 0.4 | 1.1 | GO:0006546 | glycine catabolic process(GO:0006546) glycine decarboxylation via glycine cleavage system(GO:0019464) |
| 0.4 | 3.0 | GO:0071802 | negative regulation of podosome assembly(GO:0071802) |
| 0.4 | 2.6 | GO:0035372 | protein localization to microtubule(GO:0035372) |
| 0.4 | 11.8 | GO:0048025 | negative regulation of mRNA splicing, via spliceosome(GO:0048025) |
| 0.4 | 0.7 | GO:1900226 | negative regulation of NLRP3 inflammasome complex assembly(GO:1900226) |
| 0.4 | 5.1 | GO:0015937 | coenzyme A biosynthetic process(GO:0015937) |
| 0.4 | 4.3 | GO:0006767 | water-soluble vitamin metabolic process(GO:0006767) |
| 0.4 | 0.7 | GO:2001054 | negative regulation of mesenchymal cell apoptotic process(GO:2001054) |
| 0.4 | 1.1 | GO:0021759 | globus pallidus development(GO:0021759) |
| 0.4 | 14.2 | GO:0006284 | base-excision repair(GO:0006284) |
| 0.4 | 2.5 | GO:0000056 | ribosomal small subunit export from nucleus(GO:0000056) |
| 0.4 | 13.7 | GO:0030071 | regulation of mitotic metaphase/anaphase transition(GO:0030071) regulation of metaphase/anaphase transition of cell cycle(GO:1902099) |
| 0.4 | 2.1 | GO:0051461 | corticotropin secretion(GO:0051458) regulation of corticotropin secretion(GO:0051459) positive regulation of corticotropin secretion(GO:0051461) |
| 0.3 | 2.4 | GO:0019348 | dolichol metabolic process(GO:0019348) |
| 0.3 | 1.0 | GO:0071947 | protein deubiquitination involved in ubiquitin-dependent protein catabolic process(GO:0071947) |
| 0.3 | 1.0 | GO:0019343 | cysteine biosynthetic process via cystathionine(GO:0019343) cysteine biosynthetic process(GO:0019344) |
| 0.3 | 10.4 | GO:0034723 | DNA replication-dependent nucleosome assembly(GO:0006335) DNA replication-dependent nucleosome organization(GO:0034723) |
| 0.3 | 1.6 | GO:1902965 | regulation of protein localization to early endosome(GO:1902965) positive regulation of protein localization to early endosome(GO:1902966) |
| 0.3 | 3.5 | GO:0031572 | G2 DNA damage checkpoint(GO:0031572) |
| 0.3 | 2.5 | GO:0033564 | anterior/posterior axon guidance(GO:0033564) |
| 0.3 | 3.1 | GO:0009404 | toxin metabolic process(GO:0009404) |
| 0.3 | 3.3 | GO:0001672 | regulation of chromatin assembly or disassembly(GO:0001672) |
| 0.3 | 0.9 | GO:0045589 | regulation of regulatory T cell differentiation(GO:0045589) |
| 0.3 | 0.9 | GO:0006532 | aspartate biosynthetic process(GO:0006532) |
| 0.3 | 1.4 | GO:1990034 | calcium ion export from cell(GO:1990034) |
| 0.3 | 3.2 | GO:0009226 | nucleotide-sugar biosynthetic process(GO:0009226) |
| 0.3 | 1.1 | GO:0060666 | dichotomous subdivision of terminal units involved in salivary gland branching(GO:0060666) |
| 0.3 | 1.1 | GO:1900225 | NLRP3 inflammasome complex assembly(GO:0044546) regulation of NLRP3 inflammasome complex assembly(GO:1900225) |
| 0.3 | 1.4 | GO:0035405 | histone-threonine phosphorylation(GO:0035405) |
| 0.3 | 1.9 | GO:0072257 | metanephric nephron tubule epithelial cell differentiation(GO:0072257) regulation of metanephric nephron tubule epithelial cell differentiation(GO:0072307) |
| 0.3 | 1.6 | GO:0071294 | cellular response to zinc ion(GO:0071294) |
| 0.3 | 8.6 | GO:0043171 | peptide catabolic process(GO:0043171) |
| 0.3 | 5.1 | GO:0031297 | replication fork processing(GO:0031297) |
| 0.3 | 0.8 | GO:0030300 | regulation of intestinal cholesterol absorption(GO:0030300) negative regulation of intestinal absorption(GO:1904479) |
| 0.3 | 2.6 | GO:0031119 | tRNA pseudouridine synthesis(GO:0031119) |
| 0.3 | 1.3 | GO:0021914 | negative regulation of smoothened signaling pathway involved in ventral spinal cord patterning(GO:0021914) |
| 0.3 | 3.6 | GO:0048368 | lateral mesoderm development(GO:0048368) |
| 0.3 | 3.9 | GO:0046685 | response to arsenic-containing substance(GO:0046685) |
| 0.3 | 2.3 | GO:0090557 | establishment of endothelial intestinal barrier(GO:0090557) |
| 0.3 | 5.1 | GO:0010569 | regulation of double-strand break repair via homologous recombination(GO:0010569) |
| 0.3 | 1.5 | GO:1903300 | negative regulation of glucokinase activity(GO:0033132) negative regulation of hexokinase activity(GO:1903300) |
| 0.3 | 0.8 | GO:0009313 | oligosaccharide catabolic process(GO:0009313) |
| 0.3 | 1.8 | GO:0097475 | motor neuron migration(GO:0097475) |
| 0.3 | 1.3 | GO:2000973 | regulation of pro-B cell differentiation(GO:2000973) |
| 0.3 | 1.0 | GO:0014012 | peripheral nervous system axon regeneration(GO:0014012) |
| 0.2 | 4.0 | GO:0097034 | mitochondrial respiratory chain complex IV assembly(GO:0033617) mitochondrial respiratory chain complex IV biogenesis(GO:0097034) |
| 0.2 | 0.7 | GO:2000110 | negative regulation of macrophage apoptotic process(GO:2000110) |
| 0.2 | 0.7 | GO:0030210 | heparin biosynthetic process(GO:0030210) |
| 0.2 | 19.6 | GO:0043488 | regulation of mRNA stability(GO:0043488) |
| 0.2 | 3.1 | GO:0070508 | sterol import(GO:0035376) cholesterol import(GO:0070508) |
| 0.2 | 1.9 | GO:0019730 | antimicrobial humoral response(GO:0019730) |
| 0.2 | 1.4 | GO:2000790 | regulation of mesenchymal cell proliferation involved in lung development(GO:2000790) negative regulation of mesenchymal cell proliferation involved in lung development(GO:2000791) |
| 0.2 | 2.8 | GO:0007194 | negative regulation of adenylate cyclase activity(GO:0007194) |
| 0.2 | 4.9 | GO:0098869 | cellular oxidant detoxification(GO:0098869) |
| 0.2 | 0.7 | GO:0045654 | positive regulation of megakaryocyte differentiation(GO:0045654) |
| 0.2 | 1.8 | GO:0018344 | protein geranylgeranylation(GO:0018344) |
| 0.2 | 2.3 | GO:1901409 | positive regulation of phosphorylation of RNA polymerase II C-terminal domain(GO:1901409) |
| 0.2 | 0.7 | GO:0042117 | monocyte activation(GO:0042117) |
| 0.2 | 1.1 | GO:0060040 | retinal bipolar neuron differentiation(GO:0060040) |
| 0.2 | 1.1 | GO:2000623 | regulation of nuclear-transcribed mRNA catabolic process, nonsense-mediated decay(GO:2000622) negative regulation of nuclear-transcribed mRNA catabolic process, nonsense-mediated decay(GO:2000623) |
| 0.2 | 2.9 | GO:2000505 | regulation of energy homeostasis(GO:2000505) |
| 0.2 | 1.1 | GO:0018242 | protein O-linked glycosylation via serine(GO:0018242) |
| 0.2 | 1.3 | GO:0030718 | germ-line stem cell population maintenance(GO:0030718) |
| 0.2 | 0.9 | GO:0036297 | interstrand cross-link repair(GO:0036297) |
| 0.2 | 0.7 | GO:0035701 | hematopoietic stem cell migration(GO:0035701) |
| 0.2 | 1.5 | GO:0033148 | positive regulation of intracellular estrogen receptor signaling pathway(GO:0033148) |
| 0.2 | 3.7 | GO:0035855 | megakaryocyte development(GO:0035855) |
| 0.2 | 0.6 | GO:0061418 | regulation of transcription from RNA polymerase II promoter in response to hypoxia(GO:0061418) |
| 0.2 | 1.5 | GO:0000052 | citrulline metabolic process(GO:0000052) |
| 0.2 | 3.0 | GO:0035904 | aorta development(GO:0035904) |
| 0.2 | 1.9 | GO:0070933 | histone H4 deacetylation(GO:0070933) |
| 0.2 | 2.7 | GO:1990403 | embryonic brain development(GO:1990403) |
| 0.2 | 1.9 | GO:0006750 | glutathione biosynthetic process(GO:0006750) |
| 0.2 | 2.7 | GO:0050901 | leukocyte tethering or rolling(GO:0050901) |
| 0.2 | 1.0 | GO:0031642 | negative regulation of myelination(GO:0031642) |
| 0.2 | 0.4 | GO:0090343 | positive regulation of cell aging(GO:0090343) positive regulation of cellular senescence(GO:2000774) |
| 0.2 | 1.0 | GO:1903566 | positive regulation of protein localization to cilium(GO:1903566) |
| 0.2 | 0.6 | GO:0007084 | mitotic nuclear envelope reassembly(GO:0007084) |
| 0.2 | 0.6 | GO:0048209 | regulation of vesicle targeting, to, from or within Golgi(GO:0048209) |
| 0.2 | 1.0 | GO:1901525 | negative regulation of macromitophagy(GO:1901525) |
| 0.2 | 2.2 | GO:0032467 | positive regulation of cytokinesis(GO:0032467) |
| 0.2 | 1.0 | GO:0032485 | regulation of Ral protein signal transduction(GO:0032485) |
| 0.2 | 4.3 | GO:0014912 | negative regulation of smooth muscle cell migration(GO:0014912) |
| 0.2 | 4.4 | GO:1902857 | positive regulation of nonmotile primary cilium assembly(GO:1902857) |
| 0.2 | 2.7 | GO:0007379 | segment specification(GO:0007379) |
| 0.2 | 1.5 | GO:0008611 | ether lipid biosynthetic process(GO:0008611) glycerol ether biosynthetic process(GO:0046504) ether biosynthetic process(GO:1901503) |
| 0.2 | 0.6 | GO:0061739 | protein lipidation involved in autophagosome assembly(GO:0061739) |
| 0.2 | 1.9 | GO:0050860 | negative regulation of T cell receptor signaling pathway(GO:0050860) |
| 0.2 | 1.3 | GO:2000491 | positive regulation of hepatic stellate cell activation(GO:2000491) |
| 0.2 | 1.5 | GO:0046784 | viral mRNA export from host cell nucleus(GO:0046784) |
| 0.2 | 1.7 | GO:0006833 | water transport(GO:0006833) |
| 0.2 | 3.4 | GO:0030033 | microvillus assembly(GO:0030033) |
| 0.2 | 8.4 | GO:0000070 | mitotic sister chromatid segregation(GO:0000070) |
| 0.2 | 0.2 | GO:0045359 | positive regulation of interferon-beta biosynthetic process(GO:0045359) |
| 0.2 | 1.7 | GO:0032836 | glomerular basement membrane development(GO:0032836) |
| 0.2 | 6.6 | GO:0048791 | calcium ion-regulated exocytosis of neurotransmitter(GO:0048791) |
| 0.2 | 0.7 | GO:0051195 | negative regulation of glycolytic process(GO:0045820) negative regulation of cofactor metabolic process(GO:0051195) negative regulation of coenzyme metabolic process(GO:0051198) |
| 0.2 | 1.1 | GO:0060267 | positive regulation of respiratory burst(GO:0060267) |
| 0.2 | 1.8 | GO:0043144 | snoRNA processing(GO:0043144) |
| 0.2 | 2.0 | GO:0045624 | positive regulation of T-helper cell differentiation(GO:0045624) |
| 0.2 | 3.0 | GO:0042832 | response to protozoan(GO:0001562) defense response to protozoan(GO:0042832) |
| 0.2 | 15.3 | GO:0007052 | mitotic spindle organization(GO:0007052) |
| 0.2 | 0.7 | GO:0043415 | positive regulation of skeletal muscle tissue regeneration(GO:0043415) |
| 0.2 | 2.6 | GO:0045663 | positive regulation of myoblast differentiation(GO:0045663) |
| 0.2 | 1.0 | GO:0015879 | carnitine transport(GO:0015879) |
| 0.2 | 0.5 | GO:2000780 | negative regulation of DNA repair(GO:0045738) negative regulation of double-strand break repair(GO:2000780) |
| 0.2 | 0.7 | GO:0060800 | regulation of cell differentiation involved in embryonic placenta development(GO:0060800) |
| 0.2 | 0.2 | GO:0001787 | natural killer cell proliferation(GO:0001787) |
| 0.2 | 0.2 | GO:0003032 | detection of oxygen(GO:0003032) |
| 0.2 | 1.7 | GO:0048664 | neuron fate determination(GO:0048664) |
| 0.2 | 0.8 | GO:0006741 | NADP biosynthetic process(GO:0006741) |
| 0.2 | 0.8 | GO:0007032 | endosome organization(GO:0007032) |
| 0.2 | 3.0 | GO:0015693 | magnesium ion transport(GO:0015693) |
| 0.2 | 6.2 | GO:0050830 | defense response to Gram-positive bacterium(GO:0050830) |
| 0.2 | 0.2 | GO:1901407 | regulation of phosphorylation of RNA polymerase II C-terminal domain(GO:1901407) |
| 0.2 | 1.3 | GO:0018026 | peptidyl-lysine monomethylation(GO:0018026) |
| 0.2 | 0.8 | GO:1905150 | regulation of voltage-gated sodium channel activity(GO:1905150) |
| 0.2 | 0.8 | GO:0044130 | negative regulation of growth of symbiont in host(GO:0044130) negative regulation of growth of symbiont involved in interaction with host(GO:0044146) |
| 0.2 | 0.5 | GO:0001711 | endodermal cell fate commitment(GO:0001711) |
| 0.2 | 5.3 | GO:0015804 | neutral amino acid transport(GO:0015804) |
| 0.2 | 4.9 | GO:1902808 | positive regulation of cell cycle G1/S phase transition(GO:1902808) |
| 0.2 | 1.6 | GO:2000381 | negative regulation of mesoderm development(GO:2000381) |
| 0.2 | 2.7 | GO:0001779 | natural killer cell differentiation(GO:0001779) |
| 0.2 | 1.7 | GO:1990440 | positive regulation of transcription from RNA polymerase II promoter in response to endoplasmic reticulum stress(GO:1990440) |
| 0.2 | 4.6 | GO:0032728 | positive regulation of interferon-beta production(GO:0032728) |
| 0.2 | 0.6 | GO:0010510 | regulation of acetyl-CoA biosynthetic process from pyruvate(GO:0010510) |
| 0.2 | 3.2 | GO:0006303 | double-strand break repair via nonhomologous end joining(GO:0006303) |
| 0.2 | 0.5 | GO:0021933 | radial glia guided migration of cerebellar granule cell(GO:0021933) |
| 0.1 | 1.5 | GO:0010574 | regulation of vascular endothelial growth factor production(GO:0010574) |
| 0.1 | 0.7 | GO:0031860 | telomeric 3' overhang formation(GO:0031860) |
| 0.1 | 1.9 | GO:0001833 | inner cell mass cell proliferation(GO:0001833) |
| 0.1 | 1.0 | GO:0098535 | de novo centriole assembly(GO:0098535) |
| 0.1 | 1.6 | GO:1902187 | negative regulation of viral release from host cell(GO:1902187) |
| 0.1 | 3.8 | GO:2000134 | negative regulation of G1/S transition of mitotic cell cycle(GO:2000134) |
| 0.1 | 2.9 | GO:0003009 | skeletal muscle contraction(GO:0003009) |
| 0.1 | 8.9 | GO:0051289 | protein homotetramerization(GO:0051289) |
| 0.1 | 1.1 | GO:0006620 | posttranslational protein targeting to membrane(GO:0006620) |
| 0.1 | 2.2 | GO:0060307 | regulation of ventricular cardiac muscle cell membrane repolarization(GO:0060307) |
| 0.1 | 0.9 | GO:0000395 | mRNA 5'-splice site recognition(GO:0000395) |
| 0.1 | 0.5 | GO:1901165 | positive regulation of trophoblast cell migration(GO:1901165) |
| 0.1 | 0.7 | GO:2000255 | negative regulation of male germ cell proliferation(GO:2000255) |
| 0.1 | 0.3 | GO:0007197 | adenylate cyclase-inhibiting G-protein coupled acetylcholine receptor signaling pathway(GO:0007197) phospholipase C-activating G-protein coupled acetylcholine receptor signaling pathway(GO:0007207) |
| 0.1 | 1.8 | GO:1902043 | positive regulation of extrinsic apoptotic signaling pathway via death domain receptors(GO:1902043) |
| 0.1 | 1.5 | GO:0045899 | positive regulation of RNA polymerase II transcriptional preinitiation complex assembly(GO:0045899) |
| 0.1 | 0.5 | GO:0060406 | positive regulation of penile erection(GO:0060406) |
| 0.1 | 0.6 | GO:0006384 | transcription initiation from RNA polymerase III promoter(GO:0006384) |
| 0.1 | 1.0 | GO:0034975 | protein folding in endoplasmic reticulum(GO:0034975) |
| 0.1 | 1.0 | GO:0035520 | monoubiquitinated protein deubiquitination(GO:0035520) |
| 0.1 | 0.9 | GO:0070816 | phosphorylation of RNA polymerase II C-terminal domain(GO:0070816) |
| 0.1 | 0.4 | GO:1902527 | vesicle targeting, rough ER to cis-Golgi(GO:0048207) COPII vesicle coating(GO:0048208) positive regulation of protein monoubiquitination(GO:1902527) |
| 0.1 | 0.9 | GO:0009249 | protein lipoylation(GO:0009249) |
| 0.1 | 0.6 | GO:0006983 | ER overload response(GO:0006983) |
| 0.1 | 0.7 | GO:1990564 | protein polyufmylation(GO:1990564) protein K69-linked ufmylation(GO:1990592) |
| 0.1 | 2.4 | GO:0032436 | positive regulation of proteasomal ubiquitin-dependent protein catabolic process(GO:0032436) |
| 0.1 | 0.3 | GO:0051984 | positive regulation of chromosome segregation(GO:0051984) |
| 0.1 | 1.5 | GO:0048194 | Golgi vesicle budding(GO:0048194) |
| 0.1 | 1.6 | GO:0007608 | sensory perception of smell(GO:0007608) |
| 0.1 | 1.9 | GO:0048268 | clathrin coat assembly(GO:0048268) |
| 0.1 | 5.8 | GO:0045454 | cell redox homeostasis(GO:0045454) |
| 0.1 | 0.2 | GO:0090071 | negative regulation of ribosome biogenesis(GO:0090071) |
| 0.1 | 0.4 | GO:1904714 | chaperone-mediated autophagy(GO:0061684) regulation of chaperone-mediated autophagy(GO:1904714) negative regulation of chaperone-mediated autophagy(GO:1904715) |
| 0.1 | 0.1 | GO:0060017 | parathyroid gland development(GO:0060017) |
| 0.1 | 0.3 | GO:0019372 | lipoxygenase pathway(GO:0019372) |
| 0.1 | 1.4 | GO:0010758 | regulation of macrophage chemotaxis(GO:0010758) |
| 0.1 | 0.8 | GO:0030224 | monocyte differentiation(GO:0030224) |
| 0.1 | 0.5 | GO:0015788 | UDP-N-acetylglucosamine transport(GO:0015788) |
| 0.1 | 0.8 | GO:0009162 | deoxyribonucleoside monophosphate metabolic process(GO:0009162) |
| 0.1 | 1.3 | GO:0006851 | mitochondrial calcium ion transport(GO:0006851) |
| 0.1 | 0.5 | GO:1900095 | regulation of dosage compensation by inactivation of X chromosome(GO:1900095) |
| 0.1 | 1.1 | GO:0018206 | peptidyl-methionine modification(GO:0018206) |
| 0.1 | 0.3 | GO:0043174 | nucleoside salvage(GO:0043174) |
| 0.1 | 5.0 | GO:0006261 | DNA-dependent DNA replication(GO:0006261) |
| 0.1 | 0.4 | GO:0032693 | negative regulation of interleukin-10 production(GO:0032693) |
| 0.1 | 1.2 | GO:0060420 | regulation of heart growth(GO:0060420) |
| 0.1 | 0.2 | GO:0021940 | regulation of cerebellar granule cell precursor proliferation(GO:0021936) positive regulation of cerebellar granule cell precursor proliferation(GO:0021940) |
| 0.1 | 0.5 | GO:2000288 | positive regulation of myoblast proliferation(GO:2000288) |
| 0.1 | 1.1 | GO:0021702 | cerebellar Purkinje cell differentiation(GO:0021702) |
| 0.1 | 0.3 | GO:0002940 | tRNA N2-guanine methylation(GO:0002940) |
| 0.1 | 1.6 | GO:0006349 | regulation of gene expression by genetic imprinting(GO:0006349) |
| 0.1 | 1.4 | GO:0060841 | venous blood vessel development(GO:0060841) |
| 0.1 | 1.2 | GO:0043567 | regulation of insulin-like growth factor receptor signaling pathway(GO:0043567) |
| 0.1 | 1.0 | GO:0006120 | mitochondrial electron transport, NADH to ubiquinone(GO:0006120) |
| 0.1 | 1.2 | GO:0031498 | nucleosome disassembly(GO:0006337) chromatin disassembly(GO:0031498) |
| 0.1 | 0.4 | GO:1902592 | viral budding(GO:0046755) multi-organism organelle organization(GO:1902590) multi-organism membrane budding(GO:1902592) |
| 0.1 | 0.4 | GO:0032620 | interleukin-17 production(GO:0032620) |
| 0.1 | 0.7 | GO:0002377 | immunoglobulin production(GO:0002377) |
| 0.1 | 0.3 | GO:0070574 | cadmium ion transport(GO:0015691) cadmium ion transmembrane transport(GO:0070574) |
| 0.1 | 2.6 | GO:0000184 | nuclear-transcribed mRNA catabolic process, nonsense-mediated decay(GO:0000184) |
| 0.1 | 0.4 | GO:0032049 | cardiolipin biosynthetic process(GO:0032049) |
| 0.1 | 0.4 | GO:0015014 | heparan sulfate proteoglycan biosynthetic process, polysaccharide chain biosynthetic process(GO:0015014) |
| 0.1 | 2.8 | GO:0030901 | midbrain development(GO:0030901) |
| 0.1 | 1.8 | GO:0070584 | mitochondrion morphogenesis(GO:0070584) |
| 0.1 | 1.1 | GO:0044804 | nucleophagy(GO:0044804) |
| 0.1 | 0.4 | GO:0042182 | ketone catabolic process(GO:0042182) |
| 0.1 | 2.1 | GO:0043001 | Golgi to plasma membrane protein transport(GO:0043001) |
| 0.1 | 0.4 | GO:0048227 | plasma membrane to endosome transport(GO:0048227) |
| 0.1 | 1.0 | GO:0006471 | protein ADP-ribosylation(GO:0006471) |
| 0.1 | 0.5 | GO:0046085 | adenosine metabolic process(GO:0046085) |
| 0.1 | 1.5 | GO:0051225 | spindle assembly(GO:0051225) |
| 0.1 | 1.9 | GO:0045668 | negative regulation of osteoblast differentiation(GO:0045668) |
| 0.1 | 5.4 | GO:0022409 | positive regulation of cell-cell adhesion(GO:0022409) |
| 0.1 | 0.2 | GO:0040031 | snRNA pseudouridine synthesis(GO:0031120) snRNA modification(GO:0040031) |
| 0.1 | 0.2 | GO:1901052 | sarcosine metabolic process(GO:1901052) sarcosine catabolic process(GO:1901053) |
| 0.1 | 1.6 | GO:0000387 | spliceosomal snRNP assembly(GO:0000387) |
| 0.1 | 1.3 | GO:0061028 | establishment of endothelial barrier(GO:0061028) |
| 0.1 | 1.0 | GO:0002053 | positive regulation of mesenchymal cell proliferation(GO:0002053) |
| 0.1 | 2.1 | GO:0006891 | intra-Golgi vesicle-mediated transport(GO:0006891) |
| 0.1 | 0.4 | GO:0048873 | homeostasis of number of cells within a tissue(GO:0048873) |
| 0.1 | 0.6 | GO:0006516 | glycoprotein catabolic process(GO:0006516) |
| 0.1 | 0.5 | GO:0044458 | motile cilium assembly(GO:0044458) |
| 0.1 | 0.5 | GO:0036035 | osteoclast development(GO:0036035) |
| 0.1 | 4.1 | GO:0051028 | mRNA transport(GO:0051028) |
| 0.1 | 1.2 | GO:0000413 | protein peptidyl-prolyl isomerization(GO:0000413) |
| 0.0 | 0.9 | GO:2000279 | negative regulation of DNA biosynthetic process(GO:2000279) |
| 0.0 | 3.4 | GO:0042147 | retrograde transport, endosome to Golgi(GO:0042147) |
| 0.0 | 0.2 | GO:0071361 | cellular response to ethanol(GO:0071361) |
| 0.0 | 0.8 | GO:0006825 | copper ion transport(GO:0006825) |
| 0.0 | 0.5 | GO:0030326 | embryonic limb morphogenesis(GO:0030326) embryonic appendage morphogenesis(GO:0035113) |
| 0.0 | 0.4 | GO:0046477 | glycosylceramide catabolic process(GO:0046477) |
| 0.0 | 0.3 | GO:0043403 | skeletal muscle tissue regeneration(GO:0043403) |
| 0.0 | 1.1 | GO:0051084 | 'de novo' posttranslational protein folding(GO:0051084) |
| 0.0 | 1.0 | GO:0042491 | auditory receptor cell differentiation(GO:0042491) |
| 0.0 | 1.2 | GO:0035329 | hippo signaling(GO:0035329) |
| 0.0 | 0.1 | GO:0016093 | polyprenol metabolic process(GO:0016093) |
| 0.0 | 1.3 | GO:0045494 | photoreceptor cell maintenance(GO:0045494) |
| 0.0 | 0.2 | GO:0046415 | urate metabolic process(GO:0046415) |
| 0.0 | 0.3 | GO:0036506 | maintenance of unfolded protein(GO:0036506) maintenance of unfolded protein involved in ERAD pathway(GO:1904378) |
| 0.0 | 0.4 | GO:0007398 | ectoderm development(GO:0007398) |
| 0.0 | 0.1 | GO:0000733 | DNA strand renaturation(GO:0000733) |
| 0.0 | 2.2 | GO:0007601 | visual perception(GO:0007601) |
| 0.0 | 7.1 | GO:0000398 | RNA splicing, via transesterification reactions with bulged adenosine as nucleophile(GO:0000377) mRNA splicing, via spliceosome(GO:0000398) |
| 0.0 | 0.2 | GO:0009437 | carnitine metabolic process(GO:0009437) |
| 0.0 | 1.1 | GO:0071466 | cellular response to xenobiotic stimulus(GO:0071466) |
| 0.0 | 1.1 | GO:0031146 | SCF-dependent proteasomal ubiquitin-dependent protein catabolic process(GO:0031146) |
| 0.0 | 0.2 | GO:0010735 | positive regulation of transcription via serum response element binding(GO:0010735) |
| 0.0 | 0.1 | GO:0006001 | fructose catabolic process(GO:0006001) response to sucrose(GO:0009744) response to disaccharide(GO:0034285) fructose catabolic process to hydroxyacetone phosphate and glyceraldehyde-3-phosphate(GO:0061624) glycolytic process through fructose-1-phosphate(GO:0061625) |
| 0.0 | 1.3 | GO:0007286 | spermatid development(GO:0007286) |
| 0.0 | 0.5 | GO:0010719 | negative regulation of epithelial to mesenchymal transition(GO:0010719) |
| 0.0 | 0.5 | GO:0035455 | response to interferon-alpha(GO:0035455) |
| 0.0 | 0.2 | GO:0045721 | negative regulation of gluconeogenesis(GO:0045721) |
| 0.0 | 0.2 | GO:0010216 | maintenance of DNA methylation(GO:0010216) |
| 0.0 | 0.2 | GO:0034244 | negative regulation of transcription elongation from RNA polymerase II promoter(GO:0034244) |
| 0.0 | 0.4 | GO:0032460 | negative regulation of protein oligomerization(GO:0032460) negative regulation of protein homooligomerization(GO:0032463) |
| 0.0 | 0.4 | GO:0007250 | activation of NF-kappaB-inducing kinase activity(GO:0007250) |
| 0.0 | 0.2 | GO:1900029 | positive regulation of ruffle assembly(GO:1900029) |
| 0.0 | 1.1 | GO:0016197 | endosomal transport(GO:0016197) |
| 0.0 | 0.2 | GO:0023041 | neuronal signal transduction(GO:0023041) |
| 0.0 | 2.0 | GO:0000086 | G2/M transition of mitotic cell cycle(GO:0000086) |
| 0.0 | 0.2 | GO:0050868 | negative regulation of T cell activation(GO:0050868) negative regulation of leukocyte cell-cell adhesion(GO:1903038) |
| 0.0 | 0.2 | GO:0006122 | mitochondrial electron transport, ubiquinol to cytochrome c(GO:0006122) |
| 0.0 | 1.2 | GO:0016925 | protein sumoylation(GO:0016925) |
| 0.0 | 0.9 | GO:0045670 | regulation of osteoclast differentiation(GO:0045670) |
| 0.0 | 0.8 | GO:0006367 | transcription initiation from RNA polymerase II promoter(GO:0006367) |
| 0.0 | 0.9 | GO:0097031 | NADH dehydrogenase complex assembly(GO:0010257) mitochondrial respiratory chain complex I assembly(GO:0032981) mitochondrial respiratory chain complex I biogenesis(GO:0097031) |
| 0.0 | 0.7 | GO:0045880 | positive regulation of smoothened signaling pathway(GO:0045880) |
| 0.0 | 0.7 | GO:0002474 | antigen processing and presentation of peptide antigen via MHC class I(GO:0002474) |
| 0.0 | 0.1 | GO:0019886 | antigen processing and presentation of exogenous peptide antigen via MHC class II(GO:0019886) |
| 0.0 | 0.5 | GO:0021591 | ventricular system development(GO:0021591) |
| 0.0 | 1.4 | GO:0010923 | negative regulation of phosphatase activity(GO:0010923) |
| 0.0 | 0.6 | GO:0000470 | maturation of LSU-rRNA(GO:0000470) |
| 0.0 | 0.1 | GO:0010764 | negative regulation of fibroblast migration(GO:0010764) |
| 0.0 | 0.1 | GO:0021869 | forebrain ventricular zone progenitor cell division(GO:0021869) |
| 0.0 | 0.4 | GO:0046856 | phosphatidylinositol dephosphorylation(GO:0046856) |
| 0.0 | 0.8 | GO:0006506 | GPI anchor biosynthetic process(GO:0006506) |
| 0.0 | 0.2 | GO:0031954 | positive regulation of protein autophosphorylation(GO:0031954) |
| 0.0 | 0.2 | GO:0090110 | cargo loading into COPII-coated vesicle(GO:0090110) |
| 0.0 | 0.0 | GO:1900037 | regulation of cellular response to hypoxia(GO:1900037) |
| 0.0 | 1.1 | GO:0007605 | sensory perception of sound(GO:0007605) |
| 0.0 | 0.3 | GO:0070979 | protein K11-linked ubiquitination(GO:0070979) |
| 0.0 | 0.3 | GO:0050919 | negative chemotaxis(GO:0050919) |
| 0.0 | 0.2 | GO:0061462 | protein localization to lysosome(GO:0061462) |
| 0.0 | 0.3 | GO:0042742 | defense response to bacterium(GO:0042742) |
| 0.0 | 0.0 | GO:0031339 | negative regulation of vesicle fusion(GO:0031339) |
| 0.0 | 0.1 | GO:0060363 | cranial suture morphogenesis(GO:0060363) |
| 0.0 | 0.1 | GO:0033147 | negative regulation of intracellular estrogen receptor signaling pathway(GO:0033147) |
| 0.0 | 0.1 | GO:0060213 | positive regulation of mRNA 3'-end processing(GO:0031442) regulation of nuclear-transcribed mRNA poly(A) tail shortening(GO:0060211) positive regulation of nuclear-transcribed mRNA poly(A) tail shortening(GO:0060213) |
Gene overrepresentation in cellular_component category:
| Log-likelihood per target | Total log-likelihood | Term | Description |
|---|---|---|---|
| 12.5 | 62.4 | GO:0097149 | centralspindlin complex(GO:0097149) |
| 7.7 | 23.0 | GO:0070557 | PCNA-p21 complex(GO:0070557) |
| 4.7 | 28.1 | GO:0031262 | Ndc80 complex(GO:0031262) |
| 4.3 | 12.9 | GO:0097135 | cyclin E2-CDK2 complex(GO:0097135) |
| 4.0 | 36.0 | GO:0030478 | actin cap(GO:0030478) |
| 3.3 | 9.9 | GO:0000799 | nuclear condensin complex(GO:0000799) |
| 3.1 | 3.1 | GO:0070552 | BRISC complex(GO:0070552) |
| 3.0 | 17.7 | GO:0070531 | BRCA1-A complex(GO:0070531) |
| 2.1 | 2.1 | GO:0042585 | germinal vesicle(GO:0042585) |
| 2.1 | 6.3 | GO:0031680 | G-protein beta/gamma-subunit complex(GO:0031680) |
| 2.1 | 22.6 | GO:1990907 | beta-catenin-TCF complex(GO:1990907) |
| 2.0 | 10.0 | GO:0032133 | chromosome passenger complex(GO:0032133) |
| 1.9 | 7.7 | GO:0008623 | CHRAC(GO:0008623) |
| 1.7 | 5.1 | GO:0035101 | FACT complex(GO:0035101) |
| 1.7 | 5.0 | GO:0098835 | presynaptic endocytic zone(GO:0098833) presynaptic endocytic zone membrane(GO:0098835) |
| 1.6 | 13.0 | GO:0005833 | hemoglobin complex(GO:0005833) |
| 1.6 | 4.8 | GO:0036387 | nuclear pre-replicative complex(GO:0005656) pre-replicative complex(GO:0036387) |
| 1.4 | 4.3 | GO:0005943 | phosphatidylinositol 3-kinase complex, class IA(GO:0005943) |
| 1.4 | 9.8 | GO:0001940 | male pronucleus(GO:0001940) |
| 1.4 | 8.4 | GO:0000235 | astral microtubule(GO:0000235) |
| 1.3 | 5.3 | GO:0042105 | alpha-beta T cell receptor complex(GO:0042105) |
| 1.3 | 11.5 | GO:0036157 | outer dynein arm(GO:0036157) |
| 1.2 | 3.7 | GO:0001939 | female pronucleus(GO:0001939) |
| 1.2 | 8.4 | GO:0036195 | muscle cell projection(GO:0036194) muscle cell projection membrane(GO:0036195) |
| 1.1 | 9.5 | GO:0097197 | tetraspanin-enriched microdomain(GO:0097197) |
| 1.0 | 3.1 | GO:0005588 | collagen type V trimer(GO:0005588) |
| 1.0 | 6.0 | GO:0032983 | kainate selective glutamate receptor complex(GO:0032983) |
| 1.0 | 6.8 | GO:0000796 | condensin complex(GO:0000796) |
| 0.9 | 13.9 | GO:0042788 | polysomal ribosome(GO:0042788) |
| 0.9 | 3.6 | GO:0071148 | TEAD-1-YAP complex(GO:0071148) |
| 0.9 | 4.5 | GO:0008622 | epsilon DNA polymerase complex(GO:0008622) |
| 0.9 | 9.9 | GO:0097136 | Bcl-2 family protein complex(GO:0097136) |
| 0.8 | 8.3 | GO:0000940 | condensed chromosome outer kinetochore(GO:0000940) |
| 0.8 | 1.6 | GO:0001739 | sex chromatin(GO:0001739) |
| 0.8 | 21.8 | GO:0051233 | spindle midzone(GO:0051233) |
| 0.7 | 6.7 | GO:0061617 | MICOS complex(GO:0061617) |
| 0.7 | 2.9 | GO:0043564 | Ku70:Ku80 complex(GO:0043564) |
| 0.7 | 2.8 | GO:0044307 | dendritic branch(GO:0044307) |
| 0.7 | 1.3 | GO:0033010 | paranodal junction(GO:0033010) |
| 0.7 | 2.0 | GO:0005673 | transcription factor TFIIE complex(GO:0005673) |
| 0.6 | 3.2 | GO:0048476 | Holliday junction resolvase complex(GO:0048476) |
| 0.6 | 4.4 | GO:0070187 | telosome(GO:0070187) |
| 0.6 | 21.9 | GO:0035371 | microtubule plus-end(GO:0035371) |
| 0.6 | 1.8 | GO:0034657 | GID complex(GO:0034657) |
| 0.6 | 3.6 | GO:0042406 | extrinsic component of endoplasmic reticulum membrane(GO:0042406) |
| 0.6 | 7.6 | GO:0044322 | endoplasmic reticulum quality control compartment(GO:0044322) |
| 0.6 | 7.0 | GO:0002080 | acrosomal membrane(GO:0002080) |
| 0.6 | 7.5 | GO:0043219 | lateral loop(GO:0043219) |
| 0.5 | 3.3 | GO:1990454 | L-type voltage-gated calcium channel complex(GO:1990454) |
| 0.5 | 2.6 | GO:0005658 | alpha DNA polymerase:primase complex(GO:0005658) |
| 0.5 | 2.1 | GO:0017071 | intracellular cyclic nucleotide activated cation channel complex(GO:0017071) |
| 0.5 | 3.1 | GO:0030896 | checkpoint clamp complex(GO:0030896) |
| 0.5 | 1.5 | GO:0035861 | site of double-strand break(GO:0035861) |
| 0.5 | 2.5 | GO:0035189 | Rb-E2F complex(GO:0035189) |
| 0.5 | 2.4 | GO:0033553 | rDNA heterochromatin(GO:0033553) |
| 0.5 | 4.7 | GO:0036513 | Derlin-1 retrotranslocation complex(GO:0036513) |
| 0.5 | 2.3 | GO:0046581 | intercellular canaliculus(GO:0046581) |
| 0.5 | 2.3 | GO:0032777 | Piccolo NuA4 histone acetyltransferase complex(GO:0032777) |
| 0.4 | 1.8 | GO:0061702 | inflammasome complex(GO:0061702) |
| 0.4 | 10.7 | GO:0030285 | integral component of synaptic vesicle membrane(GO:0030285) intrinsic component of synaptic vesicle membrane(GO:0098563) |
| 0.4 | 26.5 | GO:0016459 | myosin complex(GO:0016459) |
| 0.4 | 7.7 | GO:0035102 | PRC1 complex(GO:0035102) |
| 0.4 | 11.5 | GO:0016363 | nuclear matrix(GO:0016363) |
| 0.4 | 3.0 | GO:0060293 | P granule(GO:0043186) pole plasm(GO:0045495) germ plasm(GO:0060293) |
| 0.4 | 1.2 | GO:0031533 | mRNA cap methyltransferase complex(GO:0031533) |
| 0.4 | 0.8 | GO:0044753 | amphisome(GO:0044753) |
| 0.4 | 5.2 | GO:0000164 | protein phosphatase type 1 complex(GO:0000164) |
| 0.4 | 3.0 | GO:0070419 | nonhomologous end joining complex(GO:0070419) |
| 0.4 | 1.1 | GO:0070939 | Dsl1p complex(GO:0070939) |
| 0.4 | 1.8 | GO:0005968 | Rab-protein geranylgeranyltransferase complex(GO:0005968) |
| 0.3 | 2.3 | GO:0070652 | HAUS complex(GO:0070652) |
| 0.3 | 19.5 | GO:0005844 | polysome(GO:0005844) |
| 0.3 | 1.9 | GO:0097504 | Gemini of coiled bodies(GO:0097504) |
| 0.3 | 1.6 | GO:0000798 | nuclear cohesin complex(GO:0000798) |
| 0.3 | 1.3 | GO:0071012 | catalytic step 1 spliceosome(GO:0071012) |
| 0.3 | 4.0 | GO:0097542 | ciliary tip(GO:0097542) |
| 0.3 | 1.2 | GO:0030121 | AP-1 adaptor complex(GO:0030121) |
| 0.3 | 7.3 | GO:0031305 | integral component of mitochondrial inner membrane(GO:0031305) |
| 0.3 | 13.3 | GO:0005876 | spindle microtubule(GO:0005876) |
| 0.3 | 22.2 | GO:0005902 | microvillus(GO:0005902) |
| 0.3 | 3.7 | GO:0031105 | septin complex(GO:0031105) |
| 0.3 | 3.7 | GO:0031209 | SCAR complex(GO:0031209) |
| 0.3 | 0.8 | GO:0001674 | female germ cell nucleus(GO:0001674) |
| 0.3 | 1.6 | GO:0070776 | H3 histone acetyltransferase complex(GO:0070775) MOZ/MORF histone acetyltransferase complex(GO:0070776) |
| 0.3 | 3.2 | GO:0061700 | GATOR2 complex(GO:0061700) |
| 0.3 | 3.1 | GO:0042581 | specific granule(GO:0042581) |
| 0.3 | 8.4 | GO:0000788 | nuclear nucleosome(GO:0000788) |
| 0.3 | 2.0 | GO:0090543 | Flemming body(GO:0090543) |
| 0.3 | 5.8 | GO:0030992 | intraciliary transport particle B(GO:0030992) |
| 0.2 | 2.5 | GO:0005642 | annulate lamellae(GO:0005642) |
| 0.2 | 0.7 | GO:0032156 | septin cytoskeleton(GO:0032156) |
| 0.2 | 3.5 | GO:0042405 | nuclear inclusion body(GO:0042405) |
| 0.2 | 26.2 | GO:0032993 | protein-DNA complex(GO:0032993) |
| 0.2 | 5.3 | GO:0005782 | peroxisomal matrix(GO:0005782) microbody lumen(GO:0031907) |
| 0.2 | 35.2 | GO:0044798 | nuclear transcription factor complex(GO:0044798) |
| 0.2 | 9.5 | GO:0000307 | cyclin-dependent protein kinase holoenzyme complex(GO:0000307) |
| 0.2 | 2.6 | GO:0042101 | T cell receptor complex(GO:0042101) |
| 0.2 | 2.6 | GO:0044666 | MLL3/4 complex(GO:0044666) |
| 0.2 | 3.0 | GO:0034362 | low-density lipoprotein particle(GO:0034362) |
| 0.2 | 1.3 | GO:0071141 | SMAD protein complex(GO:0071141) |
| 0.2 | 2.8 | GO:0043195 | terminal bouton(GO:0043195) |
| 0.2 | 0.8 | GO:0016589 | NURF complex(GO:0016589) |
| 0.2 | 1.0 | GO:0036454 | insulin-like growth factor binding protein complex(GO:0016942) growth factor complex(GO:0036454) |
| 0.2 | 2.1 | GO:0043240 | Fanconi anaemia nuclear complex(GO:0043240) |
| 0.2 | 1.7 | GO:0048188 | Set1C/COMPASS complex(GO:0048188) |
| 0.2 | 20.0 | GO:0000776 | kinetochore(GO:0000776) |
| 0.2 | 0.6 | GO:0097629 | extrinsic component of omegasome membrane(GO:0097629) |
| 0.2 | 18.2 | GO:0005814 | centriole(GO:0005814) |
| 0.2 | 2.5 | GO:0010369 | chromocenter(GO:0010369) |
| 0.2 | 2.9 | GO:0016580 | Sin3 complex(GO:0016580) |
| 0.2 | 1.7 | GO:0031595 | nuclear proteasome complex(GO:0031595) |
| 0.2 | 61.3 | GO:0016607 | nuclear speck(GO:0016607) |
| 0.2 | 3.6 | GO:0001891 | phagocytic cup(GO:0001891) |
| 0.2 | 3.6 | GO:0097038 | perinuclear endoplasmic reticulum(GO:0097038) |
| 0.2 | 3.2 | GO:0016327 | apicolateral plasma membrane(GO:0016327) |
| 0.2 | 1.9 | GO:0043596 | nuclear replication fork(GO:0043596) |
| 0.2 | 3.4 | GO:0033017 | sarcoplasmic reticulum membrane(GO:0033017) |
| 0.2 | 1.1 | GO:0031931 | TORC1 complex(GO:0031931) |
| 0.2 | 2.3 | GO:0030127 | COPII vesicle coat(GO:0030127) |
| 0.2 | 4.9 | GO:0001772 | immunological synapse(GO:0001772) |
| 0.2 | 9.5 | GO:0030864 | cortical actin cytoskeleton(GO:0030864) |
| 0.2 | 1.9 | GO:0000800 | lateral element(GO:0000800) |
| 0.2 | 0.5 | GO:0097233 | lamellar body membrane(GO:0097232) alveolar lamellar body membrane(GO:0097233) |
| 0.1 | 2.1 | GO:0005736 | DNA-directed RNA polymerase I complex(GO:0005736) |
| 0.1 | 0.8 | GO:0030914 | STAGA complex(GO:0030914) |
| 0.1 | 1.2 | GO:0000813 | ESCRT I complex(GO:0000813) |
| 0.1 | 1.3 | GO:0005641 | nuclear envelope lumen(GO:0005641) |
| 0.1 | 1.7 | GO:0034045 | pre-autophagosomal structure membrane(GO:0034045) |
| 0.1 | 0.9 | GO:0005655 | nucleolar ribonuclease P complex(GO:0005655) |
| 0.1 | 4.1 | GO:0005913 | cell-cell adherens junction(GO:0005913) |
| 0.1 | 0.7 | GO:0070545 | PeBoW complex(GO:0070545) |
| 0.1 | 1.3 | GO:0097225 | sperm midpiece(GO:0097225) |
| 0.1 | 1.8 | GO:0017119 | Golgi transport complex(GO:0017119) |
| 0.1 | 1.5 | GO:0035253 | ciliary rootlet(GO:0035253) |
| 0.1 | 4.7 | GO:0044298 | neuronal cell body membrane(GO:0032809) cell body membrane(GO:0044298) |
| 0.1 | 18.4 | GO:0005777 | peroxisome(GO:0005777) microbody(GO:0042579) |
| 0.1 | 1.7 | GO:0035631 | CD40 receptor complex(GO:0035631) |
| 0.1 | 0.6 | GO:0089701 | U2AF(GO:0089701) |
| 0.1 | 1.6 | GO:0001518 | voltage-gated sodium channel complex(GO:0001518) |
| 0.1 | 3.4 | GO:0014704 | intercalated disc(GO:0014704) |
| 0.1 | 1.1 | GO:0042571 | immunoglobulin complex, circulating(GO:0042571) |
| 0.1 | 1.3 | GO:0030061 | mitochondrial crista(GO:0030061) |
| 0.1 | 3.1 | GO:0005758 | mitochondrial intermembrane space(GO:0005758) |
| 0.1 | 1.6 | GO:0000407 | pre-autophagosomal structure(GO:0000407) |
| 0.1 | 0.7 | GO:0005964 | phosphorylase kinase complex(GO:0005964) |
| 0.1 | 1.7 | GO:0030687 | preribosome, large subunit precursor(GO:0030687) |
| 0.1 | 1.2 | GO:0043657 | host(GO:0018995) host cell part(GO:0033643) host cell(GO:0043657) other organism(GO:0044215) other organism cell(GO:0044216) other organism part(GO:0044217) |
| 0.1 | 2.2 | GO:0032420 | stereocilium(GO:0032420) |
| 0.1 | 0.9 | GO:0043194 | axon initial segment(GO:0043194) |
| 0.1 | 1.6 | GO:0005852 | eukaryotic translation initiation factor 3 complex(GO:0005852) |
| 0.1 | 3.0 | GO:0002102 | podosome(GO:0002102) |
| 0.1 | 0.9 | GO:0035145 | exon-exon junction complex(GO:0035145) |
| 0.1 | 1.3 | GO:0098858 | actin-based cell projection(GO:0098858) |
| 0.1 | 0.8 | GO:0098533 | ATPase dependent transmembrane transport complex(GO:0098533) |
| 0.1 | 14.1 | GO:0005681 | spliceosomal complex(GO:0005681) |
| 0.1 | 1.9 | GO:0005881 | cytoplasmic microtubule(GO:0005881) |
| 0.1 | 0.5 | GO:1990393 | 3M complex(GO:1990393) |
| 0.1 | 1.0 | GO:0032391 | photoreceptor connecting cilium(GO:0032391) |
| 0.1 | 0.5 | GO:0002177 | manchette(GO:0002177) |
| 0.1 | 2.7 | GO:0008023 | transcription elongation factor complex(GO:0008023) |
| 0.1 | 2.3 | GO:0035097 | histone methyltransferase complex(GO:0035097) |
| 0.1 | 3.5 | GO:0031519 | PcG protein complex(GO:0031519) |
| 0.1 | 154.5 | GO:0005654 | nucleoplasm(GO:0005654) |
| 0.1 | 1.0 | GO:0034663 | endoplasmic reticulum chaperone complex(GO:0034663) |
| 0.1 | 3.6 | GO:0001669 | acrosomal vesicle(GO:0001669) |
| 0.1 | 2.8 | GO:0043034 | costamere(GO:0043034) |
| 0.1 | 2.2 | GO:0035770 | ribonucleoprotein granule(GO:0035770) |
| 0.1 | 0.3 | GO:0031428 | box C/D snoRNP complex(GO:0031428) |
| 0.1 | 1.1 | GO:0008074 | guanylate cyclase complex, soluble(GO:0008074) |
| 0.1 | 0.9 | GO:0008250 | oligosaccharyltransferase complex(GO:0008250) |
| 0.1 | 1.6 | GO:0060077 | inhibitory synapse(GO:0060077) |
| 0.1 | 2.6 | GO:0000922 | spindle pole(GO:0000922) |
| 0.1 | 0.2 | GO:0072588 | box H/ACA snoRNP complex(GO:0031429) box H/ACA RNP complex(GO:0072588) |
| 0.1 | 0.2 | GO:0035032 | phosphatidylinositol 3-kinase complex, class III(GO:0035032) |
| 0.1 | 0.5 | GO:0044232 | organelle membrane contact site(GO:0044232) |
| 0.0 | 0.7 | GO:0005797 | Golgi medial cisterna(GO:0005797) |
| 0.0 | 0.2 | GO:0071986 | Ragulator complex(GO:0071986) |
| 0.0 | 1.2 | GO:0005871 | kinesin complex(GO:0005871) |
| 0.0 | 0.6 | GO:0001726 | ruffle(GO:0001726) |
| 0.0 | 0.2 | GO:0097342 | ripoptosome(GO:0097342) |
| 0.0 | 0.3 | GO:0044754 | autolysosome(GO:0044754) |
| 0.0 | 0.3 | GO:0000176 | nuclear exosome (RNase complex)(GO:0000176) |
| 0.0 | 0.0 | GO:0097422 | tubular endosome(GO:0097422) |
| 0.0 | 0.4 | GO:0042612 | MHC class I protein complex(GO:0042612) |
| 0.0 | 119.1 | GO:0005634 | nucleus(GO:0005634) |
| 0.0 | 0.2 | GO:0045275 | mitochondrial respiratory chain complex III(GO:0005750) respiratory chain complex III(GO:0045275) |
| 0.0 | 0.3 | GO:0001917 | photoreceptor inner segment(GO:0001917) |
| 0.0 | 9.4 | GO:0043025 | neuronal cell body(GO:0043025) |
| 0.0 | 0.5 | GO:0005793 | endoplasmic reticulum-Golgi intermediate compartment(GO:0005793) |
| 0.0 | 0.2 | GO:0070971 | endoplasmic reticulum exit site(GO:0070971) |
| 0.0 | 0.9 | GO:1990204 | oxidoreductase complex(GO:1990204) |
| 0.0 | 0.3 | GO:0030904 | retromer complex(GO:0030904) |
| 0.0 | 0.7 | GO:0000315 | organellar large ribosomal subunit(GO:0000315) mitochondrial large ribosomal subunit(GO:0005762) |
| 0.0 | 0.2 | GO:0032587 | ruffle membrane(GO:0032587) |
| 0.0 | 0.5 | GO:0030119 | AP-type membrane coat adaptor complex(GO:0030119) |
| 0.0 | 0.1 | GO:0032937 | SREBP-SCAP-Insig complex(GO:0032937) |
Gene overrepresentation in molecular_function category:
| Log-likelihood per target | Total log-likelihood | Term | Description |
|---|---|---|---|
| 8.1 | 24.4 | GO:0008330 | protein tyrosine/threonine phosphatase activity(GO:0008330) |
| 7.7 | 23.0 | GO:0019912 | cyclin-dependent protein kinase activating kinase activity(GO:0019912) |
| 4.1 | 12.4 | GO:0042936 | dipeptide transporter activity(GO:0042936) |
| 3.9 | 11.6 | GO:0004647 | phosphoserine phosphatase activity(GO:0004647) |
| 3.7 | 25.9 | GO:0070915 | lysophosphatidic acid receptor activity(GO:0070915) |
| 3.7 | 18.5 | GO:0005344 | oxygen transporter activity(GO:0005344) |
| 3.6 | 10.9 | GO:0035575 | histone demethylase activity (H4-K20 specific)(GO:0035575) |
| 2.9 | 14.4 | GO:0000405 | bubble DNA binding(GO:0000405) |
| 2.6 | 7.7 | GO:0000402 | open form four-way junction DNA binding(GO:0000401) crossed form four-way junction DNA binding(GO:0000402) |
| 2.5 | 9.9 | GO:0032422 | purine-rich negative regulatory element binding(GO:0032422) |
| 2.4 | 19.2 | GO:0050693 | LBD domain binding(GO:0050693) |
| 2.4 | 35.7 | GO:0044323 | retinoic acid-responsive element binding(GO:0044323) |
| 2.3 | 11.4 | GO:0035174 | histone serine kinase activity(GO:0035174) |
| 2.3 | 6.8 | GO:0016015 | morphogen activity(GO:0016015) |
| 2.1 | 8.2 | GO:0008142 | oxysterol binding(GO:0008142) |
| 1.9 | 13.0 | GO:0052650 | NADP-retinol dehydrogenase activity(GO:0052650) |
| 1.7 | 5.1 | GO:0016715 | oxidoreductase activity, acting on paired donors, with incorporation or reduction of molecular oxygen, reduced ascorbate as one donor, and incorporation of one atom of oxygen(GO:0016715) |
| 1.7 | 8.4 | GO:0004594 | pantothenate kinase activity(GO:0004594) |
| 1.6 | 9.7 | GO:0044547 | DNA topoisomerase binding(GO:0044547) |
| 1.5 | 4.5 | GO:0030226 | apolipoprotein receptor activity(GO:0030226) apolipoprotein A-I receptor activity(GO:0034188) phosphatidylserine-translocating ATPase activity(GO:0090556) |
| 1.5 | 10.6 | GO:0048101 | calmodulin-dependent cyclic-nucleotide phosphodiesterase activity(GO:0004117) calcium- and calmodulin-regulated 3',5'-cyclic-GMP phosphodiesterase activity(GO:0048101) |
| 1.5 | 4.4 | GO:0008310 | single-stranded DNA 3'-5' exodeoxyribonuclease activity(GO:0008310) |
| 1.4 | 5.7 | GO:0035800 | deubiquitinase activator activity(GO:0035800) |
| 1.4 | 13.6 | GO:0008474 | palmitoyl-(protein) hydrolase activity(GO:0008474) palmitoyl hydrolase activity(GO:0098599) |
| 1.3 | 22.6 | GO:0051010 | microtubule plus-end binding(GO:0051010) |
| 1.3 | 5.0 | GO:0016647 | oxidoreductase activity, acting on the CH-NH group of donors, oxygen as acceptor(GO:0016647) |
| 1.2 | 6.2 | GO:0004792 | thiosulfate sulfurtransferase activity(GO:0004792) |
| 1.2 | 23.0 | GO:0070410 | co-SMAD binding(GO:0070410) |
| 1.2 | 3.6 | GO:0030156 | benzodiazepine receptor binding(GO:0030156) |
| 1.2 | 4.8 | GO:0043515 | kinetochore binding(GO:0043515) |
| 1.2 | 3.6 | GO:0003953 | NAD+ nucleosidase activity(GO:0003953) |
| 1.2 | 21.4 | GO:0045295 | gamma-catenin binding(GO:0045295) |
| 1.2 | 4.7 | GO:0004092 | carnitine O-acetyltransferase activity(GO:0004092) |
| 1.2 | 3.5 | GO:0032052 | bile acid binding(GO:0032052) |
| 1.1 | 4.6 | GO:0038049 | glucocorticoid receptor activity(GO:0004883) transcription factor activity, ligand-activated RNA polymerase II transcription factor binding(GO:0038049) glucocorticoid-activated RNA polymerase II transcription factor binding transcription factor activity(GO:0038051) |
| 1.1 | 13.5 | GO:0070888 | E-box binding(GO:0070888) |
| 1.1 | 3.3 | GO:0005118 | sevenless binding(GO:0005118) |
| 1.1 | 3.3 | GO:1990955 | G-rich single-stranded DNA binding(GO:1990955) |
| 1.1 | 21.2 | GO:0030215 | semaphorin receptor binding(GO:0030215) |
| 1.0 | 3.1 | GO:0008732 | threonine aldolase activity(GO:0004793) L-allo-threonine aldolase activity(GO:0008732) |
| 1.0 | 4.0 | GO:0042134 | rRNA primary transcript binding(GO:0042134) |
| 1.0 | 6.0 | GO:0015277 | kainate selective glutamate receptor activity(GO:0015277) |
| 1.0 | 7.0 | GO:0015016 | [heparan sulfate]-glucosamine N-sulfotransferase activity(GO:0015016) |
| 1.0 | 9.0 | GO:0030976 | thiamine pyrophosphate binding(GO:0030976) |
| 1.0 | 2.9 | GO:0003986 | acetyl-CoA hydrolase activity(GO:0003986) |
| 0.9 | 29.3 | GO:0008574 | ATP-dependent microtubule motor activity, plus-end-directed(GO:0008574) |
| 0.9 | 4.7 | GO:0004165 | dodecenoyl-CoA delta-isomerase activity(GO:0004165) |
| 0.9 | 3.7 | GO:0033300 | dehydroascorbic acid transporter activity(GO:0033300) D-glucose transmembrane transporter activity(GO:0055056) |
| 0.9 | 10.0 | GO:0015250 | water channel activity(GO:0015250) |
| 0.9 | 3.6 | GO:0071558 | histone demethylase activity (H3-K27 specific)(GO:0071558) |
| 0.9 | 9.0 | GO:0047499 | calcium-independent phospholipase A2 activity(GO:0047499) |
| 0.9 | 3.6 | GO:0004921 | interleukin-11 receptor activity(GO:0004921) interleukin-11 binding(GO:0019970) |
| 0.9 | 7.1 | GO:0005095 | GTPase inhibitor activity(GO:0005095) |
| 0.9 | 1.7 | GO:0070905 | serine binding(GO:0070905) |
| 0.9 | 6.8 | GO:0046790 | virion binding(GO:0046790) |
| 0.8 | 3.3 | GO:0015183 | L-aspartate transmembrane transporter activity(GO:0015183) |
| 0.8 | 2.5 | GO:0043426 | MRF binding(GO:0043426) |
| 0.8 | 4.0 | GO:0042289 | MHC class II protein binding(GO:0042289) |
| 0.8 | 12.0 | GO:0016805 | dipeptidase activity(GO:0016805) |
| 0.8 | 15.9 | GO:0008266 | poly(U) RNA binding(GO:0008266) |
| 0.8 | 6.9 | GO:0008420 | CTD phosphatase activity(GO:0008420) |
| 0.8 | 25.0 | GO:0016538 | cyclin-dependent protein serine/threonine kinase regulator activity(GO:0016538) |
| 0.7 | 2.2 | GO:0004568 | chitinase activity(GO:0004568) |
| 0.7 | 2.2 | GO:0071987 | WD40-repeat domain binding(GO:0071987) |
| 0.7 | 7.3 | GO:0016634 | oxidoreductase activity, acting on the CH-CH group of donors, oxygen as acceptor(GO:0016634) |
| 0.7 | 126.7 | GO:0001078 | transcriptional repressor activity, RNA polymerase II core promoter proximal region sequence-specific binding(GO:0001078) |
| 0.7 | 4.3 | GO:0071074 | eukaryotic initiation factor eIF2 binding(GO:0071074) |
| 0.7 | 2.1 | GO:0004886 | 9-cis retinoic acid receptor activity(GO:0004886) |
| 0.7 | 2.1 | GO:0031779 | melanocortin receptor binding(GO:0031779) type 3 melanocortin receptor binding(GO:0031781) type 4 melanocortin receptor binding(GO:0031782) |
| 0.7 | 2.1 | GO:0044715 | 8-oxo-dGDP phosphatase activity(GO:0044715) |
| 0.7 | 6.3 | GO:0038062 | protein tyrosine kinase collagen receptor activity(GO:0038062) |
| 0.7 | 2.8 | GO:0015410 | manganese-transporting ATPase activity(GO:0015410) |
| 0.7 | 2.8 | GO:0098811 | transcriptional activator activity, RNA polymerase II transcription factor binding(GO:0001190) transcriptional repressor activity, RNA polymerase II activating transcription factor binding(GO:0098811) |
| 0.7 | 7.5 | GO:0048185 | activin binding(GO:0048185) |
| 0.6 | 12.3 | GO:0035198 | miRNA binding(GO:0035198) |
| 0.6 | 10.9 | GO:0015172 | L-glutamate transmembrane transporter activity(GO:0005313) acidic amino acid transmembrane transporter activity(GO:0015172) |
| 0.6 | 2.5 | GO:0097003 | adipokinetic hormone receptor activity(GO:0097003) |
| 0.6 | 2.4 | GO:0003976 | UDP-N-acetylglucosamine-lysosomal-enzyme N-acetylglucosaminephosphotransferase activity(GO:0003976) |
| 0.6 | 11.5 | GO:0001222 | transcription corepressor binding(GO:0001222) |
| 0.6 | 5.1 | GO:0005338 | nucleotide-sugar transmembrane transporter activity(GO:0005338) |
| 0.6 | 4.5 | GO:0031432 | titin binding(GO:0031432) |
| 0.6 | 4.5 | GO:0008821 | crossover junction endodeoxyribonuclease activity(GO:0008821) |
| 0.6 | 1.7 | GO:0048019 | receptor antagonist activity(GO:0048019) |
| 0.5 | 70.6 | GO:0017048 | Rho GTPase binding(GO:0017048) |
| 0.5 | 1.6 | GO:0030171 | voltage-gated proton channel activity(GO:0030171) |
| 0.5 | 4.9 | GO:0005540 | hyaluronic acid binding(GO:0005540) |
| 0.5 | 1.6 | GO:0004145 | diamine N-acetyltransferase activity(GO:0004145) |
| 0.5 | 2.1 | GO:0048408 | epidermal growth factor binding(GO:0048408) |
| 0.5 | 3.1 | GO:0033142 | progesterone receptor binding(GO:0033142) |
| 0.5 | 2.0 | GO:0004645 | phosphorylase activity(GO:0004645) |
| 0.5 | 5.8 | GO:0004089 | carbonate dehydratase activity(GO:0004089) |
| 0.5 | 1.9 | GO:0010484 | H3 histone acetyltransferase activity(GO:0010484) |
| 0.5 | 5.1 | GO:0031957 | fatty acid transporter activity(GO:0015245) very long-chain fatty acid-CoA ligase activity(GO:0031957) |
| 0.5 | 1.4 | GO:0001225 | RNA polymerase II transcription cofactor binding(GO:0001224) RNA polymerase II transcription coactivator binding(GO:0001225) |
| 0.4 | 1.3 | GO:0004677 | DNA-dependent protein kinase activity(GO:0004677) |
| 0.4 | 0.9 | GO:0061649 | ubiquitinated histone binding(GO:0061649) |
| 0.4 | 2.7 | GO:0001849 | complement component C1q binding(GO:0001849) |
| 0.4 | 1.3 | GO:0035500 | MH2 domain binding(GO:0035500) |
| 0.4 | 3.9 | GO:0070700 | BMP receptor binding(GO:0070700) |
| 0.4 | 0.4 | GO:0016922 | ligand-dependent nuclear receptor binding(GO:0016922) |
| 0.4 | 8.3 | GO:0048027 | mRNA 5'-UTR binding(GO:0048027) |
| 0.4 | 1.2 | GO:0071633 | dihydroceramidase activity(GO:0071633) |
| 0.4 | 5.7 | GO:0003688 | DNA replication origin binding(GO:0003688) |
| 0.4 | 7.0 | GO:0045505 | dynein intermediate chain binding(GO:0045505) |
| 0.4 | 2.5 | GO:0005042 | netrin receptor activity(GO:0005042) |
| 0.4 | 1.2 | GO:0004482 | mRNA (guanine-N7-)-methyltransferase activity(GO:0004482) |
| 0.4 | 1.6 | GO:0016833 | oxo-acid-lyase activity(GO:0016833) |
| 0.4 | 2.0 | GO:0016778 | diphosphotransferase activity(GO:0016778) |
| 0.4 | 2.0 | GO:0005052 | peroxisome matrix targeting signal-1 binding(GO:0005052) |
| 0.4 | 2.0 | GO:0004849 | uridine kinase activity(GO:0004849) |
| 0.4 | 9.8 | GO:0070840 | dynein complex binding(GO:0070840) |
| 0.4 | 1.2 | GO:0004966 | galanin receptor activity(GO:0004966) |
| 0.4 | 1.5 | GO:0000268 | peroxisome targeting sequence binding(GO:0000268) |
| 0.4 | 2.6 | GO:1901612 | phosphatidylglycerol binding(GO:1901611) cardiolipin binding(GO:1901612) |
| 0.4 | 11.1 | GO:1990841 | promoter-specific chromatin binding(GO:1990841) |
| 0.4 | 14.4 | GO:0001671 | ATPase activator activity(GO:0001671) |
| 0.4 | 4.8 | GO:0017017 | MAP kinase tyrosine/serine/threonine phosphatase activity(GO:0017017) |
| 0.4 | 1.5 | GO:0004844 | uracil DNA N-glycosylase activity(GO:0004844) deaminated base DNA N-glycosylase activity(GO:0097506) |
| 0.4 | 6.3 | GO:0071855 | neuropeptide receptor binding(GO:0071855) |
| 0.4 | 33.0 | GO:0003774 | motor activity(GO:0003774) |
| 0.4 | 2.2 | GO:0033743 | peptide-methionine (R)-S-oxide reductase activity(GO:0033743) |
| 0.4 | 4.0 | GO:0003691 | double-stranded telomeric DNA binding(GO:0003691) |
| 0.4 | 4.4 | GO:0032452 | histone demethylase activity(GO:0032452) |
| 0.4 | 1.4 | GO:0034647 | histone demethylase activity (H3-trimethyl-K4 specific)(GO:0034647) histone demethylase activity (H3-dimethyl-K4 specific)(GO:0034648) |
| 0.4 | 5.8 | GO:0055103 | ligase regulator activity(GO:0055103) ubiquitin-protein transferase regulator activity(GO:0055106) |
| 0.4 | 4.0 | GO:0008430 | selenium binding(GO:0008430) |
| 0.4 | 13.0 | GO:0017091 | AU-rich element binding(GO:0017091) |
| 0.4 | 6.7 | GO:0004435 | phosphatidylinositol phospholipase C activity(GO:0004435) |
| 0.4 | 1.1 | GO:0008392 | arachidonic acid epoxygenase activity(GO:0008392) |
| 0.3 | 35.1 | GO:0001158 | enhancer sequence-specific DNA binding(GO:0001158) |
| 0.3 | 1.0 | GO:0005124 | scavenger receptor binding(GO:0005124) |
| 0.3 | 2.0 | GO:0001758 | retinal dehydrogenase activity(GO:0001758) |
| 0.3 | 1.0 | GO:1904047 | S-adenosyl-L-methionine binding(GO:1904047) |
| 0.3 | 19.0 | GO:0003684 | damaged DNA binding(GO:0003684) |
| 0.3 | 2.0 | GO:0070728 | leucine binding(GO:0070728) |
| 0.3 | 1.3 | GO:0086038 | calcium:sodium antiporter activity involved in regulation of cardiac muscle cell membrane potential(GO:0086038) |
| 0.3 | 3.8 | GO:0043560 | insulin receptor substrate binding(GO:0043560) |
| 0.3 | 13.8 | GO:0005158 | insulin receptor binding(GO:0005158) |
| 0.3 | 2.2 | GO:0086006 | voltage-gated sodium channel activity involved in cardiac muscle cell action potential(GO:0086006) |
| 0.3 | 1.2 | GO:0016971 | flavin-linked sulfhydryl oxidase activity(GO:0016971) |
| 0.3 | 1.2 | GO:0008131 | primary amine oxidase activity(GO:0008131) |
| 0.3 | 3.6 | GO:0050897 | cobalt ion binding(GO:0050897) |
| 0.3 | 0.9 | GO:0017108 | 5'-flap endonuclease activity(GO:0017108) |
| 0.3 | 0.9 | GO:0004069 | L-aspartate:2-oxoglutarate aminotransferase activity(GO:0004069) |
| 0.3 | 0.9 | GO:0000171 | ribonuclease MRP activity(GO:0000171) |
| 0.3 | 3.1 | GO:0032036 | myosin heavy chain binding(GO:0032036) |
| 0.3 | 4.8 | GO:0004198 | calcium-dependent cysteine-type endopeptidase activity(GO:0004198) |
| 0.3 | 6.2 | GO:0034237 | protein kinase A regulatory subunit binding(GO:0034237) |
| 0.3 | 8.7 | GO:0001965 | G-protein alpha-subunit binding(GO:0001965) |
| 0.3 | 9.5 | GO:0005201 | extracellular matrix structural constituent(GO:0005201) |
| 0.3 | 0.3 | GO:0008502 | melatonin receptor activity(GO:0008502) |
| 0.3 | 1.4 | GO:0004563 | beta-N-acetylhexosaminidase activity(GO:0004563) |
| 0.3 | 5.2 | GO:0005546 | phosphatidylinositol-4,5-bisphosphate binding(GO:0005546) |
| 0.3 | 1.6 | GO:0004984 | olfactory receptor activity(GO:0004984) |
| 0.3 | 0.8 | GO:0017040 | ceramidase activity(GO:0017040) |
| 0.3 | 1.3 | GO:0004382 | guanosine-diphosphatase activity(GO:0004382) |
| 0.3 | 0.5 | GO:0042609 | CD4 receptor binding(GO:0042609) |
| 0.3 | 4.0 | GO:0015035 | protein disulfide oxidoreductase activity(GO:0015035) |
| 0.3 | 1.5 | GO:0016813 | hydrolase activity, acting on carbon-nitrogen (but not peptide) bonds, in linear amidines(GO:0016813) |
| 0.2 | 11.1 | GO:0017112 | Rab guanyl-nucleotide exchange factor activity(GO:0017112) |
| 0.2 | 4.4 | GO:0001223 | transcription coactivator binding(GO:0001223) |
| 0.2 | 1.2 | GO:0098821 | BMP receptor activity(GO:0098821) |
| 0.2 | 2.7 | GO:0035497 | cAMP response element binding(GO:0035497) |
| 0.2 | 1.7 | GO:0036402 | proteasome-activating ATPase activity(GO:0036402) |
| 0.2 | 0.7 | GO:0071568 | UFM1 transferase activity(GO:0071568) |
| 0.2 | 1.9 | GO:0019788 | NEDD8 transferase activity(GO:0019788) |
| 0.2 | 10.7 | GO:0005547 | phosphatidylinositol-3,4,5-trisphosphate binding(GO:0005547) |
| 0.2 | 1.7 | GO:1990247 | N6-methyladenosine-containing RNA binding(GO:1990247) |
| 0.2 | 1.2 | GO:0016918 | retinal binding(GO:0016918) |
| 0.2 | 3.6 | GO:0005247 | voltage-gated chloride channel activity(GO:0005247) |
| 0.2 | 12.2 | GO:0001047 | core promoter binding(GO:0001047) |
| 0.2 | 9.2 | GO:0005544 | calcium-dependent phospholipid binding(GO:0005544) |
| 0.2 | 0.7 | GO:0004769 | steroid delta-isomerase activity(GO:0004769) |
| 0.2 | 1.3 | GO:0046974 | histone methyltransferase activity (H3-K9 specific)(GO:0046974) |
| 0.2 | 0.9 | GO:0004525 | ribonuclease III activity(GO:0004525) double-stranded RNA-specific ribonuclease activity(GO:0032296) |
| 0.2 | 1.5 | GO:0061665 | SUMO ligase activity(GO:0061665) |
| 0.2 | 4.6 | GO:0031492 | nucleosomal DNA binding(GO:0031492) |
| 0.2 | 1.2 | GO:0046975 | histone methyltransferase activity (H3-K36 specific)(GO:0046975) |
| 0.2 | 0.8 | GO:0051377 | mannose-ethanolamine phosphotransferase activity(GO:0051377) |
| 0.2 | 7.9 | GO:0097472 | cyclin-dependent protein kinase activity(GO:0097472) |
| 0.2 | 2.8 | GO:0000983 | transcription factor activity, RNA polymerase II core promoter sequence-specific(GO:0000983) |
| 0.2 | 1.4 | GO:0071253 | connexin binding(GO:0071253) |
| 0.2 | 0.4 | GO:0000253 | 3-keto sterol reductase activity(GO:0000253) |
| 0.2 | 2.6 | GO:0070513 | death domain binding(GO:0070513) |
| 0.2 | 0.6 | GO:0004875 | complement receptor activity(GO:0004875) |
| 0.2 | 1.9 | GO:0017025 | TBP-class protein binding(GO:0017025) |
| 0.2 | 34.3 | GO:0003714 | transcription corepressor activity(GO:0003714) |
| 0.2 | 1.2 | GO:0031995 | insulin-like growth factor II binding(GO:0031995) |
| 0.2 | 11.6 | GO:0002039 | p53 binding(GO:0002039) |
| 0.2 | 0.7 | GO:0008301 | DNA binding, bending(GO:0008301) |
| 0.2 | 0.9 | GO:0004719 | protein-L-isoaspartate (D-aspartate) O-methyltransferase activity(GO:0004719) |
| 0.2 | 0.7 | GO:0003680 | AT DNA binding(GO:0003680) |
| 0.2 | 1.6 | GO:0001228 | transcriptional activator activity, RNA polymerase II transcription regulatory region sequence-specific binding(GO:0001228) |
| 0.2 | 3.3 | GO:0004550 | nucleoside diphosphate kinase activity(GO:0004550) |
| 0.2 | 14.8 | GO:0004222 | metalloendopeptidase activity(GO:0004222) |
| 0.2 | 4.0 | GO:0016628 | oxidoreductase activity, acting on the CH-CH group of donors, NAD or NADP as acceptor(GO:0016628) |
| 0.2 | 0.5 | GO:0031686 | A1 adenosine receptor binding(GO:0031686) |
| 0.2 | 0.7 | GO:0051920 | peroxiredoxin activity(GO:0051920) |
| 0.2 | 1.3 | GO:0032454 | histone demethylase activity (H3-K9 specific)(GO:0032454) |
| 0.2 | 0.6 | GO:0019863 | IgE binding(GO:0019863) |
| 0.2 | 1.1 | GO:0050692 | DBD domain binding(GO:0050692) |
| 0.2 | 11.2 | GO:0008186 | RNA helicase activity(GO:0003724) ATP-dependent RNA helicase activity(GO:0004004) RNA-dependent ATPase activity(GO:0008186) |
| 0.2 | 1.9 | GO:0001163 | RNA polymerase I regulatory region sequence-specific DNA binding(GO:0001163) RNA polymerase I CORE element sequence-specific DNA binding(GO:0001164) |
| 0.2 | 1.6 | GO:0005049 | nuclear export signal receptor activity(GO:0005049) |
| 0.2 | 3.5 | GO:0030506 | ankyrin binding(GO:0030506) |
| 0.2 | 3.0 | GO:0015095 | magnesium ion transmembrane transporter activity(GO:0015095) |
| 0.2 | 0.6 | GO:0004740 | pyruvate dehydrogenase (acetyl-transferring) kinase activity(GO:0004740) |
| 0.1 | 1.2 | GO:0044548 | S100 protein binding(GO:0044548) |
| 0.1 | 1.0 | GO:0052629 | phosphatidylinositol-3,5-bisphosphate 3-phosphatase activity(GO:0052629) |
| 0.1 | 2.1 | GO:0001054 | RNA polymerase I activity(GO:0001054) |
| 0.1 | 1.7 | GO:0031996 | thioesterase binding(GO:0031996) |
| 0.1 | 5.1 | GO:0042169 | SH2 domain binding(GO:0042169) |
| 0.1 | 1.0 | GO:0052744 | phosphatidylinositol-3-phosphatase activity(GO:0004438) phosphatidylinositol monophosphate phosphatase activity(GO:0052744) |
| 0.1 | 2.3 | GO:0009982 | pseudouridine synthase activity(GO:0009982) |
| 0.1 | 1.6 | GO:0005092 | GDP-dissociation inhibitor activity(GO:0005092) |
| 0.1 | 6.6 | GO:0035064 | methylated histone binding(GO:0035064) |
| 0.1 | 3.3 | GO:0051879 | Hsp90 protein binding(GO:0051879) |
| 0.1 | 0.4 | GO:0034597 | phosphatidylinositol-4,5-bisphosphate 4-phosphatase activity(GO:0034597) |
| 0.1 | 0.4 | GO:0004605 | phosphatidate cytidylyltransferase activity(GO:0004605) |
| 0.1 | 0.5 | GO:1990269 | RNA polymerase II C-terminal domain phosphoserine binding(GO:1990269) |
| 0.1 | 1.1 | GO:0001161 | intronic transcription regulatory region sequence-specific DNA binding(GO:0001161) |
| 0.1 | 3.6 | GO:0043027 | cysteine-type endopeptidase inhibitor activity involved in apoptotic process(GO:0043027) |
| 0.1 | 0.3 | GO:0000403 | Y-form DNA binding(GO:0000403) |
| 0.1 | 0.7 | GO:1903136 | cuprous ion binding(GO:1903136) |
| 0.1 | 18.1 | GO:0003700 | nucleic acid binding transcription factor activity(GO:0001071) transcription factor activity, sequence-specific DNA binding(GO:0003700) |
| 0.1 | 2.5 | GO:0003746 | translation elongation factor activity(GO:0003746) |
| 0.1 | 1.2 | GO:0016861 | intramolecular oxidoreductase activity, interconverting aldoses and ketoses(GO:0016861) |
| 0.1 | 1.7 | GO:0042162 | telomeric DNA binding(GO:0042162) |
| 0.1 | 0.3 | GO:0050656 | 3'-phosphoadenosine 5'-phosphosulfate binding(GO:0050656) |
| 0.1 | 1.0 | GO:0004386 | helicase activity(GO:0004386) |
| 0.1 | 2.0 | GO:0031434 | mitogen-activated protein kinase kinase binding(GO:0031434) |
| 0.1 | 0.8 | GO:0016799 | hydrolase activity, hydrolyzing N-glycosyl compounds(GO:0016799) |
| 0.1 | 0.7 | GO:0004689 | phosphorylase kinase activity(GO:0004689) |
| 0.1 | 0.2 | GO:0019237 | centromeric DNA binding(GO:0019237) |
| 0.1 | 1.2 | GO:0033613 | activating transcription factor binding(GO:0033613) |
| 0.1 | 1.9 | GO:0030331 | estrogen receptor binding(GO:0030331) |
| 0.1 | 3.8 | GO:0051019 | mitogen-activated protein kinase binding(GO:0051019) |
| 0.1 | 0.3 | GO:0004731 | purine-nucleoside phosphorylase activity(GO:0004731) |
| 0.1 | 1.1 | GO:0034987 | immunoglobulin receptor binding(GO:0034987) |
| 0.1 | 7.4 | GO:0004252 | serine-type endopeptidase activity(GO:0004252) |
| 0.1 | 1.2 | GO:0030159 | receptor signaling complex scaffold activity(GO:0030159) |
| 0.1 | 4.4 | GO:0015179 | L-amino acid transmembrane transporter activity(GO:0015179) |
| 0.1 | 1.0 | GO:0051959 | dynein light intermediate chain binding(GO:0051959) |
| 0.1 | 0.3 | GO:0016934 | extracellular-glycine-gated ion channel activity(GO:0016933) extracellular-glycine-gated chloride channel activity(GO:0016934) |
| 0.1 | 0.4 | GO:0008449 | N-acetylglucosamine-6-sulfatase activity(GO:0008449) |
| 0.1 | 12.8 | GO:0051015 | actin filament binding(GO:0051015) |
| 0.1 | 0.9 | GO:0001103 | RNA polymerase II repressing transcription factor binding(GO:0001103) |
| 0.1 | 2.3 | GO:0016836 | hydro-lyase activity(GO:0016836) |
| 0.1 | 0.4 | GO:0034235 | GPI anchor binding(GO:0034235) |
| 0.1 | 0.7 | GO:0036312 | phosphatidylinositol 3-kinase regulatory subunit binding(GO:0036312) |
| 0.1 | 2.0 | GO:1900750 | glutathione binding(GO:0043295) oligopeptide binding(GO:1900750) |
| 0.1 | 0.4 | GO:0003910 | DNA ligase activity(GO:0003909) DNA ligase (ATP) activity(GO:0003910) |
| 0.1 | 17.8 | GO:0001077 | transcriptional activator activity, RNA polymerase II core promoter proximal region sequence-specific binding(GO:0001077) |
| 0.1 | 1.4 | GO:0005251 | delayed rectifier potassium channel activity(GO:0005251) |
| 0.1 | 2.3 | GO:0017147 | Wnt-protein binding(GO:0017147) |
| 0.1 | 0.2 | GO:0071532 | ankyrin repeat binding(GO:0071532) |
| 0.1 | 0.9 | GO:0001530 | lipopolysaccharide binding(GO:0001530) |
| 0.1 | 1.4 | GO:0031491 | nucleosome binding(GO:0031491) |
| 0.1 | 0.7 | GO:0004869 | cysteine-type endopeptidase inhibitor activity(GO:0004869) |
| 0.1 | 0.4 | GO:0004745 | retinol dehydrogenase activity(GO:0004745) |
| 0.1 | 1.1 | GO:0001085 | RNA polymerase II transcription factor binding(GO:0001085) |
| 0.1 | 14.2 | GO:0030695 | GTPase regulator activity(GO:0030695) |
| 0.1 | 1.8 | GO:0008138 | protein tyrosine/serine/threonine phosphatase activity(GO:0008138) |
| 0.1 | 0.2 | GO:0036468 | aromatic-L-amino-acid decarboxylase activity(GO:0004058) L-dopa decarboxylase activity(GO:0036468) |
| 0.1 | 1.6 | GO:0008536 | Ran GTPase binding(GO:0008536) |
| 0.1 | 1.1 | GO:0016849 | guanylate cyclase activity(GO:0004383) phosphorus-oxygen lyase activity(GO:0016849) |
| 0.1 | 12.6 | GO:0003712 | transcription cofactor activity(GO:0003712) |
| 0.1 | 0.9 | GO:0051059 | NF-kappaB binding(GO:0051059) |
| 0.1 | 0.5 | GO:0005328 | neurotransmitter:sodium symporter activity(GO:0005328) |
| 0.1 | 0.2 | GO:0046997 | sarcosine dehydrogenase activity(GO:0008480) oxidoreductase activity, acting on the CH-NH group of donors, flavin as acceptor(GO:0046997) |
| 0.1 | 0.4 | GO:0008190 | eukaryotic initiation factor 4E binding(GO:0008190) |
| 0.1 | 0.2 | GO:0015143 | urate transmembrane transporter activity(GO:0015143) salt transmembrane transporter activity(GO:1901702) |
| 0.1 | 0.4 | GO:0004185 | serine-type carboxypeptidase activity(GO:0004185) serine-type exopeptidase activity(GO:0070008) |
| 0.1 | 1.1 | GO:0051539 | 4 iron, 4 sulfur cluster binding(GO:0051539) |
| 0.1 | 0.5 | GO:1990446 | U1 snRNP binding(GO:1990446) |
| 0.1 | 0.7 | GO:0015923 | mannosidase activity(GO:0015923) |
| 0.1 | 0.3 | GO:0004809 | tRNA (guanine-N2-)-methyltransferase activity(GO:0004809) |
| 0.1 | 0.5 | GO:0050072 | m7G(5')pppN diphosphatase activity(GO:0050072) |
| 0.1 | 0.3 | GO:0004983 | neuropeptide Y receptor activity(GO:0004983) |
| 0.0 | 0.1 | GO:0008527 | taste receptor activity(GO:0008527) |
| 0.0 | 0.3 | GO:0042826 | histone deacetylase binding(GO:0042826) |
| 0.0 | 3.5 | GO:0042393 | histone binding(GO:0042393) |
| 0.0 | 0.2 | GO:0034513 | box H/ACA snoRNA binding(GO:0034513) |
| 0.0 | 0.7 | GO:0004535 | poly(A)-specific ribonuclease activity(GO:0004535) |
| 0.0 | 0.7 | GO:0003951 | NAD+ kinase activity(GO:0003951) |
| 0.0 | 1.3 | GO:0017134 | fibroblast growth factor binding(GO:0017134) |
| 0.0 | 1.5 | GO:0030145 | manganese ion binding(GO:0030145) |
| 0.0 | 1.2 | GO:0050136 | NADH dehydrogenase (ubiquinone) activity(GO:0008137) NADH dehydrogenase (quinone) activity(GO:0050136) |
| 0.0 | 0.1 | GO:0004454 | ketohexokinase activity(GO:0004454) |
| 0.0 | 0.6 | GO:0031690 | adrenergic receptor binding(GO:0031690) |
| 0.0 | 0.2 | GO:0042030 | ATPase inhibitor activity(GO:0042030) |
| 0.0 | 1.0 | GO:0048487 | beta-tubulin binding(GO:0048487) |
| 0.0 | 11.5 | GO:0005525 | GTP binding(GO:0005525) |
| 0.0 | 0.6 | GO:0016857 | racemase and epimerase activity, acting on carbohydrates and derivatives(GO:0016857) |
| 0.0 | 1.1 | GO:0004177 | aminopeptidase activity(GO:0004177) |
| 0.0 | 0.2 | GO:0004095 | carnitine O-palmitoyltransferase activity(GO:0004095) O-palmitoyltransferase activity(GO:0016416) |
| 0.0 | 0.4 | GO:0005225 | volume-sensitive anion channel activity(GO:0005225) |
| 0.0 | 0.5 | GO:0008253 | 5'-nucleotidase activity(GO:0008253) |
| 0.0 | 0.3 | GO:0016701 | oxidoreductase activity, acting on single donors with incorporation of molecular oxygen(GO:0016701) oxidoreductase activity, acting on single donors with incorporation of molecular oxygen, incorporation of two atoms of oxygen(GO:0016702) |
| 0.0 | 0.1 | GO:0009378 | four-way junction helicase activity(GO:0009378) |
| 0.0 | 0.2 | GO:0023026 | MHC class II protein complex binding(GO:0023026) |
| 0.0 | 0.2 | GO:0008097 | 5S rRNA binding(GO:0008097) |
| 0.0 | 0.3 | GO:1990226 | histone methyltransferase binding(GO:1990226) |
| 0.0 | 0.5 | GO:0070530 | K63-linked polyubiquitin binding(GO:0070530) |
| 0.0 | 0.2 | GO:0005114 | type II transforming growth factor beta receptor binding(GO:0005114) |
| 0.0 | 0.4 | GO:0030332 | cyclin binding(GO:0030332) |
| 0.0 | 0.9 | GO:0019905 | syntaxin binding(GO:0019905) |
| 0.0 | 0.3 | GO:0034061 | DNA polymerase activity(GO:0034061) |
| 0.0 | 0.2 | GO:0005172 | vascular endothelial growth factor receptor binding(GO:0005172) |
| 0.0 | 15.2 | GO:0003677 | DNA binding(GO:0003677) |
| 0.0 | 16.2 | GO:0003723 | RNA binding(GO:0003723) |
| 0.0 | 0.6 | GO:0004553 | hydrolase activity, hydrolyzing O-glycosyl compounds(GO:0004553) |
| 0.0 | 0.3 | GO:0005385 | zinc ion transmembrane transporter activity(GO:0005385) |
Gene overrepresentation in C2:CP category:
| Log-likelihood per target | Total log-likelihood | Term | Description |
|---|---|---|---|
| 2.6 | 23.0 | SA_G2_AND_M_PHASES | Cdc25 activates the cdc2/cyclin B complex to induce the G2/M transition. |
| 2.0 | 28.4 | SA_REG_CASCADE_OF_CYCLIN_EXPR | Expression of cyclins regulates progression through the cell cycle by activating cyclin-dependent kinases. |
| 1.5 | 7.5 | PID_ALK1_PATHWAY | ALK1 signaling events |
| 1.2 | 63.1 | PID_PLK1_PATHWAY | PLK1 signaling events |
| 1.2 | 55.7 | PID_AURORA_B_PATHWAY | Aurora B signaling |
| 1.1 | 3.3 | SA_PTEN_PATHWAY | PTEN is a tumor suppressor that dephosphorylates the lipid messenger phosphatidylinositol triphosphate. |
| 0.7 | 26.0 | PID_P38_MK2_PATHWAY | p38 signaling mediated by MAPKAP kinases |
| 0.7 | 70.8 | PID_AR_PATHWAY | Coregulation of Androgen receptor activity |
| 0.7 | 30.0 | PID_DELTA_NP63_PATHWAY | Validated transcriptional targets of deltaNp63 isoforms |
| 0.6 | 32.7 | PID_NETRIN_PATHWAY | Netrin-mediated signaling events |
| 0.6 | 29.9 | ST_JNK_MAPK_PATHWAY | JNK MAPK Pathway |
| 0.6 | 18.6 | PID_RET_PATHWAY | Signaling events regulated by Ret tyrosine kinase |
| 0.5 | 1.6 | ST_STAT3_PATHWAY | STAT3 Pathway |
| 0.5 | 4.9 | PID_TCR_RAS_PATHWAY | Ras signaling in the CD4+ TCR pathway |
| 0.5 | 9.3 | SA_PROGRAMMED_CELL_DEATH | Programmed cell death, or apoptosis, eliminates damaged or unneeded cells. |
| 0.4 | 6.9 | PID_P38_MKK3_6PATHWAY | p38 MAPK signaling pathway |
| 0.4 | 0.8 | PID_IL3_PATHWAY | IL3-mediated signaling events |
| 0.4 | 4.0 | PID_RANBP2_PATHWAY | Sumoylation by RanBP2 regulates transcriptional repression |
| 0.4 | 8.6 | PID_HDAC_CLASSIII_PATHWAY | Signaling events mediated by HDAC Class III |
| 0.4 | 4.8 | PID_MYC_PATHWAY | C-MYC pathway |
| 0.4 | 5.4 | ST_G_ALPHA_S_PATHWAY | G alpha s Pathway |
| 0.4 | 3.9 | PID_ALK2_PATHWAY | ALK2 signaling events |
| 0.4 | 15.8 | PID_ILK_PATHWAY | Integrin-linked kinase signaling |
| 0.3 | 14.0 | ST_WNT_BETA_CATENIN_PATHWAY | Wnt/beta-catenin Pathway |
| 0.3 | 7.6 | PID_HEDGEHOG_2PATHWAY | Signaling events mediated by the Hedgehog family |
| 0.3 | 7.8 | PID_WNT_NONCANONICAL_PATHWAY | Noncanonical Wnt signaling pathway |
| 0.3 | 7.9 | PID_TOLL_ENDOGENOUS_PATHWAY | Endogenous TLR signaling |
| 0.3 | 2.1 | PID_ERBB1_RECEPTOR_PROXIMAL_PATHWAY | EGF receptor (ErbB1) signaling pathway |
| 0.3 | 11.5 | PID_RAC1_PATHWAY | RAC1 signaling pathway |
| 0.3 | 4.5 | ST_WNT_CA2_CYCLIC_GMP_PATHWAY | Wnt/Ca2+/cyclic GMP signaling. |
| 0.2 | 6.6 | PID_HIV_NEF_PATHWAY | HIV-1 Nef: Negative effector of Fas and TNF-alpha |
| 0.2 | 10.1 | PID_HDAC_CLASSII_PATHWAY | Signaling events mediated by HDAC Class II |
| 0.2 | 8.7 | PID_HNF3A_PATHWAY | FOXA1 transcription factor network |
| 0.2 | 8.8 | PID_FANCONI_PATHWAY | Fanconi anemia pathway |
| 0.2 | 2.3 | PID_NEPHRIN_NEPH1_PATHWAY | Nephrin/Neph1 signaling in the kidney podocyte |
| 0.2 | 8.1 | SIG_INSULIN_RECEPTOR_PATHWAY_IN_CARDIAC_MYOCYTES | Genes related to the insulin receptor pathway |
| 0.2 | 6.0 | PID_LIS1_PATHWAY | Lissencephaly gene (LIS1) in neuronal migration and development |
| 0.2 | 4.5 | PID_FAK_PATHWAY | Signaling events mediated by focal adhesion kinase |
| 0.2 | 5.1 | PID_ERBB4_PATHWAY | ErbB4 signaling events |
| 0.2 | 2.1 | PID_SYNDECAN_3_PATHWAY | Syndecan-3-mediated signaling events |
| 0.2 | 3.1 | PID_REELIN_PATHWAY | Reelin signaling pathway |
| 0.2 | 4.7 | PID_SMAD2_3NUCLEAR_PATHWAY | Regulation of nuclear SMAD2/3 signaling |
| 0.1 | 1.1 | PID_INSULIN_GLUCOSE_PATHWAY | Insulin-mediated glucose transport |
| 0.1 | 5.9 | PID_NOTCH_PATHWAY | Notch signaling pathway |
| 0.1 | 2.4 | PID_INTEGRIN_A9B1_PATHWAY | Alpha9 beta1 integrin signaling events |
| 0.1 | 2.5 | PID_RETINOIC_ACID_PATHWAY | Retinoic acid receptors-mediated signaling |
| 0.1 | 2.0 | PID_VEGFR1_2_PATHWAY | Signaling events mediated by VEGFR1 and VEGFR2 |
| 0.1 | 3.6 | PID_THROMBIN_PAR1_PATHWAY | PAR1-mediated thrombin signaling events |
| 0.1 | 1.1 | PID_IL23_PATHWAY | IL23-mediated signaling events |
| 0.1 | 1.0 | PID_SYNDECAN_2_PATHWAY | Syndecan-2-mediated signaling events |
| 0.1 | 9.9 | NABA_ECM_AFFILIATED | Genes encoding proteins affiliated structurally or functionally to extracellular matrix proteins |
| 0.1 | 0.8 | PID_IL1_PATHWAY | IL1-mediated signaling events |
| 0.1 | 1.7 | PID_DNA_PK_PATHWAY | DNA-PK pathway in nonhomologous end joining |
| 0.1 | 2.4 | PID_HIF2PATHWAY | HIF-2-alpha transcription factor network |
| 0.1 | 0.7 | PID_ERBB1_DOWNSTREAM_PATHWAY | ErbB1 downstream signaling |
| 0.1 | 1.0 | PID_ATM_PATHWAY | ATM pathway |
| 0.1 | 4.3 | PID_MYC_ACTIV_PATHWAY | Validated targets of C-MYC transcriptional activation |
| 0.1 | 1.9 | PID_BMP_PATHWAY | BMP receptor signaling |
| 0.1 | 2.0 | PID_HDAC_CLASSI_PATHWAY | Signaling events mediated by HDAC Class I |
| 0.0 | 0.6 | PID_CXCR4_PATHWAY | CXCR4-mediated signaling events |
| 0.0 | 0.5 | PID_SYNDECAN_4_PATHWAY | Syndecan-4-mediated signaling events |
| 0.0 | 0.4 | PID_ERB_GENOMIC_PATHWAY | Validated nuclear estrogen receptor beta network |
| 0.0 | 1.0 | PID_CERAMIDE_PATHWAY | Ceramide signaling pathway |
| 0.0 | 5.1 | NABA_ECM_REGULATORS | Genes encoding enzymes and their regulators involved in the remodeling of the extracellular matrix |
| 0.0 | 0.7 | SIG_CD40PATHWAYMAP | Genes related to CD40 signaling |
| 0.0 | 0.2 | PID_GLYPICAN_1PATHWAY | Glypican 1 network |
| 0.0 | 1.4 | PID_AP1_PATHWAY | AP-1 transcription factor network |
| 0.0 | 0.7 | PID_TELOMERASE_PATHWAY | Regulation of Telomerase |
Gene overrepresentation in C2:CP:REACTOME category:
| Log-likelihood per target | Total log-likelihood | Term | Description |
|---|---|---|---|
| 2.5 | 22.6 | REACTOME_P2Y_RECEPTORS | Genes involved in P2Y receptors |
| 2.4 | 40.5 | REACTOME_NOTCH_HLH_TRANSCRIPTION_PATHWAY | Genes involved in Notch-HLH transcription pathway |
| 1.6 | 24.3 | REACTOME_ERKS_ARE_INACTIVATED | Genes involved in ERKs are inactivated |
| 1.5 | 39.2 | REACTOME_KINESINS | Genes involved in Kinesins |
| 1.1 | 29.4 | REACTOME_G0_AND_EARLY_G1 | Genes involved in G0 and Early G1 |
| 1.1 | 23.4 | REACTOME_FANCONI_ANEMIA_PATHWAY | Genes involved in Fanconi Anemia pathway |
| 1.1 | 38.1 | REACTOME_G1_PHASE | Genes involved in G1 Phase |
| 1.0 | 38.1 | REACTOME_SMOOTH_MUSCLE_CONTRACTION | Genes involved in Smooth Muscle Contraction |
| 0.9 | 93.3 | REACTOME_MITOTIC_PROMETAPHASE | Genes involved in Mitotic Prometaphase |
| 0.9 | 5.3 | REACTOME_TRANSLOCATION_OF_ZAP_70_TO_IMMUNOLOGICAL_SYNAPSE | Genes involved in Translocation of ZAP-70 to Immunological synapse |
| 0.8 | 12.7 | REACTOME_REGULATION_OF_INSULIN_LIKE_GROWTH_FACTOR_IGF_ACTIVITY_BY_INSULIN_LIKE_GROWTH_FACTOR_BINDING_PROTEINS_IGFBPS | Genes involved in Regulation of Insulin-like Growth Factor (IGF) Activity by Insulin-like Growth Factor Binding Proteins (IGFBPs) |
| 0.8 | 24.2 | REACTOME_DOWNREGULATION_OF_SMAD2_3_SMAD4_TRANSCRIPTIONAL_ACTIVITY | Genes involved in Downregulation of SMAD2/3:SMAD4 transcriptional activity |
| 0.7 | 11.7 | REACTOME_APOPTOSIS_INDUCED_DNA_FRAGMENTATION | Genes involved in Apoptosis induced DNA fragmentation |
| 0.7 | 10.8 | REACTOME_SIGNALING_BY_NODAL | Genes involved in Signaling by NODAL |
| 0.7 | 58.2 | REACTOME_NRAGE_SIGNALS_DEATH_THROUGH_JNK | Genes involved in NRAGE signals death through JNK |
| 0.7 | 2.6 | REACTOME_INHIBITION_OF_REPLICATION_INITIATION_OF_DAMAGED_DNA_BY_RB1_E2F1 | Genes involved in Inhibition of replication initiation of damaged DNA by RB1/E2F1 |
| 0.6 | 5.1 | REACTOME_SYNTHESIS_OF_BILE_ACIDS_AND_BILE_SALTS_VIA_24_HYDROXYCHOLESTEROL | Genes involved in Synthesis of bile acids and bile salts via 24-hydroxycholesterol |
| 0.6 | 10.1 | REACTOME_SYNTHESIS_SECRETION_AND_DEACYLATION_OF_GHRELIN | Genes involved in Synthesis, Secretion, and Deacylation of Ghrelin |
| 0.6 | 3.5 | REACTOME_APOPTOTIC_CLEAVAGE_OF_CELL_ADHESION_PROTEINS | Genes involved in Apoptotic cleavage of cell adhesion proteins |
| 0.6 | 10.3 | REACTOME_SIGNAL_ATTENUATION | Genes involved in Signal attenuation |
| 0.6 | 14.0 | REACTOME_OTHER_SEMAPHORIN_INTERACTIONS | Genes involved in Other semaphorin interactions |
| 0.5 | 2.1 | REACTOME_ENDOGENOUS_STEROLS | Genes involved in Endogenous sterols |
| 0.5 | 4.8 | REACTOME_G1_S_SPECIFIC_TRANSCRIPTION | Genes involved in G1/S-Specific Transcription |
| 0.5 | 6.5 | REACTOME_VITAMIN_B5_PANTOTHENATE_METABOLISM | Genes involved in Vitamin B5 (pantothenate) metabolism |
| 0.4 | 12.6 | REACTOME_PEROXISOMAL_LIPID_METABOLISM | Genes involved in Peroxisomal lipid metabolism |
| 0.4 | 19.0 | REACTOME_PI3K_AKT_ACTIVATION | Genes involved in PI3K/AKT activation |
| 0.4 | 5.7 | REACTOME_GENERATION_OF_SECOND_MESSENGER_MOLECULES | Genes involved in Generation of second messenger molecules |
| 0.4 | 21.2 | REACTOME_AMINO_ACID_AND_OLIGOPEPTIDE_SLC_TRANSPORTERS | Genes involved in Amino acid and oligopeptide SLC transporters |
| 0.3 | 6.9 | REACTOME_CREB_PHOSPHORYLATION_THROUGH_THE_ACTIVATION_OF_CAMKII | Genes involved in CREB phosphorylation through the activation of CaMKII |
| 0.3 | 4.7 | REACTOME_REPAIR_SYNTHESIS_FOR_GAP_FILLING_BY_DNA_POL_IN_TC_NER | Genes involved in Repair synthesis for gap-filling by DNA polymerase in TC-NER |
| 0.3 | 6.3 | REACTOME_TRAF6_MEDIATED_IRF7_ACTIVATION | Genes involved in TRAF6 mediated IRF7 activation |
| 0.3 | 2.3 | REACTOME_SPRY_REGULATION_OF_FGF_SIGNALING | Genes involved in Spry regulation of FGF signaling |
| 0.3 | 10.2 | REACTOME_TIGHT_JUNCTION_INTERACTIONS | Genes involved in Tight junction interactions |
| 0.3 | 8.6 | REACTOME_YAP1_AND_WWTR1_TAZ_STIMULATED_GENE_EXPRESSION | Genes involved in YAP1- and WWTR1 (TAZ)-stimulated gene expression |
| 0.3 | 3.5 | REACTOME_STEROID_HORMONES | Genes involved in Steroid hormones |
| 0.3 | 13.7 | REACTOME_NCAM1_INTERACTIONS | Genes involved in NCAM1 interactions |
| 0.3 | 3.9 | REACTOME_REGULATION_OF_KIT_SIGNALING | Genes involved in Regulation of KIT signaling |
| 0.3 | 3.1 | REACTOME_FACILITATIVE_NA_INDEPENDENT_GLUCOSE_TRANSPORTERS | Genes involved in Facilitative Na+-independent glucose transporters |
| 0.3 | 2.4 | REACTOME_ACTIVATION_OF_CHAPERONE_GENES_BY_ATF6_ALPHA | Genes involved in Activation of Chaperone Genes by ATF6-alpha |
| 0.3 | 2.6 | REACTOME_SHC_RELATED_EVENTS | Genes involved in SHC-related events |
| 0.3 | 2.1 | REACTOME_THE_ACTIVATION_OF_ARYLSULFATASES | Genes involved in The activation of arylsulfatases |
| 0.2 | 4.0 | REACTOME_MITOCHONDRIAL_FATTY_ACID_BETA_OXIDATION | Genes involved in Mitochondrial Fatty Acid Beta-Oxidation |
| 0.2 | 1.1 | REACTOME_PACKAGING_OF_TELOMERE_ENDS | Genes involved in Packaging Of Telomere Ends |
| 0.2 | 1.7 | REACTOME_PASSIVE_TRANSPORT_BY_AQUAPORINS | Genes involved in Passive Transport by Aquaporins |
| 0.2 | 2.1 | REACTOME_ROLE_OF_DCC_IN_REGULATING_APOPTOSIS | Genes involved in Role of DCC in regulating apoptosis |
| 0.2 | 4.5 | REACTOME_METABOLISM_OF_PORPHYRINS | Genes involved in Metabolism of porphyrins |
| 0.2 | 8.5 | REACTOME_SPHINGOLIPID_DE_NOVO_BIOSYNTHESIS | Genes involved in Sphingolipid de novo biosynthesis |
| 0.2 | 1.0 | REACTOME_CYTOCHROME_P450_ARRANGED_BY_SUBSTRATE_TYPE | Genes involved in Cytochrome P450 - arranged by substrate type |
| 0.2 | 9.0 | REACTOME_RNA_POL_I_PROMOTER_OPENING | Genes involved in RNA Polymerase I Promoter Opening |
| 0.2 | 1.6 | REACTOME_SIGNALING_BY_ACTIVATED_POINT_MUTANTS_OF_FGFR1 | Genes involved in Signaling by activated point mutants of FGFR1 |
| 0.2 | 3.3 | REACTOME_DOUBLE_STRAND_BREAK_REPAIR | Genes involved in Double-Strand Break Repair |
| 0.1 | 0.6 | REACTOME_INFLUENZA_VIRAL_RNA_TRANSCRIPTION_AND_REPLICATION | Genes involved in Influenza Viral RNA Transcription and Replication |
| 0.1 | 1.2 | REACTOME_MEMBRANE_BINDING_AND_TARGETTING_OF_GAG_PROTEINS | Genes involved in Membrane binding and targetting of GAG proteins |
| 0.1 | 2.1 | REACTOME_CREB_PHOSPHORYLATION_THROUGH_THE_ACTIVATION_OF_RAS | Genes involved in CREB phosphorylation through the activation of Ras |
| 0.1 | 0.8 | REACTOME_IL_RECEPTOR_SHC_SIGNALING | Genes involved in Interleukin receptor SHC signaling |
| 0.1 | 5.1 | REACTOME_HS_GAG_BIOSYNTHESIS | Genes involved in HS-GAG biosynthesis |
| 0.1 | 5.2 | REACTOME_GLUCAGON_TYPE_LIGAND_RECEPTORS | Genes involved in Glucagon-type ligand receptors |
| 0.1 | 1.9 | REACTOME_METABOLISM_OF_POLYAMINES | Genes involved in Metabolism of polyamines |
| 0.1 | 2.4 | REACTOME_ENDOSOMAL_SORTING_COMPLEX_REQUIRED_FOR_TRANSPORT_ESCRT | Genes involved in Endosomal Sorting Complex Required For Transport (ESCRT) |
| 0.1 | 2.6 | REACTOME_SYNTHESIS_AND_INTERCONVERSION_OF_NUCLEOTIDE_DI_AND_TRIPHOSPHATES | Genes involved in Synthesis and interconversion of nucleotide di- and triphosphates |
| 0.1 | 0.1 | REACTOME_REGULATION_OF_SIGNALING_BY_CBL | Genes involved in Regulation of signaling by CBL |
| 0.1 | 2.1 | REACTOME_SIGNALING_BY_FGFR1_MUTANTS | Genes involved in Signaling by FGFR1 mutants |
| 0.1 | 0.8 | REACTOME_P75NTR_RECRUITS_SIGNALLING_COMPLEXES | Genes involved in p75NTR recruits signalling complexes |
| 0.1 | 0.7 | REACTOME_P38MAPK_EVENTS | Genes involved in p38MAPK events |
| 0.1 | 0.7 | REACTOME_RECEPTOR_LIGAND_BINDING_INITIATES_THE_SECOND_PROTEOLYTIC_CLEAVAGE_OF_NOTCH_RECEPTOR | Genes involved in Receptor-ligand binding initiates the second proteolytic cleavage of Notch receptor |
| 0.1 | 2.3 | REACTOME_GLYCOSPHINGOLIPID_METABOLISM | Genes involved in Glycosphingolipid metabolism |
| 0.1 | 0.5 | REACTOME_CREATION_OF_C4_AND_C2_ACTIVATORS | Genes involved in Creation of C4 and C2 activators |
| 0.1 | 4.9 | REACTOME_NUCLEAR_RECEPTOR_TRANSCRIPTION_PATHWAY | Genes involved in Nuclear Receptor transcription pathway |
| 0.1 | 0.2 | REACTOME_ACTIVATION_OF_RAC | Genes involved in Activation of Rac |
| 0.1 | 1.0 | REACTOME_SULFUR_AMINO_ACID_METABOLISM | Genes involved in Sulfur amino acid metabolism |
| 0.1 | 2.0 | REACTOME_GLUTATHIONE_CONJUGATION | Genes involved in Glutathione conjugation |
| 0.1 | 1.6 | REACTOME_SIGNALING_BY_HIPPO | Genes involved in Signaling by Hippo |
| 0.1 | 0.7 | REACTOME_TERMINATION_OF_O_GLYCAN_BIOSYNTHESIS | Genes involved in Termination of O-glycan biosynthesis |
| 0.1 | 1.6 | REACTOME_METABOLISM_OF_NON_CODING_RNA | Genes involved in Metabolism of non-coding RNA |
| 0.1 | 2.1 | REACTOME_MYOGENESIS | Genes involved in Myogenesis |
| 0.1 | 1.0 | REACTOME_G_ALPHA1213_SIGNALLING_EVENTS | Genes involved in G alpha (12/13) signalling events |
| 0.1 | 1.0 | REACTOME_SYNTHESIS_OF_PIPS_AT_THE_LATE_ENDOSOME_MEMBRANE | Genes involved in Synthesis of PIPs at the late endosome membrane |
| 0.1 | 2.1 | REACTOME_ADHERENS_JUNCTIONS_INTERACTIONS | Genes involved in Adherens junctions interactions |
| 0.1 | 0.5 | REACTOME_ABACAVIR_TRANSPORT_AND_METABOLISM | Genes involved in Abacavir transport and metabolism |
| 0.1 | 3.9 | REACTOME_TRANSPORT_OF_MATURE_TRANSCRIPT_TO_CYTOPLASM | Genes involved in Transport of Mature Transcript to Cytoplasm |
| 0.1 | 1.2 | REACTOME_SIGNALING_BY_BMP | Genes involved in Signaling by BMP |
| 0.1 | 2.8 | REACTOME_NETRIN1_SIGNALING | Genes involved in Netrin-1 signaling |
| 0.1 | 0.4 | REACTOME_REGULATION_OF_INSULIN_SECRETION_BY_ACETYLCHOLINE | Genes involved in Regulation of Insulin Secretion by Acetylcholine |
| 0.1 | 1.7 | REACTOME_RNA_POL_III_TRANSCRIPTION_INITIATION_FROM_TYPE_3_PROMOTER | Genes involved in RNA Polymerase III Transcription Initiation From Type 3 Promoter |
| 0.0 | 0.6 | REACTOME_REGULATION_OF_PYRUVATE_DEHYDROGENASE_PDH_COMPLEX | Genes involved in Regulation of pyruvate dehydrogenase (PDH) complex |
| 0.0 | 0.6 | REACTOME_INFLAMMASOMES | Genes involved in Inflammasomes |
| 0.0 | 0.6 | REACTOME_NEF_MEDIATED_DOWNREGULATION_OF_MHC_CLASS_I_COMPLEX_CELL_SURFACE_EXPRESSION | Genes involved in Nef mediated downregulation of MHC class I complex cell surface expression |
| 0.0 | 2.2 | REACTOME_TRANSCRIPTIONAL_REGULATION_OF_WHITE_ADIPOCYTE_DIFFERENTIATION | Genes involved in Transcriptional Regulation of White Adipocyte Differentiation |
| 0.0 | 1.6 | REACTOME_TRANSPORT_OF_VITAMINS_NUCLEOSIDES_AND_RELATED_MOLECULES | Genes involved in Transport of vitamins, nucleosides, and related molecules |
| 0.0 | 2.4 | REACTOME_LOSS_OF_NLP_FROM_MITOTIC_CENTROSOMES | Genes involved in Loss of Nlp from mitotic centrosomes |
| 0.0 | 1.5 | REACTOME_RNA_POL_II_TRANSCRIPTION_PRE_INITIATION_AND_PROMOTER_OPENING | Genes involved in RNA Polymerase II Transcription Pre-Initiation And Promoter Opening |
| 0.0 | 3.1 | REACTOME_REGULATION_OF_MRNA_STABILITY_BY_PROTEINS_THAT_BIND_AU_RICH_ELEMENTS | Genes involved in Regulation of mRNA Stability by Proteins that Bind AU-rich Elements |
| 0.0 | 2.8 | REACTOME_MRNA_SPLICING | Genes involved in mRNA Splicing |
| 0.0 | 0.8 | REACTOME_SYNTHESIS_OF_GLYCOSYLPHOSPHATIDYLINOSITOL_GPI | Genes involved in Synthesis of glycosylphosphatidylinositol (GPI) |
| 0.0 | 0.2 | REACTOME_FORMATION_OF_TRANSCRIPTION_COUPLED_NER_TC_NER_REPAIR_COMPLEX | Genes involved in Formation of transcription-coupled NER (TC-NER) repair complex |
| 0.0 | 0.4 | REACTOME_RESOLUTION_OF_AP_SITES_VIA_THE_SINGLE_NUCLEOTIDE_REPLACEMENT_PATHWAY | Genes involved in Resolution of AP sites via the single-nucleotide replacement pathway |
| 0.0 | 0.7 | REACTOME_CHOLESTEROL_BIOSYNTHESIS | Genes involved in Cholesterol biosynthesis |
| 0.0 | 2.7 | REACTOME_SIGNALING_BY_RHO_GTPASES | Genes involved in Signaling by Rho GTPases |
| 0.0 | 0.2 | REACTOME_TRAF6_MEDIATED_INDUCTION_OF_TAK1_COMPLEX | Genes involved in TRAF6 mediated induction of TAK1 complex |
| 0.0 | 0.9 | REACTOME_ACTIVATION_OF_CHAPERONE_GENES_BY_XBP1S | Genes involved in Activation of Chaperone Genes by XBP1(S) |
| 0.0 | 0.2 | REACTOME_TELOMERE_MAINTENANCE | Genes involved in Telomere Maintenance |
| 0.0 | 0.3 | REACTOME_DEADENYLATION_OF_MRNA | Genes involved in Deadenylation of mRNA |
| 0.0 | 0.3 | REACTOME_ZINC_TRANSPORTERS | Genes involved in Zinc transporters |
| 0.0 | 0.2 | REACTOME_ANTIGEN_PRESENTATION_FOLDING_ASSEMBLY_AND_PEPTIDE_LOADING_OF_CLASS_I_MHC | Genes involved in Antigen Presentation: Folding, assembly and peptide loading of class I MHC |
| 0.0 | 1.1 | REACTOME_INTERFERON_SIGNALING | Genes involved in Interferon Signaling |
| 0.0 | 0.1 | REACTOME_PRE_NOTCH_TRANSCRIPTION_AND_TRANSLATION | Genes involved in Pre-NOTCH Transcription and Translation |
| 0.0 | 0.1 | REACTOME_CLASS_C_3_METABOTROPIC_GLUTAMATE_PHEROMONE_RECEPTORS | Genes involved in Class C/3 (Metabotropic glutamate/pheromone receptors) |
|
|
|
|