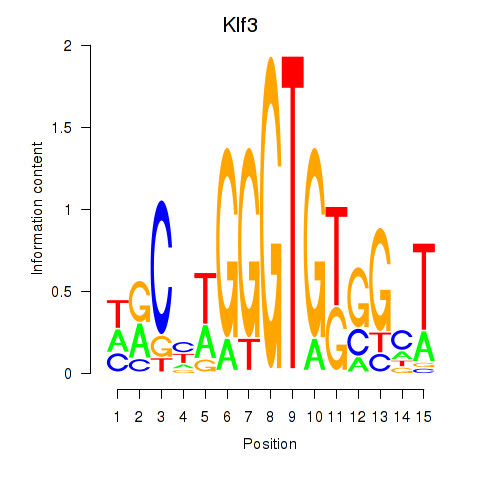
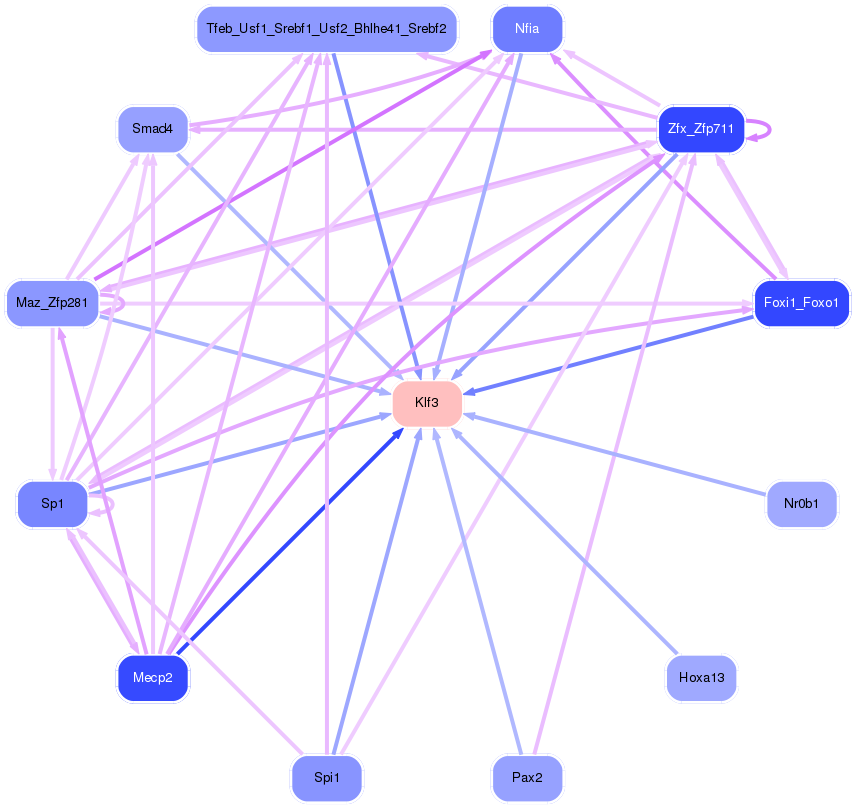
Motif ID: Klf3
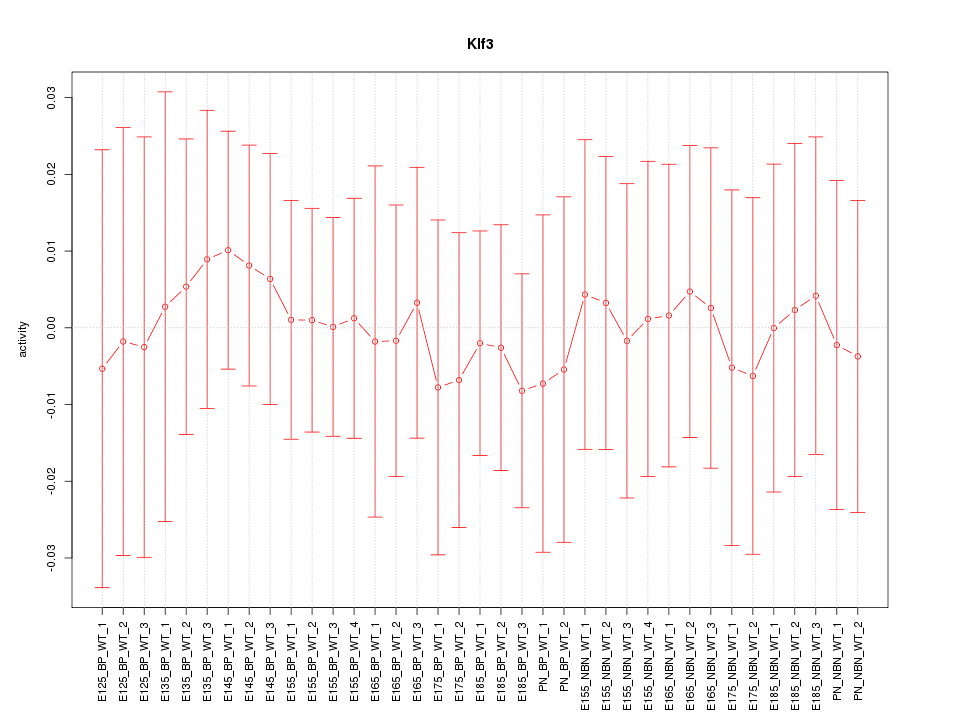
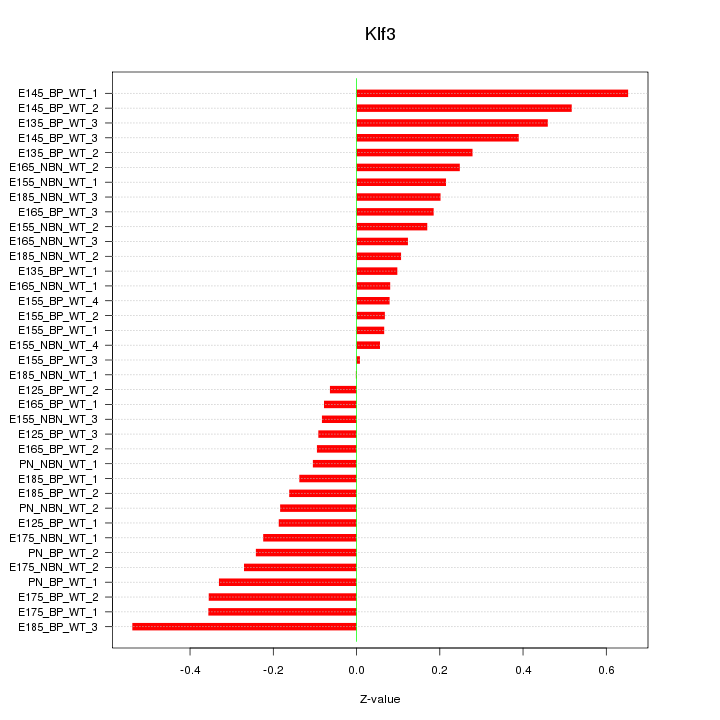
Z-value: 0.255
Transcription factors associated with Klf3:
| Gene Symbol | Entrez ID | Gene Name |
|---|---|---|
| Klf3 | ENSMUSG00000029178.8 | Klf3 |
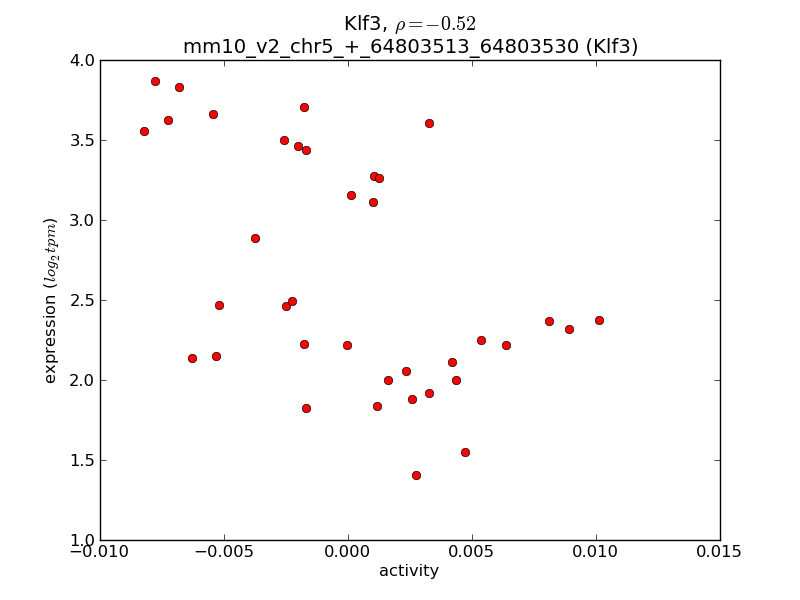
Activity-expression correlation:
| Gene Symbol | Promoter | Pearson corr. coef. | P-value | Plot |
|---|---|---|---|---|
| Klf3 | mm10_v2_chr5_+_64803513_64803530 | -0.52 | 1.1e-03 | Click! |

Top targets:
Gene overrepresentation in biological_process category:
| Log-likelihood per target | Total log-likelihood | Term | Description |
|---|---|---|---|
| 0.1 | 0.2 | GO:0071105 | response to interleukin-9(GO:0071104) response to interleukin-11(GO:0071105) |
| 0.0 | 0.1 | GO:0001951 | intestinal D-glucose absorption(GO:0001951) terminal web assembly(GO:1902896) |
| 0.0 | 0.5 | GO:0042104 | positive regulation of activated T cell proliferation(GO:0042104) |
| 0.0 | 0.1 | GO:0007016 | cytoskeletal anchoring at plasma membrane(GO:0007016) |
Gene overrepresentation in cellular_component category:
| Log-likelihood per target | Total log-likelihood | Term | Description |
|---|---|---|---|
| 0.0 | 0.4 | GO:0005862 | muscle thin filament tropomyosin(GO:0005862) |
| 0.0 | 0.1 | GO:1990357 | terminal web(GO:1990357) |
| 0.0 | 0.1 | GO:0005916 | fascia adherens(GO:0005916) |
Gene overrepresentation in molecular_function category:
| Log-likelihood per target | Total log-likelihood | Term | Description |
|---|---|---|---|
| 0.1 | 0.4 | GO:0031995 | insulin-like growth factor II binding(GO:0031995) |
| 0.0 | 1.0 | GO:0005227 | calcium activated cation channel activity(GO:0005227) |
| 0.0 | 0.1 | GO:0005459 | UDP-galactose transmembrane transporter activity(GO:0005459) |
| 0.0 | 1.0 | GO:0004867 | serine-type endopeptidase inhibitor activity(GO:0004867) |
| 0.0 | 0.2 | GO:0050693 | LBD domain binding(GO:0050693) |
| 0.0 | 0.4 | GO:0008307 | structural constituent of muscle(GO:0008307) |
Gene overrepresentation in C2:CP:REACTOME category:
| Log-likelihood per target | Total log-likelihood | Term | Description |
|---|---|---|---|
| 0.0 | 0.4 | REACTOME_REGULATION_OF_INSULIN_LIKE_GROWTH_FACTOR_IGF_ACTIVITY_BY_INSULIN_LIKE_GROWTH_FACTOR_BINDING_PROTEINS_IGFBPS | Genes involved in Regulation of Insulin-like Growth Factor (IGF) Activity by Insulin-like Growth Factor Binding Proteins (IGFBPs) |
| 0.0 | 0.4 | REACTOME_STRIATED_MUSCLE_CONTRACTION | Genes involved in Striated Muscle Contraction |
| 0.0 | 0.2 | REACTOME_OXYGEN_DEPENDENT_PROLINE_HYDROXYLATION_OF_HYPOXIA_INDUCIBLE_FACTOR_ALPHA | Genes involved in Oxygen-dependent Proline Hydroxylation of Hypoxia-inducible Factor Alpha |