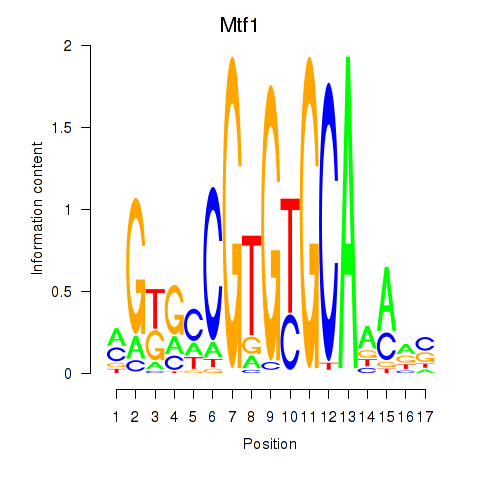
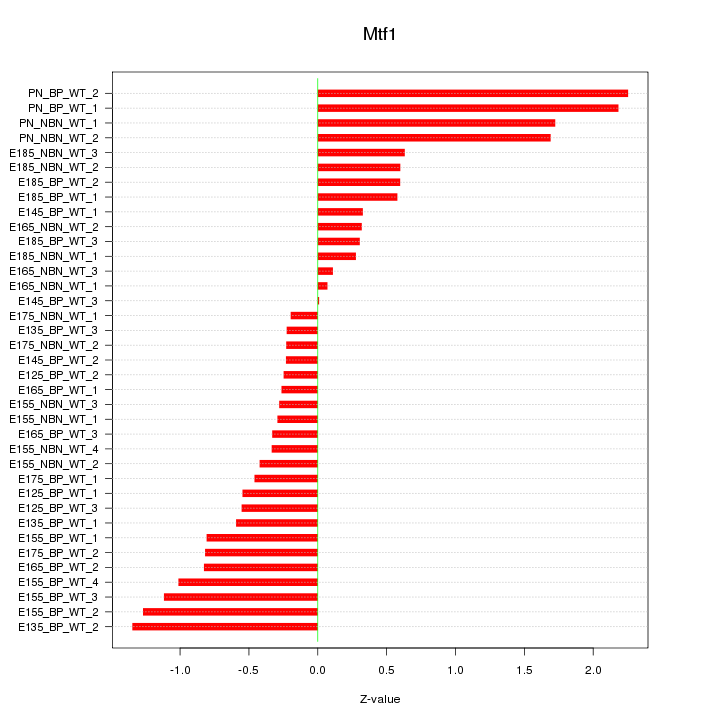
Motif ID: Mtf1
Z-value: 0.859
Transcription factors associated with Mtf1:
| Gene Symbol | Entrez ID | Gene Name |
|---|---|---|
| Mtf1 | ENSMUSG00000028890.7 | Mtf1 |
Activity-expression correlation:
| Gene Symbol | Promoter | Pearson corr. coef. | P-value | Plot |
|---|---|---|---|---|
| Mtf1 | mm10_v2_chr4_+_124802543_124802678 | -0.04 | 8.0e-01 | Click! |


Top targets:
Gene overrepresentation in biological_process category:
| Log-likelihood per target | Total log-likelihood | Term | Description |
|---|---|---|---|
| 3.8 | 26.7 | GO:0010273 | detoxification of copper ion(GO:0010273) stress response to copper ion(GO:1990169) |
| 0.4 | 1.1 | GO:0014877 | response to inactivity(GO:0014854) response to muscle inactivity(GO:0014870) response to muscle inactivity involved in regulation of muscle adaptation(GO:0014877) response to denervation involved in regulation of muscle adaptation(GO:0014894) |
| 0.3 | 1.0 | GO:0035359 | negative regulation of peroxisome proliferator activated receptor signaling pathway(GO:0035359) regulation of oxidative phosphorylation uncoupler activity(GO:2000275) cell proliferation involved in heart valve development(GO:2000793) |
| 0.3 | 2.4 | GO:0006290 | pyrimidine dimer repair(GO:0006290) |
| 0.3 | 0.8 | GO:0015920 | regulation of phosphatidylcholine catabolic process(GO:0010899) lipopolysaccharide transport(GO:0015920) |
| 0.2 | 1.1 | GO:0043985 | histone H4-R3 methylation(GO:0043985) |
| 0.2 | 1.5 | GO:0070458 | detoxification of nitrogen compound(GO:0051410) cellular detoxification of nitrogen compound(GO:0070458) |
| 0.2 | 1.1 | GO:0042891 | antibiotic transport(GO:0042891) |
| 0.2 | 0.5 | GO:0035844 | positive regulation of polarized epithelial cell differentiation(GO:0030862) cloaca development(GO:0035844) |
| 0.2 | 1.2 | GO:0046415 | urate metabolic process(GO:0046415) |
| 0.2 | 0.5 | GO:0008626 | granzyme-mediated apoptotic signaling pathway(GO:0008626) positive regulation of natural killer cell degranulation(GO:0043323) |
| 0.1 | 2.1 | GO:0048715 | negative regulation of oligodendrocyte differentiation(GO:0048715) |
| 0.1 | 0.8 | GO:1990564 | regulation of I-kappaB phosphorylation(GO:1903719) positive regulation of I-kappaB phosphorylation(GO:1903721) protein polyufmylation(GO:1990564) protein K69-linked ufmylation(GO:1990592) |
| 0.1 | 2.5 | GO:0032060 | bleb assembly(GO:0032060) |
| 0.1 | 0.3 | GO:0015910 | peroxisomal long-chain fatty acid import(GO:0015910) |
| 0.1 | 6.4 | GO:0042058 | regulation of epidermal growth factor receptor signaling pathway(GO:0042058) |
| 0.1 | 1.7 | GO:2000060 | positive regulation of protein ubiquitination involved in ubiquitin-dependent protein catabolic process(GO:2000060) |
| 0.1 | 0.5 | GO:0043569 | negative regulation of insulin-like growth factor receptor signaling pathway(GO:0043569) |
| 0.1 | 0.6 | GO:0060907 | positive regulation of macrophage cytokine production(GO:0060907) |
| 0.1 | 0.6 | GO:0046085 | adenosine metabolic process(GO:0046085) |
| 0.1 | 2.9 | GO:0034605 | cellular response to heat(GO:0034605) |
| 0.1 | 0.9 | GO:0032515 | negative regulation of phosphoprotein phosphatase activity(GO:0032515) |
| 0.0 | 1.6 | GO:1901522 | positive regulation of transcription from RNA polymerase II promoter involved in cellular response to chemical stimulus(GO:1901522) |
| 0.0 | 0.2 | GO:1902732 | positive regulation of chondrocyte proliferation(GO:1902732) |
| 0.0 | 0.4 | GO:0007168 | receptor guanylyl cyclase signaling pathway(GO:0007168) |
| 0.0 | 0.1 | GO:0097402 | optic vesicle morphogenesis(GO:0003404) neuroblast migration(GO:0097402) |
| 0.0 | 0.2 | GO:0001672 | regulation of chromatin assembly or disassembly(GO:0001672) |
| 0.0 | 0.1 | GO:0006030 | chitin metabolic process(GO:0006030) chitin catabolic process(GO:0006032) |
| 0.0 | 0.1 | GO:0014012 | peripheral nervous system axon regeneration(GO:0014012) |
| 0.0 | 0.6 | GO:0043551 | regulation of phosphatidylinositol 3-kinase activity(GO:0043551) |
| 0.0 | 0.5 | GO:0006515 | misfolded or incompletely synthesized protein catabolic process(GO:0006515) |
| 0.0 | 1.1 | GO:0008543 | fibroblast growth factor receptor signaling pathway(GO:0008543) |
| 0.0 | 0.1 | GO:0043568 | positive regulation of insulin-like growth factor receptor signaling pathway(GO:0043568) |
Gene overrepresentation in cellular_component category:
| Log-likelihood per target | Total log-likelihood | Term | Description |
|---|---|---|---|
| 0.3 | 2.4 | GO:0031465 | Cul4B-RING E3 ubiquitin ligase complex(GO:0031465) |
| 0.2 | 0.7 | GO:0045098 | type III intermediate filament(GO:0045098) |
| 0.2 | 0.5 | GO:0044194 | cytolytic granule(GO:0044194) |
| 0.1 | 1.5 | GO:0035686 | sperm fibrous sheath(GO:0035686) |
| 0.1 | 2.5 | GO:0043218 | compact myelin(GO:0043218) |
| 0.0 | 0.8 | GO:0031528 | microvillus membrane(GO:0031528) |
| 0.0 | 0.5 | GO:0042405 | nuclear inclusion body(GO:0042405) |
| 0.0 | 0.5 | GO:0036038 | MKS complex(GO:0036038) |
| 0.0 | 0.6 | GO:0005942 | phosphatidylinositol 3-kinase complex(GO:0005942) |
| 0.0 | 1.1 | GO:0031526 | brush border membrane(GO:0031526) |
| 0.0 | 6.0 | GO:0000139 | Golgi membrane(GO:0000139) |
| 0.0 | 0.9 | GO:0008287 | protein serine/threonine phosphatase complex(GO:0008287) phosphatase complex(GO:1903293) |
| 0.0 | 8.7 | GO:0005764 | lytic vacuole(GO:0000323) lysosome(GO:0005764) |
| 0.0 | 1.1 | GO:0019005 | SCF ubiquitin ligase complex(GO:0019005) |
| 0.0 | 0.4 | GO:0005834 | heterotrimeric G-protein complex(GO:0005834) |
| 0.0 | 0.3 | GO:0005782 | peroxisomal matrix(GO:0005782) microbody lumen(GO:0031907) |
| 0.0 | 0.5 | GO:0042645 | nucleoid(GO:0009295) mitochondrial nucleoid(GO:0042645) |
Gene overrepresentation in molecular_function category:
| Log-likelihood per target | Total log-likelihood | Term | Description |
|---|---|---|---|
| 0.3 | 1.1 | GO:0035243 | protein-arginine omega-N symmetric methyltransferase activity(GO:0035243) |
| 0.3 | 0.8 | GO:0001875 | lipopolysaccharide receptor activity(GO:0001875) |
| 0.2 | 1.1 | GO:0042895 | antibiotic transporter activity(GO:0042895) |
| 0.2 | 0.9 | GO:0004427 | inorganic diphosphatase activity(GO:0004427) |
| 0.2 | 10.0 | GO:0005507 | copper ion binding(GO:0005507) |
| 0.2 | 1.6 | GO:0004886 | 9-cis retinoic acid receptor activity(GO:0004886) |
| 0.1 | 0.5 | GO:0004176 | ATP-dependent peptidase activity(GO:0004176) |
| 0.1 | 1.7 | GO:0031386 | protein tag(GO:0031386) |
| 0.1 | 2.3 | GO:0003950 | NAD+ ADP-ribosyltransferase activity(GO:0003950) |
| 0.1 | 0.6 | GO:0046935 | 1-phosphatidylinositol-3-kinase regulator activity(GO:0046935) |
| 0.1 | 6.5 | GO:0004252 | serine-type endopeptidase activity(GO:0004252) |
| 0.1 | 0.3 | GO:0005324 | long-chain fatty acid transporter activity(GO:0005324) |
| 0.1 | 1.5 | GO:1900750 | glutathione binding(GO:0043295) oligopeptide binding(GO:1900750) |
| 0.1 | 0.2 | GO:0097108 | hedgehog family protein binding(GO:0097108) |
| 0.1 | 0.5 | GO:0034046 | poly(G) binding(GO:0034046) |
| 0.1 | 1.1 | GO:0005104 | fibroblast growth factor receptor binding(GO:0005104) |
| 0.0 | 0.7 | GO:0019215 | intermediate filament binding(GO:0019215) |
| 0.0 | 0.6 | GO:0038191 | neuropilin binding(GO:0038191) |
| 0.0 | 0.4 | GO:0003707 | steroid hormone receptor activity(GO:0003707) |
| 0.0 | 2.4 | GO:0003684 | damaged DNA binding(GO:0003684) |
| 0.0 | 0.6 | GO:0008253 | 5'-nucleotidase activity(GO:0008253) |
| 0.0 | 1.3 | GO:0005154 | epidermal growth factor receptor binding(GO:0005154) |
| 0.0 | 1.2 | GO:0008028 | monocarboxylic acid transmembrane transporter activity(GO:0008028) |
| 0.0 | 1.0 | GO:0043425 | bHLH transcription factor binding(GO:0043425) |
| 0.0 | 0.3 | GO:0004602 | glutathione peroxidase activity(GO:0004602) |
| 0.0 | 0.1 | GO:0004568 | chitinase activity(GO:0004568) |
| 0.0 | 0.8 | GO:0001103 | RNA polymerase II repressing transcription factor binding(GO:0001103) |
| 0.0 | 14.3 | GO:0008270 | zinc ion binding(GO:0008270) |
| 0.0 | 1.4 | GO:0004519 | endonuclease activity(GO:0004519) |
| 0.0 | 0.9 | GO:0019888 | protein phosphatase regulator activity(GO:0019888) |
Gene overrepresentation in C2:CP category:
| Log-likelihood per target | Total log-likelihood | Term | Description |
|---|---|---|---|
| 0.1 | 4.1 | PID_A6B1_A6B4_INTEGRIN_PATHWAY | a6b1 and a6b4 Integrin signaling |
| 0.0 | 2.1 | PID_P75_NTR_PATHWAY | p75(NTR)-mediated signaling |
| 0.0 | 1.1 | PID_FOXO_PATHWAY | FoxO family signaling |
| 0.0 | 0.6 | PID_NEPHRIN_NEPH1_PATHWAY | Nephrin/Neph1 signaling in the kidney podocyte |
| 0.0 | 1.1 | PID_SHP2_PATHWAY | SHP2 signaling |
| 0.0 | 1.0 | PID_HES_HEY_PATHWAY | Notch-mediated HES/HEY network |
| 0.0 | 2.5 | PID_P53_DOWNSTREAM_PATHWAY | Direct p53 effectors |
Gene overrepresentation in C2:CP:REACTOME category:
| Log-likelihood per target | Total log-likelihood | Term | Description |
|---|---|---|---|
| 0.1 | 2.4 | REACTOME_FORMATION_OF_INCISION_COMPLEX_IN_GG_NER | Genes involved in Formation of incision complex in GG-NER |
| 0.1 | 1.9 | REACTOME_GLUTATHIONE_CONJUGATION | Genes involved in Glutathione conjugation |
| 0.1 | 0.6 | REACTOME_PYRIMIDINE_CATABOLISM | Genes involved in Pyrimidine catabolism |
| 0.1 | 0.8 | REACTOME_HDL_MEDIATED_LIPID_TRANSPORT | Genes involved in HDL-mediated lipid transport |
| 0.1 | 0.6 | REACTOME_IL_7_SIGNALING | Genes involved in Interleukin-7 signaling |
| 0.0 | 1.1 | REACTOME_FRS2_MEDIATED_CASCADE | Genes involved in FRS2-mediated cascade |
| 0.0 | 1.6 | REACTOME_NUCLEAR_RECEPTOR_TRANSCRIPTION_PATHWAY | Genes involved in Nuclear Receptor transcription pathway |
| 0.0 | 0.6 | REACTOME_OTHER_SEMAPHORIN_INTERACTIONS | Genes involved in Other semaphorin interactions |
| 0.0 | 0.3 | REACTOME_ABCA_TRANSPORTERS_IN_LIPID_HOMEOSTASIS | Genes involved in ABCA transporters in lipid homeostasis |
| 0.0 | 2.1 | REACTOME_P75_NTR_RECEPTOR_MEDIATED_SIGNALLING | Genes involved in p75 NTR receptor-mediated signalling |
| 0.0 | 0.4 | REACTOME_G_BETA_GAMMA_SIGNALLING_THROUGH_PLC_BETA | Genes involved in G beta:gamma signalling through PLC beta |