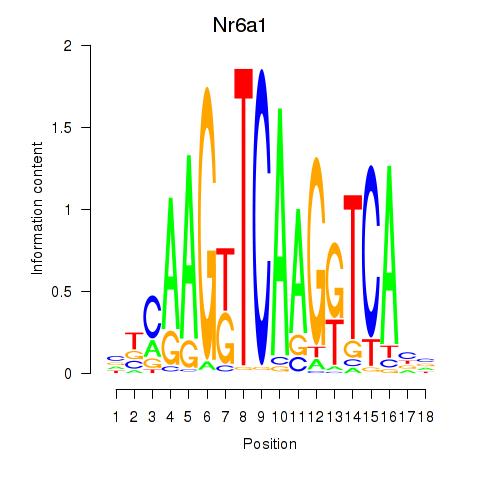
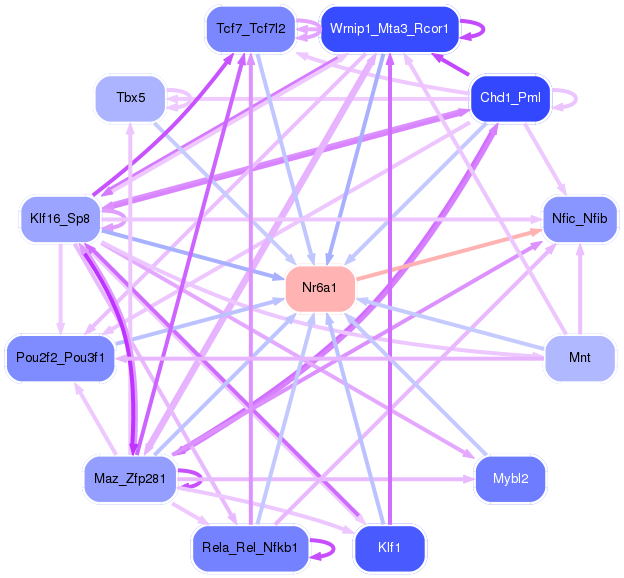
Motif ID: Nr6a1
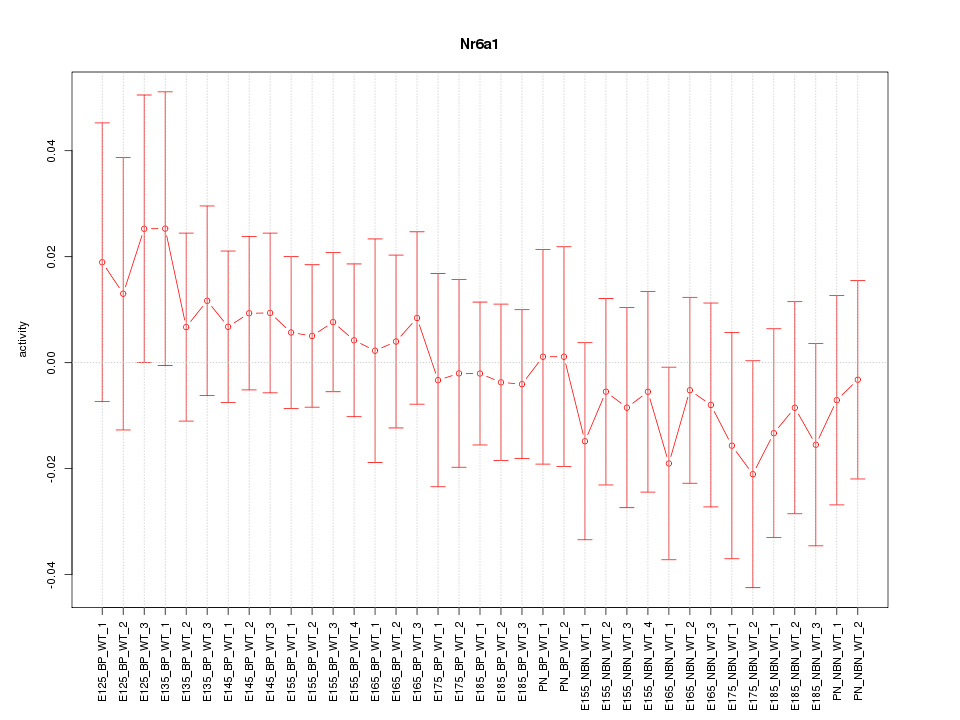
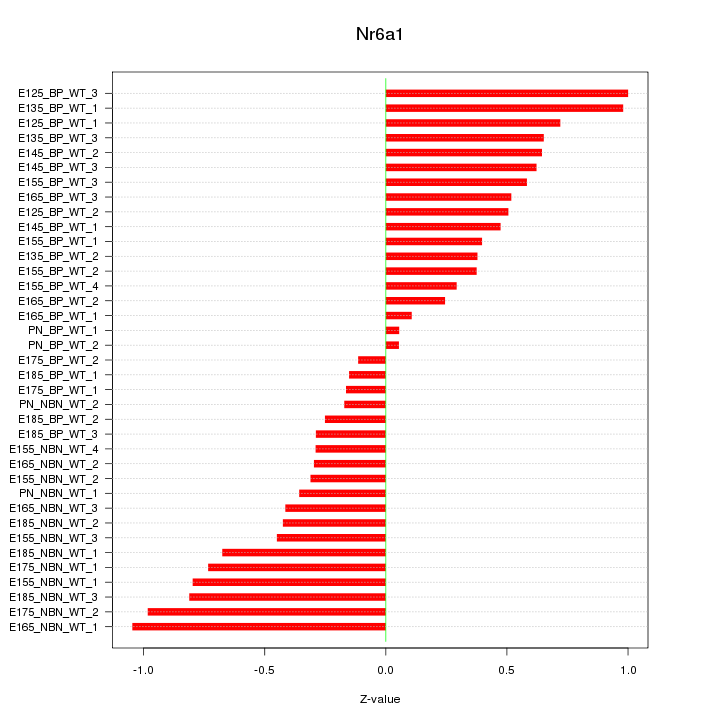
Z-value: 0.544
Transcription factors associated with Nr6a1:
| Gene Symbol | Entrez ID | Gene Name |
|---|---|---|
| Nr6a1 | ENSMUSG00000063972.7 | Nr6a1 |
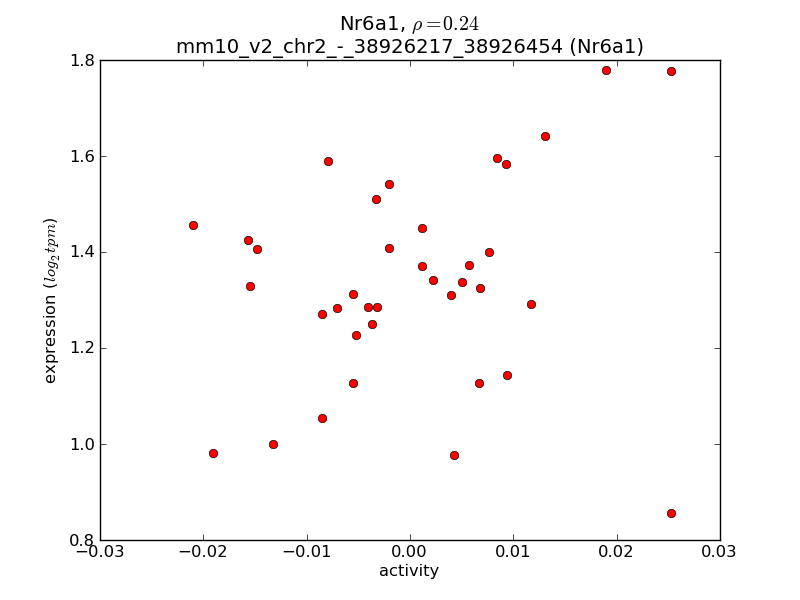
Activity-expression correlation:
| Gene Symbol | Promoter | Pearson corr. coef. | P-value | Plot |
|---|---|---|---|---|
| Nr6a1 | mm10_v2_chr2_-_38926217_38926454 | 0.24 | 1.6e-01 | Click! |

Top targets:
Gene overrepresentation in biological_process category:
| Log-likelihood per target | Total log-likelihood | Term | Description |
|---|---|---|---|
| 0.5 | 2.7 | GO:1904672 | regulation of somatic stem cell population maintenance(GO:1904672) |
| 0.5 | 2.1 | GO:0010757 | negative regulation of plasminogen activation(GO:0010757) |
| 0.4 | 2.0 | GO:0098706 | ferric iron import into cell(GO:0097461) ferric iron import across plasma membrane(GO:0098706) |
| 0.4 | 3.3 | GO:1900194 | negative regulation of oocyte maturation(GO:1900194) |
| 0.2 | 0.6 | GO:0009838 | abscission(GO:0009838) |
| 0.2 | 1.0 | GO:0046078 | dUMP metabolic process(GO:0046078) |
| 0.2 | 1.4 | GO:0044027 | hypermethylation of CpG island(GO:0044027) |
| 0.2 | 2.1 | GO:0009404 | toxin metabolic process(GO:0009404) |
| 0.2 | 0.7 | GO:0006933 | negative regulation of cell adhesion involved in substrate-bound cell migration(GO:0006933) |
| 0.1 | 1.2 | GO:0045198 | establishment of epithelial cell apical/basal polarity(GO:0045198) |
| 0.1 | 0.5 | GO:0051902 | negative regulation of mitochondrial depolarization(GO:0051902) negative regulation of membrane depolarization(GO:1904180) |
| 0.1 | 0.4 | GO:2000795 | negative regulation of epithelial cell proliferation involved in lung morphogenesis(GO:2000795) |
| 0.1 | 0.2 | GO:0048209 | regulation of vesicle targeting, to, from or within Golgi(GO:0048209) |
| 0.1 | 0.4 | GO:0006741 | NADP biosynthetic process(GO:0006741) |
| 0.1 | 0.4 | GO:0035087 | siRNA loading onto RISC involved in RNA interference(GO:0035087) |
| 0.1 | 0.2 | GO:0044830 | modulation by host of viral RNA genome replication(GO:0044830) |
| 0.1 | 2.8 | GO:1901998 | toxin transport(GO:1901998) |
| 0.0 | 0.7 | GO:0060837 | blood vessel endothelial cell differentiation(GO:0060837) |
| 0.0 | 2.8 | GO:0006749 | glutathione metabolic process(GO:0006749) |
| 0.0 | 0.4 | GO:0070317 | negative regulation of G0 to G1 transition(GO:0070317) |
| 0.0 | 0.1 | GO:0042938 | dipeptide transport(GO:0042938) |
| 0.0 | 1.9 | GO:0008156 | negative regulation of DNA replication(GO:0008156) |
| 0.0 | 1.5 | GO:0086010 | membrane depolarization during action potential(GO:0086010) |
| 0.0 | 0.3 | GO:0003214 | cardiac left ventricle morphogenesis(GO:0003214) |
| 0.0 | 0.4 | GO:2001273 | regulation of glucose import in response to insulin stimulus(GO:2001273) |
| 0.0 | 0.3 | GO:0015693 | magnesium ion transport(GO:0015693) |
| 0.0 | 0.3 | GO:0071549 | cellular response to dexamethasone stimulus(GO:0071549) |
| 0.0 | 0.7 | GO:0003341 | cilium movement(GO:0003341) |
| 0.0 | 0.4 | GO:0007094 | mitotic spindle assembly checkpoint(GO:0007094) spindle assembly checkpoint(GO:0071173) |
Gene overrepresentation in cellular_component category:
| Log-likelihood per target | Total log-likelihood | Term | Description |
|---|---|---|---|
| 0.2 | 2.1 | GO:0031232 | extrinsic component of external side of plasma membrane(GO:0031232) |
| 0.1 | 0.7 | GO:0045261 | mitochondrial proton-transporting ATP synthase complex, catalytic core F(1)(GO:0000275) proton-transporting ATP synthase complex, catalytic core F(1)(GO:0045261) |
| 0.1 | 1.2 | GO:0044453 | nuclear membrane part(GO:0044453) |
| 0.1 | 0.6 | GO:0070652 | HAUS complex(GO:0070652) |
| 0.1 | 0.4 | GO:0045179 | apical cortex(GO:0045179) |
| 0.1 | 2.0 | GO:0030140 | trans-Golgi network transport vesicle(GO:0030140) |
| 0.1 | 0.6 | GO:0090543 | Flemming body(GO:0090543) |
| 0.1 | 1.4 | GO:0001741 | XY body(GO:0001741) |
| 0.0 | 0.6 | GO:0016442 | RISC complex(GO:0016442) RNAi effector complex(GO:0031332) |
| 0.0 | 0.2 | GO:1990761 | growth cone lamellipodium(GO:1990761) growth cone filopodium(GO:1990812) |
| 0.0 | 0.6 | GO:0008074 | guanylate cyclase complex, soluble(GO:0008074) |
| 0.0 | 0.4 | GO:0000812 | Swr1 complex(GO:0000812) |
| 0.0 | 2.7 | GO:0000932 | cytoplasmic mRNA processing body(GO:0000932) |
| 0.0 | 1.5 | GO:0005871 | kinesin complex(GO:0005871) |
| 0.0 | 0.4 | GO:0044300 | cerebellar mossy fiber(GO:0044300) |
| 0.0 | 0.3 | GO:0042555 | MCM complex(GO:0042555) |
| 0.0 | 0.2 | GO:0042571 | immunoglobulin complex, circulating(GO:0042571) |
| 0.0 | 3.5 | GO:0005759 | mitochondrial matrix(GO:0005759) |
| 0.0 | 0.4 | GO:0034451 | centriolar satellite(GO:0034451) |
| 0.0 | 0.5 | GO:0002102 | podosome(GO:0002102) |
| 0.0 | 0.7 | GO:0030286 | dynein complex(GO:0030286) |
Gene overrepresentation in molecular_function category:
| Log-likelihood per target | Total log-likelihood | Term | Description |
|---|---|---|---|
| 0.7 | 2.0 | GO:0008823 | cupric reductase activity(GO:0008823) ferric-chelate reductase (NADPH) activity(GO:0052851) |
| 0.4 | 1.5 | GO:0072345 | NAADP-sensitive calcium-release channel activity(GO:0072345) |
| 0.2 | 1.4 | GO:0003886 | DNA (cytosine-5-)-methyltransferase activity(GO:0003886) |
| 0.1 | 2.8 | GO:0015035 | protein disulfide oxidoreductase activity(GO:0015035) |
| 0.1 | 0.7 | GO:0004809 | tRNA (guanine-N2-)-methyltransferase activity(GO:0004809) |
| 0.1 | 0.7 | GO:0043532 | angiostatin binding(GO:0043532) |
| 0.1 | 0.6 | GO:0016941 | natriuretic peptide receptor activity(GO:0016941) |
| 0.1 | 0.6 | GO:0000340 | RNA 7-methylguanosine cap binding(GO:0000340) |
| 0.1 | 1.0 | GO:1990825 | sequence-specific mRNA binding(GO:1990825) |
| 0.1 | 2.7 | GO:0005070 | SH3/SH2 adaptor activity(GO:0005070) |
| 0.1 | 0.5 | GO:0071253 | connexin binding(GO:0071253) |
| 0.0 | 2.1 | GO:0004867 | serine-type endopeptidase inhibitor activity(GO:0004867) |
| 0.0 | 0.7 | GO:0045504 | dynein heavy chain binding(GO:0045504) |
| 0.0 | 0.1 | GO:0035673 | oligopeptide transmembrane transporter activity(GO:0035673) dipeptide transporter activity(GO:0042936) |
| 0.0 | 2.8 | GO:0004725 | protein tyrosine phosphatase activity(GO:0004725) |
| 0.0 | 1.9 | GO:0070491 | repressing transcription factor binding(GO:0070491) |
| 0.0 | 0.4 | GO:0003951 | NAD+ kinase activity(GO:0003951) |
| 0.0 | 1.5 | GO:0003777 | microtubule motor activity(GO:0003777) |
| 0.0 | 0.3 | GO:0003688 | DNA replication origin binding(GO:0003688) |
| 0.0 | 0.3 | GO:0015095 | magnesium ion transmembrane transporter activity(GO:0015095) |
| 0.0 | 2.1 | GO:0008757 | S-adenosylmethionine-dependent methyltransferase activity(GO:0008757) |
| 0.0 | 0.4 | GO:0001106 | RNA polymerase II transcription corepressor activity(GO:0001106) |
| 0.0 | 0.3 | GO:0005104 | fibroblast growth factor receptor binding(GO:0005104) |
| 0.0 | 0.2 | GO:0034987 | immunoglobulin receptor binding(GO:0034987) |
| 0.0 | 0.5 | GO:0016504 | peptidase activator activity(GO:0016504) |
| 0.0 | 0.6 | GO:0004722 | protein serine/threonine phosphatase activity(GO:0004722) |
Gene overrepresentation in C2:CP category:
| Log-likelihood per target | Total log-likelihood | Term | Description |
|---|---|---|---|
| 0.1 | 2.7 | PID_PDGFRA_PATHWAY | PDGFR-alpha signaling pathway |
| 0.0 | 0.5 | PID_EPHA2_FWD_PATHWAY | EPHA2 forward signaling |
| 0.0 | 0.7 | PID_P38_MKK3_6PATHWAY | p38 MAPK signaling pathway |
| 0.0 | 1.4 | PID_MYC_REPRESS_PATHWAY | Validated targets of C-MYC transcriptional repression |
| 0.0 | 2.1 | NABA_ECM_REGULATORS | Genes encoding enzymes and their regulators involved in the remodeling of the extracellular matrix |
| 0.0 | 1.0 | PID_E2F_PATHWAY | E2F transcription factor network |
Gene overrepresentation in C2:CP:REACTOME category:
| Log-likelihood per target | Total log-likelihood | Term | Description |
|---|---|---|---|
| 0.1 | 1.9 | REACTOME_ASSOCIATION_OF_LICENSING_FACTORS_WITH_THE_PRE_REPLICATIVE_COMPLEX | Genes involved in Association of licensing factors with the pre-replicative complex |
| 0.1 | 1.0 | REACTOME_G1_S_SPECIFIC_TRANSCRIPTION | Genes involved in G1/S-Specific Transcription |
| 0.1 | 1.5 | REACTOME_KINESINS | Genes involved in Kinesins |
| 0.0 | 0.5 | REACTOME_P130CAS_LINKAGE_TO_MAPK_SIGNALING_FOR_INTEGRINS | Genes involved in p130Cas linkage to MAPK signaling for integrins |
| 0.0 | 0.3 | REACTOME_FGFR4_LIGAND_BINDING_AND_ACTIVATION | Genes involved in FGFR4 ligand binding and activation |
| 0.0 | 0.7 | REACTOME_FORMATION_OF_ATP_BY_CHEMIOSMOTIC_COUPLING | Genes involved in Formation of ATP by chemiosmotic coupling |
| 0.0 | 0.3 | REACTOME_UNWINDING_OF_DNA | Genes involved in Unwinding of DNA |
| 0.0 | 0.3 | REACTOME_MTORC1_MEDIATED_SIGNALLING | Genes involved in mTORC1-mediated signalling |
| 0.0 | 0.4 | REACTOME_RNA_POL_III_TRANSCRIPTION_TERMINATION | Genes involved in RNA Polymerase III Transcription Termination |