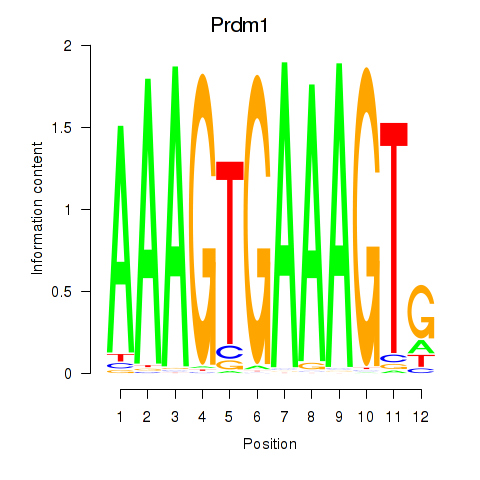
Motif ID: Prdm1
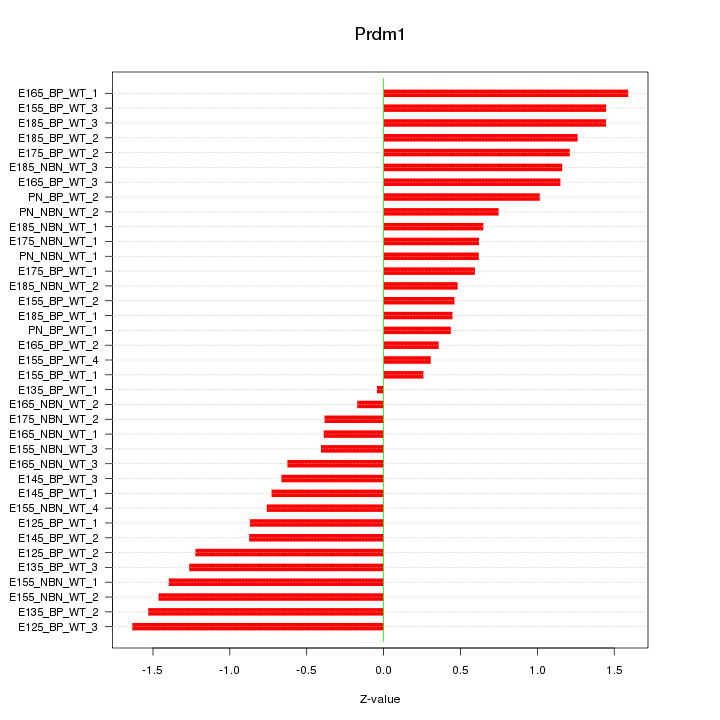
Z-value: 0.942
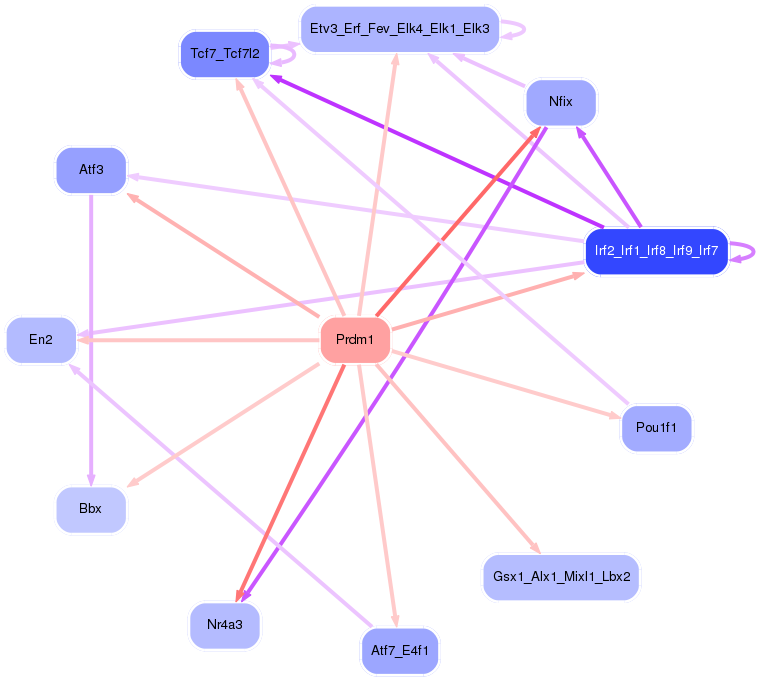
Transcription factors associated with Prdm1:
| Gene Symbol | Entrez ID | Gene Name |
|---|---|---|
| Prdm1 | ENSMUSG00000038151.6 | Prdm1 |


Top targets:
Gene overrepresentation in biological_process category:
| Log-likelihood per target | Total log-likelihood | Term | Description |
|---|---|---|---|
| 2.2 | 6.5 | GO:0032765 | positive regulation of mast cell cytokine production(GO:0032765) |
| 1.6 | 4.9 | GO:1904139 | microglial cell migration(GO:1904124) regulation of microglial cell migration(GO:1904139) |
| 1.2 | 3.6 | GO:0006001 | fructose catabolic process(GO:0006001) fructose catabolic process to hydroxyacetone phosphate and glyceraldehyde-3-phosphate(GO:0061624) glycolytic process through fructose-1-phosphate(GO:0061625) |
| 1.1 | 3.4 | GO:0042196 | dichloromethane metabolic process(GO:0018900) chlorinated hydrocarbon metabolic process(GO:0042196) halogenated hydrocarbon metabolic process(GO:0042197) |
| 1.1 | 3.3 | GO:0006553 | lysine metabolic process(GO:0006553) |
| 0.8 | 6.7 | GO:0090336 | positive regulation of brown fat cell differentiation(GO:0090336) |
| 0.8 | 3.0 | GO:1903237 | negative regulation of leukocyte tethering or rolling(GO:1903237) |
| 0.7 | 2.0 | GO:0045349 | interferon-alpha biosynthetic process(GO:0045349) regulation of interferon-alpha biosynthetic process(GO:0045354) |
| 0.7 | 2.6 | GO:1903416 | response to glycoside(GO:1903416) |
| 0.6 | 3.1 | GO:0015817 | glutamine transport(GO:0006868) histidine transport(GO:0015817) cellular response to potassium ion starvation(GO:0051365) |
| 0.6 | 4.2 | GO:0044838 | cell quiescence(GO:0044838) |
| 0.6 | 10.9 | GO:0021684 | cerebellar granular layer formation(GO:0021684) cerebellar granule cell differentiation(GO:0021707) |
| 0.5 | 1.4 | GO:0043181 | vacuolar sequestering(GO:0043181) |
| 0.4 | 1.3 | GO:1903225 | negative regulation of endodermal cell differentiation(GO:1903225) |
| 0.4 | 1.4 | GO:1903984 | positive regulation of TRAIL-activated apoptotic signaling pathway(GO:1903984) |
| 0.3 | 2.3 | GO:0042760 | very long-chain fatty acid catabolic process(GO:0042760) |
| 0.2 | 3.7 | GO:0021902 | commitment of neuronal cell to specific neuron type in forebrain(GO:0021902) |
| 0.2 | 1.5 | GO:0043553 | negative regulation of phosphatidylinositol 3-kinase activity(GO:0043553) |
| 0.2 | 0.6 | GO:2001180 | negative regulation of interleukin-10 secretion(GO:2001180) |
| 0.2 | 0.6 | GO:0061762 | CAMKK-AMPK signaling cascade(GO:0061762) |
| 0.2 | 3.4 | GO:2001275 | positive regulation of glucose import in response to insulin stimulus(GO:2001275) |
| 0.2 | 0.6 | GO:0021764 | amygdala development(GO:0021764) |
| 0.2 | 1.8 | GO:0019243 | methylglyoxal catabolic process to D-lactate via S-lactoyl-glutathione(GO:0019243) methylglyoxal catabolic process(GO:0051596) methylglyoxal catabolic process to lactate(GO:0061727) |
| 0.2 | 0.5 | GO:0046077 | dUDP biosynthetic process(GO:0006227) pyrimidine nucleoside diphosphate metabolic process(GO:0009138) pyrimidine nucleoside diphosphate biosynthetic process(GO:0009139) pyrimidine deoxyribonucleoside diphosphate metabolic process(GO:0009196) pyrimidine deoxyribonucleoside diphosphate biosynthetic process(GO:0009197) dUDP metabolic process(GO:0046077) |
| 0.2 | 1.7 | GO:0030432 | peristalsis(GO:0030432) |
| 0.2 | 6.6 | GO:0032728 | positive regulation of interferon-beta production(GO:0032728) |
| 0.2 | 0.8 | GO:0090370 | negative regulation of cholesterol efflux(GO:0090370) |
| 0.2 | 0.8 | GO:0098706 | ferric iron import into cell(GO:0097461) ferric iron import across plasma membrane(GO:0098706) |
| 0.2 | 1.1 | GO:0051611 | negative regulation of neurotransmitter uptake(GO:0051581) serotonin uptake(GO:0051610) regulation of serotonin uptake(GO:0051611) negative regulation of serotonin uptake(GO:0051612) |
| 0.2 | 1.7 | GO:0019885 | antigen processing and presentation of endogenous peptide antigen via MHC class I(GO:0019885) |
| 0.1 | 0.8 | GO:0002317 | plasma cell differentiation(GO:0002317) |
| 0.1 | 0.7 | GO:0000019 | regulation of mitotic recombination(GO:0000019) telomeric 3' overhang formation(GO:0031860) |
| 0.1 | 0.6 | GO:0090669 | snoRNA guided rRNA pseudouridine synthesis(GO:0000454) telomerase RNA stabilization(GO:0090669) |
| 0.1 | 1.2 | GO:0030322 | stabilization of membrane potential(GO:0030322) |
| 0.1 | 0.3 | GO:0042097 | interleukin-4 biosynthetic process(GO:0042097) regulation of interleukin-4 biosynthetic process(GO:0045402) |
| 0.1 | 0.4 | GO:0019355 | nicotinamide nucleotide biosynthetic process from aspartate(GO:0019355) 'de novo' NAD biosynthetic process(GO:0034627) 'de novo' NAD biosynthetic process from aspartate(GO:0034628) |
| 0.1 | 0.9 | GO:0060330 | regulation of response to interferon-gamma(GO:0060330) |
| 0.1 | 0.6 | GO:0070294 | renal sodium ion absorption(GO:0070294) |
| 0.1 | 0.6 | GO:0045919 | complement activation, alternative pathway(GO:0006957) positive regulation of cytolysis(GO:0045919) |
| 0.1 | 0.3 | GO:0016237 | lysosomal microautophagy(GO:0016237) piecemeal microautophagy of nucleus(GO:0034727) suppression by virus of host autophagy(GO:0039521) negative regulation of sphingolipid biosynthesis involved in cellular sphingolipid homeostasis(GO:0090157) |
| 0.1 | 0.5 | GO:0043569 | negative regulation of insulin-like growth factor receptor signaling pathway(GO:0043569) |
| 0.1 | 0.2 | GO:0033159 | negative regulation of protein import into nucleus, translocation(GO:0033159) |
| 0.1 | 0.6 | GO:0045065 | cytotoxic T cell differentiation(GO:0045065) |
| 0.1 | 0.6 | GO:0021984 | adenohypophysis development(GO:0021984) |
| 0.1 | 0.1 | GO:0071455 | cellular response to hyperoxia(GO:0071455) |
| 0.1 | 0.4 | GO:1904659 | glucose transmembrane transport(GO:1904659) |
| 0.1 | 0.2 | GO:1904430 | negative regulation of t-circle formation(GO:1904430) |
| 0.1 | 1.4 | GO:0071577 | zinc II ion transmembrane transport(GO:0071577) |
| 0.1 | 0.6 | GO:0046459 | short-chain fatty acid metabolic process(GO:0046459) |
| 0.1 | 0.5 | GO:0043383 | negative T cell selection(GO:0043383) negative thymic T cell selection(GO:0045060) |
| 0.1 | 0.3 | GO:2000508 | regulation of dendritic cell chemotaxis(GO:2000508) |
| 0.1 | 0.8 | GO:0046519 | sphingoid metabolic process(GO:0046519) |
| 0.1 | 1.5 | GO:1900027 | regulation of ruffle assembly(GO:1900027) |
| 0.1 | 0.7 | GO:0014842 | regulation of skeletal muscle satellite cell proliferation(GO:0014842) |
| 0.1 | 0.4 | GO:0048625 | myoblast fate commitment(GO:0048625) |
| 0.1 | 0.2 | GO:0070197 | meiotic telomere tethering at nuclear periphery(GO:0044821) meiotic attachment of telomere to nuclear envelope(GO:0070197) chromosome attachment to the nuclear envelope(GO:0097240) |
| 0.0 | 0.2 | GO:0036337 | Fas signaling pathway(GO:0036337) |
| 0.0 | 0.9 | GO:0019884 | antigen processing and presentation of exogenous antigen(GO:0019884) |
| 0.0 | 0.3 | GO:0042126 | nitrate metabolic process(GO:0042126) |
| 0.0 | 0.3 | GO:0032782 | bile acid secretion(GO:0032782) |
| 0.0 | 0.2 | GO:0010756 | positive regulation of plasminogen activation(GO:0010756) |
| 0.0 | 0.4 | GO:0010571 | positive regulation of nuclear cell cycle DNA replication(GO:0010571) |
| 0.0 | 0.6 | GO:2000696 | regulation of epithelial cell differentiation involved in kidney development(GO:2000696) |
| 0.0 | 0.6 | GO:1990403 | embryonic brain development(GO:1990403) |
| 0.0 | 2.6 | GO:0050868 | negative regulation of T cell activation(GO:0050868) |
| 0.0 | 0.4 | GO:0006450 | regulation of translational fidelity(GO:0006450) |
| 0.0 | 0.1 | GO:0090646 | RNA 5'-end processing(GO:0000966) mitochondrial tRNA processing(GO:0090646) |
| 0.0 | 0.2 | GO:0035878 | nail development(GO:0035878) |
| 0.0 | 0.1 | GO:0009794 | regulation of mitotic cell cycle, embryonic(GO:0009794) mitotic cell cycle, embryonic(GO:0045448) |
| 0.0 | 0.3 | GO:0000712 | resolution of meiotic recombination intermediates(GO:0000712) |
| 0.0 | 0.2 | GO:0045716 | positive regulation of low-density lipoprotein particle receptor biosynthetic process(GO:0045716) |
| 0.0 | 0.3 | GO:0006268 | DNA unwinding involved in DNA replication(GO:0006268) |
| 0.0 | 0.1 | GO:0010701 | positive regulation of norepinephrine secretion(GO:0010701) |
| 0.0 | 0.1 | GO:0070358 | actin polymerization-dependent cell motility(GO:0070358) |
| 0.0 | 0.1 | GO:0061537 | glycine secretion(GO:0061536) glycine secretion, neurotransmission(GO:0061537) |
| 0.0 | 0.5 | GO:0006828 | manganese ion transport(GO:0006828) |
| 0.0 | 0.1 | GO:0051013 | microtubule severing(GO:0051013) |
| 0.0 | 0.2 | GO:0071907 | determination of digestive tract left/right asymmetry(GO:0071907) |
| 0.0 | 0.1 | GO:0070682 | proteasome regulatory particle assembly(GO:0070682) |
| 0.0 | 0.1 | GO:0006689 | ganglioside catabolic process(GO:0006689) oligosaccharide catabolic process(GO:0009313) |
| 0.0 | 3.0 | GO:0048814 | regulation of dendrite morphogenesis(GO:0048814) |
| 0.0 | 0.1 | GO:1904721 | regulation of mRNA cleavage(GO:0031437) negative regulation of mRNA cleavage(GO:0031438) negative regulation of immunoglobulin secretion(GO:0051025) regulation of mRNA endonucleolytic cleavage involved in unfolded protein response(GO:1904720) negative regulation of mRNA endonucleolytic cleavage involved in unfolded protein response(GO:1904721) |
| 0.0 | 1.3 | GO:0051896 | regulation of protein kinase B signaling(GO:0051896) |
| 0.0 | 0.2 | GO:0050930 | induction of positive chemotaxis(GO:0050930) |
| 0.0 | 0.2 | GO:0070932 | histone H3 deacetylation(GO:0070932) |
| 0.0 | 0.8 | GO:0006289 | nucleotide-excision repair(GO:0006289) |
| 0.0 | 0.4 | GO:0046677 | response to antibiotic(GO:0046677) |
| 0.0 | 0.1 | GO:0000492 | box C/D snoRNP assembly(GO:0000492) |
| 0.0 | 0.2 | GO:0009451 | RNA modification(GO:0009451) |
| 0.0 | 1.8 | GO:0008654 | phospholipid biosynthetic process(GO:0008654) |
Gene overrepresentation in cellular_component category:
| Log-likelihood per target | Total log-likelihood | Term | Description |
|---|---|---|---|
| 1.5 | 4.6 | GO:1990682 | CSF1-CSF1R complex(GO:1990682) |
| 0.4 | 1.3 | GO:0005588 | collagen type V trimer(GO:0005588) |
| 0.4 | 2.6 | GO:0005890 | sodium:potassium-exchanging ATPase complex(GO:0005890) |
| 0.2 | 1.0 | GO:1990111 | spermatoproteasome complex(GO:1990111) |
| 0.2 | 0.9 | GO:0008537 | proteasome activator complex(GO:0008537) |
| 0.2 | 0.6 | GO:0090661 | box H/ACA telomerase RNP complex(GO:0090661) |
| 0.1 | 0.7 | GO:0030870 | Mre11 complex(GO:0030870) |
| 0.1 | 5.1 | GO:0005788 | endoplasmic reticulum lumen(GO:0005788) |
| 0.1 | 5.2 | GO:0016235 | aggresome(GO:0016235) |
| 0.1 | 0.7 | GO:0042824 | MHC class I peptide loading complex(GO:0042824) TAP complex(GO:0042825) |
| 0.1 | 0.3 | GO:0048476 | Holliday junction resolvase complex(GO:0048476) |
| 0.1 | 0.2 | GO:0043564 | Ku70:Ku80 complex(GO:0043564) |
| 0.1 | 0.8 | GO:0031588 | nucleotide-activated protein kinase complex(GO:0031588) |
| 0.0 | 2.9 | GO:0000307 | cyclin-dependent protein kinase holoenzyme complex(GO:0000307) |
| 0.0 | 0.4 | GO:0070369 | beta-catenin-TCF7L2 complex(GO:0070369) |
| 0.0 | 0.2 | GO:0034993 | microtubule organizing center attachment site(GO:0034992) LINC complex(GO:0034993) |
| 0.0 | 0.1 | GO:0071438 | invadopodium membrane(GO:0071438) |
| 0.0 | 3.7 | GO:0000118 | histone deacetylase complex(GO:0000118) |
| 0.0 | 3.5 | GO:0016363 | nuclear matrix(GO:0016363) |
| 0.0 | 1.5 | GO:0005834 | heterotrimeric G-protein complex(GO:0005834) |
| 0.0 | 0.4 | GO:0031011 | Ino80 complex(GO:0031011) |
| 0.0 | 0.1 | GO:0034457 | Mpp10 complex(GO:0034457) |
| 0.0 | 0.8 | GO:0030140 | trans-Golgi network transport vesicle(GO:0030140) |
| 0.0 | 0.6 | GO:0033270 | paranode region of axon(GO:0033270) |
| 0.0 | 0.3 | GO:0061700 | GATOR2 complex(GO:0061700) |
| 0.0 | 0.4 | GO:0010369 | chromocenter(GO:0010369) |
| 0.0 | 0.4 | GO:0005671 | Ada2/Gcn5/Ada3 transcription activator complex(GO:0005671) |
| 0.0 | 5.0 | GO:0009897 | external side of plasma membrane(GO:0009897) |
| 0.0 | 0.3 | GO:0042555 | MCM complex(GO:0042555) |
| 0.0 | 3.3 | GO:0005777 | peroxisome(GO:0005777) microbody(GO:0042579) |
| 0.0 | 7.3 | GO:0005925 | focal adhesion(GO:0005925) |
| 0.0 | 1.0 | GO:0031519 | PcG protein complex(GO:0031519) |
| 0.0 | 0.1 | GO:0005787 | signal peptidase complex(GO:0005787) |
| 0.0 | 0.3 | GO:0030133 | transport vesicle(GO:0030133) |
| 0.0 | 0.6 | GO:0072562 | blood microparticle(GO:0072562) |
| 0.0 | 0.8 | GO:0005811 | lipid particle(GO:0005811) |
| 0.0 | 0.5 | GO:0005801 | cis-Golgi network(GO:0005801) |
| 0.0 | 0.4 | GO:0031526 | brush border membrane(GO:0031526) |
| 0.0 | 0.2 | GO:0036038 | MKS complex(GO:0036038) |
| 0.0 | 2.2 | GO:0016323 | basolateral plasma membrane(GO:0016323) |
| 0.0 | 0.3 | GO:0000407 | pre-autophagosomal structure(GO:0000407) |
Gene overrepresentation in molecular_function category:
| Log-likelihood per target | Total log-likelihood | Term | Description |
|---|---|---|---|
| 1.4 | 4.2 | GO:0098770 | FBXO family protein binding(GO:0098770) |
| 1.2 | 3.6 | GO:0004454 | ketohexokinase activity(GO:0004454) |
| 1.1 | 3.4 | GO:0019120 | hydrolase activity, acting on acid halide bonds(GO:0016824) hydrolase activity, acting on acid halide bonds, in C-halide compounds(GO:0019120) alkylhalidase activity(GO:0047651) |
| 1.0 | 3.1 | GO:0015182 | L-asparagine transmembrane transporter activity(GO:0015182) |
| 0.8 | 3.3 | GO:0016647 | oxidoreductase activity, acting on the CH-NH group of donors, oxygen as acceptor(GO:0016647) |
| 0.5 | 1.5 | GO:0036313 | phosphatidylinositol 3-kinase catalytic subunit binding(GO:0036313) |
| 0.5 | 1.4 | GO:0004574 | oligo-1,6-glucosidase activity(GO:0004574) |
| 0.5 | 1.9 | GO:0019863 | IgE binding(GO:0019863) |
| 0.4 | 1.7 | GO:0001602 | pancreatic polypeptide receptor activity(GO:0001602) |
| 0.4 | 1.1 | GO:0016160 | alpha-amylase activity(GO:0004556) amylase activity(GO:0016160) |
| 0.3 | 2.6 | GO:1990239 | steroid hormone binding(GO:1990239) |
| 0.3 | 3.0 | GO:0045236 | CXCR chemokine receptor binding(GO:0045236) |
| 0.3 | 2.7 | GO:0005068 | transmembrane receptor protein tyrosine kinase adaptor activity(GO:0005068) |
| 0.3 | 0.8 | GO:0008823 | cupric reductase activity(GO:0008823) ferric-chelate reductase (NADPH) activity(GO:0052851) |
| 0.2 | 1.8 | GO:0004416 | hydroxyacylglutathione hydrolase activity(GO:0004416) |
| 0.2 | 4.0 | GO:0003950 | NAD+ ADP-ribosyltransferase activity(GO:0003950) |
| 0.2 | 0.5 | GO:0009041 | uridylate kinase activity(GO:0009041) |
| 0.2 | 0.8 | GO:0000405 | bubble DNA binding(GO:0000405) |
| 0.1 | 2.3 | GO:0016290 | palmitoyl-CoA hydrolase activity(GO:0016290) |
| 0.1 | 0.6 | GO:0001851 | complement component C3b binding(GO:0001851) |
| 0.1 | 0.4 | GO:1990050 | phosphatidic acid transporter activity(GO:1990050) |
| 0.1 | 4.5 | GO:0001223 | transcription coactivator binding(GO:0001223) |
| 0.1 | 0.7 | GO:0051880 | G-quadruplex DNA binding(GO:0051880) |
| 0.1 | 1.0 | GO:0005138 | interleukin-6 receptor binding(GO:0005138) |
| 0.1 | 0.6 | GO:0035174 | histone serine kinase activity(GO:0035174) |
| 0.1 | 0.7 | GO:0046978 | TAP1 binding(GO:0046978) TAP2 binding(GO:0046979) |
| 0.1 | 0.5 | GO:0072345 | NAADP-sensitive calcium-release channel activity(GO:0072345) |
| 0.1 | 1.2 | GO:0022841 | potassium ion leak channel activity(GO:0022841) |
| 0.1 | 0.4 | GO:0004515 | nicotinamide-nucleotide adenylyltransferase activity(GO:0000309) nicotinate-nucleotide adenylyltransferase activity(GO:0004515) |
| 0.1 | 0.4 | GO:0004035 | alkaline phosphatase activity(GO:0004035) |
| 0.1 | 0.9 | GO:0061133 | endopeptidase activator activity(GO:0061133) |
| 0.1 | 0.3 | GO:0019779 | Atg12 activating enzyme activity(GO:0019778) Atg8 activating enzyme activity(GO:0019779) |
| 0.1 | 0.6 | GO:0034513 | box H/ACA snoRNA binding(GO:0034513) |
| 0.1 | 1.3 | GO:0048407 | platelet-derived growth factor binding(GO:0048407) |
| 0.1 | 0.4 | GO:0004839 | ubiquitin activating enzyme activity(GO:0004839) |
| 0.1 | 0.3 | GO:0043546 | molybdenum ion binding(GO:0030151) molybdopterin cofactor binding(GO:0043546) |
| 0.1 | 1.8 | GO:0003841 | 1-acylglycerol-3-phosphate O-acyltransferase activity(GO:0003841) |
| 0.1 | 0.6 | GO:0031730 | CCR5 chemokine receptor binding(GO:0031730) |
| 0.1 | 0.8 | GO:0005149 | interleukin-1 receptor binding(GO:0005149) |
| 0.1 | 3.4 | GO:0016836 | hydro-lyase activity(GO:0016836) |
| 0.1 | 0.6 | GO:0004691 | cAMP-dependent protein kinase activity(GO:0004691) |
| 0.1 | 1.4 | GO:0005385 | zinc ion transmembrane transporter activity(GO:0005385) |
| 0.1 | 5.5 | GO:0033613 | activating transcription factor binding(GO:0033613) |
| 0.0 | 0.1 | GO:0030171 | voltage-gated proton channel activity(GO:0030171) |
| 0.0 | 3.4 | GO:0019843 | rRNA binding(GO:0019843) |
| 0.0 | 1.0 | GO:0004298 | threonine-type endopeptidase activity(GO:0004298) threonine-type peptidase activity(GO:0070003) |
| 0.0 | 7.7 | GO:0001078 | transcriptional repressor activity, RNA polymerase II core promoter proximal region sequence-specific binding(GO:0001078) |
| 0.0 | 0.8 | GO:0003995 | acyl-CoA dehydrogenase activity(GO:0003995) |
| 0.0 | 0.5 | GO:0015279 | store-operated calcium channel activity(GO:0015279) |
| 0.0 | 0.3 | GO:0008821 | crossover junction endodeoxyribonuclease activity(GO:0008821) |
| 0.0 | 0.3 | GO:0045028 | G-protein coupled nucleotide receptor activity(GO:0001608) G-protein coupled adenosine receptor activity(GO:0001609) G-protein coupled purinergic nucleotide receptor activity(GO:0045028) |
| 0.0 | 3.5 | GO:0005125 | cytokine activity(GO:0005125) |
| 0.0 | 0.5 | GO:0008349 | MAP kinase kinase kinase kinase activity(GO:0008349) |
| 0.0 | 0.3 | GO:0005212 | structural constituent of eye lens(GO:0005212) |
| 0.0 | 0.2 | GO:0032184 | SUMO polymer binding(GO:0032184) |
| 0.0 | 0.2 | GO:0051575 | 5'-deoxyribose-5-phosphate lyase activity(GO:0051575) |
| 0.0 | 13.4 | GO:0001228 | transcriptional activator activity, RNA polymerase II transcription regulatory region sequence-specific binding(GO:0001228) |
| 0.0 | 0.6 | GO:0004129 | cytochrome-c oxidase activity(GO:0004129) heme-copper terminal oxidase activity(GO:0015002) oxidoreductase activity, acting on a heme group of donors, oxygen as acceptor(GO:0016676) |
| 0.0 | 0.2 | GO:0004679 | AMP-activated protein kinase activity(GO:0004679) |
| 0.0 | 0.1 | GO:0035497 | cAMP response element binding(GO:0035497) |
| 0.0 | 0.4 | GO:0005355 | glucose transmembrane transporter activity(GO:0005355) |
| 0.0 | 0.7 | GO:0000978 | RNA polymerase II core promoter proximal region sequence-specific DNA binding(GO:0000978) |
| 0.0 | 0.3 | GO:0004559 | alpha-mannosidase activity(GO:0004559) |
| 0.0 | 1.3 | GO:0005179 | hormone activity(GO:0005179) |
| 0.0 | 0.1 | GO:0061578 | Lys63-specific deubiquitinase activity(GO:0061578) |
| 0.0 | 0.1 | GO:0008568 | microtubule-severing ATPase activity(GO:0008568) |
| 0.0 | 1.3 | GO:0019003 | GDP binding(GO:0019003) |
| 0.0 | 0.6 | GO:0071889 | 14-3-3 protein binding(GO:0071889) |
| 0.0 | 0.7 | GO:0042974 | retinoic acid receptor binding(GO:0042974) |
| 0.0 | 2.4 | GO:0030165 | PDZ domain binding(GO:0030165) |
| 0.0 | 0.2 | GO:0043495 | protein anchor(GO:0043495) |
| 0.0 | 0.7 | GO:0003678 | DNA helicase activity(GO:0003678) |
| 0.0 | 0.1 | GO:0015271 | outward rectifier potassium channel activity(GO:0015271) |
| 0.0 | 0.4 | GO:0017025 | TBP-class protein binding(GO:0017025) |
| 0.0 | 0.1 | GO:0060698 | endoribonuclease inhibitor activity(GO:0060698) |
| 0.0 | 0.1 | GO:0009019 | tRNA (guanine-N1-)-methyltransferase activity(GO:0009019) |
| 0.0 | 0.0 | GO:0070051 | fibrinogen binding(GO:0070051) |
| 0.0 | 0.2 | GO:0004435 | phosphatidylinositol phospholipase C activity(GO:0004435) phospholipase C activity(GO:0004629) |
Gene overrepresentation in C2:CP category:
| Log-likelihood per target | Total log-likelihood | Term | Description |
|---|---|---|---|
| 0.5 | 4.6 | SA_MMP_CYTOKINE_CONNECTION | Cytokines can induce activation of matrix metalloproteinases, which degrade extracellular matrix. |
| 0.1 | 4.7 | ST_GA12_PATHWAY | G alpha 12 Pathway |
| 0.1 | 2.2 | PID_SYNDECAN_2_PATHWAY | Syndecan-2-mediated signaling events |
| 0.1 | 3.0 | PID_SYNDECAN_4_PATHWAY | Syndecan-4-mediated signaling events |
| 0.1 | 4.2 | PID_IL2_STAT5_PATHWAY | IL2 signaling events mediated by STAT5 |
| 0.1 | 2.7 | PID_SHP2_PATHWAY | SHP2 signaling |
| 0.0 | 1.1 | PID_TOLL_ENDOGENOUS_PATHWAY | Endogenous TLR signaling |
| 0.0 | 1.9 | PID_FCER1_PATHWAY | Fc-epsilon receptor I signaling in mast cells |
| 0.0 | 1.3 | PID_RAS_PATHWAY | Regulation of Ras family activation |
| 0.0 | 1.5 | PID_TRKR_PATHWAY | Neurotrophic factor-mediated Trk receptor signaling |
| 0.0 | 1.3 | PID_DELTA_NP63_PATHWAY | Validated transcriptional targets of deltaNp63 isoforms |
| 0.0 | 0.6 | PID_CD8_TCR_PATHWAY | TCR signaling in naïve CD8+ T cells |
| 0.0 | 1.7 | PID_AP1_PATHWAY | AP-1 transcription factor network |
| 0.0 | 0.5 | ST_T_CELL_SIGNAL_TRANSDUCTION | T Cell Signal Transduction |
| 0.0 | 0.2 | SA_PROGRAMMED_CELL_DEATH | Programmed cell death, or apoptosis, eliminates damaged or unneeded cells. |
| 0.0 | 0.7 | PID_ATM_PATHWAY | ATM pathway |
| 0.0 | 0.6 | PID_ECADHERIN_STABILIZATION_PATHWAY | Stabilization and expansion of the E-cadherin adherens junction |
| 0.0 | 0.6 | PID_ARF6_PATHWAY | Arf6 signaling events |
| 0.0 | 1.2 | PID_BETA_CATENIN_NUC_PATHWAY | Regulation of nuclear beta catenin signaling and target gene transcription |
| 0.0 | 0.8 | PID_LKB1_PATHWAY | LKB1 signaling events |
| 0.0 | 0.6 | PID_HES_HEY_PATHWAY | Notch-mediated HES/HEY network |
| 0.0 | 0.5 | PID_TELOMERASE_PATHWAY | Regulation of Telomerase |
Gene overrepresentation in C2:CP:REACTOME category:
| Log-likelihood per target | Total log-likelihood | Term | Description |
|---|---|---|---|
| 0.3 | 2.7 | REACTOME_PHOSPHORYLATION_OF_CD3_AND_TCR_ZETA_CHAINS | Genes involved in Phosphorylation of CD3 and TCR zeta chains |
| 0.2 | 1.2 | REACTOME_TANDEM_PORE_DOMAIN_POTASSIUM_CHANNELS | Genes involved in Tandem pore domain potassium channels |
| 0.2 | 3.5 | REACTOME_HS_GAG_DEGRADATION | Genes involved in HS-GAG degradation |
| 0.1 | 1.9 | REACTOME_PLATELET_ADHESION_TO_EXPOSED_COLLAGEN | Genes involved in Platelet Adhesion to exposed collagen |
| 0.1 | 0.8 | REACTOME_TRAF6_MEDIATED_IRF7_ACTIVATION_IN_TLR7_8_OR_9_SIGNALING | Genes involved in TRAF6 mediated IRF7 activation in TLR7/8 or 9 signaling |
| 0.1 | 0.6 | REACTOME_REGULATION_OF_COMPLEMENT_CASCADE | Genes involved in Regulation of Complement cascade |
| 0.1 | 4.4 | REACTOME_INTERFERON_ALPHA_BETA_SIGNALING | Genes involved in Interferon alpha/beta signaling |
| 0.1 | 2.4 | REACTOME_CHEMOKINE_RECEPTORS_BIND_CHEMOKINES | Genes involved in Chemokine receptors bind chemokines |
| 0.1 | 1.3 | REACTOME_SEMA3A_PLEXIN_REPULSION_SIGNALING_BY_INHIBITING_INTEGRIN_ADHESION | Genes involved in SEMA3A-Plexin repulsion signaling by inhibiting Integrin adhesion |
| 0.1 | 4.2 | REACTOME_G1_PHASE | Genes involved in G1 Phase |
| 0.1 | 3.1 | REACTOME_AMINO_ACID_TRANSPORT_ACROSS_THE_PLASMA_MEMBRANE | Genes involved in Amino acid transport across the plasma membrane |
| 0.1 | 0.5 | REACTOME_ELEVATION_OF_CYTOSOLIC_CA2_LEVELS | Genes involved in Elevation of cytosolic Ca2+ levels |
| 0.1 | 2.6 | REACTOME_ION_TRANSPORT_BY_P_TYPE_ATPASES | Genes involved in Ion transport by P-type ATPases |
| 0.1 | 4.5 | REACTOME_NUCLEAR_RECEPTOR_TRANSCRIPTION_PATHWAY | Genes involved in Nuclear Receptor transcription pathway |
| 0.1 | 0.8 | REACTOME_REGULATION_OF_RHEB_GTPASE_ACTIVITY_BY_AMPK | Genes involved in Regulation of Rheb GTPase activity by AMPK |
| 0.1 | 1.4 | REACTOME_ACTIVATION_OF_GENES_BY_ATF4 | Genes involved in Activation of Genes by ATF4 |
| 0.1 | 1.8 | REACTOME_SYNTHESIS_OF_PA | Genes involved in Synthesis of PA |
| 0.1 | 1.7 | REACTOME_ADP_SIGNALLING_THROUGH_P2RY12 | Genes involved in ADP signalling through P2Y purinoceptor 12 |
| 0.1 | 1.0 | REACTOME_ANTIGEN_PRESENTATION_FOLDING_ASSEMBLY_AND_PEPTIDE_LOADING_OF_CLASS_I_MHC | Genes involved in Antigen Presentation: Folding, assembly and peptide loading of class I MHC |
| 0.0 | 1.5 | REACTOME_SEMA4D_INDUCED_CELL_MIGRATION_AND_GROWTH_CONE_COLLAPSE | Genes involved in Sema4D induced cell migration and growth-cone collapse |
| 0.0 | 0.3 | REACTOME_PASSIVE_TRANSPORT_BY_AQUAPORINS | Genes involved in Passive Transport by Aquaporins |
| 0.0 | 0.3 | REACTOME_TRAF6_MEDIATED_INDUCTION_OF_TAK1_COMPLEX | Genes involved in TRAF6 mediated induction of TAK1 complex |
| 0.0 | 0.7 | REACTOME_HOMOLOGOUS_RECOMBINATION_REPAIR_OF_REPLICATION_INDEPENDENT_DOUBLE_STRAND_BREAKS | Genes involved in Homologous recombination repair of replication-independent double-strand breaks |
| 0.0 | 0.6 | REACTOME_IMMUNOREGULATORY_INTERACTIONS_BETWEEN_A_LYMPHOID_AND_A_NON_LYMPHOID_CELL | Genes involved in Immunoregulatory interactions between a Lymphoid and a non-Lymphoid cell |
| 0.0 | 1.7 | REACTOME_AUTODEGRADATION_OF_THE_E3_UBIQUITIN_LIGASE_COP1 | Genes involved in Autodegradation of the E3 ubiquitin ligase COP1 |
| 0.0 | 0.7 | REACTOME_CELL_EXTRACELLULAR_MATRIX_INTERACTIONS | Genes involved in Cell-extracellular matrix interactions |
| 0.0 | 1.1 | REACTOME_NCAM1_INTERACTIONS | Genes involved in NCAM1 interactions |
| 0.0 | 0.4 | REACTOME_MITOCHONDRIAL_FATTY_ACID_BETA_OXIDATION | Genes involved in Mitochondrial Fatty Acid Beta-Oxidation |
| 0.0 | 0.5 | REACTOME_SYNTHESIS_AND_INTERCONVERSION_OF_NUCLEOTIDE_DI_AND_TRIPHOSPHATES | Genes involved in Synthesis and interconversion of nucleotide di- and triphosphates |
| 0.0 | 0.8 | REACTOME_SPHINGOLIPID_DE_NOVO_BIOSYNTHESIS | Genes involved in Sphingolipid de novo biosynthesis |
| 0.0 | 0.2 | REACTOME_DOUBLE_STRAND_BREAK_REPAIR | Genes involved in Double-Strand Break Repair |
| 0.0 | 1.7 | REACTOME_G_ALPHA_I_SIGNALLING_EVENTS | Genes involved in G alpha (i) signalling events |
| 0.0 | 0.5 | REACTOME_EXTENSION_OF_TELOMERES | Genes involved in Extension of Telomeres |
| 0.0 | 0.3 | REACTOME_UNWINDING_OF_DNA | Genes involved in Unwinding of DNA |
| 0.0 | 0.1 | REACTOME_NA_CL_DEPENDENT_NEUROTRANSMITTER_TRANSPORTERS | Genes involved in Na+/Cl- dependent neurotransmitter transporters |
| 0.0 | 2.4 | REACTOME_METABOLISM_OF_CARBOHYDRATES | Genes involved in Metabolism of carbohydrates |