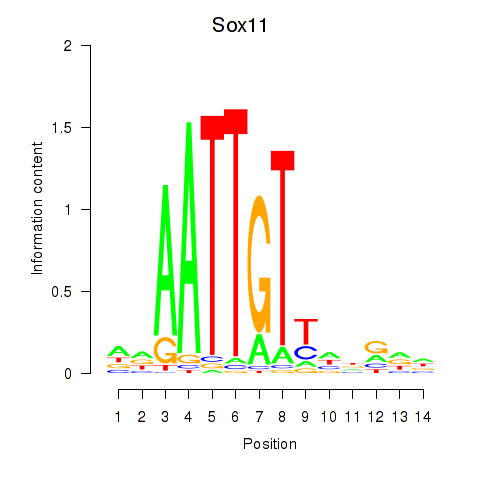
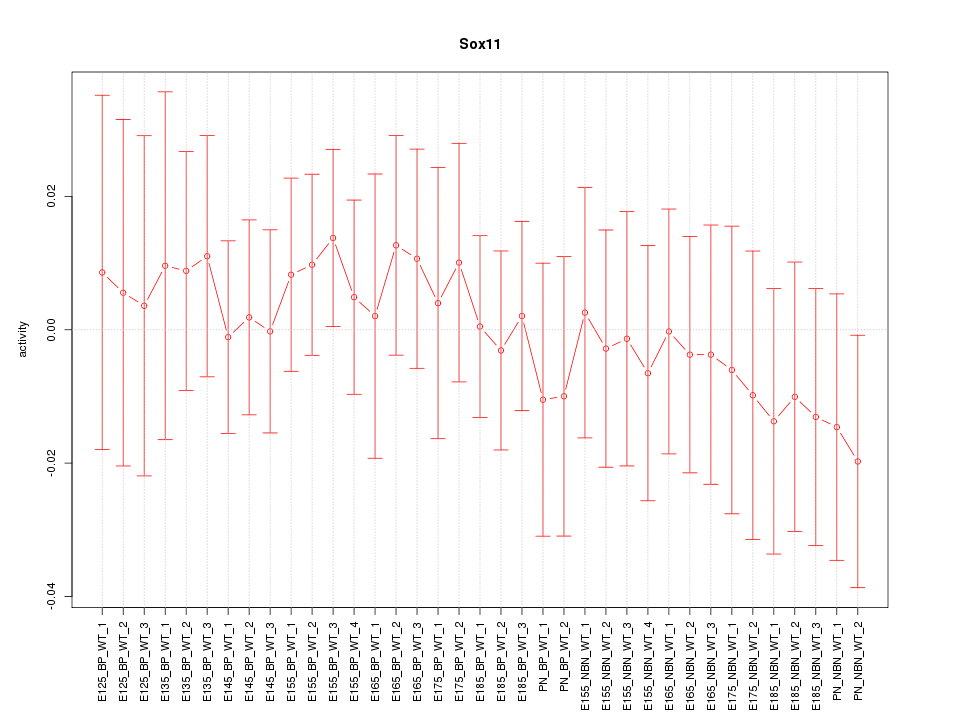
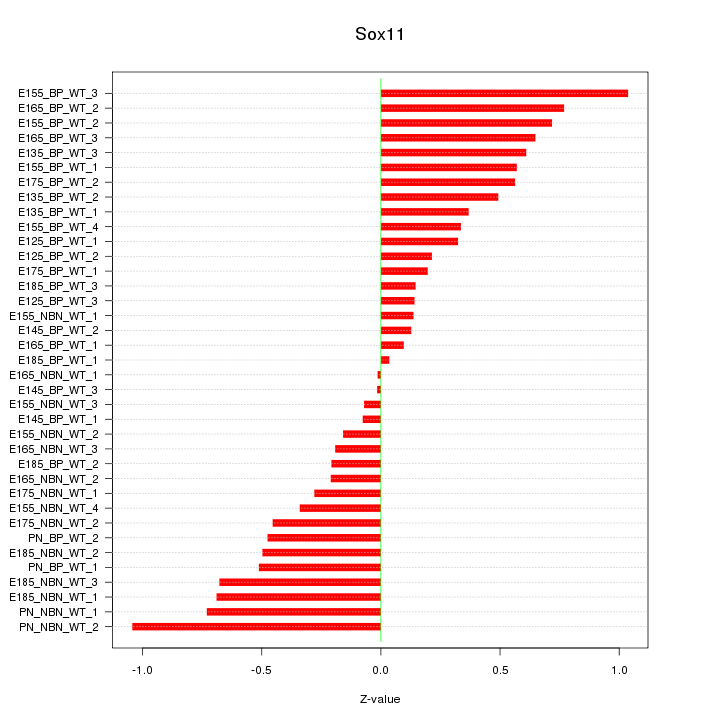
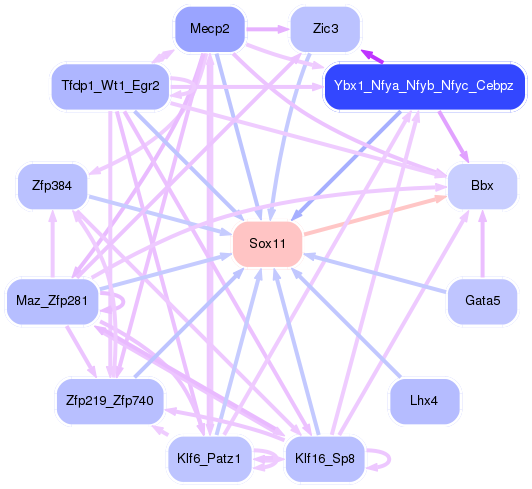
Motif ID: Sox11
Z-value: 0.472
Transcription factors associated with Sox11:
| Gene Symbol | Entrez ID | Gene Name |
|---|---|---|
| Sox11 | ENSMUSG00000063632.5 | Sox11 |
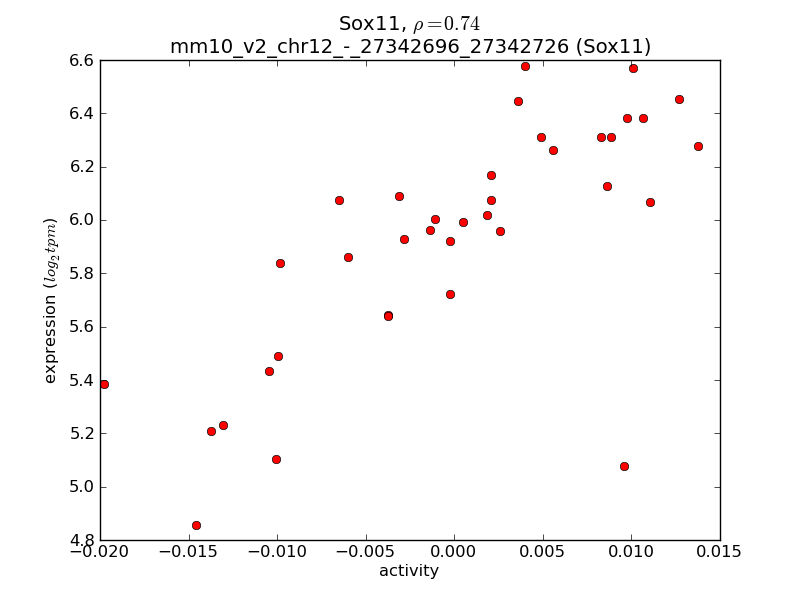
Activity-expression correlation:
| Gene Symbol | Promoter | Pearson corr. coef. | P-value | Plot |
|---|---|---|---|---|
| Sox11 | mm10_v2_chr12_-_27342696_27342726 | 0.74 | 1.5e-07 | Click! |

Top targets:
Gene overrepresentation in biological_process category:
| Log-likelihood per target | Total log-likelihood | Term | Description |
|---|---|---|---|
| 0.3 | 1.9 | GO:0021797 | forebrain anterior/posterior pattern specification(GO:0021797) |
| 0.3 | 0.8 | GO:0003162 | atrioventricular node development(GO:0003162) |
| 0.3 | 1.1 | GO:0060729 | intestinal epithelial structure maintenance(GO:0060729) |
| 0.2 | 0.7 | GO:2000620 | positive regulation of histone H4-K16 acetylation(GO:2000620) |
| 0.1 | 0.9 | GO:1902965 | regulation of protein localization to early endosome(GO:1902965) positive regulation of protein localization to early endosome(GO:1902966) |
| 0.1 | 0.3 | GO:0098928 | presynaptic signal transduction(GO:0098928) presynapse to nucleus signaling pathway(GO:0099526) |
| 0.1 | 0.5 | GO:1904659 | glucose transmembrane transport(GO:1904659) |
| 0.1 | 0.3 | GO:1903225 | negative regulation of endodermal cell differentiation(GO:1903225) |
| 0.1 | 0.3 | GO:0070125 | mitochondrial translational elongation(GO:0070125) |
| 0.1 | 1.8 | GO:0045663 | positive regulation of myoblast differentiation(GO:0045663) |
| 0.1 | 0.2 | GO:1990046 | positive regulation of mitochondrial DNA replication(GO:0090297) regulation of cardiolipin metabolic process(GO:1900208) positive regulation of cardiolipin metabolic process(GO:1900210) stress-induced mitochondrial fusion(GO:1990046) |
| 0.1 | 0.2 | GO:1903265 | positive regulation of tumor necrosis factor-mediated signaling pathway(GO:1903265) |
| 0.1 | 0.2 | GO:0030043 | actin filament fragmentation(GO:0030043) |
| 0.1 | 0.2 | GO:0060010 | Sertoli cell fate commitment(GO:0060010) |
| 0.0 | 0.7 | GO:0070508 | sterol import(GO:0035376) cholesterol import(GO:0070508) |
| 0.0 | 1.4 | GO:0010842 | retina layer formation(GO:0010842) |
| 0.0 | 0.7 | GO:0061339 | establishment of monopolar cell polarity(GO:0061162) establishment or maintenance of monopolar cell polarity(GO:0061339) |
| 0.0 | 0.4 | GO:2000270 | negative regulation of fibroblast apoptotic process(GO:2000270) |
| 0.0 | 0.3 | GO:0046015 | regulation of transcription by glucose(GO:0046015) |
| 0.0 | 0.6 | GO:0060218 | hematopoietic stem cell differentiation(GO:0060218) |
| 0.0 | 0.4 | GO:0015693 | magnesium ion transport(GO:0015693) |
| 0.0 | 0.1 | GO:0060126 | somatotropin secreting cell differentiation(GO:0060126) |
| 0.0 | 0.3 | GO:0010603 | regulation of cytoplasmic mRNA processing body assembly(GO:0010603) |
| 0.0 | 0.1 | GO:0010735 | positive regulation of transcription via serum response element binding(GO:0010735) |
| 0.0 | 0.0 | GO:2000409 | positive regulation of T cell extravasation(GO:2000409) |
| 0.0 | 0.2 | GO:0043984 | histone H4-K16 acetylation(GO:0043984) |
| 0.0 | 0.1 | GO:0036438 | maintenance of lens transparency(GO:0036438) |
Gene overrepresentation in cellular_component category:
| Log-likelihood per target | Total log-likelihood | Term | Description |
|---|---|---|---|
| 0.2 | 0.8 | GO:0002193 | MAML1-RBP-Jkappa- ICN1 complex(GO:0002193) |
| 0.1 | 2.4 | GO:0031616 | spindle pole centrosome(GO:0031616) |
| 0.1 | 0.3 | GO:0005588 | collagen type V trimer(GO:0005588) |
| 0.1 | 0.3 | GO:0099569 | presynaptic cytoskeleton(GO:0099569) |
| 0.1 | 0.3 | GO:0033553 | rDNA heterochromatin(GO:0033553) |
| 0.1 | 0.9 | GO:0051286 | cell tip(GO:0051286) |
| 0.0 | 0.2 | GO:0072487 | MSL complex(GO:0072487) |
| 0.0 | 0.7 | GO:0043196 | varicosity(GO:0043196) |
| 0.0 | 1.8 | GO:0044295 | axonal growth cone(GO:0044295) |
| 0.0 | 0.1 | GO:0042584 | chromaffin granule membrane(GO:0042584) |
| 0.0 | 0.4 | GO:0071339 | MLL1/2 complex(GO:0044665) MLL1 complex(GO:0071339) |
| 0.0 | 0.2 | GO:0042101 | T cell receptor complex(GO:0042101) |
Gene overrepresentation in molecular_function category:
| Log-likelihood per target | Total log-likelihood | Term | Description |
|---|---|---|---|
| 0.2 | 0.7 | GO:0032052 | bile acid binding(GO:0032052) |
| 0.1 | 0.7 | GO:0005519 | cytoskeletal regulatory protein binding(GO:0005519) |
| 0.0 | 0.5 | GO:0005355 | glucose transmembrane transporter activity(GO:0005355) |
| 0.0 | 0.8 | GO:0042605 | peptide antigen binding(GO:0042605) |
| 0.0 | 0.2 | GO:0004984 | olfactory receptor activity(GO:0004984) |
| 0.0 | 0.2 | GO:1901612 | phosphatidylglycerol binding(GO:1901611) cardiolipin binding(GO:1901612) |
| 0.0 | 0.3 | GO:0005522 | profilin binding(GO:0005522) |
| 0.0 | 1.1 | GO:0070888 | E-box binding(GO:0070888) |
| 0.0 | 0.4 | GO:0070016 | armadillo repeat domain binding(GO:0070016) |
| 0.0 | 0.4 | GO:0015095 | magnesium ion transmembrane transporter activity(GO:0015095) |
| 0.0 | 0.1 | GO:0008109 | N-acetyllactosaminide beta-1,6-N-acetylglucosaminyltransferase activity(GO:0008109) |
| 0.0 | 0.3 | GO:0050692 | DBD domain binding(GO:0050692) |
| 0.0 | 0.2 | GO:0001972 | retinoic acid binding(GO:0001972) |
| 0.0 | 0.3 | GO:0030159 | receptor signaling complex scaffold activity(GO:0030159) |
| 0.0 | 0.3 | GO:0003746 | translation elongation factor activity(GO:0003746) |
| 0.0 | 0.4 | GO:0031435 | mitogen-activated protein kinase kinase kinase binding(GO:0031435) |
| 0.0 | 2.4 | GO:0004721 | phosphoprotein phosphatase activity(GO:0004721) |
Gene overrepresentation in C2:CP category:
| Log-likelihood per target | Total log-likelihood | Term | Description |
|---|---|---|---|
| 0.1 | 2.4 | PID_AURORA_A_PATHWAY | Aurora A signaling |
| 0.1 | 1.8 | PID_HEDGEHOG_2PATHWAY | Signaling events mediated by the Hedgehog family |
| 0.0 | 0.7 | PID_LIS1_PATHWAY | Lissencephaly gene (LIS1) in neuronal migration and development |
| 0.0 | 0.9 | ST_GA13_PATHWAY | G alpha 13 Pathway |
| 0.0 | 0.5 | ST_WNT_BETA_CATENIN_PATHWAY | Wnt/beta-catenin Pathway |
| 0.0 | 0.8 | PID_HES_HEY_PATHWAY | Notch-mediated HES/HEY network |
Gene overrepresentation in C2:CP:REACTOME category:
| Log-likelihood per target | Total log-likelihood | Term | Description |
|---|---|---|---|
| 0.1 | 0.7 | REACTOME_STEROID_HORMONES | Genes involved in Steroid hormones |
| 0.0 | 0.8 | REACTOME_NOTCH_HLH_TRANSCRIPTION_PATHWAY | Genes involved in Notch-HLH transcription pathway |
| 0.0 | 1.8 | REACTOME_MYOGENESIS | Genes involved in Myogenesis |
| 0.0 | 1.1 | REACTOME_REGULATION_OF_GENE_EXPRESSION_IN_BETA_CELLS | Genes involved in Regulation of gene expression in beta cells |
| 0.0 | 0.9 | REACTOME_RECYCLING_PATHWAY_OF_L1 | Genes involved in Recycling pathway of L1 |