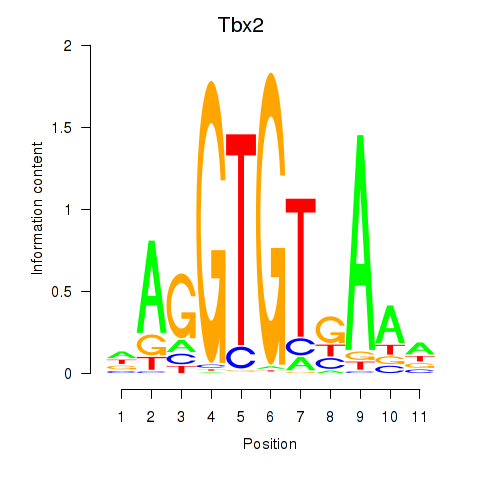
Motif ID: Tbx2
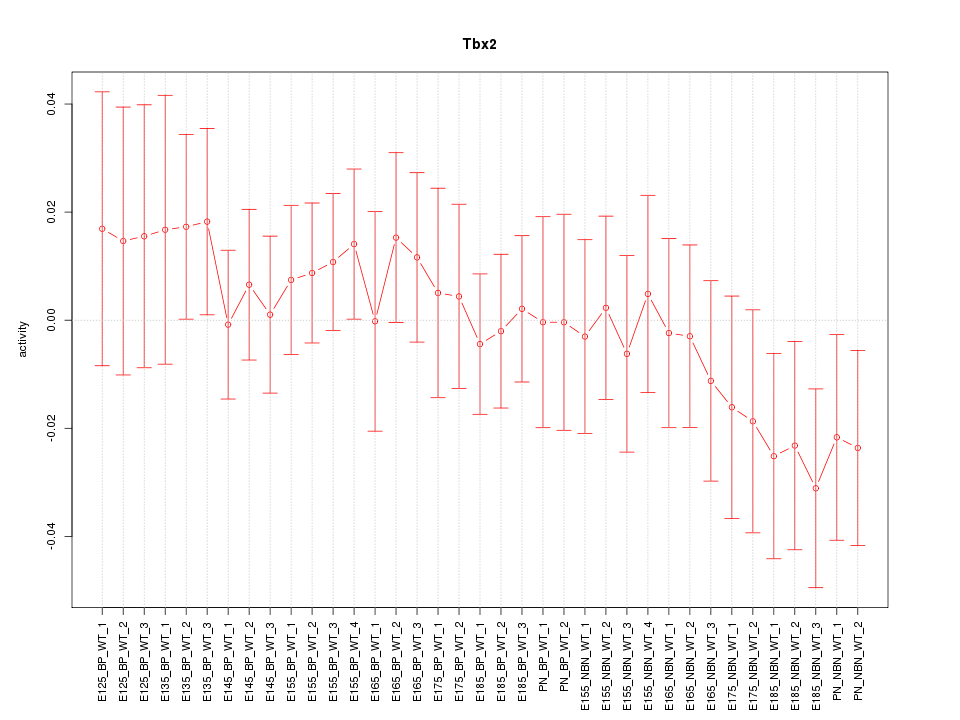
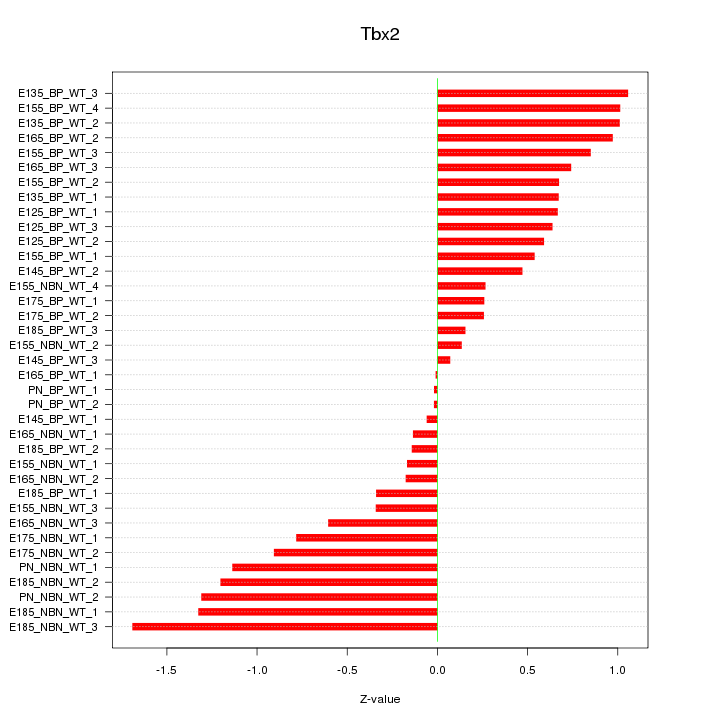
Z-value: 0.726
Transcription factors associated with Tbx2:
| Gene Symbol | Entrez ID | Gene Name |
|---|---|---|
| Tbx2 | ENSMUSG00000000093.6 | Tbx2 |
Activity-expression correlation:
| Gene Symbol | Promoter | Pearson corr. coef. | P-value | Plot |
|---|---|---|---|---|
| Tbx2 | mm10_v2_chr11_+_85832551_85832551 | -0.25 | 1.3e-01 | Click! |

Top targets:
Gene overrepresentation in biological_process category:
| Log-likelihood per target | Total log-likelihood | Term | Description |
|---|---|---|---|
| 1.6 | 8.2 | GO:0035262 | gonad morphogenesis(GO:0035262) |
| 0.9 | 2.7 | GO:2000620 | positive regulation of histone H4-K16 acetylation(GO:2000620) |
| 0.7 | 3.5 | GO:0007386 | compartment pattern specification(GO:0007386) |
| 0.5 | 1.8 | GO:0030091 | protein repair(GO:0030091) |
| 0.5 | 1.4 | GO:0090526 | regulation of gluconeogenesis involved in cellular glucose homeostasis(GO:0090526) |
| 0.4 | 2.1 | GO:0061086 | negative regulation of histone H3-K27 methylation(GO:0061086) |
| 0.4 | 1.4 | GO:0014005 | microglia differentiation(GO:0014004) microglia development(GO:0014005) |
| 0.3 | 1.0 | GO:0032474 | otolith morphogenesis(GO:0032474) |
| 0.3 | 3.3 | GO:2000741 | positive regulation of mesenchymal stem cell differentiation(GO:2000741) |
| 0.3 | 9.1 | GO:0035335 | peptidyl-tyrosine dephosphorylation(GO:0035335) |
| 0.2 | 1.7 | GO:0035735 | intraciliary transport involved in cilium morphogenesis(GO:0035735) |
| 0.2 | 1.1 | GO:0030240 | skeletal muscle thin filament assembly(GO:0030240) |
| 0.2 | 0.7 | GO:0044028 | DNA hypomethylation(GO:0044028) hypomethylation of CpG island(GO:0044029) |
| 0.2 | 2.6 | GO:0060013 | righting reflex(GO:0060013) positive regulation of epithelial cell proliferation involved in lung morphogenesis(GO:0060501) |
| 0.2 | 0.7 | GO:1901894 | regulation of calcium-transporting ATPase activity(GO:1901894) |
| 0.2 | 0.5 | GO:0090327 | negative regulation of locomotion involved in locomotory behavior(GO:0090327) |
| 0.2 | 0.9 | GO:0060467 | negative regulation of fertilization(GO:0060467) |
| 0.2 | 0.5 | GO:0036118 | hyaluranon cable assembly(GO:0036118) regulation of hyaluranon cable assembly(GO:1900104) positive regulation of hyaluranon cable assembly(GO:1900106) |
| 0.1 | 0.8 | GO:0097473 | cellular response to light intensity(GO:0071484) cellular response to high light intensity(GO:0071486) retinal rod cell apoptotic process(GO:0097473) |
| 0.1 | 0.5 | GO:0044330 | canonical Wnt signaling pathway involved in positive regulation of wound healing(GO:0044330) lactic acid secretion(GO:0046722) regulation of metanephric cap mesenchymal cell proliferation(GO:0090095) positive regulation of metanephric cap mesenchymal cell proliferation(GO:0090096) |
| 0.1 | 0.4 | GO:0001951 | intestinal D-glucose absorption(GO:0001951) terminal web assembly(GO:1902896) |
| 0.1 | 1.0 | GO:1904262 | negative regulation of TORC1 signaling(GO:1904262) |
| 0.1 | 0.4 | GO:0097278 | complement-dependent cytotoxicity(GO:0097278) |
| 0.1 | 0.6 | GO:0071947 | protein deubiquitination involved in ubiquitin-dependent protein catabolic process(GO:0071947) |
| 0.1 | 4.0 | GO:0043551 | regulation of phosphatidylinositol 3-kinase activity(GO:0043551) |
| 0.1 | 0.3 | GO:0070973 | protein localization to endoplasmic reticulum exit site(GO:0070973) |
| 0.1 | 0.4 | GO:1904565 | response to 1-oleoyl-sn-glycerol 3-phosphate(GO:1904565) cellular response to 1-oleoyl-sn-glycerol 3-phosphate(GO:1904566) |
| 0.1 | 0.3 | GO:0033364 | mast cell secretory granule organization(GO:0033364) |
| 0.1 | 2.9 | GO:0014912 | negative regulation of smooth muscle cell migration(GO:0014912) |
| 0.1 | 2.9 | GO:0042149 | cellular response to glucose starvation(GO:0042149) |
| 0.1 | 3.0 | GO:0014037 | Schwann cell differentiation(GO:0014037) |
| 0.1 | 1.8 | GO:0030866 | cortical actin cytoskeleton organization(GO:0030866) |
| 0.1 | 1.7 | GO:0010107 | potassium ion import(GO:0010107) |
| 0.1 | 2.6 | GO:0035411 | catenin import into nucleus(GO:0035411) |
| 0.1 | 0.2 | GO:0035521 | monoubiquitinated histone deubiquitination(GO:0035521) monoubiquitinated histone H2A deubiquitination(GO:0035522) |
| 0.1 | 0.3 | GO:0032929 | negative regulation of superoxide anion generation(GO:0032929) |
| 0.1 | 0.2 | GO:0001580 | detection of chemical stimulus involved in sensory perception of bitter taste(GO:0001580) |
| 0.0 | 2.4 | GO:2001222 | regulation of neuron migration(GO:2001222) |
| 0.0 | 1.7 | GO:0007129 | synapsis(GO:0007129) |
| 0.0 | 0.2 | GO:0031120 | snRNA pseudouridine synthesis(GO:0031120) |
| 0.0 | 0.4 | GO:0030206 | chondroitin sulfate biosynthetic process(GO:0030206) |
| 0.0 | 0.5 | GO:0007220 | Notch receptor processing(GO:0007220) |
| 0.0 | 0.2 | GO:0010572 | positive regulation of platelet activation(GO:0010572) |
| 0.0 | 1.1 | GO:0045599 | negative regulation of fat cell differentiation(GO:0045599) |
| 0.0 | 0.1 | GO:0034473 | U1 snRNA 3'-end processing(GO:0034473) U5 snRNA 3'-end processing(GO:0034476) |
| 0.0 | 0.3 | GO:0006851 | mitochondrial calcium ion transport(GO:0006851) |
| 0.0 | 0.4 | GO:0016578 | histone deubiquitination(GO:0016578) |
| 0.0 | 0.1 | GO:1903377 | negative regulation of oxidative stress-induced neuron intrinsic apoptotic signaling pathway(GO:1903377) |
| 0.0 | 0.7 | GO:0000381 | regulation of alternative mRNA splicing, via spliceosome(GO:0000381) |
| 0.0 | 0.6 | GO:0061003 | positive regulation of dendritic spine morphogenesis(GO:0061003) |
| 0.0 | 1.1 | GO:0006892 | post-Golgi vesicle-mediated transport(GO:0006892) |
Gene overrepresentation in cellular_component category:
| Log-likelihood per target | Total log-likelihood | Term | Description |
|---|---|---|---|
| 0.6 | 1.7 | GO:0097135 | cyclin E2-CDK2 complex(GO:0097135) |
| 0.5 | 2.7 | GO:0070531 | BRCA1-A complex(GO:0070531) |
| 0.2 | 5.4 | GO:0005942 | phosphatidylinositol 3-kinase complex(GO:0005942) |
| 0.2 | 1.4 | GO:1990316 | ATG1/ULK1 kinase complex(GO:1990316) |
| 0.1 | 2.1 | GO:0035098 | ESC/E(Z) complex(GO:0035098) |
| 0.1 | 0.4 | GO:1990357 | terminal web(GO:1990357) |
| 0.1 | 0.4 | GO:0033093 | multivesicular body membrane(GO:0032585) Weibel-Palade body(GO:0033093) |
| 0.1 | 5.3 | GO:0016328 | lateral plasma membrane(GO:0016328) |
| 0.1 | 0.5 | GO:0070765 | gamma-secretase complex(GO:0070765) |
| 0.1 | 1.7 | GO:0030992 | intraciliary transport particle B(GO:0030992) |
| 0.1 | 0.8 | GO:0032593 | insulin-responsive compartment(GO:0032593) |
| 0.0 | 0.2 | GO:0031092 | platelet alpha granule membrane(GO:0031092) |
| 0.0 | 0.7 | GO:0033017 | sarcoplasmic reticulum membrane(GO:0033017) |
| 0.0 | 1.1 | GO:0032588 | trans-Golgi network membrane(GO:0032588) |
| 0.0 | 0.2 | GO:0072588 | box H/ACA snoRNP complex(GO:0031429) box H/ACA RNP complex(GO:0072588) |
| 0.0 | 1.1 | GO:0031201 | SNARE complex(GO:0031201) |
| 0.0 | 0.3 | GO:0030061 | mitochondrial crista(GO:0030061) |
| 0.0 | 0.7 | GO:0030131 | clathrin adaptor complex(GO:0030131) |
| 0.0 | 0.1 | GO:0042382 | paraspeckles(GO:0042382) |
| 0.0 | 0.5 | GO:0005719 | nuclear euchromatin(GO:0005719) |
| 0.0 | 1.1 | GO:0072562 | blood microparticle(GO:0072562) |
Gene overrepresentation in molecular_function category:
| Log-likelihood per target | Total log-likelihood | Term | Description |
|---|---|---|---|
| 0.7 | 4.7 | GO:0046935 | 1-phosphatidylinositol-3-kinase regulator activity(GO:0046935) |
| 0.6 | 9.1 | GO:0017017 | MAP kinase tyrosine/serine/threonine phosphatase activity(GO:0017017) |
| 0.4 | 1.1 | GO:0036132 | 13-prostaglandin reductase activity(GO:0036132) 15-oxoprostaglandin 13-oxidase activity(GO:0047522) |
| 0.3 | 1.7 | GO:0015467 | G-protein activated inward rectifier potassium channel activity(GO:0015467) |
| 0.3 | 1.8 | GO:0033743 | peptide-methionine (R)-S-oxide reductase activity(GO:0033743) |
| 0.3 | 2.3 | GO:0050291 | sphingosine N-acyltransferase activity(GO:0050291) |
| 0.2 | 1.4 | GO:0070728 | leucine binding(GO:0070728) |
| 0.2 | 0.5 | GO:0050501 | hyaluronan synthase activity(GO:0050501) |
| 0.1 | 2.9 | GO:0030215 | semaphorin receptor binding(GO:0030215) |
| 0.1 | 0.5 | GO:0030292 | protein tyrosine kinase inhibitor activity(GO:0030292) |
| 0.1 | 0.7 | GO:0004652 | polynucleotide adenylyltransferase activity(GO:0004652) |
| 0.1 | 3.5 | GO:0005112 | Notch binding(GO:0005112) |
| 0.1 | 0.7 | GO:0046934 | phosphatidylinositol-4,5-bisphosphate 3-kinase activity(GO:0046934) phosphatidylinositol bisphosphate kinase activity(GO:0052813) |
| 0.1 | 0.3 | GO:0086038 | calcium:sodium antiporter activity involved in regulation of cardiac muscle cell membrane potential(GO:0086038) |
| 0.1 | 1.1 | GO:0030898 | actin-dependent ATPase activity(GO:0030898) |
| 0.1 | 0.6 | GO:1990380 | Lys48-specific deubiquitinase activity(GO:1990380) |
| 0.1 | 0.4 | GO:0035727 | lysophosphatidic acid binding(GO:0035727) lysophosphatidic acid receptor activity(GO:0070915) |
| 0.0 | 1.7 | GO:0016538 | cyclin-dependent protein serine/threonine kinase regulator activity(GO:0016538) |
| 0.0 | 0.2 | GO:0042806 | fucose binding(GO:0042806) |
| 0.0 | 0.4 | GO:0015165 | pyrimidine nucleotide-sugar transmembrane transporter activity(GO:0015165) |
| 0.0 | 2.7 | GO:0003684 | damaged DNA binding(GO:0003684) |
| 0.0 | 0.2 | GO:0034513 | box H/ACA snoRNA binding(GO:0034513) |
| 0.0 | 0.3 | GO:0003993 | acid phosphatase activity(GO:0003993) |
| 0.0 | 0.8 | GO:0004385 | guanylate kinase activity(GO:0004385) |
| 0.0 | 1.7 | GO:0048487 | beta-tubulin binding(GO:0048487) |
| 0.0 | 6.0 | GO:0001078 | transcriptional repressor activity, RNA polymerase II core promoter proximal region sequence-specific binding(GO:0001078) |
| 0.0 | 2.1 | GO:0035064 | methylated histone binding(GO:0035064) |
| 0.0 | 0.4 | GO:0004653 | polypeptide N-acetylgalactosaminyltransferase activity(GO:0004653) |
| 0.0 | 1.6 | GO:0017022 | myosin binding(GO:0017022) |
| 0.0 | 0.5 | GO:0031690 | adrenergic receptor binding(GO:0031690) |
| 0.0 | 0.9 | GO:0004867 | serine-type endopeptidase inhibitor activity(GO:0004867) |
| 0.0 | 1.1 | GO:0048306 | calcium-dependent protein binding(GO:0048306) |
| 0.0 | 1.8 | GO:0017048 | Rho GTPase binding(GO:0017048) |
| 0.0 | 3.2 | GO:0000287 | magnesium ion binding(GO:0000287) |
| 0.0 | 0.5 | GO:0070888 | E-box binding(GO:0070888) |
Gene overrepresentation in C2:CP category:
| Log-likelihood per target | Total log-likelihood | Term | Description |
|---|---|---|---|
| 0.1 | 5.4 | PID_TRAIL_PATHWAY | TRAIL signaling pathway |
| 0.1 | 1.7 | SA_REG_CASCADE_OF_CYCLIN_EXPR | Expression of cyclins regulates progression through the cell cycle by activating cyclin-dependent kinases. |
| 0.1 | 2.7 | PID_BARD1_PATHWAY | BARD1 signaling events |
| 0.0 | 4.5 | PID_NOTCH_PATHWAY | Notch signaling pathway |
| 0.0 | 2.5 | ST_G_ALPHA_I_PATHWAY | G alpha i Pathway |
| 0.0 | 1.0 | PID_ERBB4_PATHWAY | ErbB4 signaling events |
| 0.0 | 2.9 | NABA_ECM_AFFILIATED | Genes encoding proteins affiliated structurally or functionally to extracellular matrix proteins |
| 0.0 | 0.5 | PID_BCR_5PATHWAY | BCR signaling pathway |
| 0.0 | 0.4 | PID_LYSOPHOSPHOLIPID_PATHWAY | LPA receptor mediated events |
Gene overrepresentation in C2:CP:REACTOME category:
| Log-likelihood per target | Total log-likelihood | Term | Description |
|---|---|---|---|
| 0.4 | 4.7 | REACTOME_IL_7_SIGNALING | Genes involved in Interleukin-7 signaling |
| 0.2 | 5.4 | REACTOME_TIGHT_JUNCTION_INTERACTIONS | Genes involved in Tight junction interactions |
| 0.2 | 2.7 | REACTOME_HOMOLOGOUS_RECOMBINATION_REPAIR_OF_REPLICATION_INDEPENDENT_DOUBLE_STRAND_BREAKS | Genes involved in Homologous recombination repair of replication-independent double-strand breaks |
| 0.1 | 2.9 | REACTOME_OTHER_SEMAPHORIN_INTERACTIONS | Genes involved in Other semaphorin interactions |
| 0.1 | 1.1 | REACTOME_DOPAMINE_NEUROTRANSMITTER_RELEASE_CYCLE | Genes involved in Dopamine Neurotransmitter Release Cycle |
| 0.1 | 1.7 | REACTOME_G0_AND_EARLY_G1 | Genes involved in G0 and Early G1 |
| 0.1 | 0.8 | REACTOME_NEGATIVE_REGULATION_OF_THE_PI3K_AKT_NETWORK | Genes involved in Negative regulation of the PI3K/AKT network |
| 0.1 | 2.3 | REACTOME_SPHINGOLIPID_DE_NOVO_BIOSYNTHESIS | Genes involved in Sphingolipid de novo biosynthesis |
| 0.0 | 0.4 | REACTOME_GLUCURONIDATION | Genes involved in Glucuronidation |
| 0.0 | 0.7 | REACTOME_TIE2_SIGNALING | Genes involved in Tie2 Signaling |
| 0.0 | 0.5 | REACTOME_REGULATED_PROTEOLYSIS_OF_P75NTR | Genes involved in Regulated proteolysis of p75NTR |
| 0.0 | 0.5 | REACTOME_HYALURONAN_METABOLISM | Genes involved in Hyaluronan metabolism |
| 0.0 | 0.8 | REACTOME_INHIBITION_OF_VOLTAGE_GATED_CA2_CHANNELS_VIA_GBETA_GAMMA_SUBUNITS | Genes involved in Inhibition of voltage gated Ca2+ channels via Gbeta/gamma subunits |
| 0.0 | 0.4 | REACTOME_INSULIN_SYNTHESIS_AND_PROCESSING | Genes involved in Insulin Synthesis and Processing |
| 0.0 | 0.5 | REACTOME_SMAD2_SMAD3_SMAD4_HETEROTRIMER_REGULATES_TRANSCRIPTION | Genes involved in SMAD2/SMAD3:SMAD4 heterotrimer regulates transcription |
| 0.0 | 0.4 | REACTOME_O_LINKED_GLYCOSYLATION_OF_MUCINS | Genes involved in O-linked glycosylation of mucins |