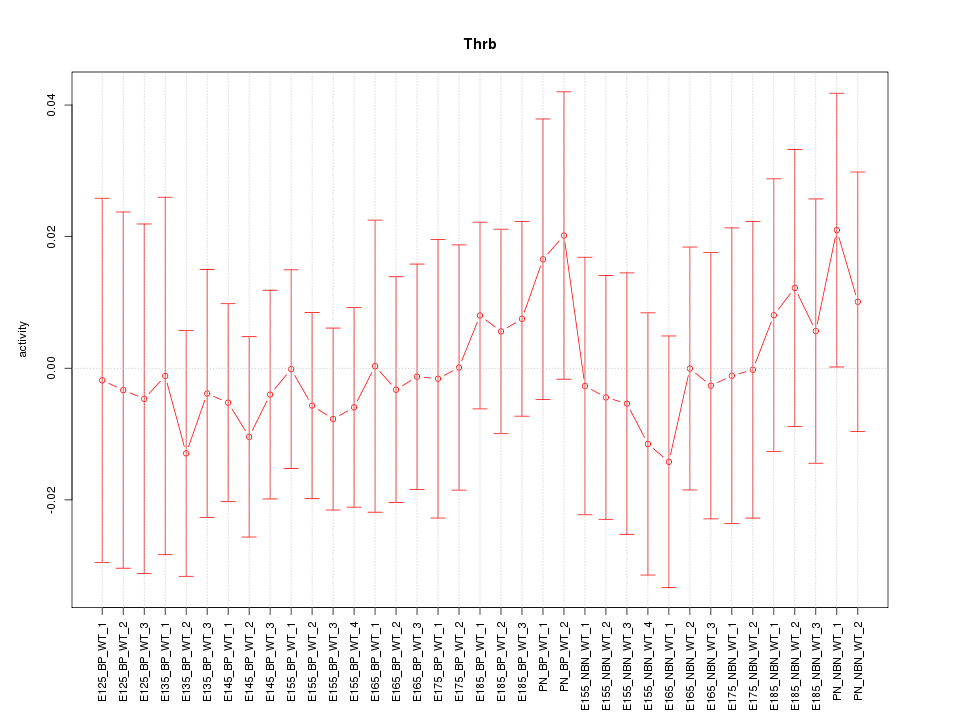
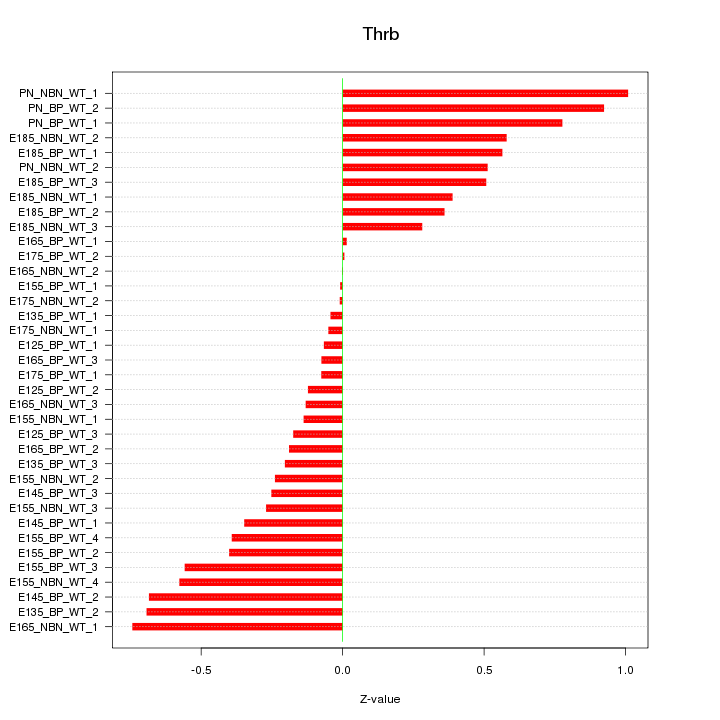
Motif ID: Thrb
Z-value: 0.434

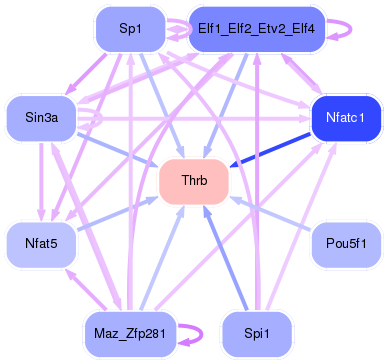
Transcription factors associated with Thrb:
| Gene Symbol | Entrez ID | Gene Name |
|---|---|---|
| Thrb | ENSMUSG00000021779.10 | Thrb |
Activity-expression correlation:
| Gene Symbol | Promoter | Pearson corr. coef. | P-value | Plot |
|---|---|---|---|---|
| Thrb | mm10_v2_chr14_+_17660956_17660963 | 0.04 | 7.9e-01 | Click! |

Top targets:
Gene overrepresentation in biological_process category:
| Log-likelihood per target | Total log-likelihood | Term | Description |
|---|---|---|---|
| 1.3 | 6.7 | GO:2000255 | negative regulation of male germ cell proliferation(GO:2000255) |
| 0.6 | 1.7 | GO:0044208 | 'de novo' AMP biosynthetic process(GO:0044208) |
| 0.3 | 1.5 | GO:0015817 | glutamine transport(GO:0006868) histidine transport(GO:0015817) cellular response to potassium ion starvation(GO:0051365) |
| 0.2 | 0.6 | GO:0097211 | response to gonadotropin-releasing hormone(GO:0097210) cellular response to gonadotropin-releasing hormone(GO:0097211) |
| 0.2 | 1.1 | GO:0030854 | positive regulation of granulocyte differentiation(GO:0030854) |
| 0.1 | 0.4 | GO:0046900 | tetrahydrofolylpolyglutamate metabolic process(GO:0046900) |
| 0.1 | 0.9 | GO:0016127 | cholesterol catabolic process(GO:0006707) sterol catabolic process(GO:0016127) |
| 0.1 | 0.3 | GO:0015788 | UDP-N-acetylglucosamine transport(GO:0015788) |
| 0.1 | 0.2 | GO:0042373 | vitamin K metabolic process(GO:0042373) |
| 0.0 | 1.1 | GO:0006730 | one-carbon metabolic process(GO:0006730) |
| 0.0 | 0.1 | GO:0001692 | histamine metabolic process(GO:0001692) imidazole-containing compound catabolic process(GO:0052805) |
| 0.0 | 0.1 | GO:0098535 | de novo centriole assembly(GO:0098535) |
| 0.0 | 0.1 | GO:0002318 | myeloid progenitor cell differentiation(GO:0002318) |
| 0.0 | 0.1 | GO:1900533 | medium-chain fatty-acyl-CoA catabolic process(GO:0036114) long-chain fatty-acyl-CoA catabolic process(GO:0036116) palmitic acid metabolic process(GO:1900533) palmitic acid biosynthetic process(GO:1900535) |
Gene overrepresentation in cellular_component category:
| Log-likelihood per target | Total log-likelihood | Term | Description |
|---|---|---|---|
| 0.1 | 6.7 | GO:0005791 | rough endoplasmic reticulum(GO:0005791) |
| 0.0 | 0.1 | GO:0031021 | interphase microtubule organizing center(GO:0031021) |
| 0.0 | 0.2 | GO:0048787 | presynaptic active zone membrane(GO:0048787) |
Gene overrepresentation in molecular_function category:
| Log-likelihood per target | Total log-likelihood | Term | Description |
|---|---|---|---|
| 1.7 | 6.7 | GO:0004667 | prostaglandin-D synthase activity(GO:0004667) |
| 0.5 | 1.5 | GO:0015182 | L-asparagine transmembrane transporter activity(GO:0015182) |
| 0.1 | 1.1 | GO:0016151 | nickel cation binding(GO:0016151) |
| 0.1 | 0.4 | GO:0008242 | omega peptidase activity(GO:0008242) |
| 0.1 | 0.8 | GO:0008484 | sulfuric ester hydrolase activity(GO:0008484) |
| 0.0 | 0.9 | GO:0016709 | oxidoreductase activity, acting on paired donors, with incorporation or reduction of molecular oxygen, NAD(P)H as one donor, and incorporation of one atom of oxygen(GO:0016709) |
| 0.0 | 0.6 | GO:0005388 | calcium-transporting ATPase activity(GO:0005388) |
| 0.0 | 1.7 | GO:0016879 | ligase activity, forming carbon-nitrogen bonds(GO:0016879) |
| 0.0 | 0.1 | GO:0004965 | G-protein coupled GABA receptor activity(GO:0004965) |
| 0.0 | 0.2 | GO:0035612 | AP-2 adaptor complex binding(GO:0035612) |
| 0.0 | 0.2 | GO:0004659 | prenyltransferase activity(GO:0004659) |
| 0.0 | 0.3 | GO:0005351 | sugar:proton symporter activity(GO:0005351) |
| 0.0 | 0.1 | GO:0016863 | intramolecular oxidoreductase activity, transposing C=C bonds(GO:0016863) |
Gene overrepresentation in C2:CP category:
| Log-likelihood per target | Total log-likelihood | Term | Description |
|---|---|---|---|
| 0.0 | 1.1 | PID_FCER1_PATHWAY | Fc-epsilon receptor I signaling in mast cells |
Gene overrepresentation in C2:CP:REACTOME category:
| Log-likelihood per target | Total log-likelihood | Term | Description |
|---|---|---|---|
| 0.1 | 0.9 | REACTOME_ENDOGENOUS_STEROLS | Genes involved in Endogenous sterols |
| 0.1 | 1.7 | REACTOME_PURINE_RIBONUCLEOSIDE_MONOPHOSPHATE_BIOSYNTHESIS | Genes involved in Purine ribonucleoside monophosphate biosynthesis |
| 0.1 | 0.8 | REACTOME_THE_ACTIVATION_OF_ARYLSULFATASES | Genes involved in The activation of arylsulfatases |
| 0.0 | 1.5 | REACTOME_AMINO_ACID_TRANSPORT_ACROSS_THE_PLASMA_MEMBRANE | Genes involved in Amino acid transport across the plasma membrane |