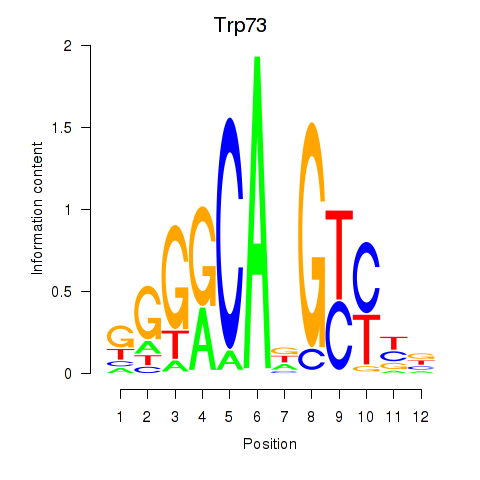
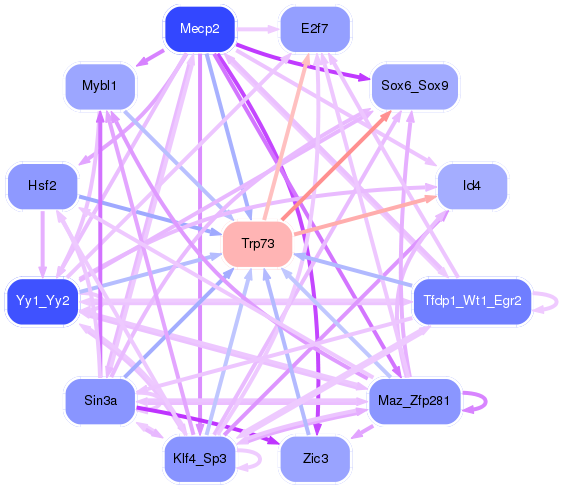
Motif ID: Trp73
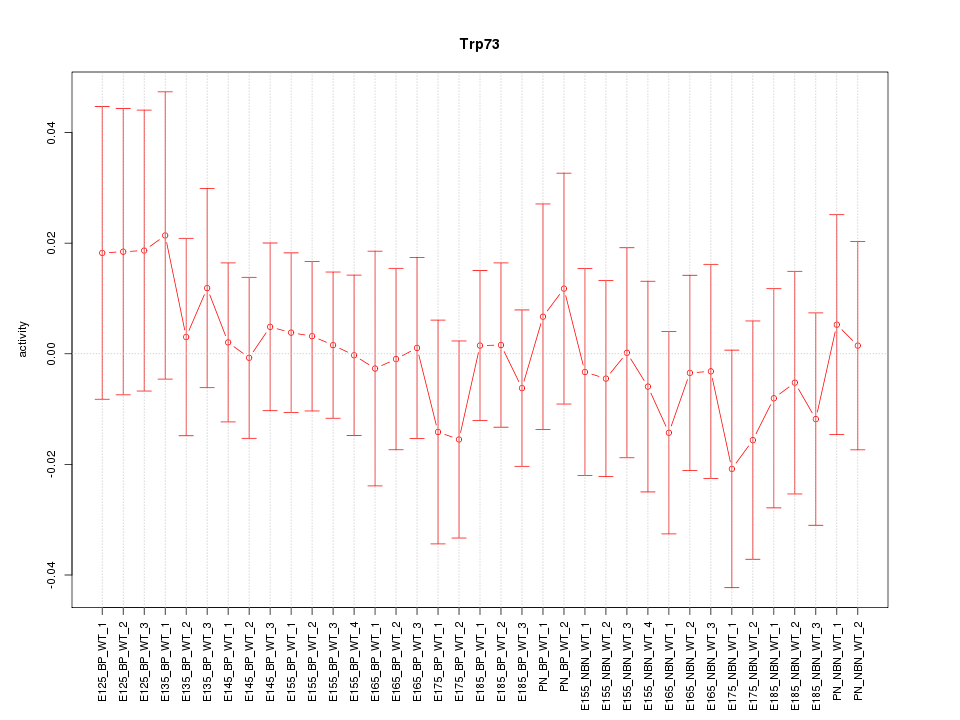
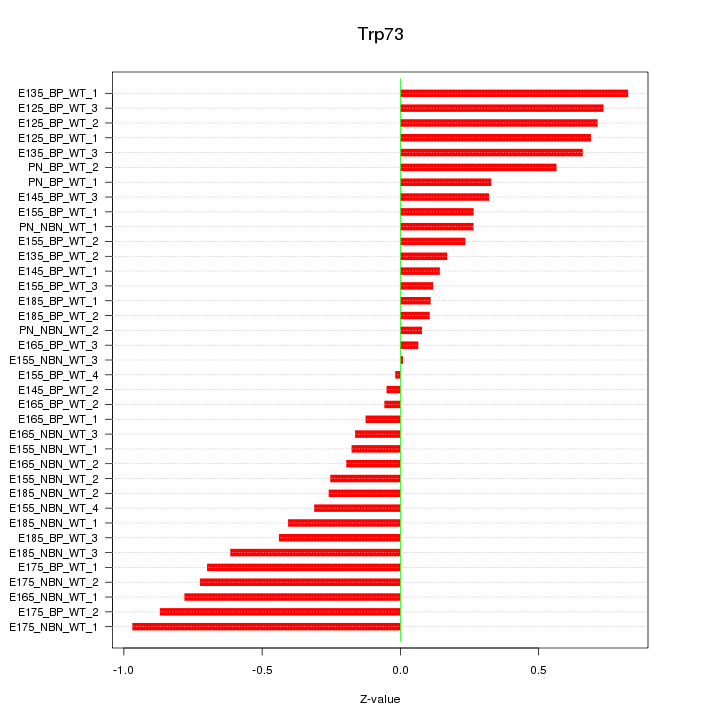
Z-value: 0.461
Transcription factors associated with Trp73:
| Gene Symbol | Entrez ID | Gene Name |
|---|---|---|
| Trp73 | ENSMUSG00000029026.10 | Trp73 |
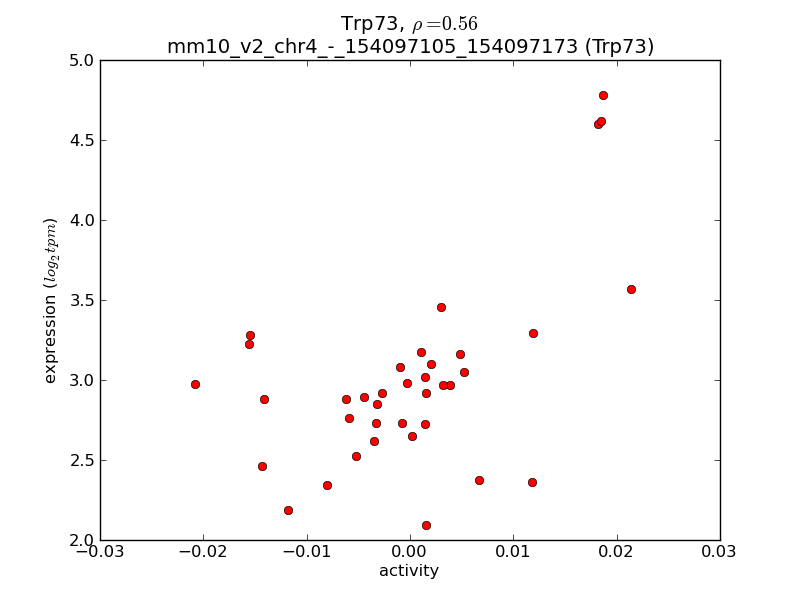
Activity-expression correlation:
| Gene Symbol | Promoter | Pearson corr. coef. | P-value | Plot |
|---|---|---|---|---|
| Trp73 | mm10_v2_chr4_-_154097105_154097173 | 0.56 | 2.9e-04 | Click! |

Top targets:
Gene overrepresentation in biological_process category:
| Log-likelihood per target | Total log-likelihood | Term | Description |
|---|---|---|---|
| 0.4 | 1.8 | GO:0042360 | vitamin E metabolic process(GO:0042360) |
| 0.4 | 2.9 | GO:0035542 | regulation of SNARE complex assembly(GO:0035542) |
| 0.3 | 1.4 | GO:0060741 | prostate gland stromal morphogenesis(GO:0060741) |
| 0.3 | 1.3 | GO:0071930 | negative regulation of transcription involved in G1/S transition of mitotic cell cycle(GO:0071930) |
| 0.3 | 0.9 | GO:0071963 | establishment or maintenance of cell polarity regulating cell shape(GO:0071963) |
| 0.3 | 0.8 | GO:0061357 | Wnt protein secretion(GO:0061355) regulation of Wnt protein secretion(GO:0061356) positive regulation of Wnt protein secretion(GO:0061357) |
| 0.2 | 2.7 | GO:2000741 | positive regulation of mesenchymal stem cell differentiation(GO:2000741) |
| 0.2 | 1.9 | GO:0071493 | cellular response to UV-B(GO:0071493) |
| 0.2 | 2.7 | GO:0007213 | G-protein coupled acetylcholine receptor signaling pathway(GO:0007213) regulation of dopamine receptor signaling pathway(GO:0060159) |
| 0.2 | 0.7 | GO:0060316 | positive regulation of ryanodine-sensitive calcium-release channel activity(GO:0060316) |
| 0.2 | 2.7 | GO:0045723 | positive regulation of fatty acid biosynthetic process(GO:0045723) |
| 0.1 | 1.4 | GO:0048742 | regulation of skeletal muscle fiber development(GO:0048742) |
| 0.1 | 0.4 | GO:0021577 | hindbrain structural organization(GO:0021577) cerebellum structural organization(GO:0021589) |
| 0.1 | 0.8 | GO:0045900 | negative regulation of translational elongation(GO:0045900) |
| 0.1 | 0.7 | GO:1900194 | negative regulation of oocyte development(GO:0060283) negative regulation of oocyte maturation(GO:1900194) |
| 0.1 | 1.3 | GO:0043567 | regulation of insulin-like growth factor receptor signaling pathway(GO:0043567) |
| 0.1 | 0.2 | GO:0048209 | regulation of vesicle targeting, to, from or within Golgi(GO:0048209) |
| 0.1 | 0.2 | GO:0043456 | regulation of pentose-phosphate shunt(GO:0043456) |
| 0.0 | 0.6 | GO:0043252 | sodium-independent organic anion transport(GO:0043252) |
| 0.0 | 0.1 | GO:0006776 | vitamin A metabolic process(GO:0006776) |
| 0.0 | 0.8 | GO:0044381 | glucose import in response to insulin stimulus(GO:0044381) |
| 0.0 | 0.5 | GO:1904262 | negative regulation of TORC1 signaling(GO:1904262) |
| 0.0 | 2.0 | GO:0070527 | platelet aggregation(GO:0070527) |
| 0.0 | 1.0 | GO:0042462 | eye photoreceptor cell development(GO:0042462) |
| 0.0 | 0.2 | GO:0045218 | zonula adherens maintenance(GO:0045218) |
| 0.0 | 0.5 | GO:0045948 | positive regulation of translational initiation(GO:0045948) |
| 0.0 | 0.3 | GO:0018195 | peptidyl-arginine modification(GO:0018195) |
| 0.0 | 0.9 | GO:0006749 | glutathione metabolic process(GO:0006749) |
| 0.0 | 0.1 | GO:1903275 | positive regulation of sodium ion export(GO:1903275) positive regulation of sodium ion export from cell(GO:1903278) regulation of inorganic anion transmembrane transport(GO:1903795) |
| 0.0 | 0.4 | GO:0060445 | branching involved in salivary gland morphogenesis(GO:0060445) |
| 0.0 | 0.0 | GO:1902951 | negative regulation of dendritic spine maintenance(GO:1902951) |
| 0.0 | 0.1 | GO:2001197 | regulation of basement membrane assembly involved in embryonic body morphogenesis(GO:1904259) positive regulation of basement membrane assembly involved in embryonic body morphogenesis(GO:1904261) basement membrane assembly involved in embryonic body morphogenesis(GO:2001197) |
Gene overrepresentation in cellular_component category:
| Log-likelihood per target | Total log-likelihood | Term | Description |
|---|---|---|---|
| 0.6 | 1.9 | GO:0070557 | PCNA-p21 complex(GO:0070557) |
| 0.2 | 1.4 | GO:0090571 | RNA polymerase II transcription repressor complex(GO:0090571) |
| 0.1 | 0.7 | GO:0035189 | Rb-E2F complex(GO:0035189) |
| 0.1 | 2.9 | GO:0000145 | exocyst(GO:0000145) |
| 0.1 | 2.3 | GO:0032809 | neuronal cell body membrane(GO:0032809) |
| 0.0 | 0.8 | GO:0032593 | insulin-responsive compartment(GO:0032593) |
| 0.0 | 0.5 | GO:0061700 | GATOR2 complex(GO:0061700) |
| 0.0 | 0.8 | GO:1990124 | messenger ribonucleoprotein complex(GO:1990124) |
| 0.0 | 1.1 | GO:0032839 | dendrite cytoplasm(GO:0032839) |
| 0.0 | 0.4 | GO:0034663 | endoplasmic reticulum chaperone complex(GO:0034663) |
| 0.0 | 1.0 | GO:0032391 | photoreceptor connecting cilium(GO:0032391) |
| 0.0 | 0.3 | GO:0008250 | oligosaccharyltransferase complex(GO:0008250) |
| 0.0 | 0.0 | GO:0000811 | GINS complex(GO:0000811) |
| 0.0 | 0.2 | GO:0005915 | zonula adherens(GO:0005915) |
Gene overrepresentation in molecular_function category:
| Log-likelihood per target | Total log-likelihood | Term | Description |
|---|---|---|---|
| 0.6 | 1.9 | GO:0019912 | cyclin-dependent protein kinase activating kinase activity(GO:0019912) |
| 0.2 | 0.8 | GO:0055056 | D-glucose transmembrane transporter activity(GO:0055056) |
| 0.2 | 1.4 | GO:0001226 | RNA polymerase II transcription corepressor binding(GO:0001226) |
| 0.2 | 2.9 | GO:0098641 | cadherin binding involved in cell-cell adhesion(GO:0098641) |
| 0.2 | 1.3 | GO:0031995 | insulin-like growth factor II binding(GO:0031995) |
| 0.1 | 0.5 | GO:0070728 | leucine binding(GO:0070728) |
| 0.1 | 0.8 | GO:0031852 | mu-type opioid receptor binding(GO:0031852) |
| 0.1 | 0.7 | GO:0061676 | importin-alpha family protein binding(GO:0061676) |
| 0.1 | 2.7 | GO:0001965 | G-protein alpha-subunit binding(GO:0001965) |
| 0.1 | 0.8 | GO:0035925 | mRNA 3'-UTR AU-rich region binding(GO:0035925) |
| 0.1 | 0.2 | GO:0046538 | bisphosphoglycerate mutase activity(GO:0004082) phosphoglycerate mutase activity(GO:0004619) 2,3-bisphosphoglycerate-dependent phosphoglycerate mutase activity(GO:0046538) |
| 0.1 | 0.6 | GO:0015347 | sodium-independent organic anion transmembrane transporter activity(GO:0015347) |
| 0.0 | 0.1 | GO:0016501 | prostacyclin receptor activity(GO:0016501) |
| 0.0 | 0.7 | GO:0004602 | glutathione peroxidase activity(GO:0004602) |
| 0.0 | 0.3 | GO:1990247 | N6-methyladenosine-containing RNA binding(GO:1990247) |
| 0.0 | 0.2 | GO:0008242 | omega peptidase activity(GO:0008242) |
| 0.0 | 0.4 | GO:0008483 | transaminase activity(GO:0008483) |
| 0.0 | 0.3 | GO:0004576 | oligosaccharyl transferase activity(GO:0004576) dolichyl-diphosphooligosaccharide-protein glycotransferase activity(GO:0004579) |
| 0.0 | 0.9 | GO:0031492 | nucleosomal DNA binding(GO:0031492) |
| 0.0 | 0.2 | GO:0004089 | carbonate dehydratase activity(GO:0004089) |
| 0.0 | 0.7 | GO:0005070 | SH3/SH2 adaptor activity(GO:0005070) |
| 0.0 | 0.3 | GO:0030628 | pre-mRNA 3'-splice site binding(GO:0030628) |
| 0.0 | 0.3 | GO:0051787 | misfolded protein binding(GO:0051787) |
| 0.0 | 2.7 | GO:0001078 | transcriptional repressor activity, RNA polymerase II core promoter proximal region sequence-specific binding(GO:0001078) |
| 0.0 | 0.2 | GO:0070097 | delta-catenin binding(GO:0070097) |
| 0.0 | 0.0 | GO:0015226 | amino-acid betaine transmembrane transporter activity(GO:0015199) carnitine transmembrane transporter activity(GO:0015226) |
Gene overrepresentation in C2:CP category:
| Log-likelihood per target | Total log-likelihood | Term | Description |
|---|---|---|---|
| 0.2 | 1.9 | SA_G2_AND_M_PHASES | Cdc25 activates the cdc2/cyclin B complex to induce the G2/M transition. |
| 0.0 | 1.0 | PID_EPHRINB_REV_PATHWAY | Ephrin B reverse signaling |
| 0.0 | 0.7 | PID_PDGFRA_PATHWAY | PDGFR-alpha signaling pathway |
| 0.0 | 0.8 | PID_INSULIN_GLUCOSE_PATHWAY | Insulin-mediated glucose transport |
| 0.0 | 1.4 | PID_HDAC_CLASSII_PATHWAY | Signaling events mediated by HDAC Class II |
| 0.0 | 0.7 | ST_G_ALPHA_I_PATHWAY | G alpha i Pathway |
| 0.0 | 0.9 | PID_ILK_PATHWAY | Integrin-linked kinase signaling |
| 0.0 | 0.7 | PID_FOXM1_PATHWAY | FOXM1 transcription factor network |
| 0.0 | 0.3 | PID_PRL_SIGNALING_EVENTS_PATHWAY | Signaling events mediated by PRL |
Gene overrepresentation in C2:CP:REACTOME category:
| Log-likelihood per target | Total log-likelihood | Term | Description |
|---|---|---|---|
| 0.1 | 1.8 | REACTOME_HDL_MEDIATED_LIPID_TRANSPORT | Genes involved in HDL-mediated lipid transport |
| 0.1 | 1.3 | REACTOME_REGULATION_OF_INSULIN_LIKE_GROWTH_FACTOR_IGF_ACTIVITY_BY_INSULIN_LIKE_GROWTH_FACTOR_BINDING_PROTEINS_IGFBPS | Genes involved in Regulation of Insulin-like Growth Factor (IGF) Activity by Insulin-like Growth Factor Binding Proteins (IGFBPs) |
| 0.1 | 0.8 | REACTOME_FACILITATIVE_NA_INDEPENDENT_GLUCOSE_TRANSPORTERS | Genes involved in Facilitative Na+-independent glucose transporters |
| 0.1 | 1.9 | REACTOME_AKT_PHOSPHORYLATES_TARGETS_IN_THE_CYTOSOL | Genes involved in AKT phosphorylates targets in the cytosol |
| 0.1 | 0.7 | REACTOME_INHIBITION_OF_REPLICATION_INITIATION_OF_DAMAGED_DNA_BY_RB1_E2F1 | Genes involved in Inhibition of replication initiation of damaged DNA by RB1/E2F1 |
| 0.0 | 0.4 | REACTOME_ACTIVATION_OF_CHAPERONE_GENES_BY_ATF6_ALPHA | Genes involved in Activation of Chaperone Genes by ATF6-alpha |
| 0.0 | 0.9 | REACTOME_CELL_EXTRACELLULAR_MATRIX_INTERACTIONS | Genes involved in Cell-extracellular matrix interactions |
| 0.0 | 3.3 | REACTOME_G_ALPHA_I_SIGNALLING_EVENTS | Genes involved in G alpha (i) signalling events |
| 0.0 | 1.4 | REACTOME_NOTCH1_INTRACELLULAR_DOMAIN_REGULATES_TRANSCRIPTION | Genes involved in NOTCH1 Intracellular Domain Regulates Transcription |
| 0.0 | 0.4 | REACTOME_AMINO_ACID_SYNTHESIS_AND_INTERCONVERSION_TRANSAMINATION | Genes involved in Amino acid synthesis and interconversion (transamination) |