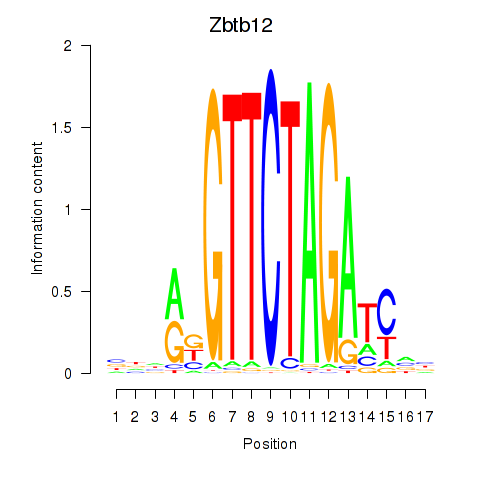
Motif ID: Zbtb12
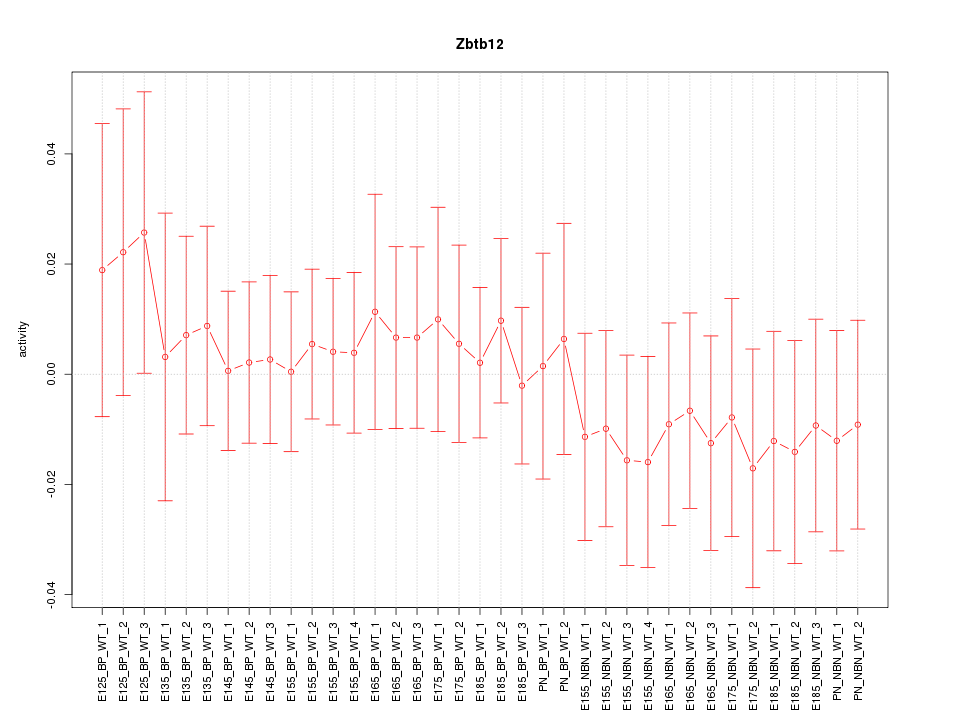
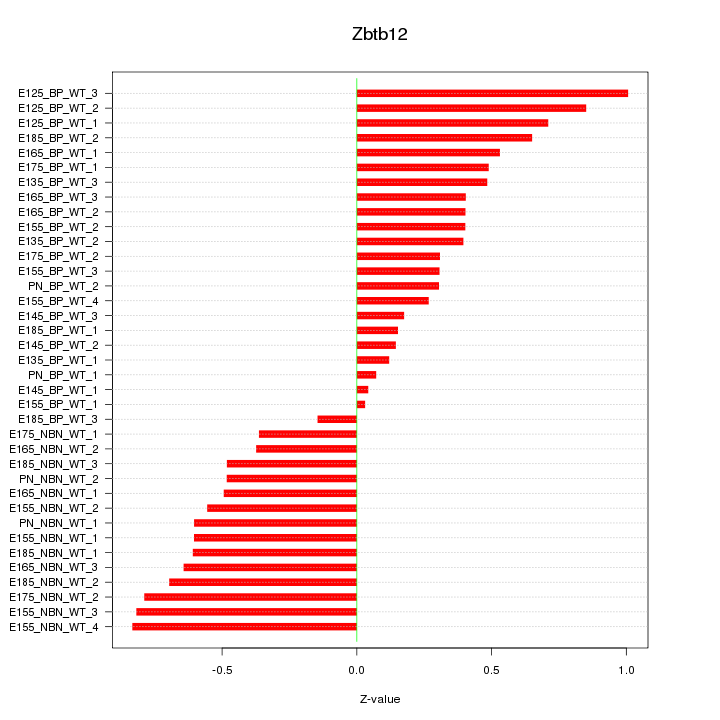
Z-value: 0.515
Transcription factors associated with Zbtb12:
| Gene Symbol | Entrez ID | Gene Name |
|---|---|---|
| Zbtb12 | ENSMUSG00000049823.8 | Zbtb12 |
Activity-expression correlation:
| Gene Symbol | Promoter | Pearson corr. coef. | P-value | Plot |
|---|---|---|---|---|
| Zbtb12 | mm10_v2_chr17_+_34894515_34894573 | -0.54 | 6.0e-04 | Click! |

Top targets:
Gene overrepresentation in biological_process category:
| Log-likelihood per target | Total log-likelihood | Term | Description |
|---|---|---|---|
| 0.8 | 2.3 | GO:0001757 | somite specification(GO:0001757) arterial endothelial cell fate commitment(GO:0060844) blood vessel endothelial cell fate commitment(GO:0060846) endothelial cell fate specification(GO:0060847) Notch signaling pathway involved in arterial endothelial cell fate commitment(GO:0060853) blood vessel endothelial cell fate specification(GO:0097101) |
| 0.4 | 4.0 | GO:0070874 | negative regulation of glycogen biosynthetic process(GO:0045719) negative regulation of glycogen metabolic process(GO:0070874) |
| 0.4 | 1.2 | GO:2001187 | natural killer cell mediated cytotoxicity directed against tumor cell target(GO:0002420) natural killer cell mediated immune response to tumor cell(GO:0002423) regulation of natural killer cell mediated immune response to tumor cell(GO:0002855) regulation of natural killer cell mediated cytotoxicity directed against tumor cell target(GO:0002858) positive regulation of CD8-positive, alpha-beta T cell activation(GO:2001187) |
| 0.4 | 1.1 | GO:1900275 | negative regulation of phospholipase C activity(GO:1900275) |
| 0.3 | 1.0 | GO:0019405 | alditol catabolic process(GO:0019405) glyceraldehyde-3-phosphate biosynthetic process(GO:0046166) |
| 0.3 | 2.7 | GO:0033601 | positive regulation of mammary gland epithelial cell proliferation(GO:0033601) |
| 0.2 | 1.9 | GO:1900194 | negative regulation of oocyte maturation(GO:1900194) |
| 0.2 | 0.6 | GO:0070682 | proteasome regulatory particle assembly(GO:0070682) |
| 0.2 | 0.5 | GO:1901187 | regulation of ephrin receptor signaling pathway(GO:1901187) |
| 0.1 | 0.3 | GO:0002586 | positive regulation of antigen processing and presentation of peptide or polysaccharide antigen via MHC class II(GO:0002582) regulation of antigen processing and presentation of peptide antigen via MHC class II(GO:0002586) positive regulation of antigen processing and presentation of peptide antigen via MHC class II(GO:0002588) |
| 0.1 | 0.5 | GO:0070562 | regulation of vitamin D receptor signaling pathway(GO:0070562) |
| 0.1 | 0.3 | GO:0046341 | CDP-diacylglycerol metabolic process(GO:0046341) |
| 0.1 | 0.3 | GO:1903896 | positive regulation of IRE1-mediated unfolded protein response(GO:1903896) |
| 0.1 | 1.0 | GO:0001675 | acrosome assembly(GO:0001675) |
| 0.1 | 1.5 | GO:0042744 | hydrogen peroxide catabolic process(GO:0042744) |
| 0.1 | 1.1 | GO:0050860 | negative regulation of T cell receptor signaling pathway(GO:0050860) |
| 0.1 | 0.5 | GO:0002154 | thyroid hormone mediated signaling pathway(GO:0002154) regulation of thyroid hormone mediated signaling pathway(GO:0002155) |
| 0.1 | 1.0 | GO:0035493 | SNARE complex assembly(GO:0035493) |
| 0.0 | 0.8 | GO:0045292 | mRNA cis splicing, via spliceosome(GO:0045292) |
| 0.0 | 0.4 | GO:0006686 | sphingomyelin biosynthetic process(GO:0006686) |
| 0.0 | 0.2 | GO:0051012 | microtubule sliding(GO:0051012) |
| 0.0 | 0.5 | GO:0043923 | positive regulation by host of viral transcription(GO:0043923) |
| 0.0 | 0.2 | GO:0033148 | positive regulation of intracellular estrogen receptor signaling pathway(GO:0033148) |
| 0.0 | 0.2 | GO:0032286 | central nervous system myelin maintenance(GO:0032286) |
| 0.0 | 0.2 | GO:0035520 | monoubiquitinated protein deubiquitination(GO:0035520) |
| 0.0 | 1.1 | GO:0030901 | midbrain development(GO:0030901) |
| 0.0 | 0.1 | GO:0097212 | cleavage furrow ingression(GO:0036090) lysosomal membrane organization(GO:0097212) positive regulation of ER to Golgi vesicle-mediated transport(GO:1902953) |
| 0.0 | 0.3 | GO:0036010 | protein localization to endosome(GO:0036010) |
| 0.0 | 0.8 | GO:0007032 | endosome organization(GO:0007032) |
| 0.0 | 0.2 | GO:0006995 | cellular response to nitrogen starvation(GO:0006995) cellular response to nitrogen levels(GO:0043562) |
| 0.0 | 0.4 | GO:0031440 | regulation of mRNA 3'-end processing(GO:0031440) |
| 0.0 | 0.4 | GO:0007131 | reciprocal meiotic recombination(GO:0007131) reciprocal DNA recombination(GO:0035825) |
Gene overrepresentation in cellular_component category:
| Log-likelihood per target | Total log-likelihood | Term | Description |
|---|---|---|---|
| 0.2 | 0.5 | GO:0055087 | Ski complex(GO:0055087) |
| 0.1 | 0.3 | GO:0061702 | inflammasome complex(GO:0061702) |
| 0.1 | 1.2 | GO:0042101 | T cell receptor complex(GO:0042101) |
| 0.1 | 0.5 | GO:0005726 | perichromatin fibrils(GO:0005726) |
| 0.0 | 1.0 | GO:0002080 | acrosomal membrane(GO:0002080) |
| 0.0 | 0.6 | GO:0008540 | proteasome regulatory particle, base subcomplex(GO:0008540) |
| 0.0 | 2.7 | GO:0016328 | lateral plasma membrane(GO:0016328) |
| 0.0 | 0.1 | GO:1990745 | EARP complex(GO:1990745) |
| 0.0 | 1.0 | GO:0030665 | clathrin-coated vesicle membrane(GO:0030665) |
| 0.0 | 1.7 | GO:0005844 | polysome(GO:0005844) |
| 0.0 | 1.9 | GO:0000932 | cytoplasmic mRNA processing body(GO:0000932) |
| 0.0 | 0.2 | GO:0042405 | nuclear inclusion body(GO:0042405) |
| 0.0 | 0.5 | GO:0045178 | basal part of cell(GO:0045178) |
| 0.0 | 0.5 | GO:0005669 | transcription factor TFIID complex(GO:0005669) |
| 0.0 | 0.8 | GO:0030136 | clathrin-coated vesicle(GO:0030136) |
| 0.0 | 0.2 | GO:0044447 | axoneme part(GO:0044447) |
| 0.0 | 0.3 | GO:0042470 | melanosome(GO:0042470) pigment granule(GO:0048770) |
| 0.0 | 0.2 | GO:0097225 | sperm midpiece(GO:0097225) |
Gene overrepresentation in molecular_function category:
| Log-likelihood per target | Total log-likelihood | Term | Description |
|---|---|---|---|
| 0.5 | 2.7 | GO:0032027 | myosin light chain binding(GO:0032027) |
| 0.2 | 1.2 | GO:0015125 | bile acid transmembrane transporter activity(GO:0015125) |
| 0.1 | 2.3 | GO:0030957 | Tat protein binding(GO:0030957) |
| 0.1 | 5.4 | GO:0005070 | SH3/SH2 adaptor activity(GO:0005070) |
| 0.1 | 1.5 | GO:0008430 | selenium binding(GO:0008430) |
| 0.1 | 1.0 | GO:0016861 | intramolecular oxidoreductase activity, interconverting aldoses and ketoses(GO:0016861) |
| 0.1 | 1.1 | GO:0070097 | delta-catenin binding(GO:0070097) |
| 0.1 | 0.5 | GO:0008239 | dipeptidyl-peptidase activity(GO:0008239) |
| 0.1 | 0.4 | GO:0033188 | sphingomyelin synthase activity(GO:0033188) ceramide cholinephosphotransferase activity(GO:0047493) |
| 0.1 | 1.7 | GO:0008266 | poly(U) RNA binding(GO:0008266) |
| 0.1 | 0.5 | GO:0034056 | estrogen response element binding(GO:0034056) |
| 0.1 | 0.4 | GO:0004652 | polynucleotide adenylyltransferase activity(GO:0004652) |
| 0.0 | 0.3 | GO:0005138 | interleukin-6 receptor binding(GO:0005138) |
| 0.0 | 0.3 | GO:0019992 | diacylglycerol binding(GO:0019992) |
| 0.0 | 1.0 | GO:0017075 | syntaxin-1 binding(GO:0017075) |
| 0.0 | 0.5 | GO:0042809 | vitamin D receptor binding(GO:0042809) |
| 0.0 | 0.8 | GO:0070064 | proline-rich region binding(GO:0070064) |
| 0.0 | 0.2 | GO:0061578 | Lys63-specific deubiquitinase activity(GO:0061578) |
| 0.0 | 0.3 | GO:0005149 | interleukin-1 receptor binding(GO:0005149) |
| 0.0 | 0.5 | GO:0046875 | ephrin receptor binding(GO:0046875) |
| 0.0 | 0.3 | GO:0017056 | structural constituent of nuclear pore(GO:0017056) |
Gene overrepresentation in C2:CP category:
| Log-likelihood per target | Total log-likelihood | Term | Description |
|---|---|---|---|
| 0.1 | 1.9 | PID_PDGFRA_PATHWAY | PDGFR-alpha signaling pathway |
| 0.1 | 4.0 | PID_IGF1_PATHWAY | IGF1 pathway |
| 0.0 | 2.7 | PID_RAC1_PATHWAY | RAC1 signaling pathway |
| 0.0 | 2.3 | PID_PS1_PATHWAY | Presenilin action in Notch and Wnt signaling |
| 0.0 | 1.1 | PID_IL2_STAT5_PATHWAY | IL2 signaling events mediated by STAT5 |
| 0.0 | 1.1 | PID_LIS1_PATHWAY | Lissencephaly gene (LIS1) in neuronal migration and development |
| 0.0 | 0.3 | PID_IL1_PATHWAY | IL1-mediated signaling events |
Gene overrepresentation in C2:CP:REACTOME category:
| Log-likelihood per target | Total log-likelihood | Term | Description |
|---|---|---|---|
| 0.2 | 4.0 | REACTOME_SIGNAL_ATTENUATION | Genes involved in Signal attenuation |
| 0.2 | 2.3 | REACTOME_RECEPTOR_LIGAND_BINDING_INITIATES_THE_SECOND_PROTEOLYTIC_CLEAVAGE_OF_NOTCH_RECEPTOR | Genes involved in Receptor-ligand binding initiates the second proteolytic cleavage of Notch receptor |
| 0.0 | 0.5 | REACTOME_INTRINSIC_PATHWAY | Genes involved in Intrinsic Pathway |
| 0.0 | 0.3 | REACTOME_THE_NLRP3_INFLAMMASOME | Genes involved in The NLRP3 inflammasome |
| 0.0 | 1.9 | REACTOME_DEPOSITION_OF_NEW_CENPA_CONTAINING_NUCLEOSOMES_AT_THE_CENTROMERE | Genes involved in Deposition of New CENPA-containing Nucleosomes at the Centromere |
| 0.0 | 1.1 | REACTOME_MYOGENESIS | Genes involved in Myogenesis |
| 0.0 | 1.0 | REACTOME_GLUCONEOGENESIS | Genes involved in Gluconeogenesis |
| 0.0 | 0.4 | REACTOME_PROCESSING_OF_INTRONLESS_PRE_MRNAS | Genes involved in Processing of Intronless Pre-mRNAs |
| 0.0 | 0.5 | REACTOME_SIGNALING_BY_FGFR1_FUSION_MUTANTS | Genes involved in Signaling by FGFR1 fusion mutants |
| 0.0 | 0.6 | REACTOME_CROSS_PRESENTATION_OF_SOLUBLE_EXOGENOUS_ANTIGENS_ENDOSOMES | Genes involved in Cross-presentation of soluble exogenous antigens (endosomes) |
| 0.0 | 0.5 | REACTOME_RNA_POL_II_TRANSCRIPTION_PRE_INITIATION_AND_PROMOTER_OPENING | Genes involved in RNA Polymerase II Transcription Pre-Initiation And Promoter Opening |
| 0.0 | 0.4 | REACTOME_MEIOTIC_RECOMBINATION | Genes involved in Meiotic Recombination |