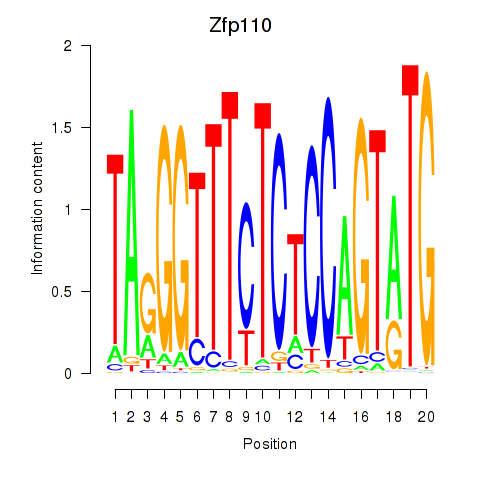
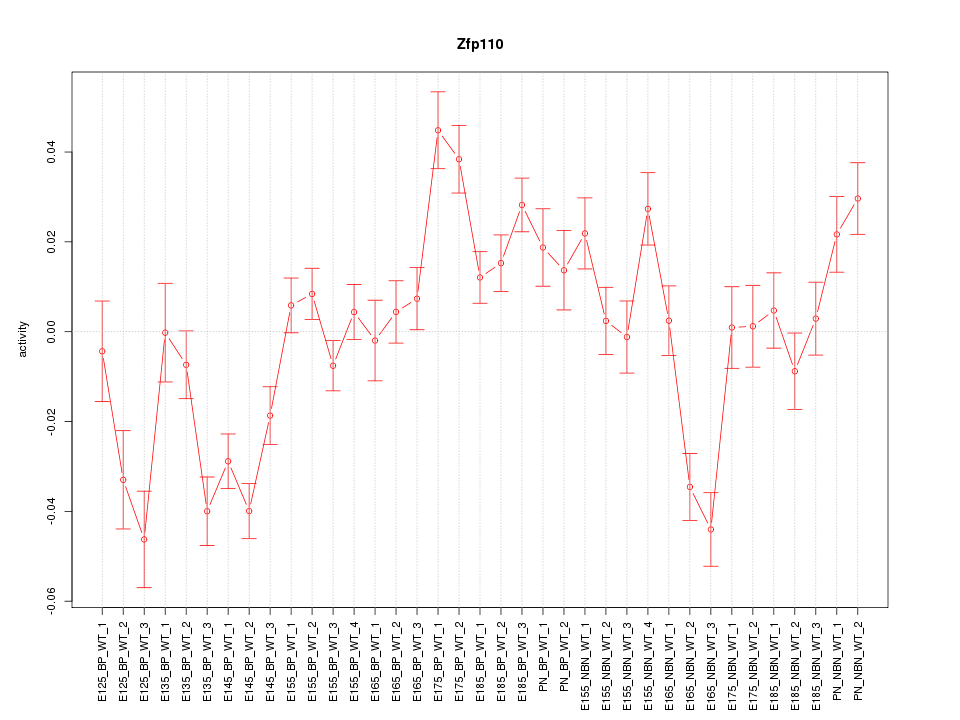
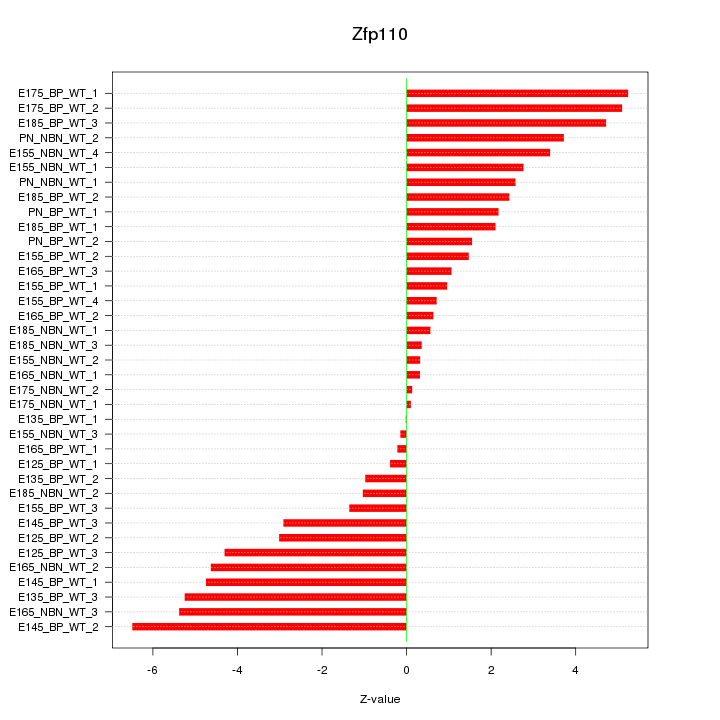
Motif ID: Zfp110
Z-value: 2.947
Transcription factors associated with Zfp110:
| Gene Symbol | Entrez ID | Gene Name |
|---|---|---|
| Zfp110 | ENSMUSG00000058638.7 | Zfp110 |
Activity-expression correlation:
| Gene Symbol | Promoter | Pearson corr. coef. | P-value | Plot |
|---|---|---|---|---|
| Zfp110 | mm10_v2_chr7_+_12834743_12834811 | 0.30 | 7.1e-02 | Click! |

Top targets:
Gene overrepresentation in biological_process category:
| Log-likelihood per target | Total log-likelihood | Term | Description |
|---|---|---|---|
| 0.5 | 4.6 | GO:0019800 | peptide cross-linking via chondroitin 4-sulfate glycosaminoglycan(GO:0019800) vascular wound healing(GO:0061042) |
| 0.5 | 1.8 | GO:0035521 | monoubiquitinated histone deubiquitination(GO:0035521) monoubiquitinated histone H2A deubiquitination(GO:0035522) |
| 0.4 | 1.8 | GO:0006272 | DNA replication, synthesis of RNA primer(GO:0006269) leading strand elongation(GO:0006272) |
| 0.3 | 1.4 | GO:1903609 | negative regulation of peptidyl-tyrosine autophosphorylation(GO:1900085) negative regulation of inward rectifier potassium channel activity(GO:1903609) |
| 0.3 | 0.8 | GO:0006507 | GPI anchor release(GO:0006507) |
| 0.2 | 2.4 | GO:0034497 | protein localization to pre-autophagosomal structure(GO:0034497) |
| 0.2 | 0.8 | GO:0002457 | T cell antigen processing and presentation(GO:0002457) |
| 0.1 | 0.4 | GO:0006553 | lysine metabolic process(GO:0006553) |
| 0.1 | 1.3 | GO:0045161 | neuronal ion channel clustering(GO:0045161) |
| 0.1 | 0.8 | GO:0090166 | Golgi disassembly(GO:0090166) |
| 0.1 | 0.7 | GO:2000786 | positive regulation of autophagosome assembly(GO:2000786) |
| 0.1 | 0.3 | GO:0034587 | piRNA metabolic process(GO:0034587) |
| 0.0 | 0.5 | GO:0010650 | positive regulation of cell communication by electrical coupling(GO:0010650) positive regulation of membrane depolarization during cardiac muscle cell action potential(GO:1900827) |
| 0.0 | 119.4 | GO:0006355 | regulation of transcription, DNA-templated(GO:0006355) |
| 0.0 | 0.7 | GO:0001964 | startle response(GO:0001964) |
| 0.0 | 0.2 | GO:0030953 | astral microtubule organization(GO:0030953) |
Gene overrepresentation in cellular_component category:
| Log-likelihood per target | Total log-likelihood | Term | Description |
|---|---|---|---|
| 0.4 | 1.8 | GO:0005658 | alpha DNA polymerase:primase complex(GO:0005658) |
| 0.2 | 2.4 | GO:0034045 | pre-autophagosomal structure membrane(GO:0034045) |
| 0.1 | 1.4 | GO:0034098 | VCP-NPL4-UFD1 AAA ATPase complex(GO:0034098) |
| 0.1 | 1.3 | GO:0044224 | juxtaparanode region of axon(GO:0044224) |
| 0.0 | 0.5 | GO:0014731 | spectrin-associated cytoskeleton(GO:0014731) |
| 0.0 | 1.2 | GO:0031463 | Cul3-RING ubiquitin ligase complex(GO:0031463) |
| 0.0 | 0.8 | GO:0031201 | SNARE complex(GO:0031201) |
| 0.0 | 4.6 | GO:0005578 | proteinaceous extracellular matrix(GO:0005578) |
| 0.0 | 195.2 | GO:0005575 | cellular_component(GO:0005575) |
Gene overrepresentation in molecular_function category:
| Log-likelihood per target | Total log-likelihood | Term | Description |
|---|---|---|---|
| 0.3 | 1.4 | GO:0070320 | inward rectifier potassium channel inhibitor activity(GO:0070320) |
| 0.1 | 0.8 | GO:0032453 | histone demethylase activity (H3-K4 specific)(GO:0032453) |
| 0.1 | 1.8 | GO:0019103 | pyrimidine nucleotide binding(GO:0019103) |
| 0.1 | 2.4 | GO:0080025 | phosphatidylinositol-3,5-bisphosphate binding(GO:0080025) |
| 0.1 | 93.0 | GO:0003700 | nucleic acid binding transcription factor activity(GO:0001071) transcription factor activity, sequence-specific DNA binding(GO:0003700) |
| 0.1 | 1.3 | GO:0004385 | guanylate kinase activity(GO:0004385) |
| 0.0 | 4.6 | GO:0008201 | heparin binding(GO:0008201) |
| 0.0 | 1.8 | GO:0004843 | thiol-dependent ubiquitin-specific protease activity(GO:0004843) |
| 0.0 | 0.8 | GO:0005484 | SNAP receptor activity(GO:0005484) |
| 0.0 | 0.4 | GO:0016780 | phosphotransferase activity, for other substituted phosphate groups(GO:0016780) |
Gene overrepresentation in C2:CP category:
| Log-likelihood per target | Total log-likelihood | Term | Description |
|---|---|---|---|
| 0.0 | 1.4 | PID_WNT_CANONICAL_PATHWAY | Canonical Wnt signaling pathway |
| 0.0 | 4.6 | NABA_ECM_GLYCOPROTEINS | Genes encoding structural ECM glycoproteins |
Gene overrepresentation in C2:CP:REACTOME category:
| Log-likelihood per target | Total log-likelihood | Term | Description |
|---|---|---|---|
| 0.1 | 1.8 | REACTOME_INHIBITION_OF_REPLICATION_INITIATION_OF_DAMAGED_DNA_BY_RB1_E2F1 | Genes involved in Inhibition of replication initiation of damaged DNA by RB1/E2F1 |
| 0.1 | 1.4 | REACTOME_HORMONE_SENSITIVE_LIPASE_HSL_MEDIATED_TRIACYLGLYCEROL_HYDROLYSIS | Genes involved in Hormone-sensitive lipase (HSL)-mediated triacylglycerol hydrolysis |
| 0.0 | 0.4 | REACTOME_VITAMIN_B5_PANTOTHENATE_METABOLISM | Genes involved in Vitamin B5 (pantothenate) metabolism |
| 0.0 | 0.5 | REACTOME_INTERACTION_BETWEEN_L1_AND_ANKYRINS | Genes involved in Interaction between L1 and Ankyrins |