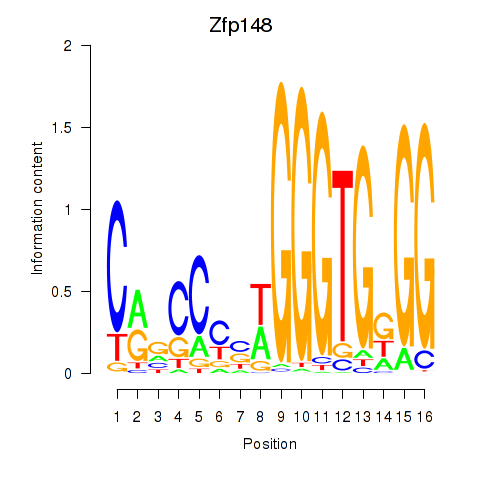
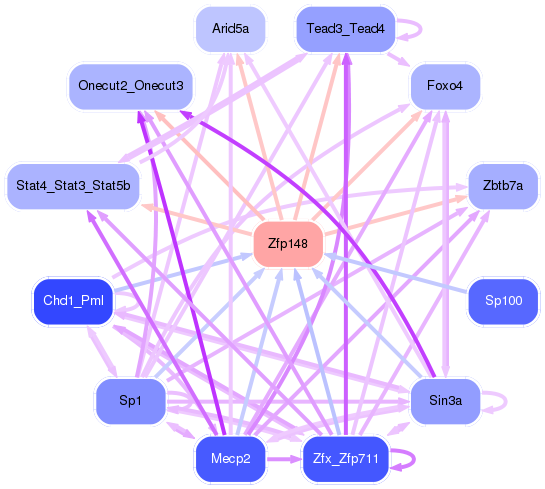
Motif ID: Zfp148
Z-value: 0.852
Transcription factors associated with Zfp148:
| Gene Symbol | Entrez ID | Gene Name |
|---|---|---|
| Zfp148 | ENSMUSG00000022811.10 | Zfp148 |
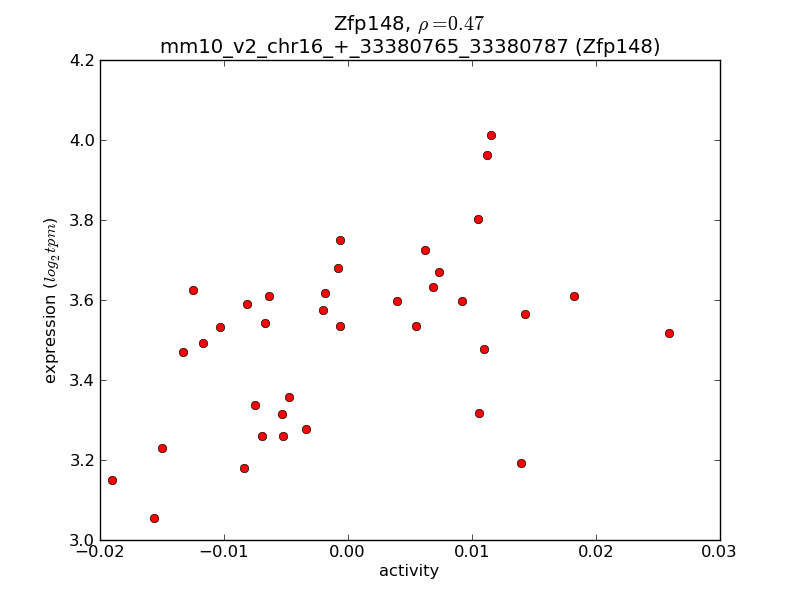
Activity-expression correlation:
| Gene Symbol | Promoter | Pearson corr. coef. | P-value | Plot |
|---|---|---|---|---|
| Zfp148 | mm10_v2_chr16_+_33380765_33380787 | 0.47 | 3.5e-03 | Click! |

Top targets:
Gene overrepresentation in biological_process category:
| Log-likelihood per target | Total log-likelihood | Term | Description |
|---|---|---|---|
| 1.9 | 11.3 | GO:0003350 | pulmonary myocardium development(GO:0003350) |
| 1.2 | 8.5 | GO:0010624 | regulation of Schwann cell proliferation(GO:0010624) |
| 1.1 | 6.5 | GO:2000672 | negative regulation of motor neuron apoptotic process(GO:2000672) |
| 0.8 | 2.5 | GO:0042939 | glutathione transport(GO:0034635) tripeptide transport(GO:0042939) |
| 0.7 | 2.1 | GO:0071677 | positive regulation of mononuclear cell migration(GO:0071677) |
| 0.5 | 2.2 | GO:1904425 | negative regulation of GTP binding(GO:1904425) |
| 0.5 | 1.6 | GO:0018199 | peptidyl-glutamine modification(GO:0018199) |
| 0.5 | 2.1 | GO:0015744 | succinate transport(GO:0015744) |
| 0.5 | 2.0 | GO:0006145 | purine nucleobase catabolic process(GO:0006145) |
| 0.5 | 1.5 | GO:0046618 | drug export(GO:0046618) |
| 0.5 | 1.4 | GO:0015910 | peroxisomal long-chain fatty acid import(GO:0015910) |
| 0.4 | 2.2 | GO:0015817 | glutamine transport(GO:0006868) histidine transport(GO:0015817) cellular response to potassium ion starvation(GO:0051365) |
| 0.4 | 1.7 | GO:0072531 | pyrimidine-containing compound transmembrane transport(GO:0072531) |
| 0.4 | 2.1 | GO:0060178 | regulation of exocyst localization(GO:0060178) |
| 0.3 | 0.9 | GO:0061153 | trachea submucosa development(GO:0061152) trachea gland development(GO:0061153) |
| 0.3 | 0.3 | GO:0046113 | nucleobase catabolic process(GO:0046113) |
| 0.3 | 2.9 | GO:0090084 | negative regulation of inclusion body assembly(GO:0090084) |
| 0.3 | 1.6 | GO:0032483 | regulation of Rab protein signal transduction(GO:0032483) |
| 0.2 | 1.5 | GO:2000049 | positive regulation of cell-cell adhesion mediated by cadherin(GO:2000049) |
| 0.2 | 2.6 | GO:0033689 | negative regulation of osteoblast proliferation(GO:0033689) |
| 0.2 | 0.9 | GO:0006558 | L-phenylalanine metabolic process(GO:0006558) erythrose 4-phosphate/phosphoenolpyruvate family amino acid metabolic process(GO:1902221) |
| 0.2 | 0.7 | GO:0007181 | transforming growth factor beta receptor complex assembly(GO:0007181) |
| 0.2 | 1.3 | GO:0045162 | clustering of voltage-gated sodium channels(GO:0045162) |
| 0.2 | 0.8 | GO:1902724 | positive regulation of skeletal muscle satellite cell proliferation(GO:1902724) positive regulation of growth factor dependent skeletal muscle satellite cell proliferation(GO:1902728) |
| 0.2 | 1.3 | GO:1900246 | positive regulation of RIG-I signaling pathway(GO:1900246) |
| 0.2 | 1.0 | GO:1990034 | calcium ion export from cell(GO:1990034) |
| 0.2 | 0.8 | GO:1900740 | regulation of protein insertion into mitochondrial membrane involved in apoptotic signaling pathway(GO:1900739) positive regulation of protein insertion into mitochondrial membrane involved in apoptotic signaling pathway(GO:1900740) |
| 0.2 | 1.7 | GO:2000467 | positive regulation of glycogen (starch) synthase activity(GO:2000467) |
| 0.2 | 0.9 | GO:0070327 | thyroid hormone transport(GO:0070327) |
| 0.2 | 2.7 | GO:0033234 | negative regulation of protein sumoylation(GO:0033234) |
| 0.2 | 0.8 | GO:1900748 | positive regulation of vascular endothelial growth factor signaling pathway(GO:1900748) |
| 0.2 | 0.5 | GO:1900226 | negative regulation of NLRP3 inflammasome complex assembly(GO:1900226) |
| 0.1 | 0.6 | GO:0036091 | positive regulation of transcription from RNA polymerase II promoter in response to oxidative stress(GO:0036091) |
| 0.1 | 1.2 | GO:0035372 | protein localization to microtubule(GO:0035372) |
| 0.1 | 0.4 | GO:1904245 | regulation of polynucleotide adenylyltransferase activity(GO:1904245) |
| 0.1 | 0.5 | GO:0035521 | monoubiquitinated histone deubiquitination(GO:0035521) monoubiquitinated histone H2A deubiquitination(GO:0035522) |
| 0.1 | 0.4 | GO:0097350 | neutrophil clearance(GO:0097350) |
| 0.1 | 1.3 | GO:0006268 | DNA unwinding involved in DNA replication(GO:0006268) |
| 0.1 | 0.4 | GO:2000686 | regulation of rubidium ion transmembrane transporter activity(GO:2000686) |
| 0.1 | 0.9 | GO:0043201 | response to leucine(GO:0043201) cellular response to leucine(GO:0071233) |
| 0.1 | 1.0 | GO:0060346 | bone trabecula formation(GO:0060346) |
| 0.1 | 0.8 | GO:0043553 | negative regulation of phosphatidylinositol 3-kinase activity(GO:0043553) |
| 0.1 | 0.7 | GO:0060050 | positive regulation of protein glycosylation(GO:0060050) |
| 0.1 | 1.0 | GO:0090050 | positive regulation of cell migration involved in sprouting angiogenesis(GO:0090050) |
| 0.1 | 0.3 | GO:0090071 | negative regulation of ribosome biogenesis(GO:0090071) |
| 0.1 | 0.4 | GO:0046947 | hydroxylysine metabolic process(GO:0046946) hydroxylysine biosynthetic process(GO:0046947) |
| 0.1 | 0.5 | GO:0045039 | protein import into mitochondrial inner membrane(GO:0045039) |
| 0.1 | 1.1 | GO:0048934 | peripheral nervous system neuron differentiation(GO:0048934) peripheral nervous system neuron development(GO:0048935) |
| 0.1 | 0.3 | GO:1904154 | protein localization to endoplasmic reticulum exit site(GO:0070973) positive regulation of retrograde protein transport, ER to cytosol(GO:1904154) |
| 0.1 | 0.7 | GO:0098532 | histone H3-K27 trimethylation(GO:0098532) |
| 0.1 | 1.1 | GO:0044539 | long-chain fatty acid import(GO:0044539) |
| 0.1 | 0.4 | GO:0031580 | membrane raft polarization(GO:0001766) membrane raft distribution(GO:0031580) |
| 0.1 | 0.7 | GO:0035092 | sperm chromatin condensation(GO:0035092) |
| 0.1 | 0.5 | GO:0090166 | Golgi disassembly(GO:0090166) |
| 0.1 | 0.3 | GO:0070317 | negative regulation of G0 to G1 transition(GO:0070317) |
| 0.1 | 1.5 | GO:0090161 | Golgi ribbon formation(GO:0090161) |
| 0.1 | 1.6 | GO:0048240 | sperm capacitation(GO:0048240) |
| 0.1 | 0.3 | GO:2000318 | positive regulation of T-helper 17 type immune response(GO:2000318) |
| 0.1 | 0.3 | GO:0033092 | positive regulation of immature T cell proliferation in thymus(GO:0033092) |
| 0.1 | 0.4 | GO:0051012 | microtubule sliding(GO:0051012) |
| 0.1 | 0.4 | GO:0036353 | histone H2A-K119 monoubiquitination(GO:0036353) |
| 0.1 | 0.6 | GO:0071493 | cellular response to UV-B(GO:0071493) |
| 0.1 | 6.0 | GO:0007156 | homophilic cell adhesion via plasma membrane adhesion molecules(GO:0007156) |
| 0.1 | 0.2 | GO:0002408 | myeloid dendritic cell chemotaxis(GO:0002408) |
| 0.1 | 0.7 | GO:0033601 | positive regulation of mammary gland epithelial cell proliferation(GO:0033601) |
| 0.1 | 0.6 | GO:0070072 | vacuolar proton-transporting V-type ATPase complex assembly(GO:0070072) |
| 0.1 | 0.3 | GO:1904717 | positive regulation of synapse structural plasticity(GO:0051835) regulation of AMPA glutamate receptor clustering(GO:1904717) |
| 0.1 | 0.7 | GO:0097067 | cellular response to thyroid hormone stimulus(GO:0097067) |
| 0.1 | 0.2 | GO:0097343 | ripoptosome assembly(GO:0097343) ripoptosome assembly involved in necroptotic process(GO:1901026) |
| 0.1 | 1.8 | GO:0061157 | mRNA destabilization(GO:0061157) |
| 0.1 | 1.8 | GO:0095500 | acetylcholine receptor signaling pathway(GO:0095500) signal transduction involved in cellular response to ammonium ion(GO:1903831) response to acetylcholine(GO:1905144) cellular response to acetylcholine(GO:1905145) |
| 0.1 | 0.5 | GO:0070813 | hydrogen sulfide metabolic process(GO:0070813) |
| 0.1 | 0.2 | GO:0071787 | endoplasmic reticulum tubular network assembly(GO:0071787) |
| 0.1 | 0.3 | GO:0044027 | hypermethylation of CpG island(GO:0044027) |
| 0.1 | 0.3 | GO:1990564 | regulation of I-kappaB phosphorylation(GO:1903719) positive regulation of I-kappaB phosphorylation(GO:1903721) protein polyufmylation(GO:1990564) protein K69-linked ufmylation(GO:1990592) |
| 0.0 | 0.5 | GO:0035434 | copper ion transmembrane transport(GO:0035434) |
| 0.0 | 0.2 | GO:0046598 | positive regulation of viral entry into host cell(GO:0046598) |
| 0.0 | 1.7 | GO:0007157 | heterophilic cell-cell adhesion via plasma membrane cell adhesion molecules(GO:0007157) |
| 0.0 | 0.3 | GO:0007343 | egg activation(GO:0007343) |
| 0.0 | 0.2 | GO:0032627 | interleukin-23 production(GO:0032627) regulation of interleukin-23 production(GO:0032667) |
| 0.0 | 0.5 | GO:0042403 | thyroid hormone metabolic process(GO:0042403) |
| 0.0 | 1.0 | GO:0071108 | protein K48-linked deubiquitination(GO:0071108) |
| 0.0 | 2.2 | GO:0048747 | muscle fiber development(GO:0048747) |
| 0.0 | 0.4 | GO:0001574 | ganglioside biosynthetic process(GO:0001574) |
| 0.0 | 0.3 | GO:1900086 | positive regulation of peptidyl-tyrosine autophosphorylation(GO:1900086) |
| 0.0 | 0.1 | GO:2000097 | arachidonic acid metabolite production involved in inflammatory response(GO:0002538) regulation of smooth muscle cell-matrix adhesion(GO:2000097) |
| 0.0 | 0.5 | GO:0055059 | asymmetric neuroblast division(GO:0055059) |
| 0.0 | 0.3 | GO:0032488 | Cdc42 protein signal transduction(GO:0032488) anterior/posterior axon guidance(GO:0033564) |
| 0.0 | 0.5 | GO:0000076 | DNA replication checkpoint(GO:0000076) |
| 0.0 | 0.4 | GO:0019368 | fatty acid elongation, saturated fatty acid(GO:0019367) fatty acid elongation, unsaturated fatty acid(GO:0019368) fatty acid elongation, monounsaturated fatty acid(GO:0034625) fatty acid elongation, polyunsaturated fatty acid(GO:0034626) |
| 0.0 | 0.3 | GO:0035269 | protein O-linked mannosylation(GO:0035269) |
| 0.0 | 0.5 | GO:0036010 | protein localization to endosome(GO:0036010) |
| 0.0 | 0.3 | GO:0034244 | negative regulation of transcription elongation from RNA polymerase II promoter(GO:0034244) |
| 0.0 | 0.1 | GO:0009446 | putrescine biosynthetic process(GO:0009446) |
| 0.0 | 0.1 | GO:1904978 | regulation of endosome organization(GO:1904978) positive regulation of endosome organization(GO:1904980) |
| 0.0 | 0.2 | GO:0007253 | cytoplasmic sequestering of NF-kappaB(GO:0007253) |
| 0.0 | 0.3 | GO:0015721 | bile acid and bile salt transport(GO:0015721) |
| 0.0 | 0.5 | GO:0001553 | luteinization(GO:0001553) |
| 0.0 | 0.2 | GO:0034975 | protein folding in endoplasmic reticulum(GO:0034975) |
| 0.0 | 0.1 | GO:0060217 | hemangioblast cell differentiation(GO:0060217) |
| 0.0 | 0.4 | GO:0007184 | SMAD protein import into nucleus(GO:0007184) |
| 0.0 | 0.6 | GO:0010719 | negative regulation of epithelial to mesenchymal transition(GO:0010719) |
| 0.0 | 0.1 | GO:0051582 | positive regulation of neurotransmitter uptake(GO:0051582) positive regulation of dopamine uptake involved in synaptic transmission(GO:0051586) positive regulation of catecholamine uptake involved in synaptic transmission(GO:0051944) |
| 0.0 | 0.3 | GO:0000187 | activation of MAPK activity(GO:0000187) |
| 0.0 | 0.4 | GO:0006656 | phosphatidylcholine biosynthetic process(GO:0006656) |
| 0.0 | 1.0 | GO:0021696 | cerebellar cortex morphogenesis(GO:0021696) |
| 0.0 | 0.2 | GO:0043589 | skin morphogenesis(GO:0043589) |
| 0.0 | 0.1 | GO:1902287 | trigeminal nerve morphogenesis(GO:0021636) trigeminal nerve structural organization(GO:0021637) semaphorin-plexin signaling pathway involved in axon guidance(GO:1902287) |
| 0.0 | 0.1 | GO:1900042 | positive regulation of interleukin-2 secretion(GO:1900042) |
| 0.0 | 1.1 | GO:0042632 | cholesterol homeostasis(GO:0042632) sterol homeostasis(GO:0055092) |
| 0.0 | 0.7 | GO:0060325 | face morphogenesis(GO:0060325) |
| 0.0 | 0.1 | GO:0060158 | phospholipase C-activating dopamine receptor signaling pathway(GO:0060158) |
| 0.0 | 0.1 | GO:0033089 | positive regulation of T cell differentiation in thymus(GO:0033089) positive regulation of thymocyte aggregation(GO:2000400) |
| 0.0 | 0.7 | GO:0043001 | Golgi to plasma membrane protein transport(GO:0043001) |
| 0.0 | 0.1 | GO:1901339 | regulation of store-operated calcium channel activity(GO:1901339) |
| 0.0 | 0.2 | GO:0007638 | mechanosensory behavior(GO:0007638) |
| 0.0 | 0.5 | GO:0048821 | erythrocyte development(GO:0048821) |
| 0.0 | 0.3 | GO:0071625 | vocalization behavior(GO:0071625) |
| 0.0 | 0.1 | GO:1903378 | positive regulation of oxidative stress-induced neuron intrinsic apoptotic signaling pathway(GO:1903378) |
| 0.0 | 0.5 | GO:0071300 | cellular response to retinoic acid(GO:0071300) |
| 0.0 | 0.1 | GO:0051152 | positive regulation of smooth muscle cell differentiation(GO:0051152) |
| 0.0 | 0.2 | GO:1900745 | positive regulation of p38MAPK cascade(GO:1900745) |
| 0.0 | 0.2 | GO:0016973 | poly(A)+ mRNA export from nucleus(GO:0016973) |
| 0.0 | 0.2 | GO:2000311 | regulation of alpha-amino-3-hydroxy-5-methyl-4-isoxazole propionate selective glutamate receptor activity(GO:2000311) |
| 0.0 | 1.1 | GO:0014013 | regulation of gliogenesis(GO:0014013) |
| 0.0 | 0.1 | GO:0031268 | pseudopodium organization(GO:0031268) |
Gene overrepresentation in cellular_component category:
| Log-likelihood per target | Total log-likelihood | Term | Description |
|---|---|---|---|
| 2.2 | 6.5 | GO:0097058 | CRLF-CLCF1 complex(GO:0097058) |
| 2.1 | 8.5 | GO:0097450 | astrocyte end-foot(GO:0097450) |
| 0.3 | 0.8 | GO:0045160 | myosin I complex(GO:0045160) |
| 0.2 | 2.5 | GO:0032426 | stereocilium tip(GO:0032426) |
| 0.2 | 0.7 | GO:0034673 | inhibin-betaglycan-ActRII complex(GO:0034673) |
| 0.2 | 1.3 | GO:0008091 | spectrin(GO:0008091) |
| 0.2 | 0.9 | GO:1990131 | Gtr1-Gtr2 GTPase complex(GO:1990131) |
| 0.2 | 1.4 | GO:0046581 | intercellular canaliculus(GO:0046581) |
| 0.2 | 1.5 | GO:0031254 | uropod(GO:0001931) cell trailing edge(GO:0031254) |
| 0.1 | 1.0 | GO:0032591 | dendritic spine membrane(GO:0032591) |
| 0.1 | 0.9 | GO:0001739 | sex chromatin(GO:0001739) |
| 0.1 | 0.4 | GO:0042719 | mitochondrial intermembrane space protein transporter complex(GO:0042719) |
| 0.1 | 0.5 | GO:0030896 | checkpoint clamp complex(GO:0030896) |
| 0.1 | 1.6 | GO:0002080 | acrosomal membrane(GO:0002080) |
| 0.1 | 1.3 | GO:0005662 | DNA replication factor A complex(GO:0005662) |
| 0.1 | 1.3 | GO:0032279 | asymmetric synapse(GO:0032279) |
| 0.1 | 0.3 | GO:0032021 | NELF complex(GO:0032021) |
| 0.1 | 0.5 | GO:0033010 | paranodal junction(GO:0033010) |
| 0.1 | 0.2 | GO:0016222 | procollagen-proline 4-dioxygenase complex(GO:0016222) |
| 0.1 | 0.3 | GO:0005784 | Sec61 translocon complex(GO:0005784) translocon complex(GO:0071256) |
| 0.1 | 1.5 | GO:0070971 | endoplasmic reticulum exit site(GO:0070971) |
| 0.0 | 0.5 | GO:1990909 | Wnt signalosome(GO:1990909) |
| 0.0 | 1.4 | GO:0005779 | integral component of peroxisomal membrane(GO:0005779) |
| 0.0 | 0.1 | GO:0005940 | septin ring(GO:0005940) |
| 0.0 | 0.2 | GO:0000346 | transcription export complex(GO:0000346) |
| 0.0 | 0.2 | GO:0005853 | eukaryotic translation elongation factor 1 complex(GO:0005853) |
| 0.0 | 0.3 | GO:0035749 | myelin sheath adaxonal region(GO:0035749) |
| 0.0 | 0.1 | GO:0042583 | chromaffin granule(GO:0042583) |
| 0.0 | 0.6 | GO:0016471 | vacuolar proton-transporting V-type ATPase complex(GO:0016471) |
| 0.0 | 0.2 | GO:0097342 | death-inducing signaling complex(GO:0031264) ripoptosome(GO:0097342) |
| 0.0 | 4.0 | GO:0016323 | basolateral plasma membrane(GO:0016323) |
| 0.0 | 0.6 | GO:0005665 | DNA-directed RNA polymerase II, core complex(GO:0005665) |
| 0.0 | 0.2 | GO:0000813 | ESCRT I complex(GO:0000813) |
| 0.0 | 1.4 | GO:0000791 | euchromatin(GO:0000791) |
| 0.0 | 0.5 | GO:0000145 | exocyst(GO:0000145) |
| 0.0 | 0.4 | GO:0042405 | nuclear inclusion body(GO:0042405) |
| 0.0 | 0.1 | GO:0033193 | Lsd1/2 complex(GO:0033193) |
| 0.0 | 0.2 | GO:0060091 | kinocilium(GO:0060091) |
| 0.0 | 0.9 | GO:0032281 | AMPA glutamate receptor complex(GO:0032281) |
| 0.0 | 1.1 | GO:0005778 | peroxisomal membrane(GO:0005778) microbody membrane(GO:0031903) |
| 0.0 | 2.2 | GO:0016528 | sarcoplasm(GO:0016528) |
| 0.0 | 2.7 | GO:0031225 | anchored component of membrane(GO:0031225) |
| 0.0 | 0.3 | GO:0032580 | Golgi cisterna membrane(GO:0032580) |
| 0.0 | 1.0 | GO:0031901 | early endosome membrane(GO:0031901) |
| 0.0 | 0.2 | GO:0000439 | core TFIIH complex(GO:0000439) |
| 0.0 | 0.3 | GO:0000124 | SAGA complex(GO:0000124) |
| 0.0 | 0.4 | GO:0071004 | U2-type prespliceosome(GO:0071004) |
| 0.0 | 0.7 | GO:0030667 | secretory granule membrane(GO:0030667) |
| 0.0 | 0.4 | GO:0043657 | host(GO:0018995) host cell part(GO:0033643) host cell(GO:0043657) |
| 0.0 | 1.1 | GO:0010494 | cytoplasmic stress granule(GO:0010494) |
| 0.0 | 0.3 | GO:0017146 | NMDA selective glutamate receptor complex(GO:0017146) |
| 0.0 | 0.1 | GO:0030906 | retromer, cargo-selective complex(GO:0030906) |
| 0.0 | 3.9 | GO:0045211 | postsynaptic membrane(GO:0045211) |
| 0.0 | 1.0 | GO:0005902 | microvillus(GO:0005902) |
| 0.0 | 0.2 | GO:0061700 | GATOR2 complex(GO:0061700) |
| 0.0 | 0.5 | GO:0032809 | neuronal cell body membrane(GO:0032809) |
| 0.0 | 0.8 | GO:0031594 | neuromuscular junction(GO:0031594) |
| 0.0 | 1.0 | GO:0005581 | collagen trimer(GO:0005581) |
| 0.0 | 0.2 | GO:0008305 | integrin complex(GO:0008305) protein complex involved in cell adhesion(GO:0098636) |
| 0.0 | 0.2 | GO:0032039 | integrator complex(GO:0032039) |
Gene overrepresentation in molecular_function category:
| Log-likelihood per target | Total log-likelihood | Term | Description |
|---|---|---|---|
| 0.9 | 6.5 | GO:0005127 | ciliary neurotrophic factor receptor binding(GO:0005127) |
| 0.9 | 11.2 | GO:0038191 | neuropilin binding(GO:0038191) |
| 0.7 | 2.2 | GO:0015182 | L-asparagine transmembrane transporter activity(GO:0015182) |
| 0.7 | 2.1 | GO:0017153 | sodium:dicarboxylate symporter activity(GO:0017153) |
| 0.4 | 1.1 | GO:0043758 | acetate-CoA ligase (ADP-forming) activity(GO:0043758) |
| 0.4 | 1.4 | GO:0005324 | long-chain fatty acid transporter activity(GO:0005324) |
| 0.3 | 1.3 | GO:0032422 | purine-rich negative regulatory element binding(GO:0032422) |
| 0.3 | 1.5 | GO:0008559 | xenobiotic-transporting ATPase activity(GO:0008559) |
| 0.3 | 0.8 | GO:0036313 | phosphatidylinositol 3-kinase catalytic subunit binding(GO:0036313) |
| 0.2 | 1.0 | GO:0034714 | type III transforming growth factor beta receptor binding(GO:0034714) |
| 0.2 | 0.9 | GO:0015349 | thyroid hormone transmembrane transporter activity(GO:0015349) |
| 0.2 | 0.7 | GO:0019002 | GMP binding(GO:0019002) |
| 0.2 | 2.5 | GO:0017081 | chloride channel regulator activity(GO:0017081) |
| 0.2 | 0.4 | GO:0071535 | RING-like zinc finger domain binding(GO:0071535) |
| 0.1 | 0.6 | GO:0004321 | fatty-acyl-CoA synthase activity(GO:0004321) |
| 0.1 | 3.6 | GO:0030506 | ankyrin binding(GO:0030506) |
| 0.1 | 1.3 | GO:0030550 | acetylcholine receptor inhibitor activity(GO:0030550) |
| 0.1 | 1.6 | GO:0016755 | transferase activity, transferring amino-acyl groups(GO:0016755) |
| 0.1 | 0.7 | GO:0004169 | dolichyl-phosphate-mannose-protein mannosyltransferase activity(GO:0004169) |
| 0.1 | 0.5 | GO:0034739 | histone deacetylase activity (H4-K16 specific)(GO:0034739) tubulin deacetylase activity(GO:0042903) |
| 0.1 | 0.7 | GO:0005114 | type II transforming growth factor beta receptor binding(GO:0005114) |
| 0.1 | 0.7 | GO:0046976 | histone methyltransferase activity (H3-K27 specific)(GO:0046976) |
| 0.1 | 8.1 | GO:0005200 | structural constituent of cytoskeleton(GO:0005200) |
| 0.1 | 0.3 | GO:0016314 | phosphatidylinositol-3,4,5-trisphosphate 3-phosphatase activity(GO:0016314) |
| 0.1 | 0.4 | GO:0008475 | procollagen-lysine 5-dioxygenase activity(GO:0008475) |
| 0.1 | 0.5 | GO:0008454 | alpha-1,3-mannosylglycoprotein 4-beta-N-acetylglucosaminyltransferase activity(GO:0008454) |
| 0.1 | 1.4 | GO:0030955 | potassium ion binding(GO:0030955) |
| 0.1 | 2.7 | GO:0019789 | SUMO transferase activity(GO:0019789) |
| 0.1 | 0.8 | GO:0031730 | CCR5 chemokine receptor binding(GO:0031730) |
| 0.1 | 0.5 | GO:0015467 | G-protein activated inward rectifier potassium channel activity(GO:0015467) |
| 0.1 | 0.3 | GO:0050510 | N-acetylgalactosaminyl-proteoglycan 3-beta-glucuronosyltransferase activity(GO:0050510) |
| 0.1 | 0.6 | GO:0061578 | Lys63-specific deubiquitinase activity(GO:0061578) |
| 0.1 | 0.3 | GO:0030160 | GKAP/Homer scaffold activity(GO:0030160) |
| 0.1 | 0.5 | GO:0002054 | nucleobase binding(GO:0002054) |
| 0.1 | 2.6 | GO:0042805 | actinin binding(GO:0042805) |
| 0.1 | 1.7 | GO:0005044 | scavenger receptor activity(GO:0005044) |
| 0.1 | 0.4 | GO:0004142 | diacylglycerol cholinephosphotransferase activity(GO:0004142) |
| 0.1 | 0.7 | GO:0035014 | phosphatidylinositol 3-kinase regulator activity(GO:0035014) |
| 0.1 | 1.1 | GO:0017128 | phospholipid scramblase activity(GO:0017128) |
| 0.1 | 0.3 | GO:0008508 | bile acid:sodium symporter activity(GO:0008508) |
| 0.1 | 0.6 | GO:0050291 | sphingosine N-acyltransferase activity(GO:0050291) |
| 0.1 | 1.3 | GO:0003950 | NAD+ ADP-ribosyltransferase activity(GO:0003950) |
| 0.1 | 0.4 | GO:0031821 | G-protein coupled serotonin receptor binding(GO:0031821) |
| 0.1 | 1.8 | GO:0043539 | protein serine/threonine kinase activator activity(GO:0043539) |
| 0.1 | 1.0 | GO:0005388 | calcium-transporting ATPase activity(GO:0005388) |
| 0.1 | 1.0 | GO:0031078 | histone deacetylase activity (H3-K14 specific)(GO:0031078) NAD-dependent histone deacetylase activity (H3-K14 specific)(GO:0032041) |
| 0.1 | 0.4 | GO:0019911 | structural constituent of myelin sheath(GO:0019911) |
| 0.1 | 0.5 | GO:0016701 | oxidoreductase activity, acting on single donors with incorporation of molecular oxygen(GO:0016701) oxidoreductase activity, acting on single donors with incorporation of molecular oxygen, incorporation of two atoms of oxygen(GO:0016702) |
| 0.1 | 1.3 | GO:0015215 | nucleotide transmembrane transporter activity(GO:0015215) |
| 0.1 | 0.8 | GO:0030898 | actin-dependent ATPase activity(GO:0030898) |
| 0.1 | 0.4 | GO:0001665 | alpha-N-acetylgalactosaminide alpha-2,6-sialyltransferase activity(GO:0001665) |
| 0.0 | 0.6 | GO:0008301 | DNA binding, bending(GO:0008301) |
| 0.0 | 0.2 | GO:0004656 | procollagen-proline 4-dioxygenase activity(GO:0004656) procollagen-proline dioxygenase activity(GO:0019798) |
| 0.0 | 0.2 | GO:0070051 | fibrinogen binding(GO:0070051) |
| 0.0 | 0.3 | GO:0003886 | DNA (cytosine-5-)-methyltransferase activity(GO:0003886) |
| 0.0 | 0.4 | GO:0032036 | myosin heavy chain binding(GO:0032036) |
| 0.0 | 0.5 | GO:0005375 | copper ion transmembrane transporter activity(GO:0005375) |
| 0.0 | 0.9 | GO:0005164 | tumor necrosis factor receptor binding(GO:0005164) |
| 0.0 | 4.7 | GO:0002020 | protease binding(GO:0002020) |
| 0.0 | 1.6 | GO:0017112 | Rab guanyl-nucleotide exchange factor activity(GO:0017112) |
| 0.0 | 2.5 | GO:0005080 | protein kinase C binding(GO:0005080) |
| 0.0 | 0.4 | GO:0009922 | fatty acid elongase activity(GO:0009922) 3-oxo-arachidoyl-CoA synthase activity(GO:0102336) 3-oxo-cerotoyl-CoA synthase activity(GO:0102337) 3-oxo-lignoceronyl-CoA synthase activity(GO:0102338) |
| 0.0 | 0.2 | GO:0031996 | thioesterase binding(GO:0031996) |
| 0.0 | 0.3 | GO:0097027 | ubiquitin-protein transferase activator activity(GO:0097027) |
| 0.0 | 0.1 | GO:0034235 | GPI anchor binding(GO:0034235) |
| 0.0 | 1.2 | GO:0016859 | cis-trans isomerase activity(GO:0016859) |
| 0.0 | 1.0 | GO:0016814 | hydrolase activity, acting on carbon-nitrogen (but not peptide) bonds, in cyclic amidines(GO:0016814) |
| 0.0 | 0.5 | GO:0070300 | phosphatidic acid binding(GO:0070300) |
| 0.0 | 0.2 | GO:0042500 | aspartic endopeptidase activity, intramembrane cleaving(GO:0042500) |
| 0.0 | 0.2 | GO:0070513 | death domain binding(GO:0070513) |
| 0.0 | 0.1 | GO:0004594 | pantothenate kinase activity(GO:0004594) |
| 0.0 | 1.6 | GO:0019003 | GDP binding(GO:0019003) |
| 0.0 | 1.9 | GO:0016810 | hydrolase activity, acting on carbon-nitrogen (but not peptide) bonds(GO:0016810) |
| 0.0 | 0.6 | GO:0046961 | proton-transporting ATPase activity, rotational mechanism(GO:0046961) |
| 0.0 | 0.4 | GO:0005545 | 1-phosphatidylinositol binding(GO:0005545) |
| 0.0 | 2.2 | GO:0051082 | unfolded protein binding(GO:0051082) |
| 0.0 | 0.7 | GO:0017147 | Wnt-protein binding(GO:0017147) |
| 0.0 | 0.4 | GO:0031683 | G-protein beta/gamma-subunit complex binding(GO:0031683) |
| 0.0 | 1.9 | GO:0003730 | mRNA 3'-UTR binding(GO:0003730) |
| 0.0 | 0.2 | GO:0042288 | MHC class I protein binding(GO:0042288) |
| 0.0 | 0.4 | GO:0070530 | K63-linked polyubiquitin binding(GO:0070530) |
| 0.0 | 0.3 | GO:0035613 | RNA stem-loop binding(GO:0035613) |
| 0.0 | 0.1 | GO:0042979 | ornithine decarboxylase regulator activity(GO:0042979) |
| 0.0 | 0.1 | GO:0043812 | phosphatidylinositol-4-phosphate phosphatase activity(GO:0043812) |
| 0.0 | 0.3 | GO:0008143 | poly(A) binding(GO:0008143) |
| 0.0 | 0.8 | GO:0070888 | E-box binding(GO:0070888) |
| 0.0 | 0.1 | GO:0004435 | phosphatidylinositol phospholipase C activity(GO:0004435) phospholipase C activity(GO:0004629) |
| 0.0 | 0.2 | GO:0070412 | R-SMAD binding(GO:0070412) |
| 0.0 | 1.0 | GO:0004252 | serine-type endopeptidase activity(GO:0004252) |
| 0.0 | 0.2 | GO:0034236 | protein kinase A catalytic subunit binding(GO:0034236) |
| 0.0 | 0.1 | GO:0005168 | neurotrophin TRKA receptor binding(GO:0005168) |
| 0.0 | 0.4 | GO:0048306 | calcium-dependent protein binding(GO:0048306) |
| 0.0 | 1.0 | GO:0004843 | thiol-dependent ubiquitin-specific protease activity(GO:0004843) |
| 0.0 | 0.2 | GO:0030215 | semaphorin receptor binding(GO:0030215) |
| 0.0 | 0.2 | GO:0003746 | translation elongation factor activity(GO:0003746) |
Gene overrepresentation in C2:CP category:
| Log-likelihood per target | Total log-likelihood | Term | Description |
|---|---|---|---|
| 0.2 | 2.7 | ST_JAK_STAT_PATHWAY | Jak-STAT Pathway |
| 0.1 | 0.8 | ST_STAT3_PATHWAY | STAT3 Pathway |
| 0.1 | 1.0 | SA_MMP_CYTOKINE_CONNECTION | Cytokines can induce activation of matrix metalloproteinases, which degrade extracellular matrix. |
| 0.1 | 11.3 | NABA_ECM_AFFILIATED | Genes encoding proteins affiliated structurally or functionally to extracellular matrix proteins |
| 0.0 | 1.0 | PID_S1P_META_PATHWAY | Sphingosine 1-phosphate (S1P) pathway |
| 0.0 | 5.8 | NABA_SECRETED_FACTORS | Genes encoding secreted soluble factors |
| 0.0 | 1.1 | PID_WNT_NONCANONICAL_PATHWAY | Noncanonical Wnt signaling pathway |
| 0.0 | 1.3 | SIG_REGULATION_OF_THE_ACTIN_CYTOSKELETON_BY_RHO_GTPASES | Genes related to regulation of the actin cytoskeleton |
| 0.0 | 3.9 | NABA_ECM_GLYCOPROTEINS | Genes encoding structural ECM glycoproteins |
| 0.0 | 1.3 | SIG_PIP3_SIGNALING_IN_B_LYMPHOCYTES | Genes related to PIP3 signaling in B lymphocytes |
| 0.0 | 2.3 | WNT_SIGNALING | Genes related to Wnt-mediated signal transduction |
| 0.0 | 0.7 | ST_TUMOR_NECROSIS_FACTOR_PATHWAY | Tumor Necrosis Factor Pathway. |
| 0.0 | 0.5 | PID_HDAC_CLASSIII_PATHWAY | Signaling events mediated by HDAC Class III |
| 0.0 | 1.0 | PID_HDAC_CLASSII_PATHWAY | Signaling events mediated by HDAC Class II |
| 0.0 | 0.2 | PID_ERBB1_DOWNSTREAM_PATHWAY | ErbB1 downstream signaling |
| 0.0 | 0.4 | PID_RAS_PATHWAY | Regulation of Ras family activation |
| 0.0 | 0.9 | PID_P73PATHWAY | p73 transcription factor network |
| 0.0 | 0.7 | PID_TGFBR_PATHWAY | TGF-beta receptor signaling |
| 0.0 | 0.2 | PID_INTEGRIN_CS_PATHWAY | Integrin family cell surface interactions |
| 0.0 | 0.9 | PID_CMYB_PATHWAY | C-MYB transcription factor network |
Gene overrepresentation in C2:CP:REACTOME category:
| Log-likelihood per target | Total log-likelihood | Term | Description |
|---|---|---|---|
| 0.2 | 9.3 | REACTOME_NUCLEAR_SIGNALING_BY_ERBB4 | Genes involved in Nuclear signaling by ERBB4 |
| 0.2 | 2.1 | REACTOME_BILE_SALT_AND_ORGANIC_ANION_SLC_TRANSPORTERS | Genes involved in Bile salt and organic anion SLC transporters |
| 0.2 | 0.4 | REACTOME_G_PROTEIN_ACTIVATION | Genes involved in G-protein activation |
| 0.1 | 0.9 | REACTOME_SEMA3A_PLEXIN_REPULSION_SIGNALING_BY_INHIBITING_INTEGRIN_ADHESION | Genes involved in SEMA3A-Plexin repulsion signaling by inhibiting Integrin adhesion |
| 0.1 | 2.5 | REACTOME_ALPHA_LINOLENIC_ACID_ALA_METABOLISM | Genes involved in alpha-linolenic acid (ALA) metabolism |
| 0.1 | 1.0 | REACTOME_PYRIMIDINE_CATABOLISM | Genes involved in Pyrimidine catabolism |
| 0.1 | 1.5 | REACTOME_REGULATION_OF_INSULIN_LIKE_GROWTH_FACTOR_IGF_ACTIVITY_BY_INSULIN_LIKE_GROWTH_FACTOR_BINDING_PROTEINS_IGFBPS | Genes involved in Regulation of Insulin-like Growth Factor (IGF) Activity by Insulin-like Growth Factor Binding Proteins (IGFBPs) |
| 0.1 | 2.2 | REACTOME_CELL_EXTRACELLULAR_MATRIX_INTERACTIONS | Genes involved in Cell-extracellular matrix interactions |
| 0.1 | 0.8 | REACTOME_IL_6_SIGNALING | Genes involved in Interleukin-6 signaling |
| 0.1 | 1.5 | REACTOME_CRMPS_IN_SEMA3A_SIGNALING | Genes involved in CRMPs in Sema3A signaling |
| 0.1 | 1.0 | REACTOME_SIGNALING_BY_PDGF | Genes involved in Signaling by PDGF |
| 0.0 | 0.4 | REACTOME_PURINE_CATABOLISM | Genes involved in Purine catabolism |
| 0.0 | 1.0 | REACTOME_TGF_BETA_RECEPTOR_SIGNALING_IN_EMT_EPITHELIAL_TO_MESENCHYMAL_TRANSITION | Genes involved in TGF-beta receptor signaling in EMT (epithelial to mesenchymal transition) |
| 0.0 | 1.7 | REACTOME_VOLTAGE_GATED_POTASSIUM_CHANNELS | Genes involved in Voltage gated Potassium channels |
| 0.0 | 1.3 | REACTOME_INTERACTION_BETWEEN_L1_AND_ANKYRINS | Genes involved in Interaction between L1 and Ankyrins |
| 0.0 | 0.4 | REACTOME_ROLE_OF_SECOND_MESSENGERS_IN_NETRIN1_SIGNALING | Genes involved in Role of second messengers in netrin-1 signaling |
| 0.0 | 0.5 | REACTOME_ADENYLATE_CYCLASE_INHIBITORY_PATHWAY | Genes involved in Adenylate cyclase inhibitory pathway |
| 0.0 | 0.2 | REACTOME_G_ALPHA_Q_SIGNALLING_EVENTS | Genes involved in G alpha (q) signalling events |
| 0.0 | 0.4 | REACTOME_SYNTHESIS_OF_PE | Genes involved in Synthesis of PE |
| 0.0 | 1.1 | REACTOME_AMINO_ACID_TRANSPORT_ACROSS_THE_PLASMA_MEMBRANE | Genes involved in Amino acid transport across the plasma membrane |
| 0.0 | 0.2 | REACTOME_MEMBRANE_BINDING_AND_TARGETTING_OF_GAG_PROTEINS | Genes involved in Membrane binding and targetting of GAG proteins |
| 0.0 | 0.6 | REACTOME_INSULIN_RECEPTOR_RECYCLING | Genes involved in Insulin receptor recycling |
| 0.0 | 0.5 | REACTOME_N_GLYCAN_ANTENNAE_ELONGATION | Genes involved in N-Glycan antennae elongation |
| 0.0 | 0.4 | REACTOME_PROCESSING_OF_INTRONLESS_PRE_MRNAS | Genes involved in Processing of Intronless Pre-mRNAs |
| 0.0 | 0.3 | REACTOME_NEGATIVE_REGULATION_OF_THE_PI3K_AKT_NETWORK | Genes involved in Negative regulation of the PI3K/AKT network |
| 0.0 | 0.3 | REACTOME_ACTIVATION_OF_CHAPERONES_BY_ATF6_ALPHA | Genes involved in Activation of Chaperones by ATF6-alpha |
| 0.0 | 0.2 | REACTOME_IKK_COMPLEX_RECRUITMENT_MEDIATED_BY_RIP1 | Genes involved in IKK complex recruitment mediated by RIP1 |
| 0.0 | 0.4 | REACTOME_SYNTHESIS_OF_VERY_LONG_CHAIN_FATTY_ACYL_COAS | Genes involved in Synthesis of very long-chain fatty acyl-CoAs |
| 0.0 | 0.6 | REACTOME_PIP3_ACTIVATES_AKT_SIGNALING | Genes involved in PIP3 activates AKT signaling |
| 0.0 | 0.2 | REACTOME_CHYLOMICRON_MEDIATED_LIPID_TRANSPORT | Genes involved in Chylomicron-mediated lipid transport |
| 0.0 | 0.2 | REACTOME_RIP_MEDIATED_NFKB_ACTIVATION_VIA_DAI | Genes involved in RIP-mediated NFkB activation via DAI |
| 0.0 | 0.5 | REACTOME_YAP1_AND_WWTR1_TAZ_STIMULATED_GENE_EXPRESSION | Genes involved in YAP1- and WWTR1 (TAZ)-stimulated gene expression |
| 0.0 | 0.2 | REACTOME_GRB2_SOS_PROVIDES_LINKAGE_TO_MAPK_SIGNALING_FOR_INTERGRINS_ | Genes involved in GRB2:SOS provides linkage to MAPK signaling for Intergrins |
| 0.0 | 0.2 | REACTOME_P38MAPK_EVENTS | Genes involved in p38MAPK events |
| 0.0 | 0.3 | REACTOME_CHONDROITIN_SULFATE_BIOSYNTHESIS | Genes involved in Chondroitin sulfate biosynthesis |
| 0.0 | 0.2 | REACTOME_MRNA_CAPPING | Genes involved in mRNA Capping |
| 0.0 | 0.3 | REACTOME_BRANCHED_CHAIN_AMINO_ACID_CATABOLISM | Genes involved in Branched-chain amino acid catabolism |