|
chr13_-_30464234
Show fit
|
2.86 |
ENST00000399489.5
ENST00000339872.8
|
HMGB1
|
high mobility group box 1
|
|
chr4_+_98995709
Show fit
|
2.17 |
ENST00000296411.11
ENST00000625963.1
|
METAP1
|
methionyl aminopeptidase 1
|
|
chr14_+_57268963
Show fit
|
1.94 |
ENST00000261558.8
|
AP5M1
|
adaptor related protein complex 5 subunit mu 1
|
|
chr3_-_113746218
Show fit
|
1.78 |
ENST00000497255.1
ENST00000240922.8
ENST00000478020.1
ENST00000493900.5
|
NAA50
|
N-alpha-acetyltransferase 50, NatE catalytic subunit
|
|
chr8_+_48008409
Show fit
|
1.54 |
ENST00000523432.5
ENST00000521346.5
ENST00000523111.7
ENST00000517630.5
|
UBE2V2
|
ubiquitin conjugating enzyme E2 V2
|
|
chr16_-_46689145
Show fit
|
1.11 |
ENST00000299138.12
|
VPS35
|
VPS35 retromer complex component
|
|
chr17_+_32350132
Show fit
|
0.75 |
ENST00000321233.10
ENST00000394673.6
ENST00000394670.9
ENST00000579634.5
ENST00000580759.5
ENST00000342555.10
ENST00000577908.5
ENST00000394679.9
ENST00000582165.1
|
ZNF207
|
zinc finger protein 207
|
|
chr7_+_12211259
Show fit
|
0.70 |
ENST00000396668.8
ENST00000444443.5
ENST00000396667.7
|
TMEM106B
|
transmembrane protein 106B
|
|
chr12_+_59689337
Show fit
|
0.65 |
ENST00000261187.8
|
SLC16A7
|
solute carrier family 16 member 7
|
|
chr2_-_241272812
Show fit
|
0.61 |
ENST00000427007.5
ENST00000458564.5
ENST00000452065.5
ENST00000427183.6
ENST00000426343.5
ENST00000422080.5
ENST00000449504.5
ENST00000449864.5
ENST00000391975.5
|
HDLBP
|
high density lipoprotein binding protein
|
|
chr6_+_42782020
Show fit
|
0.57 |
ENST00000314073.9
|
BICRAL
|
BRD4 interacting chromatin remodeling complex associated protein like
|
|
chr4_-_104494882
Show fit
|
0.45 |
ENST00000394767.3
|
CXXC4
|
CXXC finger protein 4
|
|
chr14_+_70641896
Show fit
|
0.43 |
ENST00000256367.3
|
TTC9
|
tetratricopeptide repeat domain 9
|
|
chr8_+_75539862
Show fit
|
0.27 |
ENST00000396423.4
|
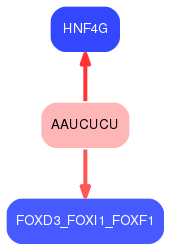
HNF4G
|
hepatocyte nuclear factor 4 gamma
|
|
chr15_+_73052449
Show fit
|
0.26 |
ENST00000261908.11
|
NEO1
|
neogenin 1
|
|
chr1_+_2391775
Show fit
|
0.21 |
ENST00000378513.7
ENST00000378518.5
ENST00000605895.6
ENST00000306256.13
ENST00000378512.5
|
RER1
|
retention in endoplasmic reticulum sorting receptor 1
|
|
chr1_+_63322558
Show fit
|
0.21 |
ENST00000371116.4
|
FOXD3
|
forkhead box D3
|
|
chr9_-_20622479
Show fit
|
0.20 |
ENST00000380338.9
|
MLLT3
|
MLLT3 super elongation complex subunit
|
|
chr17_+_66302606
Show fit
|
0.05 |
ENST00000413366.8
|
PRKCA
|
protein kinase C alpha
|

