Project
GNF SymAtlas + NCI-60 cancer cell lines, human (Su, 2004; Ross, 2000)
Navigation
Downloads
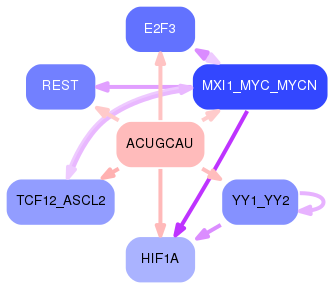
Results for ACUGCAU
Z-value: 0.48
Motif logo

miRNA associated with seed ACUGCAU
| Name | miRBASE accession |
|---|---|
|
hsa-miR-217
|
MIMAT0000274 |
|
hsa-miR-6807-3p
|
MIMAT0027515 |
Activity profile of ACUGCAU motif
Sorted Z-values of ACUGCAU motif
Network of associatons between targets according to the STRING database.

First level regulatory network of ACUGCAU
Gene Ontology Analysis
Gene overrepresentation in biological process category:
| Log-likelihood per target | Total log-likelihood | Term | Description |
|---|---|---|---|
| 1.8 | 5.5 | GO:0009996 | negative regulation of Wnt signaling pathway involved in heart development(GO:0003308) negative regulation of cell fate specification(GO:0009996) |
| 1.5 | 4.6 | GO:1902269 | positive regulation of polyamine transmembrane transport(GO:1902269) |
| 0.8 | 6.7 | GO:0035694 | mitochondrial protein catabolic process(GO:0035694) |
| 0.7 | 3.0 | GO:0021836 | cerebral cortex tangential migration using cell-cell interactions(GO:0021823) postnatal olfactory bulb interneuron migration(GO:0021827) chemorepulsion involved in postnatal olfactory bulb interneuron migration(GO:0021836) regulation of negative chemotaxis(GO:0050923) |
| 0.7 | 8.9 | GO:2000394 | positive regulation of lamellipodium morphogenesis(GO:2000394) |
| 0.7 | 5.4 | GO:0034316 | negative regulation of Arp2/3 complex-mediated actin nucleation(GO:0034316) |
| 0.7 | 3.3 | GO:0035511 | oxidative DNA demethylation(GO:0035511) |
| 0.7 | 3.9 | GO:0090625 | mRNA cleavage involved in gene silencing by miRNA(GO:0035279) mRNA cleavage involved in gene silencing by siRNA(GO:0090625) mRNA cleavage involved in gene silencing(GO:0098795) |
| 0.6 | 1.7 | GO:0060024 | rhythmic synaptic transmission(GO:0060024) |
| 0.5 | 2.2 | GO:1903347 | negative regulation of bicellular tight junction assembly(GO:1903347) |
| 0.5 | 1.6 | GO:0090611 | ubiquitin-independent protein catabolic process via the multivesicular body sorting pathway(GO:0090611) |
| 0.5 | 2.0 | GO:0061086 | negative regulation of histone H3-K27 methylation(GO:0061086) |
| 0.5 | 3.0 | GO:0061030 | epithelial cell differentiation involved in mammary gland alveolus development(GO:0061030) positive regulation of chemokine-mediated signaling pathway(GO:0070101) |
| 0.5 | 1.9 | GO:0007206 | phospholipase C-activating G-protein coupled glutamate receptor signaling pathway(GO:0007206) |
| 0.4 | 1.2 | GO:0060278 | regulation of ovulation(GO:0060278) positive regulation of ovulation(GO:0060279) |
| 0.4 | 1.6 | GO:0002188 | translation reinitiation(GO:0002188) |
| 0.4 | 2.6 | GO:0008215 | spermine metabolic process(GO:0008215) spermidine biosynthetic process(GO:0008295) |
| 0.4 | 1.1 | GO:0021897 | forebrain astrocyte differentiation(GO:0021896) forebrain astrocyte development(GO:0021897) |
| 0.3 | 1.0 | GO:0071921 | establishment of sister chromatid cohesion(GO:0034085) regulation of chromosome condensation(GO:0060623) cohesin loading(GO:0071921) regulation of cohesin loading(GO:0071922) |
| 0.3 | 1.8 | GO:0044806 | G-quadruplex DNA unwinding(GO:0044806) |
| 0.3 | 1.2 | GO:0099543 | positive regulation of circadian sleep/wake cycle, wakefulness(GO:0010841) retrograde trans-synaptic signaling by soluble gas(GO:0098923) trans-synaptic signaling by soluble gas(GO:0099543) |
| 0.3 | 2.7 | GO:1903748 | negative regulation of establishment of protein localization to mitochondrion(GO:1903748) |
| 0.3 | 2.6 | GO:0000290 | deadenylation-dependent decapping of nuclear-transcribed mRNA(GO:0000290) |
| 0.3 | 1.6 | GO:0045876 | positive regulation of sister chromatid cohesion(GO:0045876) |
| 0.3 | 1.6 | GO:0033133 | positive regulation of glucokinase activity(GO:0033133) |
| 0.2 | 2.1 | GO:1902037 | negative regulation of hematopoietic stem cell differentiation(GO:1902037) |
| 0.2 | 1.2 | GO:0006177 | GMP biosynthetic process(GO:0006177) |
| 0.2 | 5.1 | GO:0032486 | Rap protein signal transduction(GO:0032486) |
| 0.2 | 2.0 | GO:0010265 | SCF complex assembly(GO:0010265) |
| 0.2 | 0.7 | GO:0019858 | cytosine metabolic process(GO:0019858) |
| 0.2 | 2.0 | GO:0006335 | DNA replication-dependent nucleosome assembly(GO:0006335) DNA replication-dependent nucleosome organization(GO:0034723) |
| 0.2 | 2.6 | GO:0001675 | acrosome assembly(GO:0001675) |
| 0.2 | 1.1 | GO:0003408 | optic cup formation involved in camera-type eye development(GO:0003408) |
| 0.2 | 3.5 | GO:0007253 | cytoplasmic sequestering of NF-kappaB(GO:0007253) |
| 0.2 | 0.8 | GO:0034773 | histone H4-K20 trimethylation(GO:0034773) |
| 0.2 | 1.2 | GO:0019264 | L-serine catabolic process(GO:0006565) glycine biosynthetic process from serine(GO:0019264) |
| 0.2 | 2.4 | GO:2000271 | positive regulation of fibroblast apoptotic process(GO:2000271) |
| 0.2 | 4.5 | GO:0045880 | positive regulation of smoothened signaling pathway(GO:0045880) |
| 0.2 | 1.6 | GO:0070345 | negative regulation of fat cell proliferation(GO:0070345) |
| 0.2 | 1.4 | GO:1902962 | regulation of metalloendopeptidase activity involved in amyloid precursor protein catabolic process(GO:1902962) negative regulation of metalloendopeptidase activity involved in amyloid precursor protein catabolic process(GO:1902963) |
| 0.2 | 1.3 | GO:0035583 | sequestering of TGFbeta in extracellular matrix(GO:0035583) |
| 0.2 | 1.2 | GO:1902857 | positive regulation of nonmotile primary cilium assembly(GO:1902857) |
| 0.2 | 0.5 | GO:0034635 | glutathione transport(GO:0034635) tripeptide transport(GO:0042939) |
| 0.2 | 0.5 | GO:0061588 | calcium activated phospholipid scrambling(GO:0061588) calcium activated phosphatidylcholine scrambling(GO:0061590) calcium activated galactosylceramide scrambling(GO:0061591) |
| 0.2 | 2.5 | GO:0010225 | response to UV-C(GO:0010225) |
| 0.2 | 5.9 | GO:0000717 | nucleotide-excision repair, DNA duplex unwinding(GO:0000717) |
| 0.1 | 2.1 | GO:0005981 | regulation of glycogen catabolic process(GO:0005981) |
| 0.1 | 1.3 | GO:0080182 | histone H3-K4 trimethylation(GO:0080182) |
| 0.1 | 0.4 | GO:2000740 | amniotic stem cell differentiation(GO:0097086) negative regulation of dense core granule biogenesis(GO:2000706) negative regulation of mesenchymal stem cell differentiation(GO:2000740) regulation of amniotic stem cell differentiation(GO:2000797) negative regulation of amniotic stem cell differentiation(GO:2000798) |
| 0.1 | 1.2 | GO:0098814 | spontaneous neurotransmitter secretion(GO:0061669) spontaneous synaptic transmission(GO:0098814) |
| 0.1 | 5.8 | GO:0006376 | mRNA splice site selection(GO:0006376) |
| 0.1 | 1.4 | GO:0001672 | regulation of chromatin assembly or disassembly(GO:0001672) |
| 0.1 | 5.4 | GO:1900740 | regulation of protein insertion into mitochondrial membrane involved in apoptotic signaling pathway(GO:1900739) positive regulation of protein insertion into mitochondrial membrane involved in apoptotic signaling pathway(GO:1900740) |
| 0.1 | 5.4 | GO:0043090 | amino acid import(GO:0043090) |
| 0.1 | 2.6 | GO:0019054 | modulation by virus of host process(GO:0019054) |
| 0.1 | 0.2 | GO:0060434 | bronchus morphogenesis(GO:0060434) lens fiber cell apoptotic process(GO:1990086) |
| 0.1 | 0.2 | GO:0071934 | thiamine transport(GO:0015888) thiamine transmembrane transport(GO:0071934) |
| 0.1 | 0.3 | GO:0048880 | sensory system development(GO:0048880) |
| 0.1 | 2.3 | GO:0003016 | respiratory system process(GO:0003016) |
| 0.1 | 3.1 | GO:0055090 | acylglycerol homeostasis(GO:0055090) triglyceride homeostasis(GO:0070328) |
| 0.1 | 0.6 | GO:0061299 | retina vasculature morphogenesis in camera-type eye(GO:0061299) |
| 0.1 | 1.8 | GO:0071173 | mitotic spindle assembly checkpoint(GO:0007094) spindle assembly checkpoint(GO:0071173) |
| 0.1 | 5.4 | GO:0006446 | regulation of translational initiation(GO:0006446) |
| 0.1 | 0.8 | GO:0048172 | regulation of short-term neuronal synaptic plasticity(GO:0048172) |
| 0.0 | 0.6 | GO:0006122 | mitochondrial electron transport, ubiquinol to cytochrome c(GO:0006122) |
| 0.0 | 1.0 | GO:0036295 | cellular response to increased oxygen levels(GO:0036295) |
| 0.0 | 0.4 | GO:0036066 | pyrimidine nucleotide-sugar transport(GO:0015781) protein O-linked fucosylation(GO:0036066) |
| 0.0 | 1.1 | GO:0060148 | positive regulation of posttranscriptional gene silencing(GO:0060148) positive regulation of gene silencing by miRNA(GO:2000637) |
| 0.0 | 0.1 | GO:0050653 | chondroitin sulfate proteoglycan biosynthetic process, polysaccharide chain biosynthetic process(GO:0050653) |
| 0.0 | 0.9 | GO:0006907 | pinocytosis(GO:0006907) |
| 0.0 | 3.9 | GO:1902036 | regulation of hematopoietic stem cell differentiation(GO:1902036) |
| 0.0 | 1.6 | GO:0070534 | protein K63-linked ubiquitination(GO:0070534) |
| 0.0 | 0.4 | GO:0036342 | post-anal tail morphogenesis(GO:0036342) |
| 0.0 | 2.3 | GO:0031663 | lipopolysaccharide-mediated signaling pathway(GO:0031663) |
| 0.0 | 0.3 | GO:2001256 | regulation of store-operated calcium entry(GO:2001256) |
| 0.0 | 1.1 | GO:0016574 | histone ubiquitination(GO:0016574) |
| 0.0 | 1.0 | GO:0051642 | centrosome localization(GO:0051642) |
| 0.0 | 1.3 | GO:0032508 | DNA duplex unwinding(GO:0032508) |
| 0.0 | 0.3 | GO:0045793 | positive regulation of cell size(GO:0045793) |
| 0.0 | 1.3 | GO:0046513 | ceramide biosynthetic process(GO:0046513) |
| 0.0 | 1.0 | GO:0018279 | protein N-linked glycosylation via asparagine(GO:0018279) |
| 0.0 | 0.8 | GO:0017145 | stem cell division(GO:0017145) |
| 0.0 | 0.4 | GO:0032793 | positive regulation of CREB transcription factor activity(GO:0032793) |
| 0.0 | 0.1 | GO:0032482 | Rab protein signal transduction(GO:0032482) |
| 0.0 | 1.2 | GO:0090307 | mitotic spindle assembly(GO:0090307) |
| 0.0 | 0.1 | GO:0031936 | negative regulation of chromatin silencing(GO:0031936) |
| 0.0 | 1.7 | GO:0035335 | peptidyl-tyrosine dephosphorylation(GO:0035335) |
| 0.0 | 2.1 | GO:0006413 | translational initiation(GO:0006413) |
Gene overrepresentation in cellular component category:
| Log-likelihood per target | Total log-likelihood | Term | Description |
|---|---|---|---|
| 1.5 | 5.9 | GO:0071942 | XPC complex(GO:0071942) |
| 0.6 | 8.8 | GO:0016600 | flotillin complex(GO:0016600) |
| 0.5 | 1.6 | GO:1990723 | cytoplasmic periphery of the nuclear pore complex(GO:1990723) |
| 0.4 | 1.2 | GO:0043511 | inhibin complex(GO:0043511) inhibin A complex(GO:0043512) |
| 0.4 | 3.9 | GO:0035068 | micro-ribonucleoprotein complex(GO:0035068) |
| 0.3 | 2.6 | GO:0016442 | RISC complex(GO:0016442) RNAi effector complex(GO:0031332) |
| 0.3 | 2.7 | GO:0098554 | cytoplasmic side of endoplasmic reticulum membrane(GO:0098554) |
| 0.3 | 1.4 | GO:0070381 | endosome to plasma membrane transport vesicle(GO:0070381) |
| 0.2 | 2.3 | GO:0046581 | intercellular canaliculus(GO:0046581) |
| 0.2 | 2.1 | GO:0072357 | glycogen granule(GO:0042587) PTW/PP1 phosphatase complex(GO:0072357) |
| 0.2 | 1.6 | GO:0042382 | paraspeckles(GO:0042382) |
| 0.1 | 2.2 | GO:0032059 | bleb(GO:0032059) |
| 0.1 | 1.7 | GO:0035749 | myelin sheath adaxonal region(GO:0035749) |
| 0.1 | 2.5 | GO:0031011 | Ino80 complex(GO:0031011) DNA helicase complex(GO:0033202) |
| 0.1 | 1.1 | GO:0001739 | sex chromatin(GO:0001739) |
| 0.1 | 1.3 | GO:0070449 | elongin complex(GO:0070449) |
| 0.1 | 1.3 | GO:0016593 | Cdc73/Paf1 complex(GO:0016593) |
| 0.1 | 1.6 | GO:0090543 | Flemming body(GO:0090543) |
| 0.1 | 1.0 | GO:0008278 | cohesin complex(GO:0008278) |
| 0.1 | 1.0 | GO:0033180 | proton-transporting V-type ATPase, V1 domain(GO:0033180) |
| 0.1 | 1.7 | GO:0035098 | ESC/E(Z) complex(GO:0035098) |
| 0.1 | 1.2 | GO:0017146 | NMDA selective glutamate receptor complex(GO:0017146) |
| 0.1 | 3.4 | GO:0016592 | mediator complex(GO:0016592) |
| 0.1 | 1.0 | GO:0008250 | oligosaccharyltransferase complex(GO:0008250) |
| 0.1 | 2.1 | GO:0005852 | eukaryotic translation initiation factor 3 complex(GO:0005852) |
| 0.1 | 1.3 | GO:0001527 | microfibril(GO:0001527) fibril(GO:0043205) |
| 0.1 | 0.2 | GO:0070022 | transforming growth factor beta receptor homodimeric complex(GO:0070022) |
| 0.1 | 0.1 | GO:0098837 | postsynaptic recycling endosome(GO:0098837) |
| 0.0 | 5.4 | GO:0005905 | clathrin-coated pit(GO:0005905) |
| 0.0 | 5.8 | GO:0017053 | transcriptional repressor complex(GO:0017053) |
| 0.0 | 0.6 | GO:0005750 | mitochondrial respiratory chain complex III(GO:0005750) respiratory chain complex III(GO:0045275) |
| 0.0 | 5.1 | GO:0005643 | nuclear pore(GO:0005643) |
| 0.0 | 2.5 | GO:0043034 | costamere(GO:0043034) |
| 0.0 | 2.1 | GO:0042645 | nucleoid(GO:0009295) mitochondrial nucleoid(GO:0042645) |
| 0.0 | 1.0 | GO:0005868 | cytoplasmic dynein complex(GO:0005868) |
| 0.0 | 2.7 | GO:0035577 | azurophil granule membrane(GO:0035577) |
| 0.0 | 1.1 | GO:0071564 | SWI/SNF complex(GO:0016514) npBAF complex(GO:0071564) |
| 0.0 | 0.8 | GO:0032591 | dendritic spine membrane(GO:0032591) |
| 0.0 | 4.7 | GO:0030175 | filopodium(GO:0030175) |
| 0.0 | 1.2 | GO:0097228 | sperm principal piece(GO:0097228) |
| 0.0 | 0.8 | GO:0000780 | condensed nuclear chromosome, centromeric region(GO:0000780) |
| 0.0 | 6.6 | GO:0090575 | RNA polymerase II transcription factor complex(GO:0090575) |
| 0.0 | 2.4 | GO:0055038 | recycling endosome membrane(GO:0055038) |
| 0.0 | 2.1 | GO:0010494 | cytoplasmic stress granule(GO:0010494) |
| 0.0 | 0.7 | GO:0031143 | pseudopodium(GO:0031143) |
| 0.0 | 0.6 | GO:1990124 | messenger ribonucleoprotein complex(GO:1990124) |
| 0.0 | 1.8 | GO:0000777 | condensed chromosome kinetochore(GO:0000777) |
| 0.0 | 1.2 | GO:0048786 | presynaptic active zone(GO:0048786) |
| 0.0 | 0.2 | GO:0071011 | precatalytic spliceosome(GO:0071011) |
| 0.0 | 0.6 | GO:0005839 | proteasome core complex(GO:0005839) |
| 0.0 | 2.1 | GO:0031901 | early endosome membrane(GO:0031901) |
| 0.0 | 1.8 | GO:0071013 | catalytic step 2 spliceosome(GO:0071013) |
| 0.0 | 6.7 | GO:0005743 | mitochondrial inner membrane(GO:0005743) |
| 0.0 | 1.7 | GO:0035578 | azurophil granule lumen(GO:0035578) |
| 0.0 | 1.4 | GO:0005882 | intermediate filament(GO:0005882) |
| 0.0 | 0.6 | GO:0005902 | microvillus(GO:0005902) |
| 0.0 | 2.1 | GO:0101002 | ficolin-1-rich granule(GO:0101002) ficolin-1-rich granule lumen(GO:1904813) |
Gene overrepresentation in molecular function category:
| Log-likelihood per target | Total log-likelihood | Term | Description |
|---|---|---|---|
| 1.5 | 4.5 | GO:0050510 | N-acetylgalactosaminyl-proteoglycan 3-beta-glucuronosyltransferase activity(GO:0050510) |
| 1.3 | 3.9 | GO:0098808 | mRNA cap binding(GO:0098808) |
| 1.0 | 6.7 | GO:0050815 | phosphoserine binding(GO:0050815) |
| 0.9 | 2.6 | GO:0004534 | 5'-3' exoribonuclease activity(GO:0004534) |
| 0.8 | 6.7 | GO:0004176 | ATP-dependent peptidase activity(GO:0004176) |
| 0.7 | 2.2 | GO:0043739 | G/U mismatch-specific uracil-DNA glycosylase activity(GO:0043739) |
| 0.7 | 5.4 | GO:0071933 | Arp2/3 complex binding(GO:0071933) |
| 0.7 | 4.6 | GO:0042978 | ornithine decarboxylase activator activity(GO:0042978) |
| 0.6 | 1.7 | GO:0051717 | inositol-1,3,4,5-tetrakisphosphate 3-phosphatase activity(GO:0051717) |
| 0.5 | 6.2 | GO:1990247 | N6-methyladenosine-containing RNA binding(GO:1990247) |
| 0.5 | 5.5 | GO:0039706 | co-receptor binding(GO:0039706) |
| 0.4 | 2.1 | GO:0017018 | myosin phosphatase activity(GO:0017018) |
| 0.3 | 2.7 | GO:0008046 | axon guidance receptor activity(GO:0008046) |
| 0.3 | 1.6 | GO:0031871 | proteinase activated receptor binding(GO:0031871) |
| 0.3 | 1.2 | GO:0070905 | serine binding(GO:0070905) |
| 0.3 | 7.9 | GO:0005092 | GDP-dissociation inhibitor activity(GO:0005092) |
| 0.2 | 2.7 | GO:0055131 | C3HC4-type RING finger domain binding(GO:0055131) |
| 0.2 | 4.3 | GO:0035497 | cAMP response element binding(GO:0035497) |
| 0.2 | 3.4 | GO:0042809 | vitamin D receptor binding(GO:0042809) |
| 0.2 | 1.3 | GO:0050291 | sphingosine N-acyltransferase activity(GO:0050291) |
| 0.2 | 1.3 | GO:0030023 | extracellular matrix constituent conferring elasticity(GO:0030023) |
| 0.2 | 1.0 | GO:0097100 | supercoiled DNA binding(GO:0097100) |
| 0.1 | 1.2 | GO:0070699 | type II activin receptor binding(GO:0070699) |
| 0.1 | 0.4 | GO:0047756 | N-acetylgalactosamine 4-O-sulfotransferase activity(GO:0001537) chondroitin 4-sulfotransferase activity(GO:0047756) |
| 0.1 | 9.1 | GO:0003743 | translation initiation factor activity(GO:0003743) |
| 0.1 | 0.6 | GO:0051032 | nucleic acid transmembrane transporter activity(GO:0051032) RNA transmembrane transporter activity(GO:0051033) |
| 0.1 | 0.5 | GO:0035673 | oligopeptide transmembrane transporter activity(GO:0035673) |
| 0.1 | 2.2 | GO:0017049 | GTP-Rho binding(GO:0017049) |
| 0.1 | 1.9 | GO:0035256 | G-protein coupled glutamate receptor binding(GO:0035256) |
| 0.1 | 1.1 | GO:0033592 | RNA strand annealing activity(GO:0033592) |
| 0.1 | 1.0 | GO:0004579 | dolichyl-diphosphooligosaccharide-protein glycotransferase activity(GO:0004579) |
| 0.1 | 5.9 | GO:0031593 | polyubiquitin binding(GO:0031593) |
| 0.1 | 4.7 | GO:0050699 | WW domain binding(GO:0050699) |
| 0.1 | 1.4 | GO:0032050 | clathrin heavy chain binding(GO:0032050) |
| 0.1 | 7.4 | GO:0048365 | Rac GTPase binding(GO:0048365) |
| 0.1 | 3.3 | GO:0030159 | receptor signaling complex scaffold activity(GO:0030159) |
| 0.1 | 2.5 | GO:0000400 | four-way junction DNA binding(GO:0000400) |
| 0.1 | 6.8 | GO:0019003 | GDP binding(GO:0019003) |
| 0.1 | 0.2 | GO:0005026 | transforming growth factor beta receptor activity, type II(GO:0005026) |
| 0.1 | 1.2 | GO:0016884 | carbon-nitrogen ligase activity, with glutamine as amido-N-donor(GO:0016884) |
| 0.1 | 0.2 | GO:0015403 | thiamine transmembrane transporter activity(GO:0015234) thiamine uptake transmembrane transporter activity(GO:0015403) |
| 0.1 | 1.0 | GO:0045504 | dynein heavy chain binding(GO:0045504) |
| 0.1 | 1.2 | GO:0042043 | neurexin family protein binding(GO:0042043) |
| 0.1 | 1.6 | GO:0019789 | SUMO transferase activity(GO:0019789) |
| 0.1 | 2.5 | GO:0008139 | nuclear localization sequence binding(GO:0008139) |
| 0.1 | 2.3 | GO:0051059 | NF-kappaB binding(GO:0051059) |
| 0.1 | 3.0 | GO:0051879 | Hsp90 protein binding(GO:0051879) |
| 0.1 | 2.0 | GO:0017025 | TBP-class protein binding(GO:0017025) |
| 0.0 | 0.4 | GO:0050733 | RS domain binding(GO:0050733) |
| 0.0 | 2.6 | GO:0016831 | carboxy-lyase activity(GO:0016831) |
| 0.0 | 1.2 | GO:0070840 | dynein complex binding(GO:0070840) |
| 0.0 | 0.2 | GO:0042799 | histone methyltransferase activity (H4-K20 specific)(GO:0042799) |
| 0.0 | 0.7 | GO:0031435 | mitogen-activated protein kinase kinase kinase binding(GO:0031435) |
| 0.0 | 3.1 | GO:0035064 | methylated histone binding(GO:0035064) |
| 0.0 | 0.4 | GO:0005005 | transmembrane-ephrin receptor activity(GO:0005005) |
| 0.0 | 0.1 | GO:0047238 | glucuronosyl-N-acetylgalactosaminyl-proteoglycan 4-beta-N-acetylgalactosaminyltransferase activity(GO:0047238) |
| 0.0 | 1.1 | GO:0008198 | ferrous iron binding(GO:0008198) |
| 0.0 | 0.1 | GO:0061649 | ubiquitinated histone binding(GO:0061649) |
| 0.0 | 1.0 | GO:0046961 | ATPase activity, coupled to transmembrane movement of ions, rotational mechanism(GO:0044769) proton-transporting ATPase activity, rotational mechanism(GO:0046961) |
| 0.0 | 1.1 | GO:0046966 | thyroid hormone receptor binding(GO:0046966) |
| 0.0 | 0.2 | GO:0004594 | pantothenate kinase activity(GO:0004594) |
| 0.0 | 1.6 | GO:0061650 | ubiquitin conjugating enzyme activity(GO:0061631) ubiquitin-like protein conjugating enzyme activity(GO:0061650) |
| 0.0 | 0.5 | GO:0005229 | intracellular calcium activated chloride channel activity(GO:0005229) |
| 0.0 | 1.7 | GO:0008138 | protein tyrosine/serine/threonine phosphatase activity(GO:0008138) |
| 0.0 | 1.3 | GO:0004003 | ATP-dependent DNA helicase activity(GO:0004003) |
| 0.0 | 0.6 | GO:0070628 | proteasome binding(GO:0070628) |
| 0.0 | 1.6 | GO:0000980 | RNA polymerase II distal enhancer sequence-specific DNA binding(GO:0000980) |
| 0.0 | 1.1 | GO:0031491 | nucleosome binding(GO:0031491) |
| 0.0 | 0.8 | GO:0017091 | AU-rich element binding(GO:0017091) |
| 0.0 | 0.4 | GO:0015271 | outward rectifier potassium channel activity(GO:0015271) |
| 0.0 | 0.3 | GO:0030215 | semaphorin receptor binding(GO:0030215) |
| 0.0 | 0.1 | GO:0004839 | ubiquitin activating enzyme activity(GO:0004839) |
| 0.0 | 2.1 | GO:0051082 | unfolded protein binding(GO:0051082) |
| 0.0 | 1.8 | GO:0042393 | histone binding(GO:0042393) |
| 0.0 | 0.6 | GO:0004364 | glutathione transferase activity(GO:0004364) |
Gene overrepresentation in curated gene sets: canonical pathways category:
| Log-likelihood per target | Total log-likelihood | Term | Description |
|---|---|---|---|
| 0.1 | 5.4 | PID INSULIN GLUCOSE PATHWAY | Insulin-mediated glucose transport |
| 0.1 | 2.2 | PID THROMBIN PAR4 PATHWAY | PAR4-mediated thrombin signaling events |
| 0.1 | 5.8 | ST WNT BETA CATENIN PATHWAY | Wnt/beta-catenin Pathway |
| 0.1 | 8.1 | PID ECADHERIN NASCENT AJ PATHWAY | E-cadherin signaling in the nascent adherens junction |
| 0.1 | 3.0 | PID HIF1A PATHWAY | Hypoxic and oxygen homeostasis regulation of HIF-1-alpha |
| 0.1 | 2.3 | PID TCR RAS PATHWAY | Ras signaling in the CD4+ TCR pathway |
| 0.1 | 1.7 | SA PTEN PATHWAY | PTEN is a tumor suppressor that dephosphorylates the lipid messenger phosphatidylinositol triphosphate. |
| 0.1 | 1.6 | PID RANBP2 PATHWAY | Sumoylation by RanBP2 regulates transcriptional repression |
| 0.0 | 3.0 | PID AJDISS 2PATHWAY | Posttranslational regulation of adherens junction stability and dissassembly |
| 0.0 | 3.2 | PID PLK1 PATHWAY | PLK1 signaling events |
| 0.0 | 2.6 | ST TUMOR NECROSIS FACTOR PATHWAY | Tumor Necrosis Factor Pathway. |
| 0.0 | 1.9 | SIG REGULATION OF THE ACTIN CYTOSKELETON BY RHO GTPASES | Genes related to regulation of the actin cytoskeleton |
| 0.0 | 2.1 | PID HES HEY PATHWAY | Notch-mediated HES/HEY network |
| 0.0 | 1.3 | PID ALK1 PATHWAY | ALK1 signaling events |
| 0.0 | 3.2 | PID MYC ACTIV PATHWAY | Validated targets of C-MYC transcriptional activation |
| 0.0 | 1.4 | PID ARF6 TRAFFICKING PATHWAY | Arf6 trafficking events |
| 0.0 | 1.6 | PID AR TF PATHWAY | Regulation of Androgen receptor activity |
| 0.0 | 0.5 | PID S1P S1P1 PATHWAY | S1P1 pathway |
Gene overrepresentation in curated gene sets: REACTOME pathways category:
| Log-likelihood per target | Total log-likelihood | Term | Description |
|---|---|---|---|
| 0.6 | 7.7 | REACTOME RAF MAP KINASE CASCADE | Genes involved in RAF/MAP kinase cascade |
| 0.2 | 5.9 | REACTOME FORMATION OF INCISION COMPLEX IN GG NER | Genes involved in Formation of incision complex in GG-NER |
| 0.2 | 2.0 | REACTOME NEGATIVE REGULATION OF THE PI3K AKT NETWORK | Genes involved in Negative regulation of the PI3K/AKT network |
| 0.2 | 5.0 | REACTOME CHONDROITIN SULFATE BIOSYNTHESIS | Genes involved in Chondroitin sulfate biosynthesis |
| 0.2 | 2.6 | REACTOME DESTABILIZATION OF MRNA BY BRF1 | Genes involved in Destabilization of mRNA by Butyrate Response Factor 1 (BRF1) |
| 0.1 | 3.5 | REACTOME P130CAS LINKAGE TO MAPK SIGNALING FOR INTEGRINS | Genes involved in p130Cas linkage to MAPK signaling for integrins |
| 0.1 | 7.3 | REACTOME SIGNALING BY ROBO RECEPTOR | Genes involved in Signaling by Robo receptor |
| 0.1 | 2.6 | REACTOME METABOLISM OF POLYAMINES | Genes involved in Metabolism of polyamines |
| 0.1 | 1.6 | REACTOME CDC6 ASSOCIATION WITH THE ORC ORIGIN COMPLEX | Genes involved in CDC6 association with the ORC:origin complex |
| 0.1 | 2.2 | REACTOME BASE FREE SUGAR PHOSPHATE REMOVAL VIA THE SINGLE NUCLEOTIDE REPLACEMENT PATHWAY | Genes involved in Base-free sugar-phosphate removal via the single-nucleotide replacement pathway |
| 0.1 | 1.2 | REACTOME GLYCOPROTEIN HORMONES | Genes involved in Glycoprotein hormones |
| 0.1 | 1.0 | REACTOME APOBEC3G MEDIATED RESISTANCE TO HIV1 INFECTION | Genes involved in APOBEC3G mediated resistance to HIV-1 infection |
| 0.1 | 3.0 | REACTOME OXYGEN DEPENDENT PROLINE HYDROXYLATION OF HYPOXIA INDUCIBLE FACTOR ALPHA | Genes involved in Oxygen-dependent Proline Hydroxylation of Hypoxia-inducible Factor Alpha |
| 0.1 | 1.2 | REACTOME PURINE RIBONUCLEOSIDE MONOPHOSPHATE BIOSYNTHESIS | Genes involved in Purine ribonucleoside monophosphate biosynthesis |
| 0.1 | 5.2 | REACTOME REGULATION OF ORNITHINE DECARBOXYLASE ODC | Genes involved in Regulation of ornithine decarboxylase (ODC) |
| 0.1 | 4.3 | REACTOME MYOGENESIS | Genes involved in Myogenesis |
| 0.1 | 2.1 | REACTOME HORMONE SENSITIVE LIPASE HSL MEDIATED TRIACYLGLYCEROL HYDROLYSIS | Genes involved in Hormone-sensitive lipase (HSL)-mediated triacylglycerol hydrolysis |
| 0.1 | 2.2 | REACTOME SEMA4D INDUCED CELL MIGRATION AND GROWTH CONE COLLAPSE | Genes involved in Sema4D induced cell migration and growth-cone collapse |
| 0.0 | 2.7 | REACTOME MITOCHONDRIAL PROTEIN IMPORT | Genes involved in Mitochondrial Protein Import |
| 0.0 | 1.6 | REACTOME INTERACTIONS OF VPR WITH HOST CELLULAR PROTEINS | Genes involved in Interactions of Vpr with host cellular proteins |
| 0.0 | 1.3 | REACTOME SPHINGOLIPID DE NOVO BIOSYNTHESIS | Genes involved in Sphingolipid de novo biosynthesis |
| 0.0 | 1.2 | REACTOME KINESINS | Genes involved in Kinesins |
| 0.0 | 2.5 | REACTOME ANTIVIRAL MECHANISM BY IFN STIMULATED GENES | Genes involved in Antiviral mechanism by IFN-stimulated genes |
| 0.0 | 1.0 | REACTOME INSULIN RECEPTOR RECYCLING | Genes involved in Insulin receptor recycling |
| 0.0 | 5.1 | REACTOME MRNA SPLICING | Genes involved in mRNA Splicing |
| 0.0 | 2.1 | REACTOME FORMATION OF THE TERNARY COMPLEX AND SUBSEQUENTLY THE 43S COMPLEX | Genes involved in Formation of the ternary complex, and subsequently, the 43S complex |
| 0.0 | 3.8 | REACTOME SIGNALING BY RHO GTPASES | Genes involved in Signaling by Rho GTPases |
| 0.0 | 3.6 | REACTOME TRANSLATION | Genes involved in Translation |
| 0.0 | 0.2 | REACTOME TGF BETA RECEPTOR SIGNALING IN EMT EPITHELIAL TO MESENCHYMAL TRANSITION | Genes involved in TGF-beta receptor signaling in EMT (epithelial to mesenchymal transition) |
| 0.0 | 1.4 | REACTOME GOLGI ASSOCIATED VESICLE BIOGENESIS | Genes involved in Golgi Associated Vesicle Biogenesis |
| 0.0 | 0.3 | REACTOME SEMA3A PLEXIN REPULSION SIGNALING BY INHIBITING INTEGRIN ADHESION | Genes involved in SEMA3A-Plexin repulsion signaling by inhibiting Integrin adhesion |
| 0.0 | 0.2 | REACTOME VITAMIN B5 PANTOTHENATE METABOLISM | Genes involved in Vitamin B5 (pantothenate) metabolism |
| 0.0 | 0.7 | REACTOME METABOLISM OF VITAMINS AND COFACTORS | Genes involved in Metabolism of vitamins and cofactors |
| 0.0 | 1.0 | REACTOME ASPARAGINE N LINKED GLYCOSYLATION | Genes involved in Asparagine N-linked glycosylation |
| 0.0 | 1.0 | REACTOME MHC CLASS II ANTIGEN PRESENTATION | Genes involved in MHC class II antigen presentation |