Project
GNF SymAtlas + NCI-60 cancer cell lines, human (Su, 2004; Ross, 2000)
Navigation
Downloads
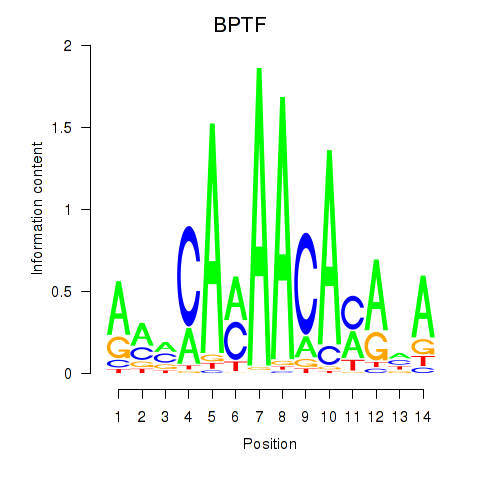
Results for BPTF
Z-value: 1.92
Motif logo
Transcription factors associated with BPTF
| Gene Symbol | Gene ID | Gene Info |
|---|---|---|
|
BPTF
|
ENSG00000171634.18 | BPTF |
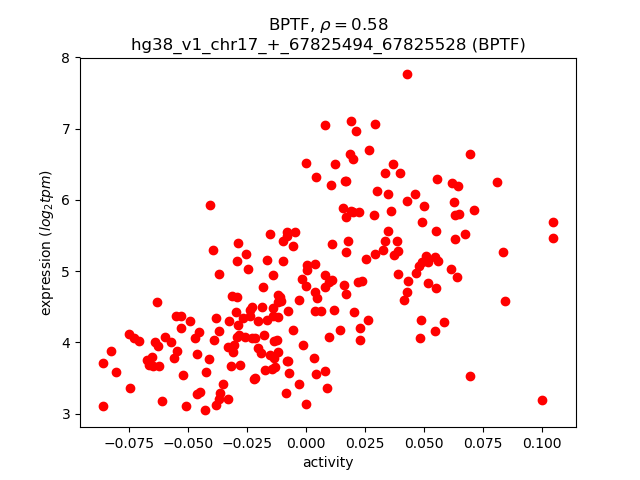
Activity-expression correlation:
| Gene | Promoter | Pearson corr. coef. | P-value | Plot |
|---|---|---|---|---|
| BPTF | hg38_v1_chr17_+_67825494_67825528 | 0.58 | 1.1e-20 | Click! |
Activity profile of BPTF motif
Sorted Z-values of BPTF motif
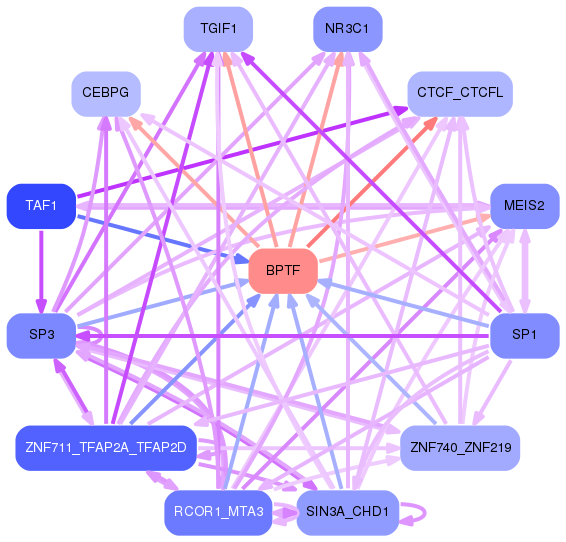
Network of associatons between targets according to the STRING database.

First level regulatory network of BPTF
Gene Ontology Analysis
Gene overrepresentation in biological process category:
| Log-likelihood per target | Total log-likelihood | Term | Description |
|---|---|---|---|
| 14.7 | 44.1 | GO:0046452 | dihydrofolate metabolic process(GO:0046452) |
| 12.7 | 50.7 | GO:2000434 | regulation of protein neddylation(GO:2000434) negative regulation of protein neddylation(GO:2000435) |
| 11.6 | 34.9 | GO:1901421 | positive regulation of response to alcohol(GO:1901421) |
| 11.2 | 33.6 | GO:0001831 | trophectodermal cellular morphogenesis(GO:0001831) |
| 10.8 | 43.1 | GO:0006238 | CMP salvage(GO:0006238) CMP biosynthetic process(GO:0009224) CMP metabolic process(GO:0046035) |
| 10.2 | 40.9 | GO:0006269 | DNA replication, synthesis of RNA primer(GO:0006269) |
| 8.8 | 35.4 | GO:0006556 | S-adenosylmethionine biosynthetic process(GO:0006556) |
| 7.5 | 30.0 | GO:0046121 | deoxyribonucleoside catabolic process(GO:0046121) |
| 7.2 | 21.7 | GO:0043328 | protein targeting to vacuole involved in ubiquitin-dependent protein catabolic process via the multivesicular body sorting pathway(GO:0043328) |
| 7.2 | 21.6 | GO:0072428 | signal transduction involved in intra-S DNA damage checkpoint(GO:0072428) response to bisphenol A(GO:1903925) cellular response to bisphenol A(GO:1903926) |
| 6.9 | 20.6 | GO:0036466 | synaptic vesicle recycling via endosome(GO:0036466) mitochondrial membrane fission(GO:0090149) |
| 6.7 | 26.7 | GO:2001247 | positive regulation of phosphatidylcholine biosynthetic process(GO:2001247) |
| 6.6 | 46.1 | GO:0010216 | maintenance of DNA methylation(GO:0010216) |
| 6.5 | 26.2 | GO:0072369 | regulation of lipid transport by positive regulation of transcription from RNA polymerase II promoter(GO:0072369) |
| 6.3 | 18.9 | GO:2000521 | negative regulation of immunological synapse formation(GO:2000521) |
| 5.7 | 34.2 | GO:0048254 | snoRNA localization(GO:0048254) |
| 5.5 | 77.0 | GO:1904871 | regulation of protein localization to Cajal body(GO:1904869) positive regulation of protein localization to Cajal body(GO:1904871) |
| 5.4 | 37.9 | GO:0006880 | intracellular sequestering of iron ion(GO:0006880) sequestering of iron ion(GO:0097577) |
| 5.3 | 74.8 | GO:0051096 | positive regulation of helicase activity(GO:0051096) |
| 5.3 | 21.4 | GO:0018231 | peptidyl-L-cysteine S-palmitoylation(GO:0018230) peptidyl-S-diacylglycerol-L-cysteine biosynthetic process from peptidyl-cysteine(GO:0018231) |
| 5.1 | 30.4 | GO:1900368 | regulation of RNA interference(GO:1900368) negative regulation of RNA interference(GO:1900369) |
| 5.0 | 15.0 | GO:0098974 | postsynaptic actin cytoskeleton organization(GO:0098974) |
| 5.0 | 29.9 | GO:1903435 | positive regulation of constitutive secretory pathway(GO:1903435) |
| 4.8 | 24.2 | GO:0071163 | DNA replication preinitiation complex assembly(GO:0071163) |
| 4.8 | 19.2 | GO:2001280 | positive regulation of prostaglandin biosynthetic process(GO:0031394) negative regulation of phospholipase A2 activity(GO:1900138) positive regulation of unsaturated fatty acid biosynthetic process(GO:2001280) |
| 4.6 | 22.9 | GO:0044111 | development involved in symbiotic interaction(GO:0044111) |
| 4.5 | 31.5 | GO:0046985 | positive regulation of hemoglobin biosynthetic process(GO:0046985) |
| 4.4 | 30.5 | GO:1901977 | negative regulation of cell cycle checkpoint(GO:1901977) negative regulation of DNA damage checkpoint(GO:2000002) |
| 4.3 | 13.0 | GO:1902524 | negative regulation of interferon-alpha production(GO:0032687) positive regulation of protein K48-linked ubiquitination(GO:1902524) |
| 4.2 | 38.2 | GO:0000395 | mRNA 5'-splice site recognition(GO:0000395) |
| 4.2 | 16.9 | GO:1904924 | negative regulation of mitophagy in response to mitochondrial depolarization(GO:1904924) |
| 4.2 | 46.2 | GO:0000492 | box C/D snoRNP assembly(GO:0000492) |
| 4.2 | 8.4 | GO:0072019 | proximal convoluted tubule development(GO:0072019) metanephric proximal convoluted tubule development(GO:0072229) |
| 4.2 | 33.4 | GO:0006689 | ganglioside catabolic process(GO:0006689) |
| 4.2 | 20.8 | GO:0070433 | negative regulation of nucleotide-binding oligomerization domain containing signaling pathway(GO:0070425) negative regulation of nucleotide-binding oligomerization domain containing 2 signaling pathway(GO:0070433) |
| 4.1 | 20.4 | GO:0030950 | establishment or maintenance of actin cytoskeleton polarity(GO:0030950) |
| 4.1 | 24.3 | GO:0051167 | glucuronate catabolic process(GO:0006064) glucuronate catabolic process to xylulose 5-phosphate(GO:0019640) xylulose 5-phosphate metabolic process(GO:0051167) xylulose 5-phosphate biosynthetic process(GO:1901159) |
| 4.0 | 24.0 | GO:0051708 | intracellular transport of viral protein in host cell(GO:0019060) symbiont intracellular protein transport in host(GO:0030581) intracellular protein transport in other organism involved in symbiotic interaction(GO:0051708) |
| 4.0 | 23.7 | GO:0006931 | substrate-dependent cell migration, cell attachment to substrate(GO:0006931) |
| 3.9 | 19.6 | GO:0031291 | Ran protein signal transduction(GO:0031291) |
| 3.9 | 27.3 | GO:0071475 | cellular hyperosmotic salinity response(GO:0071475) |
| 3.9 | 15.6 | GO:0006258 | UDP-glucose catabolic process(GO:0006258) positive regulation of adrenergic receptor signaling pathway(GO:0071879) negative regulation of type B pancreatic cell development(GO:2000077) |
| 3.9 | 15.5 | GO:0046900 | tetrahydrofolylpolyglutamate metabolic process(GO:0046900) |
| 3.8 | 11.5 | GO:0034473 | U1 snRNA 3'-end processing(GO:0034473) U5 snRNA 3'-end processing(GO:0034476) |
| 3.7 | 29.6 | GO:0034316 | negative regulation of Arp2/3 complex-mediated actin nucleation(GO:0034316) |
| 3.6 | 10.8 | GO:2000360 | negative regulation of binding of sperm to zona pellucida(GO:2000360) |
| 3.6 | 18.0 | GO:0030242 | pexophagy(GO:0030242) |
| 3.6 | 25.1 | GO:0008295 | spermidine biosynthetic process(GO:0008295) |
| 3.6 | 14.3 | GO:0009137 | purine nucleoside diphosphate catabolic process(GO:0009137) purine ribonucleoside diphosphate catabolic process(GO:0009181) |
| 3.5 | 10.5 | GO:2000863 | positive regulation of estrogen secretion(GO:2000863) positive regulation of estradiol secretion(GO:2000866) |
| 3.4 | 13.6 | GO:0044210 | 'de novo' CTP biosynthetic process(GO:0044210) |
| 3.4 | 10.2 | GO:0070213 | protein auto-ADP-ribosylation(GO:0070213) |
| 3.4 | 13.5 | GO:0044837 | assembly of actomyosin apparatus involved in cytokinesis(GO:0000912) actomyosin contractile ring assembly(GO:0000915) actomyosin contractile ring organization(GO:0044837) |
| 3.3 | 16.5 | GO:1903588 | negative regulation of blood vessel endothelial cell proliferation involved in sprouting angiogenesis(GO:1903588) |
| 3.3 | 9.8 | GO:0034729 | histone H3-K79 methylation(GO:0034729) |
| 3.3 | 26.1 | GO:0072733 | response to staurosporine(GO:0072733) cellular response to staurosporine(GO:0072734) |
| 3.3 | 26.1 | GO:0032020 | ISG15-protein conjugation(GO:0032020) |
| 3.2 | 19.2 | GO:0051563 | smooth endoplasmic reticulum calcium ion homeostasis(GO:0051563) |
| 3.2 | 6.4 | GO:0099403 | negative regulation of maintenance of sister chromatid cohesion(GO:0034092) negative regulation of maintenance of mitotic sister chromatid cohesion(GO:0034183) maintenance of mitotic sister chromatid cohesion, telomeric(GO:0099403) mitotic sister chromatid cohesion, telomeric(GO:0099404) regulation of maintenance of mitotic sister chromatid cohesion, telomeric(GO:1904907) negative regulation of maintenance of mitotic sister chromatid cohesion, telomeric(GO:1904908) |
| 3.2 | 15.8 | GO:0019276 | UDP-N-acetylgalactosamine metabolic process(GO:0019276) |
| 3.2 | 9.5 | GO:0046586 | regulation of calcium-dependent cell-cell adhesion(GO:0046586) |
| 3.1 | 18.7 | GO:0032487 | regulation of Rap protein signal transduction(GO:0032487) |
| 3.1 | 12.4 | GO:0036116 | medium-chain fatty-acyl-CoA catabolic process(GO:0036114) long-chain fatty-acyl-CoA catabolic process(GO:0036116) palmitic acid metabolic process(GO:1900533) palmitic acid biosynthetic process(GO:1900535) |
| 3.1 | 12.4 | GO:0032511 | late endosome to vacuole transport via multivesicular body sorting pathway(GO:0032511) |
| 3.1 | 21.5 | GO:0010792 | DNA double-strand break processing involved in repair via single-strand annealing(GO:0010792) |
| 3.0 | 12.2 | GO:0002270 | plasmacytoid dendritic cell activation(GO:0002270) regulation of restriction endodeoxyribonuclease activity(GO:0032072) negative regulation of apoptotic cell clearance(GO:2000426) |
| 3.0 | 6.1 | GO:0098923 | retrograde trans-synaptic signaling by soluble gas(GO:0098923) trans-synaptic signaling by soluble gas(GO:0099543) |
| 3.0 | 27.3 | GO:0030952 | establishment or maintenance of cytoskeleton polarity(GO:0030952) |
| 2.9 | 8.8 | GO:0018094 | protein polyglycylation(GO:0018094) |
| 2.9 | 11.6 | GO:0009051 | pentose-phosphate shunt, oxidative branch(GO:0009051) |
| 2.9 | 8.7 | GO:0044376 | RNA polymerase II complex import to nucleus(GO:0044376) RNA polymerase III complex localization to nucleus(GO:1990022) |
| 2.9 | 14.4 | GO:0007144 | female meiosis I(GO:0007144) |
| 2.9 | 20.0 | GO:0010724 | regulation of definitive erythrocyte differentiation(GO:0010724) |
| 2.8 | 19.9 | GO:0050689 | negative regulation of defense response to virus by host(GO:0050689) |
| 2.8 | 30.7 | GO:0010756 | positive regulation of plasminogen activation(GO:0010756) |
| 2.7 | 11.0 | GO:0035880 | embryonic nail plate morphogenesis(GO:0035880) |
| 2.7 | 2.7 | GO:0071335 | submandibular salivary gland formation(GO:0060661) hair follicle cell proliferation(GO:0071335) regulation of hair follicle cell proliferation(GO:0071336) positive regulation of hair follicle cell proliferation(GO:0071338) |
| 2.7 | 8.0 | GO:0038195 | urokinase plasminogen activator signaling pathway(GO:0038195) |
| 2.6 | 26.4 | GO:1901409 | positive regulation of phosphorylation of RNA polymerase II C-terminal domain(GO:1901409) |
| 2.6 | 7.7 | GO:1901388 | regulation of transforming growth factor beta activation(GO:1901388) negative regulation of transforming growth factor beta activation(GO:1901389) |
| 2.5 | 10.2 | GO:2000393 | negative regulation of lamellipodium morphogenesis(GO:2000393) |
| 2.5 | 2.5 | GO:1903094 | regulation of protein K48-linked deubiquitination(GO:1903093) negative regulation of protein K48-linked deubiquitination(GO:1903094) negative regulation of ubiquitin-specific protease activity(GO:2000157) |
| 2.5 | 32.3 | GO:0045835 | negative regulation of meiotic nuclear division(GO:0045835) |
| 2.5 | 32.0 | GO:1900623 | regulation of monocyte aggregation(GO:1900623) positive regulation of monocyte aggregation(GO:1900625) |
| 2.5 | 7.4 | GO:0016344 | meiotic chromosome movement towards spindle pole(GO:0016344) |
| 2.4 | 17.0 | GO:0015712 | hexose phosphate transport(GO:0015712) glucose-6-phosphate transport(GO:0015760) |
| 2.4 | 14.4 | GO:0098989 | NMDA selective glutamate receptor signaling pathway(GO:0098989) |
| 2.4 | 19.1 | GO:0002318 | myeloid progenitor cell differentiation(GO:0002318) |
| 2.4 | 14.3 | GO:0050668 | cellular response to phosphate starvation(GO:0016036) positive regulation of sulfur amino acid metabolic process(GO:0031337) positive regulation of homocysteine metabolic process(GO:0050668) |
| 2.4 | 7.1 | GO:0010796 | regulation of multivesicular body size(GO:0010796) |
| 2.4 | 11.8 | GO:0006177 | GMP biosynthetic process(GO:0006177) |
| 2.4 | 7.1 | GO:0036111 | very long-chain fatty-acyl-CoA metabolic process(GO:0036111) |
| 2.4 | 4.7 | GO:2000234 | positive regulation of ribosome biogenesis(GO:0090070) positive regulation of rRNA processing(GO:2000234) |
| 2.3 | 9.3 | GO:2000327 | regulation of ligand-dependent nuclear receptor transcription coactivator activity(GO:2000325) positive regulation of ligand-dependent nuclear receptor transcription coactivator activity(GO:2000327) |
| 2.3 | 6.9 | GO:0007518 | myoblast fate determination(GO:0007518) |
| 2.3 | 6.8 | GO:1903721 | regulation of I-kappaB phosphorylation(GO:1903719) positive regulation of I-kappaB phosphorylation(GO:1903721) |
| 2.3 | 9.0 | GO:0008616 | queuosine biosynthetic process(GO:0008616) queuosine metabolic process(GO:0046116) |
| 2.2 | 4.5 | GO:2000349 | negative regulation of CD40 signaling pathway(GO:2000349) |
| 2.2 | 6.7 | GO:0044565 | dendritic cell proliferation(GO:0044565) |
| 2.2 | 86.5 | GO:0000387 | spliceosomal snRNP assembly(GO:0000387) |
| 2.2 | 167.0 | GO:0070125 | mitochondrial translational elongation(GO:0070125) |
| 2.2 | 11.0 | GO:1902626 | assembly of large subunit precursor of preribosome(GO:1902626) |
| 2.2 | 10.8 | GO:1900264 | regulation of DNA-directed DNA polymerase activity(GO:1900262) positive regulation of DNA-directed DNA polymerase activity(GO:1900264) |
| 2.2 | 8.6 | GO:0034773 | histone H4-K20 trimethylation(GO:0034773) |
| 2.2 | 19.4 | GO:0010265 | SCF complex assembly(GO:0010265) |
| 2.2 | 6.5 | GO:1903031 | regulation of microtubule plus-end binding(GO:1903031) positive regulation of microtubule plus-end binding(GO:1903033) |
| 2.2 | 25.9 | GO:0006268 | DNA unwinding involved in DNA replication(GO:0006268) |
| 2.1 | 15.0 | GO:0046726 | positive regulation by virus of viral protein levels in host cell(GO:0046726) |
| 2.1 | 29.8 | GO:0051988 | regulation of attachment of spindle microtubules to kinetochore(GO:0051988) |
| 2.1 | 12.8 | GO:0006065 | UDP-glucuronate biosynthetic process(GO:0006065) glucose 1-phosphate metabolic process(GO:0019255) UDP-glucuronate metabolic process(GO:0046398) |
| 2.1 | 8.5 | GO:0019323 | pentose catabolic process(GO:0019323) |
| 2.1 | 6.3 | GO:0050717 | positive regulation of interleukin-1 alpha secretion(GO:0050717) |
| 2.1 | 6.3 | GO:0060739 | mesenchymal-epithelial cell signaling involved in prostate gland development(GO:0060739) |
| 2.1 | 12.4 | GO:0033152 | immunoglobulin V(D)J recombination(GO:0033152) |
| 2.1 | 8.3 | GO:0007206 | phospholipase C-activating G-protein coupled glutamate receptor signaling pathway(GO:0007206) |
| 2.0 | 12.3 | GO:0009438 | methylglyoxal metabolic process(GO:0009438) |
| 2.0 | 46.7 | GO:0043968 | histone H2A acetylation(GO:0043968) |
| 2.0 | 22.0 | GO:0031936 | negative regulation of chromatin silencing(GO:0031936) |
| 2.0 | 8.0 | GO:0050917 | sensory perception of sweet taste(GO:0050916) sensory perception of umami taste(GO:0050917) |
| 2.0 | 18.0 | GO:0006189 | AMP biosynthetic process(GO:0006167) 'de novo' IMP biosynthetic process(GO:0006189) |
| 2.0 | 8.0 | GO:0061552 | vestibulocochlear nerve structural organization(GO:0021649) positive regulation of cytokine activity(GO:0060301) ganglion morphogenesis(GO:0061552) endothelial tip cell fate specification(GO:0097102) VEGF-activated neuropilin signaling pathway involved in axon guidance(GO:1902378) dorsal root ganglion morphogenesis(GO:1904835) otic placode development(GO:1905040) |
| 2.0 | 6.0 | GO:1903436 | regulation of cytokinetic process(GO:0032954) regulation of mitotic cytokinetic process(GO:1903436) positive regulation of mitotic cytokinetic process(GO:1903438) positive regulation of mitotic cytokinesis(GO:1903490) |
| 2.0 | 7.9 | GO:0043987 | histone H3-S10 phosphorylation(GO:0043987) |
| 2.0 | 17.8 | GO:0045039 | protein import into mitochondrial inner membrane(GO:0045039) |
| 2.0 | 5.9 | GO:0006172 | ADP biosynthetic process(GO:0006172) |
| 2.0 | 17.6 | GO:0071578 | zinc II ion transmembrane import(GO:0071578) |
| 2.0 | 29.4 | GO:0006122 | mitochondrial electron transport, ubiquinol to cytochrome c(GO:0006122) |
| 1.9 | 21.4 | GO:0042262 | DNA protection(GO:0042262) |
| 1.9 | 15.5 | GO:1902255 | positive regulation of intrinsic apoptotic signaling pathway by p53 class mediator(GO:1902255) |
| 1.9 | 1.9 | GO:1900041 | negative regulation of interleukin-2 secretion(GO:1900041) |
| 1.9 | 7.7 | GO:0061484 | hematopoietic stem cell homeostasis(GO:0061484) |
| 1.9 | 23.2 | GO:0007076 | mitotic chromosome condensation(GO:0007076) |
| 1.9 | 222.4 | GO:0031145 | anaphase-promoting complex-dependent catabolic process(GO:0031145) |
| 1.9 | 3.8 | GO:0014878 | response to electrical stimulus involved in regulation of muscle adaptation(GO:0014878) |
| 1.9 | 15.2 | GO:0050859 | negative regulation of B cell receptor signaling pathway(GO:0050859) |
| 1.9 | 20.5 | GO:0000056 | ribosomal small subunit export from nucleus(GO:0000056) |
| 1.8 | 31.3 | GO:0070389 | chaperone cofactor-dependent protein refolding(GO:0070389) |
| 1.8 | 5.5 | GO:0036089 | cleavage furrow formation(GO:0036089) |
| 1.8 | 7.3 | GO:1903758 | regulation of transcription from RNA polymerase II promoter by histone modification(GO:1903756) negative regulation of transcription from RNA polymerase II promoter by histone modification(GO:1903758) |
| 1.8 | 3.6 | GO:0002277 | myeloid dendritic cell activation involved in immune response(GO:0002277) |
| 1.8 | 23.3 | GO:2000774 | positive regulation of cell aging(GO:0090343) positive regulation of cellular senescence(GO:2000774) |
| 1.8 | 5.3 | GO:1905000 | regulation of membrane repolarization during atrial cardiac muscle cell action potential(GO:1905000) |
| 1.7 | 6.8 | GO:0009956 | radial pattern formation(GO:0009956) |
| 1.7 | 6.8 | GO:0048388 | endosomal lumen acidification(GO:0048388) |
| 1.7 | 8.4 | GO:1904636 | response to ionomycin(GO:1904636) cellular response to ionomycin(GO:1904637) |
| 1.7 | 11.7 | GO:0032057 | negative regulation of translational initiation in response to stress(GO:0032057) |
| 1.7 | 15.1 | GO:0043402 | glucocorticoid mediated signaling pathway(GO:0043402) |
| 1.7 | 5.0 | GO:0001545 | primary ovarian follicle growth(GO:0001545) |
| 1.7 | 5.0 | GO:2000687 | negative regulation of rubidium ion transport(GO:2000681) negative regulation of rubidium ion transmembrane transporter activity(GO:2000687) |
| 1.6 | 27.9 | GO:0035518 | histone H2A monoubiquitination(GO:0035518) |
| 1.6 | 32.7 | GO:0000715 | nucleotide-excision repair, DNA damage recognition(GO:0000715) |
| 1.6 | 1.6 | GO:0060467 | negative regulation of fertilization(GO:0060467) |
| 1.6 | 14.5 | GO:0060574 | intestinal epithelial cell maturation(GO:0060574) |
| 1.6 | 8.0 | GO:0001315 | age-dependent response to oxidative stress(GO:0001306) age-dependent response to reactive oxygen species(GO:0001315) regulation of systemic arterial blood pressure by acetylcholine(GO:0003068) vasodilation by acetylcholine involved in regulation of systemic arterial blood pressure(GO:0003069) regulation of systemic arterial blood pressure by neurotransmitter(GO:0003070) age-dependent general metabolic decline(GO:0007571) |
| 1.6 | 25.4 | GO:0030150 | protein import into mitochondrial matrix(GO:0030150) |
| 1.6 | 20.7 | GO:0000076 | DNA replication checkpoint(GO:0000076) |
| 1.6 | 11.0 | GO:0042998 | positive regulation of Golgi to plasma membrane protein transport(GO:0042998) |
| 1.6 | 23.4 | GO:1903608 | protein localization to cytoplasmic stress granule(GO:1903608) |
| 1.6 | 7.8 | GO:0060613 | fat pad development(GO:0060613) |
| 1.5 | 4.6 | GO:0045082 | positive regulation of interleukin-10 biosynthetic process(GO:0045082) |
| 1.5 | 4.6 | GO:0006041 | glucosamine metabolic process(GO:0006041) |
| 1.5 | 20.0 | GO:0006983 | ER overload response(GO:0006983) |
| 1.5 | 6.1 | GO:0006235 | dTTP biosynthetic process(GO:0006235) pyrimidine nucleoside diphosphate metabolic process(GO:0009138) deoxyribonucleoside diphosphate metabolic process(GO:0009186) deoxyribonucleoside diphosphate biosynthetic process(GO:0009189) deoxyribonucleoside triphosphate biosynthetic process(GO:0009202) pyrimidine deoxyribonucleoside triphosphate biosynthetic process(GO:0009212) |
| 1.5 | 4.6 | GO:0036233 | glycine import(GO:0036233) |
| 1.5 | 9.1 | GO:0017062 | respiratory chain complex III assembly(GO:0017062) mitochondrial respiratory chain complex III assembly(GO:0034551) |
| 1.5 | 19.5 | GO:0070986 | left/right axis specification(GO:0070986) |
| 1.5 | 7.4 | GO:0007386 | compartment pattern specification(GO:0007386) |
| 1.5 | 14.8 | GO:0043353 | enucleate erythrocyte differentiation(GO:0043353) |
| 1.5 | 7.3 | GO:2001206 | positive regulation of osteoclast development(GO:2001206) |
| 1.4 | 12.9 | GO:0009249 | protein lipoylation(GO:0009249) |
| 1.4 | 34.4 | GO:0032802 | low-density lipoprotein particle receptor catabolic process(GO:0032802) |
| 1.4 | 8.6 | GO:0000727 | double-strand break repair via break-induced replication(GO:0000727) |
| 1.4 | 15.6 | GO:0070934 | CRD-mediated mRNA stabilization(GO:0070934) |
| 1.4 | 5.6 | GO:0030961 | peptidyl-arginine hydroxylation(GO:0030961) |
| 1.4 | 58.9 | GO:0006370 | 7-methylguanosine mRNA capping(GO:0006370) |
| 1.4 | 8.2 | GO:1904721 | negative regulation of mRNA cleavage(GO:0031438) negative regulation of mRNA endonucleolytic cleavage involved in unfolded protein response(GO:1904721) |
| 1.4 | 24.6 | GO:0071803 | positive regulation of podosome assembly(GO:0071803) |
| 1.4 | 26.0 | GO:0032968 | positive regulation of transcription elongation from RNA polymerase II promoter(GO:0032968) |
| 1.4 | 44.8 | GO:0019054 | modulation by virus of host process(GO:0019054) |
| 1.4 | 6.8 | GO:2000676 | positive regulation of type B pancreatic cell apoptotic process(GO:2000676) |
| 1.3 | 34.9 | GO:0070979 | protein K11-linked ubiquitination(GO:0070979) |
| 1.3 | 4.0 | GO:0035752 | lysosomal lumen pH elevation(GO:0035752) |
| 1.3 | 10.6 | GO:0071847 | TNFSF11-mediated signaling pathway(GO:0071847) |
| 1.3 | 3.9 | GO:0033512 | L-lysine catabolic process to acetyl-CoA via saccharopine(GO:0033512) |
| 1.3 | 5.2 | GO:0001519 | peptide amidation(GO:0001519) protein amidation(GO:0018032) peptide modification(GO:0031179) |
| 1.3 | 42.0 | GO:0034314 | Arp2/3 complex-mediated actin nucleation(GO:0034314) |
| 1.3 | 12.7 | GO:0048227 | plasma membrane to endosome transport(GO:0048227) |
| 1.3 | 3.8 | GO:0046521 | sphingoid catabolic process(GO:0046521) |
| 1.2 | 5.0 | GO:1904502 | regulation of lipophagy(GO:1904502) positive regulation of lipophagy(GO:1904504) |
| 1.2 | 7.5 | GO:0001880 | Mullerian duct regression(GO:0001880) |
| 1.2 | 7.4 | GO:0015755 | fructose transport(GO:0015755) fructose import(GO:0032445) carbohydrate import into cell(GO:0097319) carbohydrate import across plasma membrane(GO:0098704) fructose import across plasma membrane(GO:1990539) |
| 1.2 | 4.9 | GO:0021691 | cerebellar Purkinje cell layer maturation(GO:0021691) |
| 1.2 | 7.3 | GO:0036493 | positive regulation of translation in response to endoplasmic reticulum stress(GO:0036493) |
| 1.2 | 4.8 | GO:0070358 | actin polymerization-dependent cell motility(GO:0070358) |
| 1.2 | 9.6 | GO:0033211 | adiponectin-activated signaling pathway(GO:0033211) |
| 1.2 | 6.0 | GO:0070212 | protein poly-ADP-ribosylation(GO:0070212) |
| 1.2 | 3.5 | GO:0016199 | axon midline choice point recognition(GO:0016199) |
| 1.2 | 20.0 | GO:0040015 | negative regulation of multicellular organism growth(GO:0040015) |
| 1.2 | 3.5 | GO:0042270 | protection from natural killer cell mediated cytotoxicity(GO:0042270) |
| 1.2 | 9.3 | GO:1900038 | negative regulation of cellular response to hypoxia(GO:1900038) |
| 1.2 | 5.8 | GO:0006574 | valine catabolic process(GO:0006574) |
| 1.2 | 13.8 | GO:0016540 | protein autoprocessing(GO:0016540) |
| 1.2 | 3.5 | GO:0018197 | peptidyl-aspartic acid modification(GO:0018197) peptidyl-aspartic acid hydroxylation(GO:0042264) |
| 1.1 | 20.6 | GO:0000028 | ribosomal small subunit assembly(GO:0000028) |
| 1.1 | 84.3 | GO:0042273 | ribosomal large subunit biogenesis(GO:0042273) |
| 1.1 | 4.5 | GO:0033606 | B cell receptor transport within lipid bilayer(GO:0032595) B cell receptor transport into membrane raft(GO:0032597) protein transport out of membrane raft(GO:0032599) chemokine receptor transport out of membrane raft(GO:0032600) negative regulation of transforming growth factor beta3 production(GO:0032913) chemokine receptor transport within lipid bilayer(GO:0033606) |
| 1.1 | 22.6 | GO:0051923 | sulfation(GO:0051923) |
| 1.1 | 4.4 | GO:0050705 | negative regulation of interleukin-1 alpha production(GO:0032690) regulation of interleukin-1 alpha secretion(GO:0050705) negative regulation of interleukin-1 alpha secretion(GO:0050712) |
| 1.1 | 58.7 | GO:0000413 | protein peptidyl-prolyl isomerization(GO:0000413) |
| 1.1 | 6.4 | GO:0071442 | positive regulation of histone H3-K14 acetylation(GO:0071442) |
| 1.1 | 6.3 | GO:0097338 | response to clozapine(GO:0097338) |
| 1.1 | 11.6 | GO:0001682 | tRNA 5'-leader removal(GO:0001682) |
| 1.0 | 15.7 | GO:0039702 | viral budding via host ESCRT complex(GO:0039702) |
| 1.0 | 7.3 | GO:0051382 | kinetochore assembly(GO:0051382) |
| 1.0 | 55.0 | GO:0043486 | histone exchange(GO:0043486) |
| 1.0 | 3.1 | GO:0060279 | regulation of ovulation(GO:0060278) positive regulation of ovulation(GO:0060279) |
| 1.0 | 7.2 | GO:0072553 | terminal button organization(GO:0072553) |
| 1.0 | 6.1 | GO:0061143 | alveolar primary septum development(GO:0061143) |
| 1.0 | 14.2 | GO:0034356 | NAD biosynthesis via nicotinamide riboside salvage pathway(GO:0034356) |
| 1.0 | 27.2 | GO:0046653 | tetrahydrofolate metabolic process(GO:0046653) |
| 1.0 | 6.0 | GO:0060370 | susceptibility to T cell mediated cytotoxicity(GO:0060370) |
| 1.0 | 5.0 | GO:0035905 | ascending aorta development(GO:0035905) ascending aorta morphogenesis(GO:0035910) |
| 1.0 | 6.9 | GO:0035583 | sequestering of TGFbeta in extracellular matrix(GO:0035583) |
| 1.0 | 4.9 | GO:0032596 | protein transport into membrane raft(GO:0032596) |
| 1.0 | 2.0 | GO:0061357 | positive regulation of Wnt protein secretion(GO:0061357) |
| 1.0 | 7.8 | GO:1904796 | regulation of core promoter binding(GO:1904796) positive regulation of core promoter binding(GO:1904798) |
| 1.0 | 4.9 | GO:0015862 | uridine transport(GO:0015862) |
| 1.0 | 6.8 | GO:0042791 | 5S class rRNA transcription from RNA polymerase III type 1 promoter(GO:0042791) tRNA transcription from RNA polymerase III promoter(GO:0042797) |
| 1.0 | 20.2 | GO:0008228 | opsonization(GO:0008228) |
| 1.0 | 4.8 | GO:0090206 | negative regulation of cholesterol biosynthetic process(GO:0045541) negative regulation of cholesterol metabolic process(GO:0090206) |
| 1.0 | 17.2 | GO:1901663 | ubiquinone biosynthetic process(GO:0006744) quinone biosynthetic process(GO:1901663) |
| 1.0 | 8.6 | GO:1905146 | lysosomal protein catabolic process(GO:1905146) |
| 1.0 | 64.8 | GO:0097031 | NADH dehydrogenase complex assembly(GO:0010257) mitochondrial respiratory chain complex I assembly(GO:0032981) mitochondrial respiratory chain complex I biogenesis(GO:0097031) |
| 1.0 | 2.9 | GO:1902462 | regulation of mesenchymal stem cell proliferation(GO:1902460) positive regulation of mesenchymal stem cell proliferation(GO:1902462) |
| 0.9 | 2.8 | GO:1903781 | endoplasmic reticulum membrane organization(GO:0090158) positive regulation of cardiac conduction(GO:1903781) |
| 0.9 | 3.7 | GO:0044821 | telomere tethering at nuclear periphery(GO:0034398) meiotic telomere tethering at nuclear periphery(GO:0044821) meiotic attachment of telomere to nuclear envelope(GO:0070197) chromosome attachment to the nuclear envelope(GO:0097240) |
| 0.9 | 2.8 | GO:1904578 | response to thapsigargin(GO:1904578) cellular response to thapsigargin(GO:1904579) |
| 0.9 | 2.8 | GO:1903568 | negative regulation of protein localization to cilium(GO:1903565) regulation of protein localization to ciliary membrane(GO:1903567) negative regulation of protein localization to ciliary membrane(GO:1903568) |
| 0.9 | 3.7 | GO:0035803 | egg coat formation(GO:0035803) |
| 0.9 | 5.5 | GO:0080182 | histone H3-K4 trimethylation(GO:0080182) |
| 0.9 | 3.6 | GO:0046952 | ketone body catabolic process(GO:0046952) |
| 0.9 | 16.2 | GO:0010510 | regulation of acetyl-CoA biosynthetic process from pyruvate(GO:0010510) |
| 0.9 | 5.4 | GO:0035063 | nuclear speck organization(GO:0035063) |
| 0.9 | 4.5 | GO:0006788 | heme oxidation(GO:0006788) |
| 0.9 | 10.6 | GO:2001288 | positive regulation of caveolin-mediated endocytosis(GO:2001288) |
| 0.9 | 14.9 | GO:0030953 | astral microtubule organization(GO:0030953) |
| 0.9 | 71.5 | GO:0000380 | alternative mRNA splicing, via spliceosome(GO:0000380) |
| 0.9 | 11.3 | GO:2000622 | regulation of nuclear-transcribed mRNA catabolic process, nonsense-mediated decay(GO:2000622) negative regulation of nuclear-transcribed mRNA catabolic process, nonsense-mediated decay(GO:2000623) |
| 0.9 | 12.9 | GO:0032836 | glomerular basement membrane development(GO:0032836) |
| 0.9 | 9.4 | GO:1900119 | positive regulation of execution phase of apoptosis(GO:1900119) |
| 0.9 | 12.8 | GO:0001522 | pseudouridine synthesis(GO:0001522) |
| 0.8 | 15.9 | GO:0006123 | mitochondrial electron transport, cytochrome c to oxygen(GO:0006123) |
| 0.8 | 2.5 | GO:0035915 | pore formation in membrane of other organism(GO:0035915) |
| 0.8 | 6.7 | GO:0042255 | ribosome assembly(GO:0042255) |
| 0.8 | 10.8 | GO:0045618 | positive regulation of keratinocyte differentiation(GO:0045618) |
| 0.8 | 7.3 | GO:0046600 | negative regulation of centriole replication(GO:0046600) |
| 0.8 | 8.9 | GO:0042373 | vitamin K metabolic process(GO:0042373) |
| 0.8 | 9.7 | GO:0048368 | lateral mesoderm development(GO:0048368) |
| 0.8 | 4.0 | GO:0034501 | protein localization to kinetochore(GO:0034501) |
| 0.8 | 20.1 | GO:0030033 | microvillus assembly(GO:0030033) |
| 0.8 | 5.6 | GO:0032497 | detection of lipopolysaccharide(GO:0032497) |
| 0.8 | 15.2 | GO:0031468 | nuclear envelope reassembly(GO:0031468) |
| 0.8 | 8.8 | GO:0008090 | retrograde axonal transport(GO:0008090) |
| 0.8 | 8.7 | GO:0051256 | mitotic spindle midzone assembly(GO:0051256) |
| 0.8 | 7.9 | GO:0031547 | brain-derived neurotrophic factor receptor signaling pathway(GO:0031547) |
| 0.8 | 3.1 | GO:0035407 | histone H3-T11 phosphorylation(GO:0035407) |
| 0.8 | 2.3 | GO:0061590 | calcium activated phospholipid scrambling(GO:0061588) calcium activated phosphatidylcholine scrambling(GO:0061590) calcium activated galactosylceramide scrambling(GO:0061591) |
| 0.8 | 3.1 | GO:0000451 | rRNA 2'-O-methylation(GO:0000451) |
| 0.8 | 3.9 | GO:0070383 | DNA cytosine deamination(GO:0070383) |
| 0.8 | 35.5 | GO:1900026 | positive regulation of substrate adhesion-dependent cell spreading(GO:1900026) |
| 0.8 | 5.4 | GO:1902902 | negative regulation of autophagosome assembly(GO:1902902) |
| 0.8 | 0.8 | GO:0060300 | regulation of cytokine activity(GO:0060300) |
| 0.8 | 53.8 | GO:0000079 | regulation of cyclin-dependent protein serine/threonine kinase activity(GO:0000079) |
| 0.8 | 6.9 | GO:0040016 | embryonic cleavage(GO:0040016) |
| 0.8 | 3.8 | GO:0002098 | tRNA wobble uridine modification(GO:0002098) |
| 0.8 | 79.0 | GO:0007062 | sister chromatid cohesion(GO:0007062) |
| 0.8 | 12.1 | GO:0090110 | cargo loading into COPII-coated vesicle(GO:0090110) |
| 0.8 | 3.8 | GO:0001971 | negative regulation of activation of membrane attack complex(GO:0001971) |
| 0.8 | 9.0 | GO:0015939 | pantothenate metabolic process(GO:0015939) |
| 0.8 | 0.8 | GO:0050653 | chondroitin sulfate proteoglycan biosynthetic process, polysaccharide chain biosynthetic process(GO:0050653) |
| 0.7 | 3.7 | GO:0006987 | activation of signaling protein activity involved in unfolded protein response(GO:0006987) |
| 0.7 | 12.5 | GO:0006012 | galactose metabolic process(GO:0006012) |
| 0.7 | 2.9 | GO:2000254 | regulation of male germ cell proliferation(GO:2000254) negative regulation of male germ cell proliferation(GO:2000255) |
| 0.7 | 5.1 | GO:0061709 | reticulophagy(GO:0061709) |
| 0.7 | 11.5 | GO:0034975 | protein folding in endoplasmic reticulum(GO:0034975) |
| 0.7 | 1.4 | GO:0061428 | negative regulation of transcription from RNA polymerase II promoter in response to hypoxia(GO:0061428) |
| 0.7 | 4.3 | GO:2000152 | regulation of ubiquitin-specific protease activity(GO:2000152) positive regulation of ubiquitin-specific protease activity(GO:2000158) |
| 0.7 | 6.3 | GO:0007023 | post-chaperonin tubulin folding pathway(GO:0007023) |
| 0.7 | 7.0 | GO:1900364 | negative regulation of mRNA polyadenylation(GO:1900364) |
| 0.7 | 4.2 | GO:0008218 | bioluminescence(GO:0008218) |
| 0.7 | 3.5 | GO:1901350 | cell-cell signaling involved in cell-cell junction organization(GO:1901350) |
| 0.7 | 22.1 | GO:0043928 | nuclear-transcribed mRNA catabolic process, exonucleolytic(GO:0000291) exonucleolytic nuclear-transcribed mRNA catabolic process involved in deadenylation-dependent decay(GO:0043928) |
| 0.7 | 8.2 | GO:0000460 | maturation of 5.8S rRNA(GO:0000460) |
| 0.7 | 5.4 | GO:0051026 | chiasma assembly(GO:0051026) |
| 0.7 | 8.9 | GO:0006044 | N-acetylglucosamine metabolic process(GO:0006044) |
| 0.7 | 3.4 | GO:0043305 | negative regulation of mast cell degranulation(GO:0043305) |
| 0.7 | 4.1 | GO:1902897 | regulation of postsynaptic density protein 95 clustering(GO:1902897) |
| 0.7 | 13.4 | GO:0016254 | preassembly of GPI anchor in ER membrane(GO:0016254) |
| 0.7 | 10.7 | GO:0070314 | G1 to G0 transition(GO:0070314) |
| 0.7 | 10.6 | GO:0046341 | CDP-diacylglycerol metabolic process(GO:0046341) |
| 0.7 | 6.6 | GO:0010626 | regulation of Schwann cell proliferation(GO:0010624) negative regulation of Schwann cell proliferation(GO:0010626) |
| 0.7 | 4.6 | GO:0031444 | slow-twitch skeletal muscle fiber contraction(GO:0031444) |
| 0.7 | 5.3 | GO:0015781 | pyrimidine nucleotide-sugar transport(GO:0015781) |
| 0.7 | 3.9 | GO:0090063 | positive regulation of microtubule nucleation(GO:0090063) |
| 0.6 | 4.5 | GO:1905068 | arterial endothelial cell fate commitment(GO:0060844) blood vessel lumenization(GO:0072554) positive regulation of ephrin receptor signaling pathway(GO:1901189) positive regulation of canonical Wnt signaling pathway involved in cardiac muscle cell fate commitment(GO:1901297) positive regulation of canonical Wnt signaling pathway involved in heart development(GO:1905068) |
| 0.6 | 2.6 | GO:0034244 | negative regulation of transcription elongation from RNA polymerase II promoter(GO:0034244) |
| 0.6 | 6.4 | GO:0036120 | response to platelet-derived growth factor(GO:0036119) cellular response to platelet-derived growth factor stimulus(GO:0036120) |
| 0.6 | 2.5 | GO:0008588 | release of cytoplasmic sequestered NF-kappaB(GO:0008588) |
| 0.6 | 12.7 | GO:0000462 | maturation of SSU-rRNA from tricistronic rRNA transcript (SSU-rRNA, 5.8S rRNA, LSU-rRNA)(GO:0000462) |
| 0.6 | 7.0 | GO:0006450 | regulation of translational fidelity(GO:0006450) |
| 0.6 | 3.8 | GO:1902857 | positive regulation of nonmotile primary cilium assembly(GO:1902857) |
| 0.6 | 5.0 | GO:0006564 | L-serine biosynthetic process(GO:0006564) |
| 0.6 | 9.4 | GO:0039532 | negative regulation of viral-induced cytoplasmic pattern recognition receptor signaling pathway(GO:0039532) |
| 0.6 | 1.2 | GO:0002232 | leukocyte chemotaxis involved in inflammatory response(GO:0002232) |
| 0.6 | 10.5 | GO:1902455 | negative regulation of stem cell population maintenance(GO:1902455) |
| 0.6 | 1.8 | GO:2000653 | regulation of genetic imprinting(GO:2000653) |
| 0.6 | 9.7 | GO:0033539 | fatty acid beta-oxidation using acyl-CoA dehydrogenase(GO:0033539) |
| 0.6 | 16.6 | GO:0016578 | histone deubiquitination(GO:0016578) |
| 0.6 | 1.8 | GO:0018103 | protein C-linked glycosylation(GO:0018103) peptidyl-tryptophan modification(GO:0018211) protein C-linked glycosylation via tryptophan(GO:0018317) protein C-linked glycosylation via 2'-alpha-mannosyl-L-tryptophan(GO:0018406) |
| 0.6 | 8.2 | GO:0043555 | regulation of translation in response to stress(GO:0043555) |
| 0.6 | 4.6 | GO:0045329 | carnitine biosynthetic process(GO:0045329) |
| 0.6 | 0.6 | GO:0072387 | flavin adenine dinucleotide metabolic process(GO:0072387) |
| 0.6 | 47.9 | GO:0006903 | vesicle targeting(GO:0006903) |
| 0.6 | 4.6 | GO:2000042 | negative regulation of double-strand break repair via homologous recombination(GO:2000042) |
| 0.6 | 5.2 | GO:0016559 | peroxisome fission(GO:0016559) |
| 0.6 | 2.3 | GO:0061073 | ciliary body morphogenesis(GO:0061073) |
| 0.6 | 27.2 | GO:0000245 | spliceosomal complex assembly(GO:0000245) |
| 0.6 | 4.0 | GO:0032328 | alanine transport(GO:0032328) |
| 0.6 | 16.9 | GO:0019372 | lipoxygenase pathway(GO:0019372) |
| 0.6 | 3.9 | GO:0035879 | plasma membrane lactate transport(GO:0035879) |
| 0.5 | 3.3 | GO:0006686 | sphingomyelin biosynthetic process(GO:0006686) |
| 0.5 | 8.1 | GO:2000001 | regulation of DNA damage checkpoint(GO:2000001) |
| 0.5 | 12.4 | GO:0030728 | ovulation(GO:0030728) |
| 0.5 | 15.5 | GO:0032467 | positive regulation of cytokinesis(GO:0032467) |
| 0.5 | 9.5 | GO:0018208 | peptidyl-proline modification(GO:0018208) |
| 0.5 | 2.6 | GO:0018243 | protein O-linked glycosylation via threonine(GO:0018243) |
| 0.5 | 7.9 | GO:1904776 | regulation of protein localization to cell cortex(GO:1904776) positive regulation of protein localization to cell cortex(GO:1904778) |
| 0.5 | 4.1 | GO:0009313 | oligosaccharide catabolic process(GO:0009313) |
| 0.5 | 1.5 | GO:0097498 | endothelial tube lumen extension(GO:0097498) |
| 0.5 | 5.1 | GO:0010499 | proteasomal ubiquitin-independent protein catabolic process(GO:0010499) |
| 0.5 | 2.0 | GO:0036060 | filtration diaphragm assembly(GO:0036058) slit diaphragm assembly(GO:0036060) |
| 0.5 | 5.6 | GO:0090161 | Golgi ribbon formation(GO:0090161) |
| 0.5 | 5.0 | GO:0042659 | regulation of cell fate specification(GO:0042659) |
| 0.5 | 3.0 | GO:0009048 | dosage compensation(GO:0007549) dosage compensation by inactivation of X chromosome(GO:0009048) |
| 0.5 | 3.5 | GO:0033148 | positive regulation of intracellular estrogen receptor signaling pathway(GO:0033148) |
| 0.5 | 1.0 | GO:0006166 | purine ribonucleoside salvage(GO:0006166) |
| 0.5 | 10.4 | GO:0042026 | protein refolding(GO:0042026) |
| 0.5 | 2.9 | GO:0051958 | methotrexate transport(GO:0051958) reduced folate transmembrane transport(GO:0098838) |
| 0.5 | 3.4 | GO:0072642 | interferon-alpha secretion(GO:0072642) regulation of interferon-alpha secretion(GO:1902739) positive regulation of interferon-alpha secretion(GO:1902741) |
| 0.5 | 3.4 | GO:0003096 | renal sodium ion transport(GO:0003096) |
| 0.5 | 23.9 | GO:0042348 | regulation of NF-kappaB import into nucleus(GO:0042345) NF-kappaB import into nucleus(GO:0042348) |
| 0.5 | 1.9 | GO:1904977 | lymphatic endothelial cell migration(GO:1904977) |
| 0.5 | 5.6 | GO:0045717 | negative regulation of fatty acid biosynthetic process(GO:0045717) |
| 0.5 | 2.8 | GO:1900016 | negative regulation of cytokine production involved in inflammatory response(GO:1900016) |
| 0.5 | 6.4 | GO:0006703 | estrogen biosynthetic process(GO:0006703) |
| 0.4 | 3.6 | GO:0010918 | positive regulation of mitochondrial membrane potential(GO:0010918) |
| 0.4 | 1.8 | GO:0010637 | negative regulation of mitochondrial fusion(GO:0010637) |
| 0.4 | 4.8 | GO:0035020 | regulation of Rac protein signal transduction(GO:0035020) |
| 0.4 | 4.3 | GO:0007175 | negative regulation of epidermal growth factor-activated receptor activity(GO:0007175) |
| 0.4 | 3.4 | GO:0030578 | PML body organization(GO:0030578) |
| 0.4 | 5.6 | GO:2000059 | negative regulation of protein ubiquitination involved in ubiquitin-dependent protein catabolic process(GO:2000059) |
| 0.4 | 15.2 | GO:0007077 | mitotic nuclear envelope disassembly(GO:0007077) |
| 0.4 | 2.5 | GO:0051012 | microtubule sliding(GO:0051012) |
| 0.4 | 4.6 | GO:0021730 | trigeminal sensory nucleus development(GO:0021730) principal sensory nucleus of trigeminal nerve development(GO:0021740) negative regulation of epithelial cell proliferation involved in lung morphogenesis(GO:2000795) |
| 0.4 | 3.3 | GO:0051451 | myoblast migration(GO:0051451) |
| 0.4 | 5.0 | GO:0035562 | negative regulation of chromatin binding(GO:0035562) |
| 0.4 | 12.1 | GO:0006378 | mRNA polyadenylation(GO:0006378) RNA polyadenylation(GO:0043631) |
| 0.4 | 0.8 | GO:0002586 | regulation of antigen processing and presentation of peptide antigen via MHC class II(GO:0002586) |
| 0.4 | 1.6 | GO:0006049 | UDP-N-acetylglucosamine catabolic process(GO:0006049) |
| 0.4 | 0.8 | GO:1903281 | positive regulation of calcium:sodium antiporter activity(GO:1903281) |
| 0.4 | 4.3 | GO:0043983 | histone H4-K12 acetylation(GO:0043983) |
| 0.4 | 38.6 | GO:0006613 | cotranslational protein targeting to membrane(GO:0006613) |
| 0.4 | 13.5 | GO:0000184 | nuclear-transcribed mRNA catabolic process, nonsense-mediated decay(GO:0000184) |
| 0.4 | 2.3 | GO:0019049 | evasion or tolerance of host defenses by virus(GO:0019049) avoidance of host defenses(GO:0044413) evasion or tolerance of host defenses(GO:0044415) avoidance of defenses of other organism involved in symbiotic interaction(GO:0051832) evasion or tolerance of defenses of other organism involved in symbiotic interaction(GO:0051834) negative regulation of lung blood pressure(GO:0061767) |
| 0.4 | 3.0 | GO:0032790 | ribosome disassembly(GO:0032790) |
| 0.4 | 1.5 | GO:0003366 | cell-matrix adhesion involved in ameboidal cell migration(GO:0003366) |
| 0.4 | 6.0 | GO:0003334 | keratinocyte development(GO:0003334) |
| 0.4 | 3.3 | GO:0090050 | positive regulation of cell migration involved in sprouting angiogenesis(GO:0090050) |
| 0.4 | 1.1 | GO:0002305 | gamma-delta intraepithelial T cell differentiation(GO:0002304) CD8-positive, gamma-delta intraepithelial T cell differentiation(GO:0002305) |
| 0.4 | 30.1 | GO:0006413 | translational initiation(GO:0006413) |
| 0.4 | 5.4 | GO:0031953 | negative regulation of protein autophosphorylation(GO:0031953) |
| 0.4 | 3.2 | GO:2000480 | negative regulation of cAMP-dependent protein kinase activity(GO:2000480) |
| 0.4 | 1.1 | GO:0018160 | peptidyl-pyrromethane cofactor linkage(GO:0018160) |
| 0.4 | 3.2 | GO:0098909 | maintenance of centrosome location(GO:0051661) regulation of cardiac muscle cell action potential involved in regulation of contraction(GO:0098909) |
| 0.4 | 2.1 | GO:2000767 | positive regulation of cytoplasmic translation(GO:2000767) |
| 0.3 | 3.5 | GO:0030854 | positive regulation of granulocyte differentiation(GO:0030854) |
| 0.3 | 13.1 | GO:0010501 | RNA secondary structure unwinding(GO:0010501) |
| 0.3 | 22.0 | GO:0006635 | fatty acid beta-oxidation(GO:0006635) |
| 0.3 | 0.7 | GO:0006550 | isoleucine catabolic process(GO:0006550) |
| 0.3 | 3.7 | GO:0051044 | positive regulation of membrane protein ectodomain proteolysis(GO:0051044) |
| 0.3 | 9.7 | GO:0006337 | nucleosome disassembly(GO:0006337) |
| 0.3 | 0.7 | GO:0033031 | positive regulation of neutrophil apoptotic process(GO:0033031) |
| 0.3 | 5.9 | GO:0035635 | entry of bacterium into host cell(GO:0035635) |
| 0.3 | 2.9 | GO:0060052 | neurofilament cytoskeleton organization(GO:0060052) |
| 0.3 | 1.3 | GO:0090362 | positive regulation of platelet-derived growth factor production(GO:0090362) |
| 0.3 | 1.3 | GO:0071802 | negative regulation of podosome assembly(GO:0071802) |
| 0.3 | 12.1 | GO:0006369 | termination of RNA polymerase II transcription(GO:0006369) |
| 0.3 | 2.1 | GO:0019321 | pentose metabolic process(GO:0019321) |
| 0.3 | 2.4 | GO:0006572 | tyrosine catabolic process(GO:0006572) |
| 0.3 | 2.7 | GO:0002934 | desmosome organization(GO:0002934) |
| 0.3 | 0.6 | GO:0036215 | response to stem cell factor(GO:0036215) cellular response to stem cell factor stimulus(GO:0036216) Kit signaling pathway(GO:0038109) |
| 0.3 | 2.0 | GO:0007143 | female meiotic division(GO:0007143) |
| 0.3 | 12.7 | GO:0006891 | intra-Golgi vesicle-mediated transport(GO:0006891) |
| 0.2 | 2.2 | GO:2000659 | regulation of interleukin-1-mediated signaling pathway(GO:2000659) |
| 0.2 | 1.7 | GO:0031339 | negative regulation of vesicle fusion(GO:0031339) |
| 0.2 | 12.1 | GO:0018196 | peptidyl-asparagine modification(GO:0018196) protein N-linked glycosylation via asparagine(GO:0018279) |
| 0.2 | 5.8 | GO:0050690 | regulation of defense response to virus by virus(GO:0050690) |
| 0.2 | 1.3 | GO:0097084 | vascular smooth muscle cell development(GO:0097084) |
| 0.2 | 3.6 | GO:0034629 | cellular protein complex localization(GO:0034629) |
| 0.2 | 1.9 | GO:0035269 | protein O-linked mannosylation(GO:0035269) |
| 0.2 | 2.3 | GO:0090154 | positive regulation of sphingolipid biosynthetic process(GO:0090154) positive regulation of ceramide biosynthetic process(GO:2000304) |
| 0.2 | 11.7 | GO:0006303 | double-strand break repair via nonhomologous end joining(GO:0006303) |
| 0.2 | 2.3 | GO:0021796 | cerebral cortex regionalization(GO:0021796) |
| 0.2 | 5.8 | GO:0009235 | cobalamin metabolic process(GO:0009235) |
| 0.2 | 2.7 | GO:1904714 | regulation of chaperone-mediated autophagy(GO:1904714) |
| 0.2 | 2.4 | GO:0034035 | purine ribonucleoside bisphosphate metabolic process(GO:0034035) 3'-phosphoadenosine 5'-phosphosulfate metabolic process(GO:0050427) |
| 0.2 | 2.2 | GO:0006610 | ribosomal protein import into nucleus(GO:0006610) |
| 0.2 | 28.7 | GO:0000377 | RNA splicing, via transesterification reactions with bulged adenosine as nucleophile(GO:0000377) mRNA splicing, via spliceosome(GO:0000398) |
| 0.2 | 0.4 | GO:0035026 | leading edge cell differentiation(GO:0035026) |
| 0.2 | 3.2 | GO:0006750 | glutathione biosynthetic process(GO:0006750) |
| 0.2 | 1.0 | GO:2001214 | positive regulation of vasculogenesis(GO:2001214) |
| 0.2 | 4.9 | GO:0060397 | JAK-STAT cascade involved in growth hormone signaling pathway(GO:0060397) |
| 0.2 | 2.8 | GO:0006309 | apoptotic DNA fragmentation(GO:0006309) |
| 0.2 | 5.4 | GO:0042149 | cellular response to glucose starvation(GO:0042149) |
| 0.2 | 0.4 | GO:0060339 | negative regulation of type I interferon-mediated signaling pathway(GO:0060339) |
| 0.2 | 0.4 | GO:0002874 | regulation of chronic inflammatory response to antigenic stimulus(GO:0002874) positive regulation of chronic inflammatory response to antigenic stimulus(GO:0002876) |
| 0.2 | 7.4 | GO:0006110 | regulation of glycolytic process(GO:0006110) |
| 0.2 | 0.7 | GO:0046532 | regulation of photoreceptor cell differentiation(GO:0046532) |
| 0.2 | 5.9 | GO:0014904 | myotube cell development(GO:0014904) |
| 0.2 | 12.7 | GO:0016575 | histone deacetylation(GO:0016575) |
| 0.2 | 8.5 | GO:0043525 | positive regulation of neuron apoptotic process(GO:0043525) |
| 0.2 | 1.2 | GO:0038110 | interleukin-2-mediated signaling pathway(GO:0038110) cellular response to interleukin-2(GO:0071352) |
| 0.2 | 2.5 | GO:0018023 | peptidyl-lysine trimethylation(GO:0018023) |
| 0.2 | 2.6 | GO:1901661 | quinone metabolic process(GO:1901661) |
| 0.2 | 4.2 | GO:0030866 | cortical actin cytoskeleton organization(GO:0030866) |
| 0.2 | 0.8 | GO:1902659 | regulation of glucose mediated signaling pathway(GO:1902659) |
| 0.2 | 0.3 | GO:0040030 | regulation of molecular function, epigenetic(GO:0040030) |
| 0.2 | 1.4 | GO:0034498 | early endosome to Golgi transport(GO:0034498) |
| 0.1 | 1.9 | GO:0060285 | cilium-dependent cell motility(GO:0060285) |
| 0.1 | 3.6 | GO:0033081 | regulation of T cell differentiation in thymus(GO:0033081) regulation of thymocyte aggregation(GO:2000398) |
| 0.1 | 5.5 | GO:0045333 | cellular respiration(GO:0045333) |
| 0.1 | 3.1 | GO:0006270 | DNA replication initiation(GO:0006270) |
| 0.1 | 2.0 | GO:0010666 | positive regulation of striated muscle cell apoptotic process(GO:0010663) positive regulation of cardiac muscle cell apoptotic process(GO:0010666) |
| 0.1 | 1.4 | GO:1901843 | positive regulation of high voltage-gated calcium channel activity(GO:1901843) |
| 0.1 | 2.1 | GO:0071577 | zinc II ion transmembrane transport(GO:0071577) |
| 0.1 | 3.1 | GO:0071539 | protein localization to centrosome(GO:0071539) |
| 0.1 | 4.4 | GO:0007205 | protein kinase C-activating G-protein coupled receptor signaling pathway(GO:0007205) |
| 0.1 | 4.7 | GO:0006893 | Golgi to plasma membrane transport(GO:0006893) |
| 0.1 | 1.9 | GO:0051712 | regulation of killing of cells of other organism(GO:0051709) positive regulation of killing of cells of other organism(GO:0051712) |
| 0.1 | 2.1 | GO:0060536 | cartilage morphogenesis(GO:0060536) |
| 0.1 | 0.5 | GO:0035860 | glial cell-derived neurotrophic factor receptor signaling pathway(GO:0035860) |
| 0.1 | 9.0 | GO:0045931 | positive regulation of mitotic cell cycle(GO:0045931) |
| 0.1 | 0.6 | GO:0045872 | positive regulation of rhodopsin gene expression(GO:0045872) |
| 0.1 | 0.5 | GO:0045218 | zonula adherens maintenance(GO:0045218) |
| 0.1 | 0.7 | GO:0001780 | neutrophil homeostasis(GO:0001780) |
| 0.1 | 0.1 | GO:0005988 | lactose metabolic process(GO:0005988) lactose biosynthetic process(GO:0005989) |
| 0.1 | 1.7 | GO:0033866 | coenzyme A biosynthetic process(GO:0015937) nucleoside bisphosphate biosynthetic process(GO:0033866) ribonucleoside bisphosphate biosynthetic process(GO:0034030) purine nucleoside bisphosphate biosynthetic process(GO:0034033) |
| 0.1 | 0.4 | GO:0051410 | detoxification of nitrogen compound(GO:0051410) cellular detoxification of nitrogen compound(GO:0070458) |
| 0.1 | 9.0 | GO:0051965 | positive regulation of synapse assembly(GO:0051965) |
| 0.1 | 1.2 | GO:2000258 | negative regulation of complement activation(GO:0045916) negative regulation of protein activation cascade(GO:2000258) |
| 0.1 | 4.2 | GO:0061001 | regulation of dendritic spine morphogenesis(GO:0061001) |
| 0.1 | 1.9 | GO:2000144 | positive regulation of DNA-templated transcription, initiation(GO:2000144) |
| 0.1 | 0.9 | GO:0045898 | regulation of RNA polymerase II transcriptional preinitiation complex assembly(GO:0045898) |
| 0.1 | 1.8 | GO:0007099 | centriole replication(GO:0007099) |
| 0.1 | 1.6 | GO:0043306 | positive regulation of mast cell activation involved in immune response(GO:0033008) positive regulation of mast cell degranulation(GO:0043306) |
| 0.1 | 2.2 | GO:0006491 | N-glycan processing(GO:0006491) |
| 0.1 | 5.6 | GO:1903076 | regulation of protein localization to plasma membrane(GO:1903076) |
| 0.1 | 1.0 | GO:0050860 | negative regulation of T cell receptor signaling pathway(GO:0050860) |
| 0.1 | 1.0 | GO:0042428 | serotonin metabolic process(GO:0042428) |
| 0.1 | 6.2 | GO:0031338 | regulation of vesicle fusion(GO:0031338) |
| 0.1 | 0.6 | GO:0046449 | creatinine metabolic process(GO:0046449) |
| 0.1 | 0.3 | GO:0060215 | primitive hemopoiesis(GO:0060215) |
| 0.1 | 1.4 | GO:0060612 | adipose tissue development(GO:0060612) |
| 0.1 | 2.9 | GO:0007029 | endoplasmic reticulum organization(GO:0007029) |
| 0.1 | 12.7 | GO:0008360 | regulation of cell shape(GO:0008360) |
| 0.1 | 0.1 | GO:0051255 | spindle midzone assembly(GO:0051255) |
| 0.1 | 0.3 | GO:1904262 | negative regulation of TORC1 signaling(GO:1904262) |
| 0.1 | 0.4 | GO:0046852 | positive regulation of bone resorption(GO:0045780) positive regulation of bone remodeling(GO:0046852) |
| 0.1 | 0.3 | GO:0014874 | response to stimulus involved in regulation of muscle adaptation(GO:0014874) |
| 0.1 | 1.1 | GO:0000281 | mitotic cytokinesis(GO:0000281) |
| 0.1 | 0.2 | GO:0002415 | immunoglobulin transcytosis in epithelial cells mediated by polymeric immunoglobulin receptor(GO:0002415) |
| 0.0 | 2.6 | GO:0045454 | cell redox homeostasis(GO:0045454) |
| 0.0 | 0.2 | GO:0061739 | protein lipidation involved in autophagosome assembly(GO:0061739) |
| 0.0 | 1.3 | GO:0035329 | hippo signaling(GO:0035329) |
| 0.0 | 3.6 | GO:0008380 | RNA splicing(GO:0008380) |
| 0.0 | 1.4 | GO:0006099 | tricarboxylic acid cycle(GO:0006099) |
| 0.0 | 0.0 | GO:0021888 | cerebral cortex tangential migration using cell-axon interactions(GO:0021824) gonadotrophin-releasing hormone neuronal migration to the hypothalamus(GO:0021828) hypothalamic tangential migration using cell-axon interactions(GO:0021856) hypothalamus gonadotrophin-releasing hormone neuron differentiation(GO:0021886) hypothalamus gonadotrophin-releasing hormone neuron development(GO:0021888) cranial ganglion development(GO:0061550) trigeminal ganglion development(GO:0061551) facioacoustic ganglion development(GO:1903375) |
| 0.0 | 0.9 | GO:0002076 | osteoblast development(GO:0002076) |
| 0.0 | 1.6 | GO:0043171 | peptide catabolic process(GO:0043171) |
| 0.0 | 0.7 | GO:0090502 | RNA phosphodiester bond hydrolysis, endonucleolytic(GO:0090502) |
| 0.0 | 0.6 | GO:0048935 | peripheral nervous system neuron differentiation(GO:0048934) peripheral nervous system neuron development(GO:0048935) |
| 0.0 | 0.0 | GO:0050861 | positive regulation of B cell receptor signaling pathway(GO:0050861) negative regulation of glial cell migration(GO:1903976) regulation of microglial cell activation(GO:1903978) microglial cell migration(GO:1904124) regulation of microglial cell migration(GO:1904139) |
| 0.0 | 0.2 | GO:0007028 | cytoplasm organization(GO:0007028) |
| 0.0 | 0.3 | GO:0071415 | cellular response to caffeine(GO:0071313) cellular response to purine-containing compound(GO:0071415) |
| 0.0 | 0.3 | GO:0046541 | saliva secretion(GO:0046541) |
| 0.0 | 0.1 | GO:0034331 | cell junction maintenance(GO:0034331) |
| 0.0 | 0.1 | GO:0071679 | commissural neuron axon guidance(GO:0071679) |
| 0.0 | 0.4 | GO:0035435 | phosphate ion transmembrane transport(GO:0035435) |
| 0.0 | 0.2 | GO:0097324 | melanocyte migration(GO:0097324) positive regulation of lens fiber cell differentiation(GO:1902748) |
| 0.0 | 0.6 | GO:0006298 | mismatch repair(GO:0006298) |
| 0.0 | 0.1 | GO:0036066 | protein O-linked fucosylation(GO:0036066) |
| 0.0 | 1.9 | GO:0043647 | inositol phosphate metabolic process(GO:0043647) |
| 0.0 | 0.4 | GO:0033198 | response to ATP(GO:0033198) |
| 0.0 | 0.1 | GO:0010801 | negative regulation of peptidyl-threonine phosphorylation(GO:0010801) |
| 0.0 | 0.2 | GO:0017121 | phospholipid scrambling(GO:0017121) |
| 0.0 | 0.0 | GO:2000302 | positive regulation of synaptic vesicle exocytosis(GO:2000302) |
| 0.0 | 0.1 | GO:0045078 | positive regulation of interferon-gamma biosynthetic process(GO:0045078) |
| 0.0 | 0.3 | GO:0006487 | protein N-linked glycosylation(GO:0006487) |
| 0.0 | 0.3 | GO:0036297 | interstrand cross-link repair(GO:0036297) |
| 0.0 | 0.3 | GO:0031581 | hemidesmosome assembly(GO:0031581) |
Gene overrepresentation in cellular component category:
| Log-likelihood per target | Total log-likelihood | Term | Description |
|---|---|---|---|
| 11.8 | 35.4 | GO:0048269 | methionine adenosyltransferase complex(GO:0048269) |
| 10.8 | 75.3 | GO:0034715 | pICln-Sm protein complex(GO:0034715) |
| 10.6 | 31.9 | GO:0034515 | proteasome storage granule(GO:0034515) |
| 9.1 | 45.3 | GO:0001651 | dense fibrillar component(GO:0001651) |
| 8.4 | 41.8 | GO:0097149 | centralspindlin complex(GO:0097149) |
| 6.9 | 41.5 | GO:0000243 | commitment complex(GO:0000243) |
| 6.8 | 40.9 | GO:0005658 | alpha DNA polymerase:primase complex(GO:0005658) |
| 6.5 | 19.5 | GO:0034272 | phosphatidylinositol 3-kinase complex, class III, type I(GO:0034271) phosphatidylinositol 3-kinase complex, class III, type II(GO:0034272) |
| 6.0 | 24.0 | GO:0036502 | Derlin-1-VIMP complex(GO:0036502) |
| 5.9 | 77.0 | GO:0002199 | zona pellucida receptor complex(GO:0002199) |
| 5.8 | 34.7 | GO:0009368 | endopeptidase Clp complex(GO:0009368) |
| 5.5 | 71.1 | GO:0005688 | U6 snRNP(GO:0005688) |
| 5.5 | 27.3 | GO:0043564 | Ku70:Ku80 complex(GO:0043564) |
| 5.4 | 37.9 | GO:0044326 | dendritic spine neck(GO:0044326) |
| 5.3 | 26.7 | GO:0045272 | plasma membrane respiratory chain complex I(GO:0045272) |
| 5.1 | 15.2 | GO:0031262 | Ndc80 complex(GO:0031262) |
| 4.8 | 19.3 | GO:1990423 | RZZ complex(GO:1990423) |
| 4.7 | 65.5 | GO:0019774 | proteasome core complex, beta-subunit complex(GO:0019774) |
| 4.7 | 37.2 | GO:0005827 | polar microtubule(GO:0005827) |
| 4.6 | 23.2 | GO:0032301 | MutSalpha complex(GO:0032301) |
| 4.5 | 18.1 | GO:0005687 | U4 snRNP(GO:0005687) |
| 4.4 | 26.4 | GO:0002178 | palmitoyltransferase complex(GO:0002178) |
| 4.3 | 30.4 | GO:0044530 | supraspliceosomal complex(GO:0044530) |
| 3.9 | 15.6 | GO:0031510 | SUMO activating enzyme complex(GO:0031510) |
| 3.9 | 23.3 | GO:0017101 | aminoacyl-tRNA synthetase multienzyme complex(GO:0017101) |
| 3.8 | 11.3 | GO:0055087 | Ski complex(GO:0055087) |
| 3.7 | 11.1 | GO:0071148 | TEAD-1-YAP complex(GO:0071148) |
| 3.6 | 10.8 | GO:0002081 | outer acrosomal membrane(GO:0002081) |
| 3.6 | 10.8 | GO:0097441 | basilar dendrite(GO:0097441) |
| 3.6 | 28.6 | GO:0000015 | phosphopyruvate hydratase complex(GO:0000015) |
| 3.6 | 17.8 | GO:0033503 | HULC complex(GO:0033503) |
| 3.4 | 94.8 | GO:0005763 | organellar small ribosomal subunit(GO:0000314) mitochondrial small ribosomal subunit(GO:0005763) |
| 3.3 | 3.3 | GO:0036195 | muscle cell projection(GO:0036194) muscle cell projection membrane(GO:0036195) |
| 3.3 | 22.8 | GO:0044352 | pinosome(GO:0044352) macropinosome(GO:0044354) |
| 3.2 | 19.4 | GO:0031467 | Cul7-RING ubiquitin ligase complex(GO:0031467) |
| 3.2 | 19.2 | GO:0031232 | extrinsic component of external side of plasma membrane(GO:0031232) |
| 3.2 | 60.5 | GO:0000812 | Swr1 complex(GO:0000812) |
| 3.2 | 28.5 | GO:0034709 | methylosome(GO:0034709) |
| 3.2 | 9.5 | GO:0016939 | kinesin II complex(GO:0016939) |
| 3.1 | 61.8 | GO:0043189 | NuA4 histone acetyltransferase complex(GO:0035267) H4/H2A histone acetyltransferase complex(GO:0043189) H4 histone acetyltransferase complex(GO:1902562) |
| 3.0 | 60.0 | GO:0005885 | Arp2/3 protein complex(GO:0005885) |
| 3.0 | 35.6 | GO:0071203 | WASH complex(GO:0071203) |
| 3.0 | 17.8 | GO:0042721 | mitochondrial inner membrane protein insertion complex(GO:0042721) |
| 3.0 | 11.8 | GO:0071942 | XPC complex(GO:0071942) |
| 2.9 | 23.4 | GO:0005742 | mitochondrial outer membrane translocase complex(GO:0005742) |
| 2.9 | 14.5 | GO:0070557 | PCNA-p21 complex(GO:0070557) |
| 2.8 | 13.8 | GO:0031523 | Myb complex(GO:0031523) |
| 2.7 | 10.7 | GO:1990730 | VCP-NSFL1C complex(GO:1990730) |
| 2.6 | 7.7 | GO:0000799 | nuclear condensin complex(GO:0000799) |
| 2.6 | 7.7 | GO:1990917 | sperm head plasma membrane(GO:1990913) ooplasm(GO:1990917) |
| 2.5 | 12.4 | GO:0005958 | DNA-dependent protein kinase-DNA ligase 4 complex(GO:0005958) |
| 2.5 | 19.8 | GO:0008290 | F-actin capping protein complex(GO:0008290) |
| 2.5 | 27.1 | GO:0035692 | macrophage migration inhibitory factor receptor complex(GO:0035692) |
| 2.3 | 11.7 | GO:0031673 | H zone(GO:0031673) |
| 2.3 | 28.0 | GO:0042555 | MCM complex(GO:0042555) |
| 2.3 | 7.0 | GO:0097637 | intrinsic component of autophagosome membrane(GO:0097636) integral component of autophagosome membrane(GO:0097637) |
| 2.3 | 20.8 | GO:0031298 | replication fork protection complex(GO:0031298) |
| 2.3 | 29.9 | GO:0033093 | Weibel-Palade body(GO:0033093) |
| 2.3 | 29.4 | GO:0045275 | mitochondrial respiratory chain complex III(GO:0005750) respiratory chain complex III(GO:0045275) |
| 2.2 | 26.7 | GO:0019773 | proteasome core complex, alpha-subunit complex(GO:0019773) |
| 2.2 | 15.4 | GO:0000125 | PCAF complex(GO:0000125) |
| 2.2 | 10.8 | GO:0005663 | DNA replication factor C complex(GO:0005663) |
| 2.1 | 6.4 | GO:0031933 | telomeric heterochromatin(GO:0031933) |
| 2.1 | 6.3 | GO:0072557 | IPAF inflammasome complex(GO:0072557) |
| 2.1 | 56.8 | GO:0005665 | DNA-directed RNA polymerase II, core complex(GO:0005665) |
| 2.0 | 40.2 | GO:0031588 | nucleotide-activated protein kinase complex(GO:0031588) |
| 2.0 | 9.8 | GO:0030981 | cortical microtubule cytoskeleton(GO:0030981) |
| 1.9 | 9.7 | GO:0005854 | nascent polypeptide-associated complex(GO:0005854) |
| 1.9 | 11.6 | GO:0000172 | ribonuclease MRP complex(GO:0000172) |
| 1.9 | 7.5 | GO:0005850 | eukaryotic translation initiation factor 2 complex(GO:0005850) |
| 1.8 | 1.8 | GO:0005943 | phosphatidylinositol 3-kinase complex, class IA(GO:0005943) |
| 1.8 | 18.3 | GO:0070552 | BRISC complex(GO:0070552) |
| 1.8 | 5.3 | GO:0005873 | plus-end kinesin complex(GO:0005873) |
| 1.7 | 22.7 | GO:0000176 | nuclear exosome (RNase complex)(GO:0000176) |
| 1.7 | 10.2 | GO:0097129 | cyclin D2-CDK4 complex(GO:0097129) |
| 1.7 | 11.7 | GO:0005851 | eukaryotic translation initiation factor 2B complex(GO:0005851) |
| 1.7 | 8.3 | GO:0071012 | catalytic step 1 spliceosome(GO:0071012) |
| 1.7 | 14.9 | GO:0000813 | ESCRT I complex(GO:0000813) |
| 1.7 | 26.4 | GO:0005642 | annulate lamellae(GO:0005642) |
| 1.6 | 1.6 | GO:0031166 | integral component of vacuolar membrane(GO:0031166) intrinsic component of vacuolar membrane(GO:0031310) |
| 1.6 | 233.1 | GO:0015934 | large ribosomal subunit(GO:0015934) |
| 1.6 | 11.0 | GO:0030905 | retromer, tubulation complex(GO:0030905) |
| 1.6 | 15.7 | GO:0061574 | ASAP complex(GO:0061574) |
| 1.6 | 34.4 | GO:0036020 | endolysosome membrane(GO:0036020) |
| 1.6 | 31.3 | GO:0035371 | microtubule plus-end(GO:0035371) |
| 1.5 | 10.6 | GO:0098560 | cytoplasmic side of late endosome membrane(GO:0098560) |
| 1.5 | 7.3 | GO:0044308 | axonal spine(GO:0044308) |
| 1.5 | 7.3 | GO:0034388 | Pwp2p-containing subcomplex of 90S preribosome(GO:0034388) |
| 1.5 | 5.8 | GO:0032133 | chromosome passenger complex(GO:0032133) |
| 1.4 | 15.9 | GO:0005751 | mitochondrial respiratory chain complex IV(GO:0005751) |
| 1.4 | 10.1 | GO:1990761 | growth cone lamellipodium(GO:1990761) |
| 1.4 | 7.1 | GO:0098837 | postsynaptic recycling endosome(GO:0098837) |
| 1.4 | 5.6 | GO:0000221 | vacuolar proton-transporting V-type ATPase, V1 domain(GO:0000221) |
| 1.4 | 9.6 | GO:0005956 | protein kinase CK2 complex(GO:0005956) |
| 1.4 | 16.2 | GO:0045254 | pyruvate dehydrogenase complex(GO:0045254) |
| 1.3 | 4.0 | GO:0005685 | U1 snRNP(GO:0005685) |
| 1.3 | 21.1 | GO:0070937 | CRD-mediated mRNA stability complex(GO:0070937) |
| 1.3 | 22.4 | GO:0036452 | ESCRT complex(GO:0036452) |
| 1.3 | 5.2 | GO:1990876 | cytoplasmic side of nuclear pore(GO:1990876) |
| 1.3 | 14.1 | GO:0000940 | condensed chromosome outer kinetochore(GO:0000940) |
| 1.3 | 20.4 | GO:0031932 | TORC2 complex(GO:0031932) |
| 1.3 | 59.4 | GO:0009295 | nucleoid(GO:0009295) mitochondrial nucleoid(GO:0042645) |
| 1.3 | 5.0 | GO:0034457 | Mpp10 complex(GO:0034457) |
| 1.2 | 11.0 | GO:1990630 | IRE1-RACK1-PP2A complex(GO:1990630) |
| 1.1 | 18.3 | GO:0031080 | nuclear pore outer ring(GO:0031080) |
| 1.1 | 14.6 | GO:0005744 | mitochondrial inner membrane presequence translocase complex(GO:0005744) |
| 1.1 | 11.2 | GO:0005869 | dynactin complex(GO:0005869) |
| 1.1 | 4.4 | GO:0033257 | Bcl3/NF-kappaB2 complex(GO:0033257) |
| 1.0 | 7.3 | GO:0033180 | proton-transporting V-type ATPase, V1 domain(GO:0033180) |
| 1.0 | 3.1 | GO:0043512 | inhibin complex(GO:0043511) inhibin A complex(GO:0043512) |
| 1.0 | 18.5 | GO:0030056 | hemidesmosome(GO:0030056) |
| 1.0 | 9.2 | GO:0070765 | gamma-secretase complex(GO:0070765) |
| 1.0 | 8.0 | GO:0097443 | sorting endosome(GO:0097443) |
| 1.0 | 6.8 | GO:0000127 | transcription factor TFIIIC complex(GO:0000127) |
| 0.9 | 23.0 | GO:0071782 | endoplasmic reticulum tubular network(GO:0071782) |
| 0.9 | 23.6 | GO:0030687 | preribosome, large subunit precursor(GO:0030687) |
| 0.9 | 7.1 | GO:0030478 | actin cap(GO:0030478) |
| 0.9 | 162.8 | GO:0101002 | ficolin-1-rich granule(GO:0101002) ficolin-1-rich granule lumen(GO:1904813) |
| 0.9 | 18.2 | GO:0030686 | 90S preribosome(GO:0030686) |
| 0.9 | 13.8 | GO:0097038 | perinuclear endoplasmic reticulum(GO:0097038) |
| 0.8 | 5.9 | GO:0030891 | VCB complex(GO:0030891) |
| 0.8 | 5.9 | GO:0034719 | SMN-Sm protein complex(GO:0034719) |
| 0.8 | 7.3 | GO:0072546 | ER membrane protein complex(GO:0072546) |
| 0.8 | 4.8 | GO:0090543 | Flemming body(GO:0090543) |
| 0.8 | 43.4 | GO:0002102 | podosome(GO:0002102) |
| 0.8 | 3.2 | GO:0044307 | dendritic branch(GO:0044307) |
| 0.8 | 11.0 | GO:0051233 | spindle midzone(GO:0051233) |
| 0.8 | 10.9 | GO:0017146 | NMDA selective glutamate receptor complex(GO:0017146) |
| 0.8 | 20.9 | GO:0005680 | anaphase-promoting complex(GO:0005680) |
| 0.8 | 6.2 | GO:0071014 | post-mRNA release spliceosomal complex(GO:0071014) |
| 0.8 | 25.2 | GO:0035861 | site of double-strand break(GO:0035861) |
| 0.7 | 17.2 | GO:0030992 | intraciliary transport particle B(GO:0030992) |
| 0.7 | 8.8 | GO:0097136 | Bcl-2 family protein complex(GO:0097136) |
| 0.7 | 3.7 | GO:0035032 | phosphatidylinositol 3-kinase complex, class III(GO:0035032) |
| 0.7 | 15.6 | GO:0030877 | beta-catenin destruction complex(GO:0030877) |
| 0.7 | 12.6 | GO:0016281 | eukaryotic translation initiation factor 4F complex(GO:0016281) |
| 0.7 | 32.8 | GO:0005876 | spindle microtubule(GO:0005876) |
| 0.7 | 10.2 | GO:0000242 | pericentriolar material(GO:0000242) |
| 0.7 | 8.0 | GO:0071438 | invadopodium membrane(GO:0071438) |
| 0.7 | 6.5 | GO:0097550 | transcriptional preinitiation complex(GO:0097550) |
| 0.6 | 46.5 | GO:0000779 | condensed chromosome, centromeric region(GO:0000779) |
| 0.6 | 4.4 | GO:0036157 | outer dynein arm(GO:0036157) |
| 0.6 | 5.5 | GO:0072357 | PTW/PP1 phosphatase complex(GO:0072357) |
| 0.6 | 3.6 | GO:0098576 | lumenal side of membrane(GO:0098576) |
| 0.6 | 1.8 | GO:0033185 | dolichol-phosphate-mannose synthase complex(GO:0033185) |
| 0.6 | 25.1 | GO:0016235 | aggresome(GO:0016235) |
| 0.6 | 2.3 | GO:0097539 | ciliary transition fiber(GO:0097539) |
| 0.6 | 2.8 | GO:0030314 | junctional membrane complex(GO:0030314) |
| 0.6 | 11.6 | GO:0043219 | lateral loop(GO:0043219) |
| 0.6 | 5.5 | GO:0016593 | Cdc73/Paf1 complex(GO:0016593) |
| 0.6 | 13.8 | GO:0005640 | nuclear outer membrane(GO:0005640) |
| 0.5 | 2.2 | GO:0031466 | Cul5-RING ubiquitin ligase complex(GO:0031466) |
| 0.5 | 2.7 | GO:0034680 | integrin alpha10-beta1 complex(GO:0034680) |
| 0.5 | 10.9 | GO:0043205 | microfibril(GO:0001527) fibril(GO:0043205) |
| 0.5 | 31.3 | GO:0005747 | mitochondrial respiratory chain complex I(GO:0005747) NADH dehydrogenase complex(GO:0030964) respiratory chain complex I(GO:0045271) |
| 0.5 | 93.8 | GO:0005681 | spliceosomal complex(GO:0005681) |
| 0.5 | 16.9 | GO:0071564 | npBAF complex(GO:0071564) |
| 0.5 | 4.5 | GO:0002193 | MAML1-RBP-Jkappa- ICN1 complex(GO:0002193) |
| 0.5 | 5.0 | GO:0031465 | Cul4B-RING E3 ubiquitin ligase complex(GO:0031465) |
| 0.5 | 5.4 | GO:0070938 | contractile ring(GO:0070938) |
| 0.5 | 15.6 | GO:0072686 | mitotic spindle(GO:0072686) |
| 0.5 | 52.5 | GO:0030496 | midbody(GO:0030496) |
| 0.5 | 5.8 | GO:0008250 | oligosaccharyltransferase complex(GO:0008250) |
| 0.5 | 4.3 | GO:0044233 | ER-mitochondrion membrane contact site(GO:0044233) |
| 0.5 | 49.0 | GO:0000922 | spindle pole(GO:0000922) |
| 0.5 | 79.6 | GO:0042579 | peroxisome(GO:0005777) microbody(GO:0042579) |
| 0.5 | 20.8 | GO:0000307 | cyclin-dependent protein kinase holoenzyme complex(GO:0000307) |
| 0.5 | 2.8 | GO:0097451 | glial limiting end-foot(GO:0097451) |
| 0.5 | 16.3 | GO:0000159 | protein phosphatase type 2A complex(GO:0000159) |
| 0.5 | 38.3 | GO:0030134 | ER to Golgi transport vesicle(GO:0030134) |
| 0.4 | 4.5 | GO:0008540 | proteasome regulatory particle, base subcomplex(GO:0008540) |
| 0.4 | 2.7 | GO:0045252 | oxoglutarate dehydrogenase complex(GO:0045252) |
| 0.4 | 2.2 | GO:0032044 | DSIF complex(GO:0032044) |
| 0.4 | 27.8 | GO:0035577 | azurophil granule membrane(GO:0035577) |
| 0.4 | 4.7 | GO:0034098 | VCP-NPL4-UFD1 AAA ATPase complex(GO:0034098) |
| 0.4 | 6.3 | GO:0005952 | cAMP-dependent protein kinase complex(GO:0005952) |
| 0.4 | 2.1 | GO:0005761 | organellar ribosome(GO:0000313) mitochondrial ribosome(GO:0005761) |
| 0.4 | 52.3 | GO:0030176 | integral component of endoplasmic reticulum membrane(GO:0030176) |
| 0.4 | 4.2 | GO:0008385 | IkappaB kinase complex(GO:0008385) |
| 0.4 | 1.5 | GO:0034669 | integrin alpha4-beta7 complex(GO:0034669) |
| 0.4 | 2.2 | GO:0005736 | DNA-directed RNA polymerase I complex(GO:0005736) |
| 0.4 | 8.8 | GO:0031304 | intrinsic component of mitochondrial inner membrane(GO:0031304) integral component of mitochondrial inner membrane(GO:0031305) |
| 0.3 | 4.5 | GO:0031362 | anchored component of external side of plasma membrane(GO:0031362) |
| 0.3 | 19.4 | GO:0031519 | PcG protein complex(GO:0031519) |
| 0.3 | 18.8 | GO:0018995 | host(GO:0018995) host cell(GO:0043657) |
| 0.3 | 5.6 | GO:0008091 | spectrin(GO:0008091) |
| 0.3 | 17.1 | GO:0022627 | cytosolic small ribosomal subunit(GO:0022627) ribosomal subunit(GO:0044391) |
| 0.3 | 3.5 | GO:0044666 | MLL3/4 complex(GO:0044666) |
| 0.3 | 1.3 | GO:0030014 | CCR4-NOT complex(GO:0030014) |
| 0.3 | 9.1 | GO:0005881 | cytoplasmic microtubule(GO:0005881) |
| 0.3 | 9.6 | GO:0030140 | trans-Golgi network transport vesicle(GO:0030140) |
| 0.3 | 3.7 | GO:0032433 | filopodium tip(GO:0032433) |
| 0.3 | 5.2 | GO:0071141 | SMAD protein complex(GO:0071141) |
| 0.3 | 1.5 | GO:0070761 | pre-snoRNP complex(GO:0070761) |
| 0.3 | 3.1 | GO:0016342 | catenin complex(GO:0016342) |
| 0.3 | 21.6 | GO:0005819 | spindle(GO:0005819) |
| 0.3 | 7.2 | GO:0090545 | NuRD complex(GO:0016581) CHD-type complex(GO:0090545) |
| 0.3 | 12.8 | GO:0000118 | histone deacetylase complex(GO:0000118) |
| 0.3 | 21.1 | GO:0000793 | condensed chromosome(GO:0000793) |
| 0.3 | 10.1 | GO:0005840 | ribosome(GO:0005840) |
| 0.3 | 2.4 | GO:0005664 | origin recognition complex(GO:0000808) nuclear origin of replication recognition complex(GO:0005664) |
| 0.3 | 4.6 | GO:0031258 | lamellipodium membrane(GO:0031258) |
| 0.3 | 1.3 | GO:0034688 | integrin alphaM-beta2 complex(GO:0034688) |
| 0.2 | 12.6 | GO:0005637 | nuclear inner membrane(GO:0005637) |
| 0.2 | 0.7 | GO:0070195 | growth hormone receptor complex(GO:0070195) |
| 0.2 | 8.4 | GO:0008180 | COP9 signalosome(GO:0008180) |
| 0.2 | 19.3 | GO:0005758 | mitochondrial intermembrane space(GO:0005758) |
| 0.2 | 27.4 | GO:0016605 | PML body(GO:0016605) |
| 0.2 | 4.6 | GO:0044300 | cerebellar mossy fiber(GO:0044300) |
| 0.2 | 2.4 | GO:0030126 | COPI vesicle coat(GO:0030126) |
| 0.2 | 3.4 | GO:0005922 | connexon complex(GO:0005922) |
| 0.2 | 0.8 | GO:0042613 | MHC class II protein complex(GO:0042613) |
| 0.2 | 8.2 | GO:0005798 | Golgi-associated vesicle(GO:0005798) |
| 0.2 | 75.1 | GO:0005925 | focal adhesion(GO:0005925) |
| 0.2 | 53.7 | GO:0005759 | mitochondrial matrix(GO:0005759) |
| 0.2 | 15.1 | GO:0035578 | azurophil granule lumen(GO:0035578) |
| 0.2 | 0.5 | GO:0030956 | glutamyl-tRNA(Gln) amidotransferase complex(GO:0030956) |
| 0.2 | 13.9 | GO:0070821 | tertiary granule membrane(GO:0070821) |
| 0.1 | 1.3 | GO:0000938 | GARP complex(GO:0000938) |
| 0.1 | 1.6 | GO:0070971 | endoplasmic reticulum exit site(GO:0070971) |
| 0.1 | 14.9 | GO:0042581 | specific granule(GO:0042581) |
| 0.1 | 5.0 | GO:0031201 | SNARE complex(GO:0031201) |
| 0.1 | 1.6 | GO:0005921 | gap junction(GO:0005921) |
| 0.1 | 2.9 | GO:0031904 | endosome lumen(GO:0031904) |
| 0.1 | 2.1 | GO:0030867 | rough endoplasmic reticulum membrane(GO:0030867) |
| 0.1 | 1.0 | GO:0000347 | THO complex(GO:0000347) THO complex part of transcription export complex(GO:0000445) |
| 0.1 | 0.5 | GO:0005915 | zonula adherens(GO:0005915) |
| 0.1 | 3.8 | GO:0033116 | endoplasmic reticulum-Golgi intermediate compartment membrane(GO:0033116) |
| 0.1 | 4.6 | GO:0045171 | intercellular bridge(GO:0045171) |
| 0.1 | 1.5 | GO:0033202 | Ino80 complex(GO:0031011) DNA helicase complex(GO:0033202) |
| 0.1 | 0.6 | GO:0032389 | MutLalpha complex(GO:0032389) |
| 0.1 | 6.2 | GO:0032580 | Golgi cisterna membrane(GO:0032580) |
| 0.1 | 1.2 | GO:0032040 | small-subunit processome(GO:0032040) |
| 0.1 | 3.0 | GO:0032420 | stereocilium(GO:0032420) |
| 0.1 | 1.4 | GO:0000786 | nucleosome(GO:0000786) |
| 0.1 | 2.4 | GO:0015030 | Cajal body(GO:0015030) |
| 0.1 | 4.1 | GO:0032588 | trans-Golgi network membrane(GO:0032588) |
| 0.1 | 26.2 | GO:0016607 | nuclear speck(GO:0016607) |
| 0.1 | 12.1 | GO:0001726 | ruffle(GO:0001726) |
| 0.1 | 0.8 | GO:0031941 | filamentous actin(GO:0031941) |
| 0.1 | 2.3 | GO:0010494 | cytoplasmic stress granule(GO:0010494) |
| 0.0 | 0.4 | GO:0000124 | SAGA complex(GO:0000124) |
| 0.0 | 1.0 | GO:0031985 | Golgi cisterna(GO:0031985) |
| 0.0 | 0.3 | GO:1990130 | Iml1 complex(GO:1990130) |
| 0.0 | 3.0 | GO:0048770 | melanosome(GO:0042470) pigment granule(GO:0048770) |
| 0.0 | 0.8 | GO:0030173 | integral component of Golgi membrane(GO:0030173) |
| 0.0 | 0.4 | GO:0030008 | TRAPP complex(GO:0030008) |
| 0.0 | 0.8 | GO:0005771 | multivesicular body(GO:0005771) |
| 0.0 | 0.2 | GO:0046696 | lipopolysaccharide receptor complex(GO:0046696) |
| 0.0 | 4.7 | GO:0030529 | intracellular ribonucleoprotein complex(GO:0030529) |
| 0.0 | 5.7 | GO:0005788 | endoplasmic reticulum lumen(GO:0005788) |
| 0.0 | 0.2 | GO:0070522 | ERCC4-ERCC1 complex(GO:0070522) |
Gene overrepresentation in molecular function category:
| Log-likelihood per target | Total log-likelihood | Term | Description |
|---|---|---|---|
| 13.6 | 40.9 | GO:0003896 | DNA primase activity(GO:0003896) |
| 12.2 | 48.8 | GO:0030622 | U4atac snRNA binding(GO:0030622) |
| 12.2 | 72.9 | GO:1990446 | U1 snRNP binding(GO:1990446) |
| 11.2 | 33.6 | GO:0031208 | POZ domain binding(GO:0031208) |
| 11.1 | 66.3 | GO:0019238 | cyclohydrolase activity(GO:0019238) |
| 10.8 | 43.2 | GO:0043262 | adenosine-diphosphatase activity(GO:0043262) |
| 9.8 | 29.3 | GO:0043035 | chromatin insulator sequence binding(GO:0043035) |
| 9.3 | 46.5 | GO:0019834 | phospholipase A2 inhibitor activity(GO:0019834) |
| 8.4 | 25.1 | GO:0004766 | spermidine synthase activity(GO:0004766) |
| 7.4 | 73.7 | GO:0055104 | ligase inhibitor activity(GO:0055104) ubiquitin ligase inhibitor activity(GO:1990948) |
| 7.0 | 21.0 | GO:0004492 | methylmalonyl-CoA decarboxylase activity(GO:0004492) |
| 6.2 | 43.1 | GO:0004849 | uridine kinase activity(GO:0004849) |
| 5.9 | 29.6 | GO:0030621 | U4 snRNA binding(GO:0030621) |
| 5.7 | 22.6 | GO:0102007 | lactonohydrolase activity(GO:0046573) acyl-L-homoserine-lactone lactonohydrolase activity(GO:0102007) |
| 5.4 | 16.2 | GO:0050309 | glucose-6-phosphatase activity(GO:0004346) sugar-terminal-phosphatase activity(GO:0050309) |
| 5.3 | 15.8 | GO:0035248 | alpha-1,4-N-acetylgalactosaminyltransferase activity(GO:0035248) |
| 5.2 | 41.4 | GO:0019237 | centromeric DNA binding(GO:0019237) |
| 5.0 | 15.1 | GO:0033858 | N-acetylgalactosamine kinase activity(GO:0033858) |
| 5.0 | 15.0 | GO:0098973 | structural constituent of synapse(GO:0098918) structural constituent of postsynaptic actin cytoskeleton(GO:0098973) |
| 4.8 | 28.5 | GO:0044020 | histone methyltransferase activity (H4-R3 specific)(GO:0044020) |
| 4.7 | 18.9 | GO:0042134 | rRNA primary transcript binding(GO:0042134) |
| 4.5 | 26.8 | GO:0004563 | beta-N-acetylhexosaminidase activity(GO:0004563) |
| 4.3 | 25.5 | GO:0047894 | flavonol 3-sulfotransferase activity(GO:0047894) |
| 4.1 | 12.4 | GO:0004677 | DNA-dependent protein kinase activity(GO:0004677) |
| 3.9 | 11.6 | GO:0032143 | single thymine insertion binding(GO:0032143) |
| 3.7 | 11.2 | GO:0000035 | acyl binding(GO:0000035) |
| 3.7 | 29.4 | GO:0016681 | ubiquinol-cytochrome-c reductase activity(GO:0008121) oxidoreductase activity, acting on diphenols and related substances as donors, cytochrome as acceptor(GO:0016681) |
| 3.6 | 10.9 | GO:0050510 | N-acetylgalactosaminyl-proteoglycan 3-beta-glucuronosyltransferase activity(GO:0050510) |
| 3.6 | 10.9 | GO:0001069 | regulatory region RNA binding(GO:0001069) |
| 3.6 | 14.4 | GO:0047685 | amine sulfotransferase activity(GO:0047685) |
| 3.6 | 28.6 | GO:0004634 | phosphopyruvate hydratase activity(GO:0004634) |
| 3.5 | 27.8 | GO:0071933 | Arp2/3 complex binding(GO:0071933) |
| 3.4 | 17.1 | GO:0034597 | phosphatidylinositol-3,4-bisphosphate 4-phosphatase activity(GO:0016316) inositol-1,3,4-trisphosphate 4-phosphatase activity(GO:0017161) phosphatidylinositol-4,5-bisphosphate 4-phosphatase activity(GO:0034597) inositol-3,4-bisphosphate 4-phosphatase activity(GO:0052828) |
| 3.4 | 13.6 | GO:0003883 | CTP synthase activity(GO:0003883) |
| 3.3 | 10.0 | GO:0032089 | NACHT domain binding(GO:0032089) |
| 3.3 | 92.2 | GO:0004298 | threonine-type endopeptidase activity(GO:0004298) threonine-type peptidase activity(GO:0070003) |
| 3.3 | 39.0 | GO:0010314 | phosphatidylinositol-5-phosphate binding(GO:0010314) |
| 3.3 | 58.5 | GO:0001055 | RNA polymerase II activity(GO:0001055) |
| 3.2 | 12.8 | GO:0051748 | UTP:glucose-1-phosphate uridylyltransferase activity(GO:0003983) UTP-monosaccharide-1-phosphate uridylyltransferase activity(GO:0051748) |
| 3.1 | 25.1 | GO:0004111 | creatine kinase activity(GO:0004111) |
| 3.1 | 6.1 | GO:0009041 | uridylate kinase activity(GO:0009041) |
| 3.0 | 27.3 | GO:0051575 | 5'-deoxyribose-5-phosphate lyase activity(GO:0051575) |
| 3.0 | 15.1 | GO:0038051 | glucocorticoid receptor activity(GO:0004883) glucocorticoid-activated RNA polymerase II transcription factor binding transcription factor activity(GO:0038051) |
| 3.0 | 11.8 | GO:0003938 | IMP dehydrogenase activity(GO:0003938) |
| 2.9 | 8.8 | GO:0070735 | protein-glycine ligase activity(GO:0070735) |
| 2.9 | 14.5 | GO:0019912 | cyclin-dependent protein kinase activating kinase activity(GO:0019912) |
| 2.8 | 8.5 | GO:0004750 | ribulose-phosphate 3-epimerase activity(GO:0004750) |
| 2.8 | 8.4 | GO:0008169 | C-methyltransferase activity(GO:0008169) |
| 2.6 | 10.5 | GO:0072320 | volume-sensitive chloride channel activity(GO:0072320) |
| 2.6 | 20.7 | GO:0019863 | IgE binding(GO:0019863) |
| 2.6 | 7.7 | GO:0002135 | CTP binding(GO:0002135) |
| 2.6 | 15.4 | GO:0050145 | nucleoside phosphate kinase activity(GO:0050145) |
| 2.6 | 23.1 | GO:0016842 | amidine-lyase activity(GO:0016842) |
| 2.6 | 20.5 | GO:0008379 | thioredoxin peroxidase activity(GO:0008379) |
| 2.5 | 20.4 | GO:0003726 | double-stranded RNA adenosine deaminase activity(GO:0003726) |
| 2.5 | 2.5 | GO:0036435 | K48-linked polyubiquitin binding(GO:0036435) |
| 2.5 | 7.5 | GO:0030618 | transforming growth factor beta receptor, pathway-specific cytoplasmic mediator activity(GO:0030618) |
| 2.4 | 9.5 | GO:0019797 | procollagen-proline 3-dioxygenase activity(GO:0019797) |
| 2.4 | 9.5 | GO:0043273 | CTPase activity(GO:0043273) |
| 2.4 | 11.8 | GO:0042296 | ISG15 transferase activity(GO:0042296) |
| 2.4 | 7.1 | GO:0044594 | 3alpha,7alpha,12alpha-trihydroxy-5beta-cholest-24-enoyl-CoA hydratase activity(GO:0033989) 17-beta-hydroxysteroid dehydrogenase (NAD+) activity(GO:0044594) |
| 2.3 | 15.9 | GO:0030614 | oxidoreductase activity, acting on phosphorus or arsenic in donors(GO:0030613) oxidoreductase activity, acting on phosphorus or arsenic in donors, disulfide as acceptor(GO:0030614) |
| 2.2 | 85.4 | GO:0005540 | hyaluronic acid binding(GO:0005540) |
| 2.2 | 6.7 | GO:0005519 | cytoskeletal regulatory protein binding(GO:0005519) |
| 2.2 | 19.9 | GO:0046703 | natural killer cell lectin-like receptor binding(GO:0046703) |
| 2.2 | 6.6 | GO:0004345 | glucose-6-phosphate dehydrogenase activity(GO:0004345) |
| 2.2 | 6.6 | GO:0052796 | exo-alpha-(2->3)-sialidase activity(GO:0052794) exo-alpha-(2->6)-sialidase activity(GO:0052795) exo-alpha-(2->8)-sialidase activity(GO:0052796) |
| 2.2 | 11.0 | GO:1990460 | leptin receptor binding(GO:1990460) |
| 2.2 | 28.1 | GO:0031681 | G-protein beta-subunit binding(GO:0031681) |
| 2.1 | 15.0 | GO:0102345 | 3-hydroxy-behenoyl-CoA dehydratase activity(GO:0102344) 3-hydroxy-lignoceroyl-CoA dehydratase activity(GO:0102345) |
| 2.1 | 12.8 | GO:0004839 | ubiquitin activating enzyme activity(GO:0004839) |
| 2.1 | 25.4 | GO:0015266 | protein channel activity(GO:0015266) |
| 2.1 | 6.4 | GO:0015616 | DNA translocase activity(GO:0015616) |
| 2.1 | 6.4 | GO:0004307 | ethanolaminephosphotransferase activity(GO:0004307) |
| 2.1 | 8.4 | GO:0003985 | acetyl-CoA C-acetyltransferase activity(GO:0003985) |
| 2.0 | 4.1 | GO:0032564 | adenyl deoxyribonucleotide binding(GO:0032558) dATP binding(GO:0032564) |
| 2.0 | 16.2 | GO:0004738 | pyruvate dehydrogenase activity(GO:0004738) pyruvate dehydrogenase [NAD(P)+] activity(GO:0034603) pyruvate dehydrogenase (NAD+) activity(GO:0034604) |
| 2.0 | 8.0 | GO:0000822 | inositol hexakisphosphate binding(GO:0000822) |
| 2.0 | 13.8 | GO:0033170 | DNA clamp loader activity(GO:0003689) protein-DNA loading ATPase activity(GO:0033170) |
| 1.9 | 7.7 | GO:0043515 | kinetochore binding(GO:0043515) |
| 1.9 | 5.8 | GO:0003860 | 3-hydroxyisobutyryl-CoA hydrolase activity(GO:0003860) |
| 1.9 | 21.1 | GO:0004576 | oligosaccharyl transferase activity(GO:0004576) |
| 1.8 | 7.3 | GO:0033265 | choline binding(GO:0033265) |
| 1.8 | 7.3 | GO:0046933 | proton-transporting ATP synthase activity, rotational mechanism(GO:0046933) |
| 1.8 | 16.1 | GO:0032190 | acrosin binding(GO:0032190) |
| 1.8 | 35.5 | GO:0008603 | cAMP-dependent protein kinase regulator activity(GO:0008603) |
| 1.7 | 12.2 | GO:0010858 | calcium-dependent protein kinase regulator activity(GO:0010858) |
| 1.7 | 29.3 | GO:0051400 | BH domain binding(GO:0051400) |
| 1.7 | 25.9 | GO:0017070 | U6 snRNA binding(GO:0017070) |
| 1.7 | 25.6 | GO:0005049 | nuclear export signal receptor activity(GO:0005049) |
| 1.7 | 5.0 | GO:0004963 | follicle-stimulating hormone receptor activity(GO:0004963) |
| 1.7 | 36.6 | GO:0008494 | translation activator activity(GO:0008494) |
| 1.7 | 5.0 | GO:0016454 | serine C-palmitoyltransferase activity(GO:0004758) C-palmitoyltransferase activity(GO:0016454) |
| 1.7 | 8.3 | GO:0004376 | glycolipid mannosyltransferase activity(GO:0004376) |
| 1.6 | 4.9 | GO:0050501 | hyaluronan synthase activity(GO:0050501) |
| 1.6 | 30.9 | GO:0019706 | protein-cysteine S-palmitoyltransferase activity(GO:0019706) protein-cysteine S-acyltransferase activity(GO:0019707) |
| 1.6 | 6.5 | GO:0000995 | transcription factor activity, core RNA polymerase III binding(GO:0000995) |
| 1.6 | 16.0 | GO:0051425 | PTB domain binding(GO:0051425) |
| 1.6 | 14.3 | GO:0016206 | catechol O-methyltransferase activity(GO:0016206) |
| 1.6 | 28.4 | GO:0051537 | 2 iron, 2 sulfur cluster binding(GO:0051537) |
| 1.6 | 4.7 | GO:0003858 | 3-hydroxybutyrate dehydrogenase activity(GO:0003858) |
| 1.6 | 6.2 | GO:0016417 | S-acyltransferase activity(GO:0016417) |
| 1.5 | 4.6 | GO:0008336 | gamma-butyrobetaine dioxygenase activity(GO:0008336) |
| 1.5 | 33.9 | GO:0016832 | aldehyde-lyase activity(GO:0016832) |
| 1.5 | 34.8 | GO:0098748 | clathrin adaptor activity(GO:0035615) endocytic adaptor activity(GO:0098748) |
| 1.5 | 9.0 | GO:0008479 | queuine tRNA-ribosyltransferase activity(GO:0008479) |
| 1.5 | 44.7 | GO:0070410 | co-SMAD binding(GO:0070410) |
| 1.5 | 8.9 | GO:0003960 | NADPH:quinone reductase activity(GO:0003960) |
| 1.4 | 1.4 | GO:0032427 | GBD domain binding(GO:0032427) |
| 1.4 | 4.3 | GO:0008384 | IkappaB kinase activity(GO:0008384) |
| 1.4 | 8.6 | GO:0043138 | 3'-5' DNA helicase activity(GO:0043138) |
| 1.4 | 24.0 | GO:1990381 | ubiquitin-specific protease binding(GO:1990381) |
| 1.4 | 34.8 | GO:0031489 | myosin V binding(GO:0031489) |
| 1.4 | 6.9 | GO:0050436 | microfibril binding(GO:0050436) |
| 1.4 | 11.0 | GO:0030292 | protein tyrosine kinase inhibitor activity(GO:0030292) |
| 1.4 | 12.4 | GO:0036042 | long-chain fatty acyl-CoA binding(GO:0036042) |
| 1.4 | 49.0 | GO:0001671 | ATPase activator activity(GO:0001671) |
| 1.3 | 12.1 | GO:0000014 | single-stranded DNA endodeoxyribonuclease activity(GO:0000014) |
| 1.3 | 9.3 | GO:0016403 | dimethylargininase activity(GO:0016403) |
| 1.3 | 8.0 | GO:0038085 | vascular endothelial growth factor binding(GO:0038085) |
| 1.3 | 9.2 | GO:0042500 | aspartic endopeptidase activity, intramembrane cleaving(GO:0042500) |
| 1.3 | 3.8 | GO:0004711 | ribosomal protein S6 kinase activity(GO:0004711) |
| 1.2 | 5.0 | GO:0004647 | phosphoserine phosphatase activity(GO:0004647) |
| 1.2 | 49.7 | GO:0004198 | calcium-dependent cysteine-type endopeptidase activity(GO:0004198) |
| 1.2 | 7.4 | GO:0005353 | fructose transmembrane transporter activity(GO:0005353) |
| 1.2 | 42.9 | GO:0044183 | protein binding involved in protein folding(GO:0044183) |
| 1.2 | 7.3 | GO:0004594 | pantothenate kinase activity(GO:0004594) |
| 1.2 | 4.9 | GO:0004449 | isocitrate dehydrogenase (NAD+) activity(GO:0004449) |
| 1.2 | 17.0 | GO:0031386 | protein tag(GO:0031386) |
| 1.2 | 251.0 | GO:0003735 | structural constituent of ribosome(GO:0003735) |
| 1.2 | 50.8 | GO:0008139 | nuclear localization sequence binding(GO:0008139) |
| 1.2 | 31.7 | GO:0005528 | macrolide binding(GO:0005527) FK506 binding(GO:0005528) |
| 1.2 | 8.2 | GO:0060698 | endoribonuclease inhibitor activity(GO:0060698) |
| 1.2 | 10.4 | GO:0019784 | NEDD8-specific protease activity(GO:0019784) |
| 1.2 | 3.5 | GO:0004597 | peptide-aspartate beta-dioxygenase activity(GO:0004597) |
| 1.1 | 3.3 | GO:0080101 | phosphatidyl-N-methylethanolamine N-methyltransferase activity(GO:0000773) phosphatidylethanolamine N-methyltransferase activity(GO:0004608) phosphatidyl-N-dimethylethanolamine N-methyltransferase activity(GO:0080101) |
| 1.1 | 62.2 | GO:0019212 | phosphatase inhibitor activity(GO:0019212) |
| 1.1 | 6.5 | GO:0002161 | aminoacyl-tRNA editing activity(GO:0002161) |
| 1.1 | 19.4 | GO:0097602 | cullin family protein binding(GO:0097602) |
| 1.1 | 3.2 | GO:0004862 | cAMP-dependent protein kinase inhibitor activity(GO:0004862) |
| 1.1 | 4.3 | GO:0035800 | deubiquitinase activator activity(GO:0035800) |
| 1.1 | 12.8 | GO:0009982 | pseudouridine synthase activity(GO:0009982) |
| 1.0 | 3.1 | GO:0070039 | rRNA (guanosine-2'-O-)-methyltransferase activity(GO:0070039) |
| 1.0 | 11.2 | GO:0043024 | ribosomal small subunit binding(GO:0043024) |
| 1.0 | 36.6 | GO:0016538 | cyclin-dependent protein serine/threonine kinase regulator activity(GO:0016538) |
| 1.0 | 4.1 | GO:0061649 | ubiquitinated histone binding(GO:0061649) |
| 1.0 | 4.0 | GO:0035614 | snRNA stem-loop binding(GO:0035614) |
| 1.0 | 18.9 | GO:0080025 | phosphatidylinositol-3,5-bisphosphate binding(GO:0080025) |
| 1.0 | 32.7 | GO:0004467 | long-chain fatty acid-CoA ligase activity(GO:0004467) |
| 1.0 | 13.7 | GO:0016846 | carbon-sulfur lyase activity(GO:0016846) |
| 1.0 | 14.6 | GO:0001094 | TFIID-class transcription factor binding(GO:0001094) |
| 1.0 | 2.9 | GO:0004958 | prostaglandin F receptor activity(GO:0004958) |
| 1.0 | 20.4 | GO:0016505 | peptidase activator activity involved in apoptotic process(GO:0016505) |
| 1.0 | 11.6 | GO:0004526 | ribonuclease P activity(GO:0004526) |
| 1.0 | 11.6 | GO:0003688 | DNA replication origin binding(GO:0003688) |
| 1.0 | 2.9 | GO:0051377 | mannose-ethanolamine phosphotransferase activity(GO:0051377) |
| 1.0 | 9.6 | GO:0001162 | RNA polymerase II intronic transcription regulatory region sequence-specific DNA binding(GO:0001162) |
| 0.9 | 17.1 | GO:0005176 | ErbB-2 class receptor binding(GO:0005176) |
| 0.9 | 20.9 | GO:0051010 | microtubule plus-end binding(GO:0051010) |
| 0.9 | 2.8 | GO:0004531 | deoxyribonuclease II activity(GO:0004531) |
| 0.9 | 19.8 | GO:0005385 | zinc ion transmembrane transporter activity(GO:0005385) |
| 0.9 | 16.0 | GO:0034236 | protein kinase A catalytic subunit binding(GO:0034236) |
| 0.9 | 5.6 | GO:0032552 | deoxyribonucleotide binding(GO:0032552) |
| 0.9 | 4.6 | GO:0003678 | DNA helicase activity(GO:0003678) |
| 0.9 | 4.6 | GO:0004090 | carbonyl reductase (NADPH) activity(GO:0004090) |
| 0.9 | 4.5 | GO:0004392 | heme oxygenase (decyclizing) activity(GO:0004392) |
| 0.9 | 7.9 | GO:0035174 | histone serine kinase activity(GO:0035174) |
| 0.9 | 26.9 | GO:0003755 | peptidyl-prolyl cis-trans isomerase activity(GO:0003755) |
| 0.9 | 52.7 | GO:0019894 | kinesin binding(GO:0019894) |
| 0.8 | 21.1 | GO:0031434 | mitogen-activated protein kinase kinase binding(GO:0031434) |
| 0.8 | 48.1 | GO:0008138 | protein tyrosine/serine/threonine phosphatase activity(GO:0008138) |
| 0.8 | 8.4 | GO:1990825 | sequence-specific mRNA binding(GO:1990825) |
| 0.8 | 67.7 | GO:0047485 | protein N-terminus binding(GO:0047485) |
| 0.8 | 28.8 | GO:0004003 | ATP-dependent DNA helicase activity(GO:0004003) |
| 0.8 | 8.1 | GO:0015385 | sodium:proton antiporter activity(GO:0015385) potassium:proton antiporter activity(GO:0015386) |
| 0.8 | 21.8 | GO:0070182 | DNA polymerase binding(GO:0070182) |
| 0.8 | 2.4 | GO:0016859 | cis-trans isomerase activity(GO:0016859) |
| 0.8 | 8.0 | GO:0004784 | superoxide dismutase activity(GO:0004784) oxidoreductase activity, acting on superoxide radicals as acceptor(GO:0016721) |
| 0.8 | 6.3 | GO:0097157 | pre-mRNA intronic binding(GO:0097157) |
| 0.8 | 5.5 | GO:0051021 | GDP-dissociation inhibitor binding(GO:0051021) Rho GDP-dissociation inhibitor binding(GO:0051022) |
| 0.8 | 3.1 | GO:0035402 | histone kinase activity (H3-T11 specific)(GO:0035402) |
| 0.8 | 3.9 | GO:0004045 | aminoacyl-tRNA hydrolase activity(GO:0004045) |
| 0.8 | 22.5 | GO:0070840 | dynein complex binding(GO:0070840) |
| 0.8 | 13.2 | GO:0008327 | methyl-CpG binding(GO:0008327) |
| 0.8 | 5.4 | GO:0016618 | hydroxypyruvate reductase activity(GO:0016618) glyoxylate reductase (NADP) activity(GO:0030267) |
| 0.8 | 13.8 | GO:0042809 | vitamin D receptor binding(GO:0042809) |
| 0.7 | 8.9 | GO:0016857 | racemase and epimerase activity, acting on carbohydrates and derivatives(GO:0016857) |
| 0.7 | 5.9 | GO:0004017 | adenylate kinase activity(GO:0004017) |
| 0.7 | 20.5 | GO:0097200 | cysteine-type endopeptidase activity involved in execution phase of apoptosis(GO:0097200) |
| 0.7 | 4.4 | GO:0016900 | oxidoreductase activity, acting on the CH-OH group of donors, disulfide as acceptor(GO:0016900) vitamin-K-epoxide reductase (warfarin-sensitive) activity(GO:0047057) |
| 0.7 | 3.6 | GO:0034988 | Fc-gamma receptor I complex binding(GO:0034988) |
| 0.7 | 10.7 | GO:0016892 | endoribonuclease activity, producing 3'-phosphomonoesters(GO:0016892) |
| 0.7 | 2.1 | GO:0019150 | D-ribulokinase activity(GO:0019150) |
| 0.7 | 4.3 | GO:0017040 | ceramidase activity(GO:0017040) |
| 0.7 | 6.4 | GO:0004032 | alditol:NADP+ 1-oxidoreductase activity(GO:0004032) |
| 0.7 | 5.6 | GO:0001875 | lipopolysaccharide receptor activity(GO:0001875) |
| 0.7 | 34.9 | GO:0016655 | oxidoreductase activity, acting on NAD(P)H, quinone or similar compound as acceptor(GO:0016655) |
| 0.7 | 6.3 | GO:0045545 | syndecan binding(GO:0045545) |
| 0.7 | 5.6 | GO:0042731 | PH domain binding(GO:0042731) |
| 0.7 | 6.1 | GO:0031730 | CCR5 chemokine receptor binding(GO:0031730) |
| 0.7 | 2.7 | GO:0005111 | type 2 fibroblast growth factor receptor binding(GO:0005111) |
| 0.7 | 14.8 | GO:0008191 | metalloendopeptidase inhibitor activity(GO:0008191) |
| 0.7 | 4.6 | GO:0015187 | glycine transmembrane transporter activity(GO:0015187) |
| 0.6 | 4.5 | GO:0000150 | recombinase activity(GO:0000150) |
| 0.6 | 7.8 | GO:0019869 | chloride channel inhibitor activity(GO:0019869) |
| 0.6 | 17.9 | GO:0070717 | poly-purine tract binding(GO:0070717) |
| 0.6 | 4.5 | GO:0044323 | retinoic acid-responsive element binding(GO:0044323) |
| 0.6 | 75.4 | GO:0003697 | single-stranded DNA binding(GO:0003697) |
| 0.6 | 8.2 | GO:0008253 | 5'-nucleotidase activity(GO:0008253) |
| 0.6 | 1.8 | GO:0004582 | dolichyl-phosphate beta-D-mannosyltransferase activity(GO:0004582) |
| 0.6 | 10.6 | GO:0019871 | sodium channel inhibitor activity(GO:0019871) |
| 0.6 | 2.3 | GO:0016230 | sphingomyelin phosphodiesterase activator activity(GO:0016230) |
| 0.6 | 26.1 | GO:0061631 | ubiquitin conjugating enzyme activity(GO:0061631) |
| 0.6 | 2.9 | GO:0043208 | glycosphingolipid binding(GO:0043208) |
| 0.6 | 10.6 | GO:0042609 | CD4 receptor binding(GO:0042609) |
| 0.6 | 3.3 | GO:0017169 | CDP-alcohol phosphatidyltransferase activity(GO:0017169) |
| 0.5 | 2.7 | GO:0098639 | collagen binding involved in cell-matrix adhesion(GO:0098639) |
| 0.5 | 9.3 | GO:0004535 | poly(A)-specific ribonuclease activity(GO:0004535) |
| 0.5 | 3.8 | GO:0008481 | sphinganine kinase activity(GO:0008481) D-erythro-sphingosine kinase activity(GO:0017050) |
| 0.5 | 3.7 | GO:0048408 | epidermal growth factor binding(GO:0048408) |
| 0.5 | 13.0 | GO:0070034 | telomerase RNA binding(GO:0070034) |
| 0.5 | 2.1 | GO:0016524 | latrotoxin receptor activity(GO:0016524) |
| 0.5 | 3.6 | GO:0042608 | T cell receptor binding(GO:0042608) |
| 0.5 | 3.1 | GO:0045294 | alpha-catenin binding(GO:0045294) |
| 0.5 | 12.0 | GO:0008301 | DNA binding, bending(GO:0008301) |
| 0.5 | 6.3 | GO:0004691 | cAMP-dependent protein kinase activity(GO:0004691) |
| 0.5 | 2.9 | GO:0008518 | reduced folate carrier activity(GO:0008518) methotrexate transporter activity(GO:0015350) |
| 0.5 | 34.8 | GO:0004843 | thiol-dependent ubiquitin-specific protease activity(GO:0004843) |
| 0.5 | 5.6 | GO:0032453 | histone demethylase activity (H3-K4 specific)(GO:0032453) |
| 0.5 | 4.2 | GO:0036402 | proteasome-activating ATPase activity(GO:0036402) |
| 0.5 | 11.1 | GO:0070064 | proline-rich region binding(GO:0070064) |
| 0.5 | 3.7 | GO:0060002 | plus-end directed microfilament motor activity(GO:0060002) |
| 0.5 | 8.7 | GO:0043422 | protein kinase B binding(GO:0043422) |
| 0.5 | 29.7 | GO:0003743 | translation initiation factor activity(GO:0003743) |
| 0.4 | 3.5 | GO:0008046 | axon guidance receptor activity(GO:0008046) |
| 0.4 | 5.3 | GO:0034450 | ubiquitin-ubiquitin ligase activity(GO:0034450) |
| 0.4 | 7.1 | GO:0035256 | G-protein coupled glutamate receptor binding(GO:0035256) |
| 0.4 | 12.7 | GO:0043015 | gamma-tubulin binding(GO:0043015) |
| 0.4 | 5.6 | GO:0001730 | 2'-5'-oligoadenylate synthetase activity(GO:0001730) |
| 0.4 | 4.3 | GO:0017069 | snRNA binding(GO:0017069) |
| 0.4 | 8.6 | GO:0031492 | nucleosomal DNA binding(GO:0031492) |
| 0.4 | 173.0 | GO:0045296 | cadherin binding(GO:0045296) |
| 0.4 | 1.7 | GO:0017159 | pantetheine hydrolase activity(GO:0017159) |
| 0.4 | 3.0 | GO:0008454 | alpha-1,3-mannosylglycoprotein 4-beta-N-acetylglucosaminyltransferase activity(GO:0008454) |
| 0.4 | 5.5 | GO:0042800 | histone methyltransferase activity (H3-K4 specific)(GO:0042800) |
| 0.4 | 9.3 | GO:0004532 | exoribonuclease activity(GO:0004532) |
| 0.4 | 4.6 | GO:0016861 | intramolecular oxidoreductase activity, interconverting aldoses and ketoses(GO:0016861) |
| 0.4 | 14.5 | GO:0004364 | glutathione transferase activity(GO:0004364) |
| 0.4 | 69.8 | GO:0042393 | histone binding(GO:0042393) |
| 0.4 | 7.3 | GO:0030515 | snoRNA binding(GO:0030515) |
| 0.4 | 16.5 | GO:0004407 | histone deacetylase activity(GO:0004407) |
| 0.4 | 7.2 | GO:0035497 | cAMP response element binding(GO:0035497) |
| 0.4 | 1.6 | GO:0003827 | alpha-1,3-mannosylglycoprotein 2-beta-N-acetylglucosaminyltransferase activity(GO:0003827) |
| 0.4 | 13.2 | GO:0017147 | Wnt-protein binding(GO:0017147) |
| 0.4 | 1.9 | GO:0034714 | type III transforming growth factor beta receptor binding(GO:0034714) |
| 0.4 | 3.1 | GO:0070697 | activin receptor binding(GO:0070697) type II activin receptor binding(GO:0070699) |
| 0.4 | 3.0 | GO:0030274 | LIM domain binding(GO:0030274) |
| 0.4 | 2.2 | GO:0001054 | RNA polymerase I activity(GO:0001054) |
| 0.4 | 8.8 | GO:0004659 | prenyltransferase activity(GO:0004659) |
| 0.4 | 5.1 | GO:0031996 | thioesterase binding(GO:0031996) |
| 0.4 | 18.3 | GO:0001784 | phosphotyrosine binding(GO:0001784) |
| 0.4 | 6.1 | GO:0042043 | neurexin family protein binding(GO:0042043) |
| 0.4 | 1.1 | GO:0004418 | hydroxymethylbilane synthase activity(GO:0004418) |
| 0.3 | 23.0 | GO:0019003 | GDP binding(GO:0019003) |
| 0.3 | 5.8 | GO:0008536 | Ran GTPase binding(GO:0008536) |
| 0.3 | 2.6 | GO:0015165 | pyrimidine nucleotide-sugar transmembrane transporter activity(GO:0015165) |
| 0.3 | 3.0 | GO:0005068 | transmembrane receptor protein tyrosine kinase adaptor activity(GO:0005068) |
| 0.3 | 4.6 | GO:0031014 | troponin T binding(GO:0031014) |
| 0.3 | 23.3 | GO:0008565 | protein transporter activity(GO:0008565) |
| 0.3 | 2.6 | GO:0017128 | phospholipid scramblase activity(GO:0017128) |
| 0.3 | 34.1 | GO:0017048 | Rho GTPase binding(GO:0017048) |
| 0.3 | 2.4 | GO:0004126 | cytidine deaminase activity(GO:0004126) |
| 0.3 | 4.3 | GO:0034185 | apolipoprotein binding(GO:0034185) |
| 0.3 | 4.5 | GO:0019966 | interleukin-1 binding(GO:0019966) |
| 0.3 | 16.7 | GO:0019888 | protein phosphatase regulator activity(GO:0019888) |
| 0.3 | 3.5 | GO:0070053 | thrombospondin receptor activity(GO:0070053) |
| 0.3 | 3.5 | GO:0015129 | lactate transmembrane transporter activity(GO:0015129) |
| 0.3 | 5.8 | GO:0046966 | thyroid hormone receptor binding(GO:0046966) |
| 0.3 | 2.0 | GO:0043813 | phosphatidylinositol-3,5-bisphosphate 5-phosphatase activity(GO:0043813) |
| 0.3 | 1.1 | GO:0016929 | SUMO-specific protease activity(GO:0016929) |
| 0.3 | 7.3 | GO:0003841 | 1-acylglycerol-3-phosphate O-acyltransferase activity(GO:0003841) lysophosphatidic acid acyltransferase activity(GO:0042171) lysophospholipid acyltransferase activity(GO:0071617) |
| 0.3 | 2.5 | GO:0070273 | phosphatidylinositol-4-phosphate binding(GO:0070273) |
| 0.3 | 2.8 | GO:0016290 | palmitoyl-CoA hydrolase activity(GO:0016290) |
| 0.3 | 5.7 | GO:0008242 | omega peptidase activity(GO:0008242) |
| 0.3 | 7.0 | GO:0016922 | ligand-dependent nuclear receptor binding(GO:0016922) |
| 0.3 | 4.5 | GO:0030296 | protein tyrosine kinase activator activity(GO:0030296) |
| 0.3 | 5.8 | GO:0051371 | muscle alpha-actinin binding(GO:0051371) |
| 0.3 | 4.4 | GO:0004143 | diacylglycerol kinase activity(GO:0004143) |
| 0.3 | 43.4 | GO:0051015 | actin filament binding(GO:0051015) |
| 0.3 | 4.4 | GO:0045505 | dynein intermediate chain binding(GO:0045505) |
| 0.3 | 1.8 | GO:1990405 | C-X3-C chemokine binding(GO:0019960) protein antigen binding(GO:1990405) |
| 0.3 | 3.3 | GO:0008140 | cAMP response element binding protein binding(GO:0008140) |
| 0.3 | 19.3 | GO:0043130 | ubiquitin binding(GO:0043130) |
| 0.3 | 0.8 | GO:0047238 | glucuronosyl-N-acetylgalactosaminyl-proteoglycan 4-beta-N-acetylgalactosaminyltransferase activity(GO:0047238) |
| 0.2 | 1.5 | GO:0039552 | RIG-I binding(GO:0039552) |
| 0.2 | 10.9 | GO:0004869 | cysteine-type endopeptidase inhibitor activity(GO:0004869) |
| 0.2 | 0.6 | GO:0008157 | protein phosphatase 1 binding(GO:0008157) |
| 0.2 | 0.6 | GO:0004157 | dihydropyrimidinase activity(GO:0004157) |
| 0.2 | 0.6 | GO:0031697 | beta-1 adrenergic receptor binding(GO:0031697) |
| 0.2 | 0.7 | GO:0005148 | prolactin receptor binding(GO:0005148) |
| 0.2 | 0.4 | GO:0097677 | STAT family protein binding(GO:0097677) |
| 0.2 | 1.4 | GO:0031491 | nucleosome binding(GO:0031491) |
| 0.2 | 0.7 | GO:0008428 | ribonuclease inhibitor activity(GO:0008428) |
| 0.2 | 2.7 | GO:0003746 | translation elongation factor activity(GO:0003746) |
| 0.2 | 8.8 | GO:0004004 | RNA helicase activity(GO:0003724) ATP-dependent RNA helicase activity(GO:0004004) RNA-dependent ATPase activity(GO:0008186) |
| 0.2 | 0.5 | GO:0050567 | glutaminyl-tRNA synthase (glutamine-hydrolyzing) activity(GO:0050567) |
| 0.2 | 0.3 | GO:0000992 | polymerase III regulatory region sequence-specific DNA binding(GO:0000992) RNA polymerase III type 1 promoter sequence-specific DNA binding(GO:0001002) RNA polymerase III type 2 promoter sequence-specific DNA binding(GO:0001003) |
| 0.2 | 0.8 | GO:0001165 | RNA polymerase I upstream control element sequence-specific DNA binding(GO:0001165) |
| 0.2 | 3.9 | GO:0070006 | metalloaminopeptidase activity(GO:0070006) |
| 0.2 | 2.7 | GO:0004386 | helicase activity(GO:0004386) |
| 0.2 | 3.0 | GO:0015114 | phosphate ion transmembrane transporter activity(GO:0015114) |
| 0.2 | 3.2 | GO:0034237 | protein kinase A regulatory subunit binding(GO:0034237) |
| 0.1 | 0.7 | GO:0001594 | trace-amine receptor activity(GO:0001594) |
| 0.1 | 7.2 | GO:0001205 | transcriptional activator activity, RNA polymerase II distal enhancer sequence-specific binding(GO:0001205) |
| 0.1 | 0.4 | GO:0008240 | tripeptidyl-peptidase activity(GO:0008240) |
| 0.1 | 1.8 | GO:0043560 | insulin receptor substrate binding(GO:0043560) |
| 0.1 | 7.2 | GO:0017112 | Rab guanyl-nucleotide exchange factor activity(GO:0017112) |
| 0.1 | 1.4 | GO:0004128 | cytochrome-b5 reductase activity, acting on NAD(P)H(GO:0004128) |
| 0.1 | 2.9 | GO:0050431 | transforming growth factor beta binding(GO:0050431) |
| 0.1 | 0.7 | GO:0004084 | branched-chain-amino-acid transaminase activity(GO:0004084) L-leucine transaminase activity(GO:0052654) L-valine transaminase activity(GO:0052655) L-isoleucine transaminase activity(GO:0052656) |
| 0.1 | 8.5 | GO:0050840 | extracellular matrix binding(GO:0050840) |
| 0.1 | 1.3 | GO:0043522 | leucine zipper domain binding(GO:0043522) |
| 0.1 | 1.2 | GO:0008429 | phosphatidylethanolamine binding(GO:0008429) |
| 0.1 | 2.0 | GO:0010857 | calcium-dependent protein serine/threonine kinase activity(GO:0009931) calcium-dependent protein kinase activity(GO:0010857) |
| 0.1 | 1.3 | GO:0001851 | complement component C3b binding(GO:0001851) |
| 0.1 | 0.4 | GO:0004980 | melanocyte-stimulating hormone receptor activity(GO:0004980) |
| 0.1 | 133.4 | GO:0003723 | RNA binding(GO:0003723) |
| 0.1 | 1.5 | GO:0004551 | nucleotide diphosphatase activity(GO:0004551) |
| 0.1 | 2.5 | GO:0030742 | GTP-dependent protein binding(GO:0030742) |
| 0.1 | 5.3 | GO:0048306 | calcium-dependent protein binding(GO:0048306) |
| 0.1 | 2.1 | GO:0071889 | 14-3-3 protein binding(GO:0071889) |
| 0.1 | 3.9 | GO:0001158 | enhancer sequence-specific DNA binding(GO:0001158) |
| 0.1 | 1.0 | GO:0004645 | phosphorylase activity(GO:0004645) |
| 0.1 | 1.3 | GO:0005112 | Notch binding(GO:0005112) |
| 0.1 | 0.8 | GO:0035381 | extracellular ATP-gated cation channel activity(GO:0004931) ATP-gated ion channel activity(GO:0035381) |
| 0.1 | 0.8 | GO:0036122 | BMP binding(GO:0036122) |
| 0.1 | 6.7 | GO:0002020 | protease binding(GO:0002020) |
| 0.1 | 1.9 | GO:0042288 | MHC class I protein binding(GO:0042288) |
| 0.1 | 1.5 | GO:0005337 | nucleoside transmembrane transporter activity(GO:0005337) |
| 0.1 | 0.3 | GO:0099580 | ion antiporter activity involved in regulation of postsynaptic membrane potential(GO:0099580) |
| 0.1 | 2.2 | GO:0001972 | retinoic acid binding(GO:0001972) |
| 0.1 | 5.8 | GO:0019903 | protein phosphatase binding(GO:0019903) |
| 0.1 | 0.5 | GO:0016167 | glial cell-derived neurotrophic factor receptor activity(GO:0016167) |
| 0.1 | 1.8 | GO:0042169 | SH2 domain binding(GO:0042169) |
| 0.1 | 0.6 | GO:0050694 | galactosylceramide sulfotransferase activity(GO:0001733) galactose 3-O-sulfotransferase activity(GO:0050694) |
| 0.1 | 0.9 | GO:0051428 | peptide hormone receptor binding(GO:0051428) |
| 0.1 | 0.8 | GO:0023026 | MHC protein complex binding(GO:0023023) MHC class II protein complex binding(GO:0023026) |
| 0.1 | 1.4 | GO:0001087 | transcription factor activity, sequence-specific DNA binding, RNA polymerase recruiting(GO:0001011) transcription factor activity, TFIIB-class binding(GO:0001087) |
| 0.1 | 0.3 | GO:0031781 | melanocortin receptor binding(GO:0031779) type 3 melanocortin receptor binding(GO:0031781) type 4 melanocortin receptor binding(GO:0031782) |
| 0.1 | 0.5 | GO:0008569 | ATP-dependent microtubule motor activity, minus-end-directed(GO:0008569) |
| 0.1 | 0.7 | GO:0052629 | phosphatidylinositol-3,5-bisphosphate 3-phosphatase activity(GO:0052629) |
| 0.1 | 1.6 | GO:0051219 | phosphoprotein binding(GO:0051219) |
| 0.1 | 0.3 | GO:0004046 | aminoacylase activity(GO:0004046) |
| 0.0 | 0.9 | GO:0004185 | serine-type carboxypeptidase activity(GO:0004185) |
| 0.0 | 0.3 | GO:0004873 | asialoglycoprotein receptor activity(GO:0004873) |
| 0.0 | 0.3 | GO:0004062 | aryl sulfotransferase activity(GO:0004062) |
| 0.0 | 1.4 | GO:0005484 | SNAP receptor activity(GO:0005484) |
| 0.0 | 0.6 | GO:0035259 | glucocorticoid receptor binding(GO:0035259) |
| 0.0 | 1.7 | GO:0004715 | non-membrane spanning protein tyrosine kinase activity(GO:0004715) |
| 0.0 | 0.1 | GO:0004461 | lactose synthase activity(GO:0004461) |
| 0.0 | 6.1 | GO:0003924 | GTPase activity(GO:0003924) |
| 0.0 | 2.3 | GO:0005089 | Rho guanyl-nucleotide exchange factor activity(GO:0005089) |
| 0.0 | 1.5 | GO:0003705 | transcription factor activity, RNA polymerase II distal enhancer sequence-specific binding(GO:0003705) |
| 0.0 | 0.1 | GO:0030291 | protein serine/threonine kinase inhibitor activity(GO:0030291) |
| 0.0 | 0.3 | GO:0043539 | protein serine/threonine kinase activator activity(GO:0043539) |
Gene overrepresentation in curated gene sets: canonical pathways category:
| Log-likelihood per target | Total log-likelihood | Term | Description |
|---|---|---|---|
| 2.4 | 84.2 | PID TOLL ENDOGENOUS PATHWAY | Endogenous TLR signaling |
| 2.1 | 28.9 | SA G2 AND M PHASES | Cdc25 activates the cdc2/cyclin B complex to induce the G2/M transition. |
| 1.6 | 46.1 | PID DNA PK PATHWAY | DNA-PK pathway in nonhomologous end joining |
| 1.5 | 10.2 | SA REG CASCADE OF CYCLIN EXPR | Expression of cyclins regulates progression through the cell cycle by activating cyclin-dependent kinases. |
| 1.4 | 84.4 | PID AURORA B PATHWAY | Aurora B signaling |
| 1.3 | 52.8 | PID SMAD2 3PATHWAY | Regulation of cytoplasmic and nuclear SMAD2/3 signaling |
| 1.2 | 23.2 | PID RANBP2 PATHWAY | Sumoylation by RanBP2 regulates transcriptional repression |
| 1.2 | 94.1 | PID P53 REGULATION PATHWAY | p53 pathway |
| 1.1 | 35.0 | PID BETA CATENIN DEG PATHWAY | Degradation of beta catenin |
| 1.0 | 56.7 | PID ATR PATHWAY | ATR signaling pathway |
| 0.9 | 19.9 | PID ARF6 DOWNSTREAM PATHWAY | Arf6 downstream pathway |
| 0.9 | 21.9 | PID ARF 3PATHWAY | Arf1 pathway |
| 0.9 | 9.5 | ST IL 13 PATHWAY | Interleukin 13 (IL-13) Pathway |
| 0.8 | 35.4 | PID AVB3 OPN PATHWAY | Osteopontin-mediated events |
| 0.8 | 79.2 | PID E2F PATHWAY | E2F transcription factor network |
| 0.7 | 14.8 | PID FANCONI PATHWAY | Fanconi anemia pathway |
| 0.7 | 73.8 | PID AR PATHWAY | Coregulation of Androgen receptor activity |
| 0.7 | 46.2 | PID ILK PATHWAY | Integrin-linked kinase signaling |
| 0.7 | 48.5 | PID RAC1 PATHWAY | RAC1 signaling pathway |
| 0.7 | 18.0 | PID MYC PATHWAY | C-MYC pathway |
| 0.7 | 31.4 | PID PLK1 PATHWAY | PLK1 signaling events |
| 0.7 | 12.4 | SA PROGRAMMED CELL DEATH | Programmed cell death, or apoptosis, eliminates damaged or unneeded cells. |
| 0.6 | 5.7 | PID NFKAPPAB ATYPICAL PATHWAY | Atypical NF-kappaB pathway |
| 0.5 | 30.1 | PID CERAMIDE PATHWAY | Ceramide signaling pathway |
| 0.5 | 1.8 | PID NECTIN PATHWAY | Nectin adhesion pathway |
| 0.5 | 31.3 | PID NOTCH PATHWAY | Notch signaling pathway |
| 0.5 | 20.8 | PID FAK PATHWAY | Signaling events mediated by focal adhesion kinase |
| 0.4 | 16.5 | PID ECADHERIN NASCENT AJ PATHWAY | E-cadherin signaling in the nascent adherens junction |
| 0.4 | 7.1 | PID VEGF VEGFR PATHWAY | VEGF and VEGFR signaling network |
| 0.4 | 9.8 | PID NCADHERIN PATHWAY | N-cadherin signaling events |
| 0.4 | 10.4 | PID FOXM1 PATHWAY | FOXM1 transcription factor network |
| 0.4 | 18.9 | PID HEDGEHOG GLI PATHWAY | Hedgehog signaling events mediated by Gli proteins |
| 0.4 | 7.5 | PID ALK2 PATHWAY | ALK2 signaling events |
| 0.4 | 25.8 | PID MTOR 4PATHWAY | mTOR signaling pathway |
| 0.4 | 22.7 | PID INTEGRIN A4B1 PATHWAY | Alpha4 beta1 integrin signaling events |
| 0.4 | 11.1 | PID WNT SIGNALING PATHWAY | Wnt signaling network |
| 0.3 | 19.2 | PID AJDISS 2PATHWAY | Posttranslational regulation of adherens junction stability and dissassembly |
| 0.3 | 9.7 | PID RHOA PATHWAY | RhoA signaling pathway |
| 0.3 | 8.3 | PID PI3K PLC TRK PATHWAY | Trk receptor signaling mediated by PI3K and PLC-gamma |
| 0.3 | 14.7 | PID INTEGRIN3 PATHWAY | Beta3 integrin cell surface interactions |
| 0.3 | 3.3 | PID ATM PATHWAY | ATM pathway |
| 0.2 | 11.3 | WNT SIGNALING | Genes related to Wnt-mediated signal transduction |
| 0.2 | 8.5 | PID IL6 7 PATHWAY | IL6-mediated signaling events |
| 0.2 | 9.2 | PID GLYPICAN 1PATHWAY | Glypican 1 network |
| 0.2 | 4.5 | PID HIF1A PATHWAY | Hypoxic and oxygen homeostasis regulation of HIF-1-alpha |
| 0.2 | 9.4 | PID HDAC CLASSII PATHWAY | Signaling events mediated by HDAC Class II |
| 0.2 | 2.8 | PID ANTHRAX PATHWAY | Cellular roles of Anthrax toxin |
| 0.2 | 9.7 | PID VEGFR1 2 PATHWAY | Signaling events mediated by VEGFR1 and VEGFR2 |
| 0.2 | 5.3 | PID P38 ALPHA BETA DOWNSTREAM PATHWAY | Signaling mediated by p38-alpha and p38-beta |
| 0.2 | 5.3 | SIG REGULATION OF THE ACTIN CYTOSKELETON BY RHO GTPASES | Genes related to regulation of the actin cytoskeleton |
| 0.2 | 4.7 | PID TRAIL PATHWAY | TRAIL signaling pathway |
| 0.2 | 2.6 | PID NFKAPPAB CANONICAL PATHWAY | Canonical NF-kappaB pathway |
| 0.2 | 2.4 | PID AURORA A PATHWAY | Aurora A signaling |
| 0.2 | 8.4 | PID TGFBR PATHWAY | TGF-beta receptor signaling |
| 0.2 | 4.5 | PID CDC42 PATHWAY | CDC42 signaling events |
| 0.1 | 10.6 | PID BETA CATENIN NUC PATHWAY | Regulation of nuclear beta catenin signaling and target gene transcription |
| 0.1 | 8.3 | PID RHOA REG PATHWAY | Regulation of RhoA activity |
| 0.1 | 14.3 | PID P53 DOWNSTREAM PATHWAY | Direct p53 effectors |
| 0.1 | 2.0 | PID FGF PATHWAY | FGF signaling pathway |
| 0.1 | 3.5 | PID ERBB1 INTERNALIZATION PATHWAY | Internalization of ErbB1 |
| 0.1 | 3.8 | PID TAP63 PATHWAY | Validated transcriptional targets of TAp63 isoforms |
| 0.1 | 2.1 | PID KIT PATHWAY | Signaling events mediated by Stem cell factor receptor (c-Kit) |
| 0.1 | 1.1 | SA CASPASE CASCADE | Apoptosis is mediated by caspases, cysteine proteases arranged in a proteolytic cascade. |
| 0.1 | 1.2 | PID FOXO PATHWAY | FoxO family signaling |
| 0.1 | 3.0 | PID HIF1 TFPATHWAY | HIF-1-alpha transcription factor network |
| 0.1 | 2.3 | PID TELOMERASE PATHWAY | Regulation of Telomerase |
| 0.1 | 1.4 | PID INTEGRIN CS PATHWAY | Integrin family cell surface interactions |
| 0.1 | 0.9 | PID IL2 1PATHWAY | IL2-mediated signaling events |
| 0.0 | 1.3 | PID REELIN PATHWAY | Reelin signaling pathway |
| 0.0 | 0.3 | PID HIV NEF PATHWAY | HIV-1 Nef: Negative effector of Fas and TNF-alpha |
| 0.0 | 2.4 | ST FAS SIGNALING PATHWAY | Fas Signaling Pathway |
| 0.0 | 0.4 | PID SYNDECAN 3 PATHWAY | Syndecan-3-mediated signaling events |
| 0.0 | 2.0 | PID CMYB PATHWAY | C-MYB transcription factor network |
| 0.0 | 1.2 | PID RB 1PATHWAY | Regulation of retinoblastoma protein |
| 0.0 | 1.2 | PID CDC42 REG PATHWAY | Regulation of CDC42 activity |
| 0.0 | 0.5 | PID ECADHERIN STABILIZATION PATHWAY | Stabilization and expansion of the E-cadherin adherens junction |
| 0.0 | 0.8 | PID MYC ACTIV PATHWAY | Validated targets of C-MYC transcriptional activation |
Gene overrepresentation in curated gene sets: REACTOME pathways category:
| Log-likelihood per target | Total log-likelihood | Term | Description |
|---|---|---|---|
| 4.9 | 73.9 | REACTOME PURINE RIBONUCLEOSIDE MONOPHOSPHATE BIOSYNTHESIS | Genes involved in Purine ribonucleoside monophosphate biosynthesis |
| 3.2 | 51.7 | REACTOME POL SWITCHING | Genes involved in Polymerase switching |
| 2.8 | 14.0 | REACTOME ORC1 REMOVAL FROM CHROMATIN | Genes involved in Orc1 removal from chromatin |
| 2.7 | 5.5 | REACTOME CDK MEDIATED PHOSPHORYLATION AND REMOVAL OF CDC6 | Genes involved in CDK-mediated phosphorylation and removal of Cdc6 |
| 2.7 | 21.6 | REACTOME P53 INDEPENDENT G1 S DNA DAMAGE CHECKPOINT | Genes involved in p53-Independent G1/S DNA damage checkpoint |
| 2.6 | 23.3 | REACTOME CYTOSOLIC TRNA AMINOACYLATION | Genes involved in Cytosolic tRNA aminoacylation |
| 2.5 | 58.5 | REACTOME VIRAL MESSENGER RNA SYNTHESIS | Genes involved in Viral Messenger RNA Synthesis |
| 2.5 | 95.3 | REACTOME ASSOCIATION OF TRIC CCT WITH TARGET PROTEINS DURING BIOSYNTHESIS | Genes involved in Association of TriC/CCT with target proteins during biosynthesis |
| 2.5 | 37.6 | REACTOME UNWINDING OF DNA | Genes involved in Unwinding of DNA |
| 2.4 | 26.5 | REACTOME CDT1 ASSOCIATION WITH THE CDC6 ORC ORIGIN COMPLEX | Genes involved in CDT1 association with the CDC6:ORC:origin complex |
| 2.4 | 9.5 | REACTOME NEGATIVE REGULATION OF THE PI3K AKT NETWORK | Genes involved in Negative regulation of the PI3K/AKT network |
| 2.3 | 233.5 | REACTOME APC C CDC20 MEDIATED DEGRADATION OF MITOTIC PROTEINS | Genes involved in APC/C:Cdc20 mediated degradation of mitotic proteins |
| 2.3 | 34.7 | REACTOME SLBP DEPENDENT PROCESSING OF REPLICATION DEPENDENT HISTONE PRE MRNAS | Genes involved in SLBP Dependent Processing of Replication-Dependent Histone Pre-mRNAs |
| 2.3 | 54.7 | REACTOME HYALURONAN UPTAKE AND DEGRADATION | Genes involved in Hyaluronan uptake and degradation |
| 2.2 | 19.4 | REACTOME SCF BETA TRCP MEDIATED DEGRADATION OF EMI1 | Genes involved in SCF-beta-TrCP mediated degradation of Emi1 |
| 2.1 | 14.9 | REACTOME MEMBRANE BINDING AND TARGETTING OF GAG PROTEINS | Genes involved in Membrane binding and targetting of GAG proteins |
| 2.1 | 31.8 | REACTOME APOPTOSIS INDUCED DNA FRAGMENTATION | Genes involved in Apoptosis induced DNA fragmentation |
| 2.1 | 59.1 | REACTOME KINESINS | Genes involved in Kinesins |
| 1.9 | 19.0 | REACTOME ELONGATION ARREST AND RECOVERY | Genes involved in Elongation arrest and recovery |
| 1.9 | 45.0 | REACTOME CYCLIN A B1 ASSOCIATED EVENTS DURING G2 M TRANSITION | Genes involved in Cyclin A/B1 associated events during G2/M transition |
| 1.8 | 22.8 | REACTOME METABOLISM OF POLYAMINES | Genes involved in Metabolism of polyamines |
| 1.6 | 4.9 | REACTOME HYALURONAN METABOLISM | Genes involved in Hyaluronan metabolism |
| 1.6 | 77.3 | REACTOME METABOLISM OF NON CODING RNA | Genes involved in Metabolism of non-coding RNA |
| 1.5 | 77.1 | REACTOME SMAD2 SMAD3 SMAD4 HETEROTRIMER REGULATES TRANSCRIPTION | Genes involved in SMAD2/SMAD3:SMAD4 heterotrimer regulates transcription |
| 1.5 | 128.9 | REACTOME RESPIRATORY ELECTRON TRANSPORT | Genes involved in Respiratory electron transport |
| 1.5 | 33.4 | REACTOME CYTOSOLIC SULFONATION OF SMALL MOLECULES | Genes involved in Cytosolic sulfonation of small molecules |
| 1.4 | 27.3 | REACTOME INTEGRATION OF PROVIRUS | Genes involved in Integration of provirus |
| 1.4 | 21.7 | REACTOME SYNTHESIS OF PIPS AT THE LATE ENDOSOME MEMBRANE | Genes involved in Synthesis of PIPs at the late endosome membrane |
| 1.3 | 24.1 | REACTOME THE NLRP3 INFLAMMASOME | Genes involved in The NLRP3 inflammasome |
| 1.3 | 34.4 | REACTOME RETROGRADE NEUROTROPHIN SIGNALLING | Genes involved in Retrograde neurotrophin signalling |
| 1.3 | 26.9 | REACTOME TETRAHYDROBIOPTERIN BH4 SYNTHESIS RECYCLING SALVAGE AND REGULATION | Genes involved in Tetrahydrobiopterin (BH4) synthesis, recycling, salvage and regulation |
| 1.3 | 39.5 | REACTOME SULFUR AMINO ACID METABOLISM | Genes involved in Sulfur amino acid metabolism |
| 1.2 | 38.7 | REACTOME PKA MEDIATED PHOSPHORYLATION OF CREB | Genes involved in PKA-mediated phosphorylation of CREB |
| 1.2 | 38.8 | REACTOME CELL EXTRACELLULAR MATRIX INTERACTIONS | Genes involved in Cell-extracellular matrix interactions |
| 1.2 | 22.1 | REACTOME MRNA DECAY BY 5 TO 3 EXORIBONUCLEASE | Genes involved in mRNA Decay by 5' to 3' Exoribonuclease |
| 1.2 | 176.8 | REACTOME INFLUENZA VIRAL RNA TRANSCRIPTION AND REPLICATION | Genes involved in Influenza Viral RNA Transcription and Replication |
| 1.1 | 39.1 | REACTOME NONSENSE MEDIATED DECAY ENHANCED BY THE EXON JUNCTION COMPLEX | Genes involved in Nonsense Mediated Decay Enhanced by the Exon Junction Complex |
| 1.1 | 20.4 | REACTOME TGF BETA RECEPTOR SIGNALING IN EMT EPITHELIAL TO MESENCHYMAL TRANSITION | Genes involved in TGF-beta receptor signaling in EMT (epithelial to mesenchymal transition) |
| 1.1 | 96.3 | REACTOME MITOTIC PROMETAPHASE | Genes involved in Mitotic Prometaphase |
| 1.1 | 26.7 | REACTOME SIGNALING BY HIPPO | Genes involved in Signaling by Hippo |
| 1.1 | 19.8 | REACTOME ZINC TRANSPORTERS | Genes involved in Zinc transporters |
| 1.1 | 17.1 | REACTOME SYNTHESIS OF SUBSTRATES IN N GLYCAN BIOSYTHESIS | Genes involved in Synthesis of substrates in N-glycan biosythesis |
| 1.0 | 67.6 | REACTOME ANTIVIRAL MECHANISM BY IFN STIMULATED GENES | Genes involved in Antiviral mechanism by IFN-stimulated genes |
| 1.0 | 11.5 | REACTOME MRNA DECAY BY 3 TO 5 EXORIBONUCLEASE | Genes involved in mRNA Decay by 3' to 5' Exoribonuclease |
| 1.0 | 16.2 | REACTOME REGULATION OF PYRUVATE DEHYDROGENASE PDH COMPLEX | Genes involved in Regulation of pyruvate dehydrogenase (PDH) complex |
| 0.9 | 20.2 | REACTOME INSULIN SYNTHESIS AND PROCESSING | Genes involved in Insulin Synthesis and Processing |
| 0.9 | 35.6 | REACTOME PYRIMIDINE METABOLISM | Genes involved in Pyrimidine metabolism |
| 0.9 | 14.6 | REACTOME AKT PHOSPHORYLATES TARGETS IN THE CYTOSOL | Genes involved in AKT phosphorylates targets in the cytosol |
| 0.8 | 21.8 | REACTOME ANTIGEN PRESENTATION FOLDING ASSEMBLY AND PEPTIDE LOADING OF CLASS I MHC | Genes involved in Antigen Presentation: Folding, assembly and peptide loading of class I MHC |
| 0.8 | 44.7 | REACTOME MITOCHONDRIAL PROTEIN IMPORT | Genes involved in Mitochondrial Protein Import |
| 0.8 | 12.9 | REACTOME GLUCOSE TRANSPORT | Genes involved in Glucose transport |
| 0.8 | 3.8 | REACTOME MTORC1 MEDIATED SIGNALLING | Genes involved in mTORC1-mediated signalling |
| 0.8 | 23.4 | REACTOME SYNTHESIS OF VERY LONG CHAIN FATTY ACYL COAS | Genes involved in Synthesis of very long-chain fatty acyl-CoAs |
| 0.7 | 8.2 | REACTOME G2 M CHECKPOINTS | Genes involved in G2/M Checkpoints |
| 0.7 | 22.2 | REACTOME POST TRANSLATIONAL MODIFICATION SYNTHESIS OF GPI ANCHORED PROTEINS | Genes involved in Post-translational modification: synthesis of GPI-anchored proteins |
| 0.7 | 11.7 | REACTOME DEADENYLATION DEPENDENT MRNA DECAY | Genes involved in Deadenylation-dependent mRNA decay |
| 0.7 | 10.7 | REACTOME NOTCH HLH TRANSCRIPTION PATHWAY | Genes involved in Notch-HLH transcription pathway |
| 0.7 | 100.8 | REACTOME MRNA PROCESSING | Genes involved in mRNA Processing |
| 0.7 | 6.4 | REACTOME ELEVATION OF CYTOSOLIC CA2 LEVELS | Genes involved in Elevation of cytosolic Ca2+ levels |
| 0.7 | 9.2 | REACTOME SIGNALING BY NOTCH2 | Genes involved in Signaling by NOTCH2 |
| 0.7 | 22.2 | REACTOME CD28 DEPENDENT PI3K AKT SIGNALING | Genes involved in CD28 dependent PI3K/Akt signaling |
| 0.7 | 11.0 | REACTOME CITRIC ACID CYCLE TCA CYCLE | Genes involved in Citric acid cycle (TCA cycle) |
| 0.7 | 8.2 | REACTOME INFLAMMASOMES | Genes involved in Inflammasomes |
| 0.7 | 7.2 | REACTOME COPI MEDIATED TRANSPORT | Genes involved in COPI Mediated Transport |
| 0.6 | 10.3 | REACTOME ADVANCED GLYCOSYLATION ENDPRODUCT RECEPTOR SIGNALING | Genes involved in Advanced glycosylation endproduct receptor signaling |
| 0.6 | 13.6 | REACTOME PROTEOLYTIC CLEAVAGE OF SNARE COMPLEX PROTEINS | Genes involved in Proteolytic cleavage of SNARE complex proteins |
| 0.6 | 3.6 | REACTOME THE ROLE OF NEF IN HIV1 REPLICATION AND DISEASE PATHOGENESIS | Genes involved in The role of Nef in HIV-1 replication and disease pathogenesis |
| 0.6 | 100.4 | REACTOME ANTIGEN PROCESSING UBIQUITINATION PROTEASOME DEGRADATION | Genes involved in Antigen processing: Ubiquitination & Proteasome degradation |
| 0.6 | 10.2 | REACTOME S PHASE | Genes involved in S Phase |
| 0.6 | 14.4 | REACTOME RECYCLING PATHWAY OF L1 | Genes involved in Recycling pathway of L1 |
| 0.6 | 4.8 | REACTOME PEPTIDE CHAIN ELONGATION | Genes involved in Peptide chain elongation |
| 0.6 | 10.0 | REACTOME NEF MEDIATES DOWN MODULATION OF CELL SURFACE RECEPTORS BY RECRUITING THEM TO CLATHRIN ADAPTERS | Genes involved in Nef-mediates down modulation of cell surface receptors by recruiting them to clathrin adapters |
| 0.6 | 28.1 | REACTOME GLYCOLYSIS | Genes involved in Glycolysis |
| 0.6 | 27.2 | REACTOME BMAL1 CLOCK NPAS2 ACTIVATES CIRCADIAN EXPRESSION | Genes involved in BMAL1:CLOCK/NPAS2 Activates Circadian Expression |
| 0.6 | 9.0 | REACTOME VITAMIN B5 PANTOTHENATE METABOLISM | Genes involved in Vitamin B5 (pantothenate) metabolism |
| 0.6 | 15.0 | REACTOME PREFOLDIN MEDIATED TRANSFER OF SUBSTRATE TO CCT TRIC | Genes involved in Prefoldin mediated transfer of substrate to CCT/TriC |
| 0.5 | 6.4 | REACTOME REGULATION OF KIT SIGNALING | Genes involved in Regulation of KIT signaling |
| 0.5 | 6.3 | REACTOME PROTEIN FOLDING | Genes involved in Protein folding |
| 0.5 | 7.9 | REACTOME REGULATION OF RHEB GTPASE ACTIVITY BY AMPK | Genes involved in Regulation of Rheb GTPase activity by AMPK |
| 0.5 | 18.1 | REACTOME INTRINSIC PATHWAY FOR APOPTOSIS | Genes involved in Intrinsic Pathway for Apoptosis |
| 0.5 | 11.3 | REACTOME FORMATION OF INCISION COMPLEX IN GG NER | Genes involved in Formation of incision complex in GG-NER |
| 0.5 | 10.2 | REACTOME DOUBLE STRAND BREAK REPAIR | Genes involved in Double-Strand Break Repair |
| 0.5 | 7.1 | REACTOME ALPHA LINOLENIC ACID ALA METABOLISM | Genes involved in alpha-linolenic acid (ALA) metabolism |
| 0.5 | 35.7 | REACTOME TRANSLATION | Genes involved in Translation |
| 0.5 | 5.3 | REACTOME CREATION OF C4 AND C2 ACTIVATORS | Genes involved in Creation of C4 and C2 activators |
| 0.5 | 10.8 | REACTOME ACTIVATION OF RAC | Genes involved in Activation of Rac |
| 0.5 | 8.0 | REACTOME VEGF LIGAND RECEPTOR INTERACTIONS | Genes involved in VEGF ligand-receptor interactions |
| 0.5 | 12.9 | REACTOME SIGNAL REGULATORY PROTEIN SIRP FAMILY INTERACTIONS | Genes involved in Signal regulatory protein (SIRP) family interactions |
| 0.5 | 6.9 | REACTOME ACTIVATION OF IRF3 IRF7 MEDIATED BY TBK1 IKK EPSILON | Genes involved in Activation of IRF3/IRF7 mediated by TBK1/IKK epsilon |
| 0.4 | 10.2 | REACTOME SIGNALING BY FGFR1 FUSION MUTANTS | Genes involved in Signaling by FGFR1 fusion mutants |
| 0.4 | 6.5 | REACTOME ENDOSOMAL SORTING COMPLEX REQUIRED FOR TRANSPORT ESCRT | Genes involved in Endosomal Sorting Complex Required For Transport (ESCRT) |
| 0.4 | 16.0 | REACTOME DEGRADATION OF THE EXTRACELLULAR MATRIX | Genes involved in Degradation of the extracellular matrix |
| 0.4 | 3.1 | REACTOME GLYCOPROTEIN HORMONES | Genes involved in Glycoprotein hormones |
| 0.4 | 22.2 | REACTOME NRAGE SIGNALS DEATH THROUGH JNK | Genes involved in NRAGE signals death through JNK |
| 0.4 | 12.1 | REACTOME SYNTHESIS AND INTERCONVERSION OF NUCLEOTIDE DI AND TRIPHOSPHATES | Genes involved in Synthesis and interconversion of nucleotide di- and triphosphates |
| 0.4 | 9.1 | REACTOME GLUCURONIDATION | Genes involved in Glucuronidation |
| 0.4 | 10.2 | REACTOME IONOTROPIC ACTIVITY OF KAINATE RECEPTORS | Genes involved in Ionotropic activity of Kainate Receptors |
| 0.4 | 5.0 | REACTOME HORMONE LIGAND BINDING RECEPTORS | Genes involved in Hormone ligand-binding receptors |
| 0.3 | 8.4 | REACTOME SIGNAL TRANSDUCTION BY L1 | Genes involved in Signal transduction by L1 |
| 0.3 | 8.8 | REACTOME BRANCHED CHAIN AMINO ACID CATABOLISM | Genes involved in Branched-chain amino acid catabolism |
| 0.3 | 7.9 | REACTOME ADP SIGNALLING THROUGH P2RY12 | Genes involved in ADP signalling through P2Y purinoceptor 12 |
| 0.3 | 9.3 | REACTOME CHONDROITIN SULFATE BIOSYNTHESIS | Genes involved in Chondroitin sulfate biosynthesis |
| 0.3 | 4.9 | REACTOME PROLACTIN RECEPTOR SIGNALING | Genes involved in Prolactin receptor signaling |
| 0.3 | 3.1 | REACTOME REGULATION OF IFNG SIGNALING | Genes involved in Regulation of IFNG signaling |
| 0.3 | 12.4 | REACTOME GLYCOSPHINGOLIPID METABOLISM | Genes involved in Glycosphingolipid metabolism |
| 0.2 | 2.0 | REACTOME ACTIVATED NOTCH1 TRANSMITS SIGNAL TO THE NUCLEUS | Genes involved in Activated NOTCH1 Transmits Signal to the Nucleus |
| 0.2 | 16.2 | REACTOME TRANS GOLGI NETWORK VESICLE BUDDING | Genes involved in trans-Golgi Network Vesicle Budding |
| 0.2 | 6.6 | REACTOME SPHINGOLIPID DE NOVO BIOSYNTHESIS | Genes involved in Sphingolipid de novo biosynthesis |
| 0.2 | 3.5 | REACTOME BILE SALT AND ORGANIC ANION SLC TRANSPORTERS | Genes involved in Bile salt and organic anion SLC transporters |
| 0.2 | 5.2 | REACTOME CREB PHOSPHORYLATION THROUGH THE ACTIVATION OF CAMKII | Genes involved in CREB phosphorylation through the activation of CaMKII |
| 0.2 | 3.0 | REACTOME RNA POL I TRANSCRIPTION TERMINATION | Genes involved in RNA Polymerase I Transcription Termination |
| 0.2 | 2.9 | REACTOME GAMMA CARBOXYLATION TRANSPORT AND AMINO TERMINAL CLEAVAGE OF PROTEINS | Genes involved in Gamma-carboxylation, transport, and amino-terminal cleavage of proteins |
| 0.2 | 3.7 | REACTOME NETRIN1 SIGNALING | Genes involved in Netrin-1 signaling |
| 0.2 | 4.3 | REACTOME ABCA TRANSPORTERS IN LIPID HOMEOSTASIS | Genes involved in ABCA transporters in lipid homeostasis |
| 0.2 | 5.5 | REACTOME METABOLISM OF PORPHYRINS | Genes involved in Metabolism of porphyrins |
| 0.2 | 6.0 | REACTOME TRIGLYCERIDE BIOSYNTHESIS | Genes involved in Triglyceride Biosynthesis |
| 0.2 | 4.1 | REACTOME REGULATION OF COMPLEMENT CASCADE | Genes involved in Regulation of Complement cascade |
| 0.2 | 7.8 | REACTOME PHASE II CONJUGATION | Genes involved in Phase II conjugation |
| 0.2 | 4.4 | REACTOME NUCLEAR EVENTS KINASE AND TRANSCRIPTION FACTOR ACTIVATION | Genes involved in Nuclear Events (kinase and transcription factor activation) |
| 0.2 | 8.9 | REACTOME MYOGENESIS | Genes involved in Myogenesis |
| 0.1 | 0.6 | REACTOME COMMON PATHWAY | Genes involved in Common Pathway |
| 0.1 | 2.6 | REACTOME NEGATIVE REGULATORS OF RIG I MDA5 SIGNALING | Genes involved in Negative regulators of RIG-I/MDA5 signaling |
| 0.1 | 2.6 | REACTOME CRMPS IN SEMA3A SIGNALING | Genes involved in CRMPs in Sema3A signaling |
| 0.1 | 4.8 | REACTOME AQUAPORIN MEDIATED TRANSPORT | Genes involved in Aquaporin-mediated transport |
| 0.1 | 5.2 | REACTOME RNA POL III TRANSCRIPTION | Genes involved in RNA Polymerase III Transcription |
| 0.1 | 2.5 | REACTOME INTRINSIC PATHWAY | Genes involved in Intrinsic Pathway |
| 0.1 | 2.2 | REACTOME GAP JUNCTION ASSEMBLY | Genes involved in Gap junction assembly |
| 0.1 | 7.3 | REACTOME MHC CLASS II ANTIGEN PRESENTATION | Genes involved in MHC class II antigen presentation |
| 0.1 | 1.5 | REACTOME DCC MEDIATED ATTRACTIVE SIGNALING | Genes involved in DCC mediated attractive signaling |
| 0.1 | 5.0 | REACTOME SMOOTH MUSCLE CONTRACTION | Genes involved in Smooth Muscle Contraction |
| 0.1 | 0.6 | REACTOME SIGNALING BY SCF KIT | Genes involved in Signaling by SCF-KIT |
| 0.1 | 0.9 | REACTOME N GLYCAN TRIMMING IN THE ER AND CALNEXIN CALRETICULIN CYCLE | Genes involved in N-glycan trimming in the ER and Calnexin/Calreticulin cycle |
| 0.1 | 3.4 | REACTOME INTERFERON GAMMA SIGNALING | Genes involved in Interferon gamma signaling |
| 0.1 | 1.7 | REACTOME SYNTHESIS OF PC | Genes involved in Synthesis of PC |
| 0.1 | 2.1 | REACTOME IRON UPTAKE AND TRANSPORT | Genes involved in Iron uptake and transport |
| 0.0 | 0.4 | REACTOME GAP JUNCTION DEGRADATION | Genes involved in Gap junction degradation |
| 0.0 | 1.8 | REACTOME TRANSPORT TO THE GOLGI AND SUBSEQUENT MODIFICATION | Genes involved in Transport to the Golgi and subsequent modification |
| 0.0 | 0.4 | REACTOME ANTIGEN ACTIVATES B CELL RECEPTOR LEADING TO GENERATION OF SECOND MESSENGERS | Genes involved in Antigen Activates B Cell Receptor Leading to Generation of Second Messengers |
| 0.0 | 0.3 | REACTOME PLATELET CALCIUM HOMEOSTASIS | Genes involved in Platelet calcium homeostasis |
| 0.0 | 1.5 | REACTOME INTEGRIN CELL SURFACE INTERACTIONS | Genes involved in Integrin cell surface interactions |
| 0.0 | 0.3 | REACTOME A TETRASACCHARIDE LINKER SEQUENCE IS REQUIRED FOR GAG SYNTHESIS | Genes involved in A tetrasaccharide linker sequence is required for GAG synthesis |