Project
GNF SymAtlas + NCI-60 cancer cell lines, human (Su, 2004; Ross, 2000)
Navigation
Downloads
Results for CREB5_CREM_JUNB
Z-value: 1.40
Motif logo
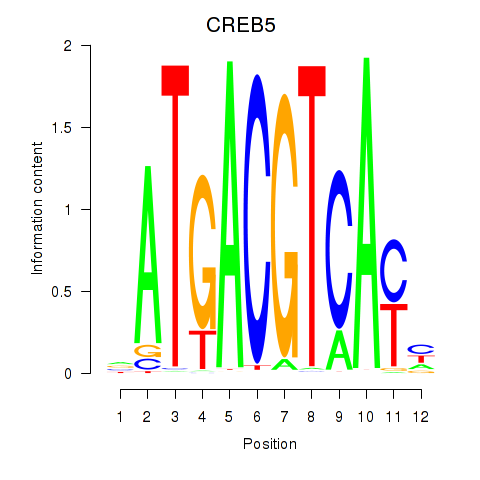
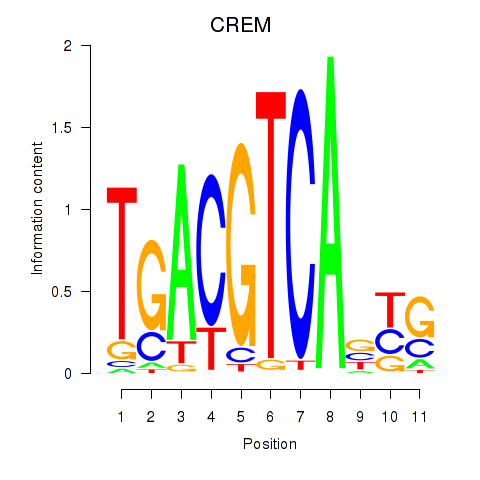
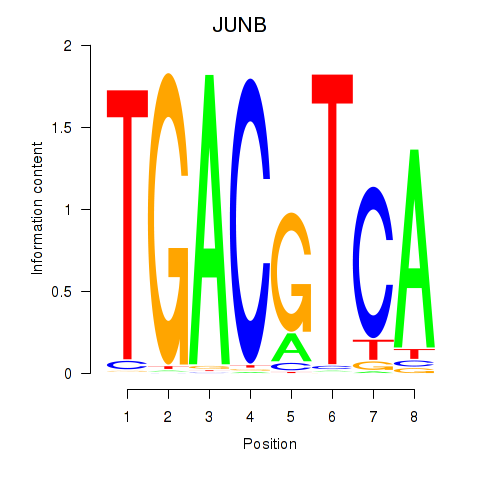
Transcription factors associated with CREB5_CREM_JUNB
| Gene Symbol | Gene ID | Gene Info |
|---|---|---|
|
CREB5
|
ENSG00000146592.17 | CREB5 |
|
CREM
|
ENSG00000095794.19 | CREM |
|
JUNB
|
ENSG00000171223.6 | JUNB |
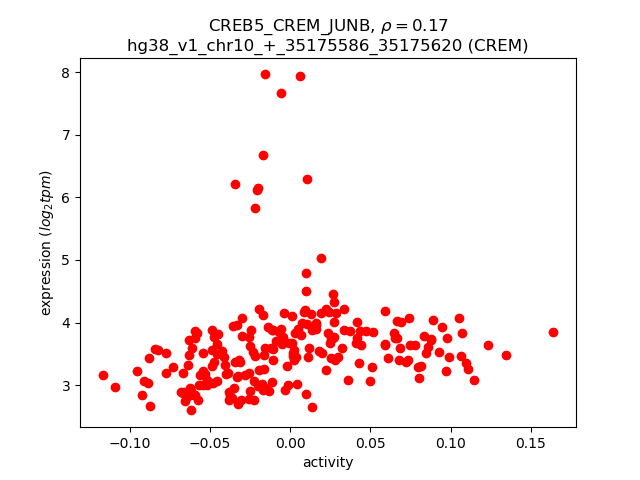
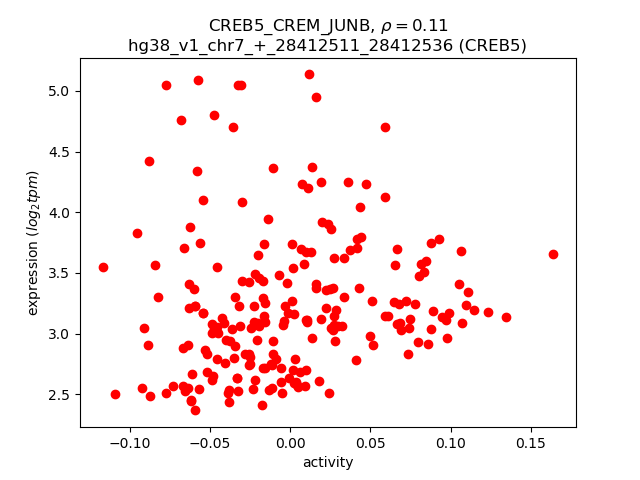
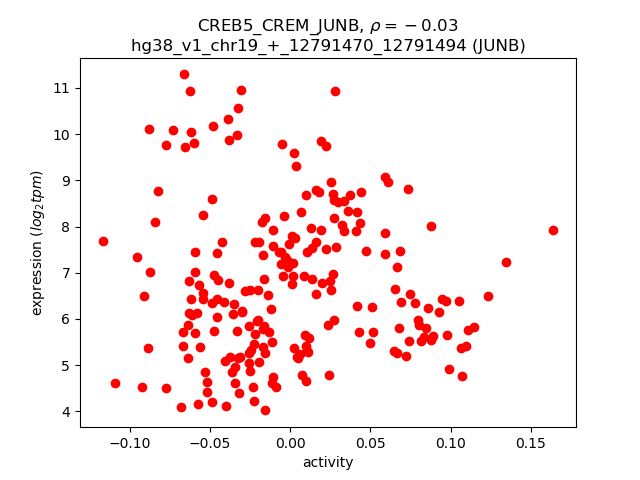
Activity-expression correlation:
| Gene | Promoter | Pearson corr. coef. | P-value | Plot |
|---|---|---|---|---|
| CREM | hg38_v1_chr10_+_35175586_35175620 | 0.17 | 1.1e-02 | Click! |
| CREB5 | hg38_v1_chr7_+_28412511_28412536, hg38_v1_chr7_+_28685968_28685991 | 0.11 | 9.5e-02 | Click! |
| JUNB | hg38_v1_chr19_+_12791470_12791494 | -0.03 | 6.7e-01 | Click! |
Activity profile of CREB5_CREM_JUNB motif
Sorted Z-values of CREB5_CREM_JUNB motif
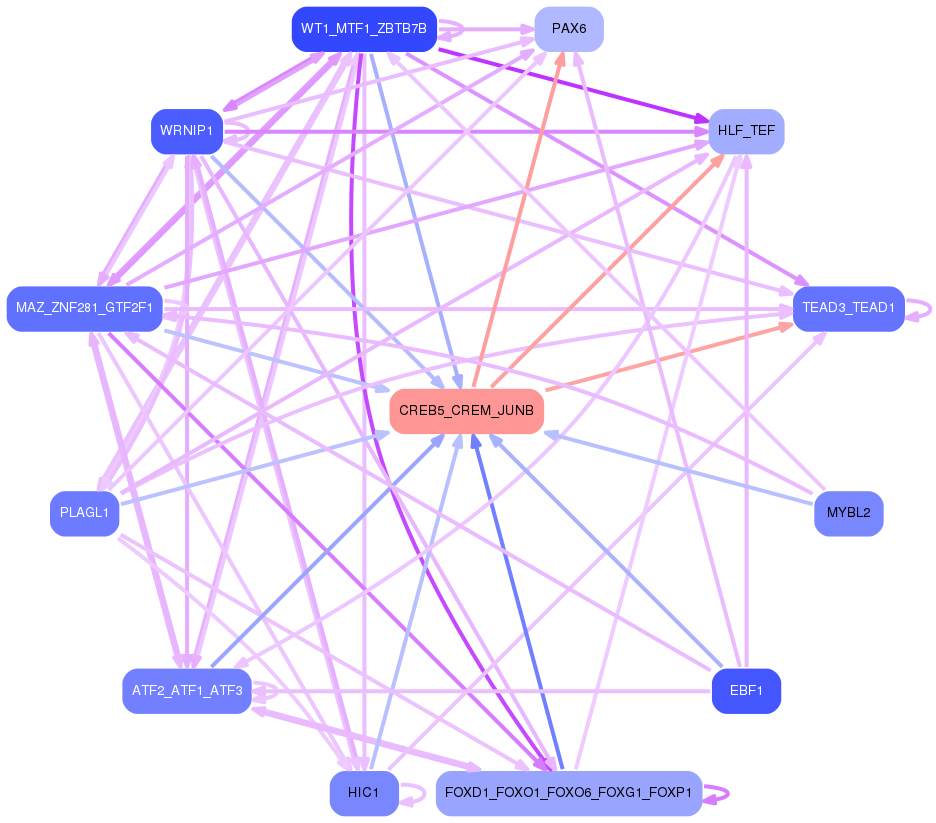
Network of associatons between targets according to the STRING database.

First level regulatory network of CREB5_CREM_JUNB
Gene Ontology Analysis
Gene overrepresentation in biological process category:
| Log-likelihood per target | Total log-likelihood | Term | Description |
|---|---|---|---|
| 10.9 | 130.7 | GO:0051611 | negative regulation of neurotransmitter uptake(GO:0051581) regulation of serotonin uptake(GO:0051611) negative regulation of serotonin uptake(GO:0051612) |
| 9.1 | 54.4 | GO:0030644 | cellular chloride ion homeostasis(GO:0030644) |
| 7.7 | 23.1 | GO:1901899 | positive regulation of relaxation of cardiac muscle(GO:1901899) |
| 7.4 | 22.2 | GO:1904692 | positive regulation of type B pancreatic cell proliferation(GO:1904692) |
| 7.1 | 35.6 | GO:0099590 | neurotransmitter receptor internalization(GO:0099590) |
| 6.3 | 38.0 | GO:1903690 | negative regulation of wound healing, spreading of epidermal cells(GO:1903690) |
| 5.5 | 27.6 | GO:0008628 | hormone-mediated apoptotic signaling pathway(GO:0008628) |
| 4.9 | 14.7 | GO:0052047 | interaction with other organism via secreted substance involved in symbiotic interaction(GO:0052047) |
| 4.6 | 23.2 | GO:0030070 | insulin processing(GO:0030070) |
| 4.2 | 33.4 | GO:0060373 | regulation of ventricular cardiac muscle cell membrane depolarization(GO:0060373) |
| 4.1 | 12.2 | GO:0046066 | dGDP metabolic process(GO:0046066) |
| 3.6 | 21.9 | GO:0035617 | stress granule disassembly(GO:0035617) |
| 3.6 | 10.9 | GO:1903644 | regulation of chaperone-mediated protein folding(GO:1903644) |
| 3.6 | 21.6 | GO:0038016 | insulin receptor internalization(GO:0038016) |
| 3.5 | 10.6 | GO:2000832 | negative regulation of steroid hormone secretion(GO:2000832) negative regulation of corticosteroid hormone secretion(GO:2000847) negative regulation of glucocorticoid secretion(GO:2000850) |
| 3.3 | 29.4 | GO:0002175 | protein localization to paranode region of axon(GO:0002175) |
| 3.1 | 9.3 | GO:0070317 | negative regulation of G0 to G1 transition(GO:0070317) |
| 3.0 | 12.0 | GO:0006669 | sphinganine-1-phosphate biosynthetic process(GO:0006669) |
| 2.9 | 34.5 | GO:0008090 | retrograde axonal transport(GO:0008090) |
| 2.8 | 19.9 | GO:2000324 | positive regulation of glucocorticoid receptor signaling pathway(GO:2000324) |
| 2.7 | 5.5 | GO:2000118 | regulation of sodium-dependent phosphate transport(GO:2000118) |
| 2.7 | 27.2 | GO:0036309 | protein localization to M-band(GO:0036309) protein localization to T-tubule(GO:0036371) |
| 2.6 | 23.2 | GO:0003190 | atrioventricular valve formation(GO:0003190) |
| 2.6 | 20.5 | GO:1902474 | positive regulation of protein localization to synapse(GO:1902474) |
| 2.5 | 34.5 | GO:0048245 | eosinophil chemotaxis(GO:0048245) |
| 2.4 | 16.8 | GO:0033353 | S-adenosylmethionine cycle(GO:0033353) |
| 2.4 | 7.1 | GO:0097156 | fasciculation of motor neuron axon(GO:0097156) |
| 2.4 | 73.6 | GO:0034035 | purine ribonucleoside bisphosphate metabolic process(GO:0034035) 3'-phosphoadenosine 5'-phosphosulfate metabolic process(GO:0050427) |
| 2.3 | 40.8 | GO:0097091 | synaptic vesicle clustering(GO:0097091) |
| 2.2 | 46.7 | GO:0042921 | glucocorticoid receptor signaling pathway(GO:0042921) |
| 2.1 | 21.4 | GO:0007042 | lysosomal lumen acidification(GO:0007042) |
| 2.1 | 6.4 | GO:0021897 | forebrain astrocyte differentiation(GO:0021896) forebrain astrocyte development(GO:0021897) |
| 2.1 | 31.8 | GO:0007258 | JUN phosphorylation(GO:0007258) |
| 2.1 | 18.8 | GO:2000286 | receptor internalization involved in canonical Wnt signaling pathway(GO:2000286) |
| 2.1 | 6.2 | GO:1902498 | regulation of protein autoubiquitination(GO:1902498) |
| 2.0 | 8.1 | GO:0031161 | phosphatidylinositol catabolic process(GO:0031161) |
| 1.9 | 33.1 | GO:0003322 | pancreatic A cell development(GO:0003322) |
| 1.9 | 5.6 | GO:1901877 | regulation of calcium ion binding(GO:1901876) negative regulation of calcium ion binding(GO:1901877) |
| 1.8 | 7.4 | GO:0070426 | positive regulation of nucleotide-binding oligomerization domain containing signaling pathway(GO:0070426) positive regulation of nucleotide-binding oligomerization domain containing 2 signaling pathway(GO:0070434) |
| 1.8 | 5.5 | GO:0061034 | olfactory bulb mitral cell layer development(GO:0061034) |
| 1.8 | 74.9 | GO:0007019 | microtubule depolymerization(GO:0007019) |
| 1.8 | 21.0 | GO:0031284 | positive regulation of guanylate cyclase activity(GO:0031284) |
| 1.7 | 22.2 | GO:0043983 | histone H4-K12 acetylation(GO:0043983) |
| 1.7 | 13.7 | GO:0042118 | endothelial cell activation(GO:0042118) |
| 1.7 | 3.4 | GO:0021780 | spinal cord oligodendrocyte cell differentiation(GO:0021529) spinal cord oligodendrocyte cell fate specification(GO:0021530) oligodendrocyte cell fate specification(GO:0021778) oligodendrocyte cell fate commitment(GO:0021779) glial cell fate specification(GO:0021780) |
| 1.7 | 15.1 | GO:0070475 | rRNA base methylation(GO:0070475) |
| 1.6 | 13.2 | GO:0035694 | mitochondrial protein catabolic process(GO:0035694) |
| 1.6 | 8.2 | GO:0051835 | positive regulation of synapse structural plasticity(GO:0051835) |
| 1.6 | 4.9 | GO:1990637 | response to prolactin(GO:1990637) |
| 1.6 | 8.2 | GO:0090394 | negative regulation of excitatory postsynaptic potential(GO:0090394) |
| 1.6 | 9.8 | GO:0051414 | response to cortisol(GO:0051414) |
| 1.6 | 21.0 | GO:0046325 | negative regulation of glucose import(GO:0046325) |
| 1.6 | 16.1 | GO:2000348 | regulation of CD40 signaling pathway(GO:2000348) |
| 1.6 | 7.9 | GO:1901350 | cell-cell signaling involved in cell-cell junction organization(GO:1901350) |
| 1.5 | 4.6 | GO:0001983 | regulation of systemic arterial blood pressure by carotid sinus baroreceptor feedback(GO:0001978) baroreceptor response to increased systemic arterial blood pressure(GO:0001983) |
| 1.5 | 58.0 | GO:0008045 | motor neuron axon guidance(GO:0008045) |
| 1.5 | 12.2 | GO:0007185 | transmembrane receptor protein tyrosine phosphatase signaling pathway(GO:0007185) |
| 1.5 | 22.8 | GO:0006995 | cellular response to nitrogen starvation(GO:0006995) cellular response to nitrogen levels(GO:0043562) |
| 1.4 | 4.3 | GO:1903538 | meiotic spindle elongation(GO:0051232) meiotic cell cycle process involved in oocyte maturation(GO:1903537) regulation of meiotic cell cycle process involved in oocyte maturation(GO:1903538) |
| 1.4 | 5.6 | GO:0031548 | regulation of brain-derived neurotrophic factor receptor signaling pathway(GO:0031548) |
| 1.4 | 13.9 | GO:0031274 | positive regulation of pseudopodium assembly(GO:0031274) |
| 1.3 | 5.4 | GO:0002879 | positive regulation of acute inflammatory response to non-antigenic stimulus(GO:0002879) |
| 1.3 | 16.1 | GO:1990416 | cellular response to brain-derived neurotrophic factor stimulus(GO:1990416) |
| 1.3 | 6.7 | GO:0060385 | axonogenesis involved in innervation(GO:0060385) |
| 1.3 | 3.9 | GO:0021538 | epithalamus development(GO:0021538) habenula development(GO:0021986) |
| 1.3 | 10.2 | GO:0061709 | reticulophagy(GO:0061709) |
| 1.3 | 3.8 | GO:0021764 | amygdala development(GO:0021764) regulation of timing of neuron differentiation(GO:0060164) |
| 1.2 | 27.4 | GO:0071850 | mitotic cell cycle arrest(GO:0071850) |
| 1.2 | 34.3 | GO:0032012 | regulation of ARF protein signal transduction(GO:0032012) |
| 1.2 | 8.4 | GO:0006655 | phosphatidylglycerol biosynthetic process(GO:0006655) |
| 1.2 | 10.8 | GO:0045054 | constitutive secretory pathway(GO:0045054) |
| 1.2 | 4.6 | GO:0043314 | negative regulation of neutrophil degranulation(GO:0043314) |
| 1.1 | 17.2 | GO:0046855 | phosphorylated carbohydrate dephosphorylation(GO:0046838) inositol phosphate dephosphorylation(GO:0046855) |
| 1.1 | 29.8 | GO:0002091 | negative regulation of receptor internalization(GO:0002091) |
| 1.1 | 9.1 | GO:0006384 | transcription initiation from RNA polymerase III promoter(GO:0006384) |
| 1.1 | 3.4 | GO:0019287 | isopentenyl diphosphate biosynthetic process, mevalonate pathway(GO:0019287) |
| 1.1 | 3.4 | GO:0048388 | endosomal lumen acidification(GO:0048388) |
| 1.1 | 1.1 | GO:0070093 | negative regulation of glucagon secretion(GO:0070093) |
| 1.1 | 4.3 | GO:0038098 | sequestering of BMP from receptor via BMP binding(GO:0038098) |
| 1.1 | 5.3 | GO:0046167 | glycerol-3-phosphate biosynthetic process(GO:0046167) |
| 1.1 | 5.3 | GO:2001295 | malonyl-CoA biosynthetic process(GO:2001295) |
| 1.0 | 12.6 | GO:0003406 | retinal pigment epithelium development(GO:0003406) |
| 1.0 | 8.2 | GO:0070164 | negative regulation of adiponectin secretion(GO:0070164) |
| 1.0 | 50.0 | GO:0070884 | regulation of calcineurin-NFAT signaling cascade(GO:0070884) |
| 1.0 | 17.0 | GO:0031163 | iron-sulfur cluster assembly(GO:0016226) metallo-sulfur cluster assembly(GO:0031163) |
| 1.0 | 31.6 | GO:0046839 | phospholipid dephosphorylation(GO:0046839) |
| 1.0 | 3.9 | GO:0007206 | phospholipase C-activating G-protein coupled glutamate receptor signaling pathway(GO:0007206) |
| 1.0 | 2.9 | GO:0051877 | pigment granule aggregation in cell center(GO:0051877) |
| 1.0 | 2.9 | GO:0035574 | histone H4-K20 demethylation(GO:0035574) |
| 1.0 | 19.1 | GO:0034389 | lipid particle organization(GO:0034389) |
| 0.9 | 7.4 | GO:2000253 | positive regulation of feeding behavior(GO:2000253) |
| 0.9 | 12.9 | GO:0061162 | establishment of monopolar cell polarity(GO:0061162) establishment or maintenance of monopolar cell polarity(GO:0061339) |
| 0.9 | 14.7 | GO:0045793 | positive regulation of cell size(GO:0045793) |
| 0.9 | 15.5 | GO:0007021 | tubulin complex assembly(GO:0007021) |
| 0.9 | 2.7 | GO:0002949 | tRNA threonylcarbamoyladenosine modification(GO:0002949) |
| 0.9 | 5.4 | GO:0097052 | L-kynurenine metabolic process(GO:0097052) |
| 0.9 | 3.5 | GO:0031179 | peptide amidation(GO:0001519) protein amidation(GO:0018032) peptide modification(GO:0031179) |
| 0.9 | 29.2 | GO:0045956 | positive regulation of calcium ion-dependent exocytosis(GO:0045956) |
| 0.9 | 35.4 | GO:0061003 | positive regulation of dendritic spine morphogenesis(GO:0061003) |
| 0.8 | 2.5 | GO:0010966 | regulation of phosphate transport(GO:0010966) |
| 0.8 | 5.8 | GO:0001661 | conditioned taste aversion(GO:0001661) |
| 0.8 | 7.1 | GO:0031642 | negative regulation of myelination(GO:0031642) |
| 0.8 | 7.7 | GO:0051964 | negative regulation of synapse assembly(GO:0051964) |
| 0.8 | 9.3 | GO:0042420 | dopamine catabolic process(GO:0042420) |
| 0.8 | 6.9 | GO:0009407 | toxin catabolic process(GO:0009407) secondary metabolite catabolic process(GO:0090487) |
| 0.8 | 55.2 | GO:0007212 | dopamine receptor signaling pathway(GO:0007212) |
| 0.8 | 4.6 | GO:1902412 | regulation of mitotic cytokinesis(GO:1902412) |
| 0.7 | 3.0 | GO:0070836 | caveola assembly(GO:0070836) |
| 0.7 | 11.2 | GO:0070779 | D-aspartate transport(GO:0070777) D-aspartate import(GO:0070779) |
| 0.7 | 3.7 | GO:0051418 | interphase microtubule nucleation by interphase microtubule organizing center(GO:0051415) microtubule nucleation by microtubule organizing center(GO:0051418) |
| 0.7 | 8.7 | GO:0000050 | urea cycle(GO:0000050) |
| 0.7 | 5.1 | GO:1904879 | positive regulation of calcium ion transmembrane transport via high voltage-gated calcium channel(GO:1904879) |
| 0.7 | 5.1 | GO:0036123 | histone H3-K9 dimethylation(GO:0036123) |
| 0.7 | 1.4 | GO:0046601 | positive regulation of centriole replication(GO:0046601) |
| 0.7 | 8.5 | GO:0048172 | regulation of short-term neuronal synaptic plasticity(GO:0048172) |
| 0.7 | 6.2 | GO:0061042 | vascular wound healing(GO:0061042) |
| 0.7 | 6.9 | GO:0070166 | enamel mineralization(GO:0070166) |
| 0.7 | 2.7 | GO:1900738 | positive regulation of phospholipase C-activating G-protein coupled receptor signaling pathway(GO:1900738) |
| 0.7 | 2.0 | GO:0030200 | heparan sulfate proteoglycan catabolic process(GO:0030200) |
| 0.7 | 2.7 | GO:1903527 | positive regulation of membrane tubulation(GO:1903527) |
| 0.7 | 6.0 | GO:0010265 | SCF complex assembly(GO:0010265) |
| 0.7 | 10.5 | GO:2000480 | negative regulation of cAMP-dependent protein kinase activity(GO:2000480) |
| 0.7 | 11.2 | GO:0019800 | peptide cross-linking via chondroitin 4-sulfate glycosaminoglycan(GO:0019800) |
| 0.6 | 3.2 | GO:1904781 | positive regulation of protein localization to centrosome(GO:1904781) |
| 0.6 | 8.9 | GO:0043162 | ubiquitin-dependent protein catabolic process via the multivesicular body sorting pathway(GO:0043162) |
| 0.6 | 3.2 | GO:0061052 | negative regulation of cell growth involved in cardiac muscle cell development(GO:0061052) |
| 0.6 | 1.3 | GO:0035751 | regulation of lysosomal lumen pH(GO:0035751) |
| 0.6 | 6.2 | GO:1903546 | protein localization to photoreceptor outer segment(GO:1903546) |
| 0.6 | 3.1 | GO:0045829 | negative regulation of isotype switching(GO:0045829) |
| 0.6 | 3.7 | GO:0018343 | protein farnesylation(GO:0018343) |
| 0.6 | 21.0 | GO:0021542 | dentate gyrus development(GO:0021542) |
| 0.6 | 3.0 | GO:0042796 | snRNA transcription from RNA polymerase III promoter(GO:0042796) |
| 0.6 | 5.0 | GO:0032790 | ribosome disassembly(GO:0032790) |
| 0.5 | 6.6 | GO:0034472 | snRNA 3'-end processing(GO:0034472) |
| 0.5 | 1.6 | GO:0034499 | late endosome to Golgi transport(GO:0034499) |
| 0.5 | 9.7 | GO:0010510 | regulation of acetyl-CoA biosynthetic process from pyruvate(GO:0010510) regulation of acyl-CoA biosynthetic process(GO:0050812) |
| 0.5 | 1.1 | GO:0033686 | positive regulation of luteinizing hormone secretion(GO:0033686) |
| 0.5 | 6.4 | GO:0008298 | intracellular mRNA localization(GO:0008298) |
| 0.5 | 2.1 | GO:0061000 | negative regulation of dendritic spine development(GO:0061000) |
| 0.5 | 15.1 | GO:0014887 | muscle hypertrophy in response to stress(GO:0003299) cardiac muscle adaptation(GO:0014887) cardiac muscle hypertrophy in response to stress(GO:0014898) |
| 0.5 | 6.2 | GO:1901898 | negative regulation of relaxation of cardiac muscle(GO:1901898) |
| 0.5 | 3.0 | GO:0060370 | susceptibility to T cell mediated cytotoxicity(GO:0060370) |
| 0.5 | 1.5 | GO:0072385 | minus-end-directed organelle transport along microtubule(GO:0072385) |
| 0.5 | 19.8 | GO:0021952 | central nervous system projection neuron axonogenesis(GO:0021952) |
| 0.5 | 5.5 | GO:0098789 | pre-mRNA cleavage required for polyadenylation(GO:0098789) |
| 0.5 | 12.3 | GO:0034776 | response to histamine(GO:0034776) cellular response to histamine(GO:0071420) |
| 0.5 | 3.9 | GO:0072600 | establishment of protein localization to Golgi(GO:0072600) |
| 0.5 | 5.8 | GO:2001224 | cellular response to electrical stimulus(GO:0071257) positive regulation of neuron migration(GO:2001224) |
| 0.5 | 0.5 | GO:1903774 | regulation of viral budding via host ESCRT complex(GO:1903772) positive regulation of viral budding via host ESCRT complex(GO:1903774) |
| 0.5 | 5.3 | GO:1902894 | negative regulation of pri-miRNA transcription from RNA polymerase II promoter(GO:1902894) |
| 0.5 | 1.9 | GO:0001555 | oocyte growth(GO:0001555) |
| 0.5 | 1.8 | GO:1902219 | negative regulation of intrinsic apoptotic signaling pathway in response to osmotic stress(GO:1902219) |
| 0.5 | 1.8 | GO:1900042 | positive regulation of interleukin-2 secretion(GO:1900042) |
| 0.4 | 5.8 | GO:0045475 | locomotor rhythm(GO:0045475) |
| 0.4 | 1.3 | GO:0070121 | pronephric nephron morphogenesis(GO:0039007) pronephric nephron tubule morphogenesis(GO:0039008) pronephric duct development(GO:0039022) pronephric duct morphogenesis(GO:0039023) Kupffer's vesicle development(GO:0070121) |
| 0.4 | 3.5 | GO:0035754 | B cell chemotaxis(GO:0035754) |
| 0.4 | 11.4 | GO:0030206 | chondroitin sulfate biosynthetic process(GO:0030206) |
| 0.4 | 4.4 | GO:0001553 | luteinization(GO:0001553) |
| 0.4 | 2.6 | GO:0051012 | microtubule sliding(GO:0051012) |
| 0.4 | 19.9 | GO:0006198 | cAMP catabolic process(GO:0006198) |
| 0.4 | 7.0 | GO:0071168 | protein localization to chromatin(GO:0071168) |
| 0.4 | 0.8 | GO:0048073 | regulation of eye pigmentation(GO:0048073) |
| 0.4 | 2.0 | GO:2001013 | epithelial cell proliferation involved in renal tubule morphogenesis(GO:2001013) |
| 0.4 | 3.2 | GO:0045586 | regulation of gamma-delta T cell differentiation(GO:0045586) |
| 0.4 | 1.1 | GO:0070940 | dephosphorylation of RNA polymerase II C-terminal domain(GO:0070940) |
| 0.4 | 1.1 | GO:1903347 | negative regulation of myosin-light-chain-phosphatase activity(GO:0035509) negative regulation of bicellular tight junction assembly(GO:1903347) |
| 0.4 | 3.0 | GO:0048014 | Tie signaling pathway(GO:0048014) |
| 0.4 | 7.8 | GO:0032515 | negative regulation of phosphoprotein phosphatase activity(GO:0032515) |
| 0.4 | 2.6 | GO:0007000 | nucleolus organization(GO:0007000) |
| 0.4 | 2.9 | GO:2001256 | regulation of store-operated calcium entry(GO:2001256) |
| 0.4 | 4.3 | GO:0030854 | positive regulation of granulocyte differentiation(GO:0030854) |
| 0.4 | 5.0 | GO:0021895 | cerebral cortex neuron differentiation(GO:0021895) |
| 0.4 | 6.7 | GO:0030949 | positive regulation of vascular endothelial growth factor receptor signaling pathway(GO:0030949) |
| 0.3 | 6.2 | GO:0032703 | negative regulation of interleukin-2 production(GO:0032703) |
| 0.3 | 14.0 | GO:0035329 | hippo signaling(GO:0035329) |
| 0.3 | 18.1 | GO:0006891 | intra-Golgi vesicle-mediated transport(GO:0006891) |
| 0.3 | 9.8 | GO:0031639 | plasminogen activation(GO:0031639) |
| 0.3 | 0.7 | GO:0090038 | negative regulation of protein kinase C signaling(GO:0090038) |
| 0.3 | 0.3 | GO:0010840 | regulation of circadian sleep/wake cycle, wakefulness(GO:0010840) circadian sleep/wake cycle, wakefulness(GO:0042746) |
| 0.3 | 2.0 | GO:0007341 | penetration of zona pellucida(GO:0007341) |
| 0.3 | 8.5 | GO:0060856 | establishment of blood-brain barrier(GO:0060856) |
| 0.3 | 1.0 | GO:1901842 | negative regulation of high voltage-gated calcium channel activity(GO:1901842) |
| 0.3 | 3.8 | GO:0015871 | choline transport(GO:0015871) |
| 0.3 | 1.9 | GO:0015793 | glycerol transport(GO:0015793) |
| 0.3 | 11.1 | GO:0048168 | regulation of neuronal synaptic plasticity(GO:0048168) |
| 0.3 | 6.2 | GO:0030517 | negative regulation of axon extension(GO:0030517) |
| 0.3 | 2.8 | GO:0048672 | positive regulation of collateral sprouting(GO:0048672) |
| 0.3 | 1.2 | GO:0045065 | cytotoxic T cell differentiation(GO:0045065) |
| 0.3 | 11.5 | GO:0007029 | endoplasmic reticulum organization(GO:0007029) |
| 0.3 | 1.8 | GO:0060754 | positive regulation of mast cell chemotaxis(GO:0060754) |
| 0.3 | 2.1 | GO:0001842 | neural fold formation(GO:0001842) |
| 0.3 | 12.7 | GO:1903959 | regulation of anion transmembrane transport(GO:1903959) |
| 0.3 | 23.3 | GO:0048477 | oogenesis(GO:0048477) |
| 0.3 | 5.5 | GO:0003094 | glomerular filtration(GO:0003094) |
| 0.3 | 10.4 | GO:0000188 | inactivation of MAPK activity(GO:0000188) |
| 0.3 | 21.5 | GO:0032411 | positive regulation of transporter activity(GO:0032411) |
| 0.3 | 4.4 | GO:0031573 | intra-S DNA damage checkpoint(GO:0031573) |
| 0.3 | 1.1 | GO:0090370 | negative regulation of cholesterol efflux(GO:0090370) |
| 0.3 | 1.9 | GO:0038180 | nerve growth factor signaling pathway(GO:0038180) |
| 0.3 | 5.7 | GO:0007597 | blood coagulation, intrinsic pathway(GO:0007597) |
| 0.3 | 8.1 | GO:0090200 | positive regulation of release of cytochrome c from mitochondria(GO:0090200) |
| 0.3 | 4.2 | GO:1904706 | negative regulation of vascular smooth muscle cell proliferation(GO:1904706) |
| 0.2 | 3.5 | GO:0040020 | regulation of meiotic nuclear division(GO:0040020) |
| 0.2 | 1.4 | GO:0071028 | nuclear RNA surveillance(GO:0071027) nuclear mRNA surveillance(GO:0071028) |
| 0.2 | 6.7 | GO:0007214 | gamma-aminobutyric acid signaling pathway(GO:0007214) |
| 0.2 | 5.3 | GO:0045109 | intermediate filament organization(GO:0045109) |
| 0.2 | 3.0 | GO:0006828 | manganese ion transport(GO:0006828) |
| 0.2 | 0.9 | GO:0038170 | somatostatin receptor signaling pathway(GO:0038169) somatostatin signaling pathway(GO:0038170) |
| 0.2 | 0.9 | GO:0018101 | protein citrullination(GO:0018101) histone citrullination(GO:0036414) |
| 0.2 | 3.6 | GO:0030277 | maintenance of gastrointestinal epithelium(GO:0030277) |
| 0.2 | 1.3 | GO:0090063 | positive regulation of microtubule nucleation(GO:0090063) |
| 0.2 | 21.1 | GO:0021987 | cerebral cortex development(GO:0021987) |
| 0.2 | 4.0 | GO:0072697 | protein localization to cell cortex(GO:0072697) regulation of protein localization to cell cortex(GO:1904776) positive regulation of protein localization to cell cortex(GO:1904778) |
| 0.2 | 2.2 | GO:0007252 | I-kappaB phosphorylation(GO:0007252) |
| 0.2 | 1.5 | GO:1904262 | negative regulation of TORC1 signaling(GO:1904262) |
| 0.2 | 4.8 | GO:1904380 | endoplasmic reticulum mannose trimming(GO:1904380) |
| 0.2 | 0.7 | GO:0007207 | adenylate cyclase-inhibiting G-protein coupled acetylcholine receptor signaling pathway(GO:0007197) phospholipase C-activating G-protein coupled acetylcholine receptor signaling pathway(GO:0007207) |
| 0.2 | 6.3 | GO:0071377 | cellular response to glucagon stimulus(GO:0071377) |
| 0.2 | 9.6 | GO:0035914 | skeletal muscle cell differentiation(GO:0035914) |
| 0.2 | 7.6 | GO:0001756 | somitogenesis(GO:0001756) |
| 0.2 | 8.2 | GO:0033344 | cholesterol efflux(GO:0033344) |
| 0.2 | 10.1 | GO:0035308 | negative regulation of protein dephosphorylation(GO:0035308) |
| 0.1 | 0.4 | GO:0003218 | cardiac left ventricle formation(GO:0003218) |
| 0.1 | 1.1 | GO:0002087 | regulation of respiratory gaseous exchange by neurological system process(GO:0002087) |
| 0.1 | 8.8 | GO:0003073 | regulation of systemic arterial blood pressure(GO:0003073) |
| 0.1 | 6.9 | GO:0016486 | peptide hormone processing(GO:0016486) |
| 0.1 | 3.1 | GO:0014059 | dopamine secretion(GO:0014046) regulation of dopamine secretion(GO:0014059) |
| 0.1 | 0.4 | GO:0097534 | lymphoid lineage cell migration(GO:0097534) lymphoid lineage cell migration into thymus(GO:0097535) regulation of positive thymic T cell selection(GO:1902232) |
| 0.1 | 19.2 | GO:0007156 | homophilic cell adhesion via plasma membrane adhesion molecules(GO:0007156) |
| 0.1 | 1.5 | GO:0000338 | protein deneddylation(GO:0000338) |
| 0.1 | 1.5 | GO:0006600 | creatine metabolic process(GO:0006600) |
| 0.1 | 1.3 | GO:0030213 | hyaluronan biosynthetic process(GO:0030213) |
| 0.1 | 8.0 | GO:0042771 | intrinsic apoptotic signaling pathway in response to DNA damage by p53 class mediator(GO:0042771) |
| 0.1 | 7.6 | GO:0016525 | negative regulation of angiogenesis(GO:0016525) |
| 0.1 | 1.6 | GO:0022615 | protein to membrane docking(GO:0022615) |
| 0.1 | 4.8 | GO:0042795 | snRNA transcription(GO:0009301) snRNA transcription from RNA polymerase II promoter(GO:0042795) |
| 0.1 | 0.9 | GO:0021527 | ventral spinal cord interneuron differentiation(GO:0021514) spinal cord association neuron differentiation(GO:0021527) |
| 0.1 | 0.5 | GO:1900245 | negative regulation of smooth muscle cell differentiation(GO:0051151) positive regulation of MDA-5 signaling pathway(GO:1900245) |
| 0.1 | 1.3 | GO:0021854 | hypothalamus development(GO:0021854) |
| 0.1 | 9.6 | GO:0090630 | activation of GTPase activity(GO:0090630) |
| 0.1 | 3.1 | GO:0050982 | detection of mechanical stimulus(GO:0050982) |
| 0.1 | 14.1 | GO:0000187 | activation of MAPK activity(GO:0000187) |
| 0.1 | 1.8 | GO:0006646 | phosphatidylethanolamine biosynthetic process(GO:0006646) |
| 0.1 | 3.3 | GO:0034314 | Arp2/3 complex-mediated actin nucleation(GO:0034314) |
| 0.1 | 1.1 | GO:1902187 | negative regulation of viral release from host cell(GO:1902187) |
| 0.1 | 4.6 | GO:0071260 | cellular response to mechanical stimulus(GO:0071260) |
| 0.1 | 1.2 | GO:0071526 | semaphorin-plexin signaling pathway(GO:0071526) |
| 0.1 | 5.8 | GO:0070527 | platelet aggregation(GO:0070527) |
| 0.1 | 0.9 | GO:1904427 | positive regulation of calcium ion transmembrane transport(GO:1904427) |
| 0.1 | 0.5 | GO:0002051 | osteoblast fate commitment(GO:0002051) |
| 0.1 | 5.5 | GO:0007368 | determination of left/right symmetry(GO:0007368) |
| 0.1 | 0.6 | GO:0045794 | negative regulation of cell volume(GO:0045794) |
| 0.1 | 0.8 | GO:0016024 | CDP-diacylglycerol biosynthetic process(GO:0016024) |
| 0.1 | 2.1 | GO:0030317 | sperm motility(GO:0030317) |
| 0.1 | 0.2 | GO:0032747 | interleukin-23 production(GO:0032627) regulation of interleukin-23 production(GO:0032667) positive regulation of interleukin-23 production(GO:0032747) |
| 0.1 | 0.6 | GO:0098914 | membrane repolarization during atrial cardiac muscle cell action potential(GO:0098914) |
| 0.1 | 1.0 | GO:0098927 | early endosome to late endosome transport(GO:0045022) vesicle-mediated transport between endosomal compartments(GO:0098927) |
| 0.0 | 1.0 | GO:0002076 | osteoblast development(GO:0002076) |
| 0.0 | 2.2 | GO:0016239 | positive regulation of macroautophagy(GO:0016239) |
| 0.0 | 2.0 | GO:0000083 | regulation of transcription involved in G1/S transition of mitotic cell cycle(GO:0000083) |
| 0.0 | 4.5 | GO:0007286 | spermatid development(GO:0007286) |
| 0.0 | 0.2 | GO:0010838 | positive regulation of keratinocyte proliferation(GO:0010838) |
| 0.0 | 0.5 | GO:0006704 | glucocorticoid biosynthetic process(GO:0006704) |
| 0.0 | 2.4 | GO:0003333 | amino acid transmembrane transport(GO:0003333) |
| 0.0 | 1.0 | GO:0060976 | coronary vasculature development(GO:0060976) |
| 0.0 | 0.6 | GO:0060394 | negative regulation of pathway-restricted SMAD protein phosphorylation(GO:0060394) |
| 0.0 | 16.7 | GO:0043687 | post-translational protein modification(GO:0043687) |
| 0.0 | 0.5 | GO:0006853 | carnitine shuttle(GO:0006853) |
| 0.0 | 3.8 | GO:0007272 | ensheathment of neurons(GO:0007272) axon ensheathment(GO:0008366) |
| 0.0 | 2.5 | GO:0043473 | pigmentation(GO:0043473) |
| 0.0 | 0.5 | GO:0001829 | trophectodermal cell differentiation(GO:0001829) |
| 0.0 | 0.2 | GO:0007296 | vitellogenesis(GO:0007296) |
| 0.0 | 1.7 | GO:0030574 | collagen catabolic process(GO:0030574) |
| 0.0 | 0.3 | GO:0051412 | response to corticosterone(GO:0051412) |
| 0.0 | 0.4 | GO:0032754 | positive regulation of interleukin-5 production(GO:0032754) |
| 0.0 | 0.5 | GO:0045063 | T-helper 1 cell differentiation(GO:0045063) |
| 0.0 | 1.2 | GO:0050434 | positive regulation of viral transcription(GO:0050434) |
| 0.0 | 0.2 | GO:0021702 | cerebellar Purkinje cell layer formation(GO:0021694) cerebellar Purkinje cell differentiation(GO:0021702) |
| 0.0 | 1.8 | GO:1903955 | positive regulation of protein targeting to mitochondrion(GO:1903955) |
| 0.0 | 0.1 | GO:0042730 | fibrinolysis(GO:0042730) |
| 0.0 | 1.6 | GO:0006937 | regulation of muscle contraction(GO:0006937) |
| 0.0 | 0.8 | GO:0030521 | androgen receptor signaling pathway(GO:0030521) |
| 0.0 | 1.2 | GO:0046854 | phosphatidylinositol phosphorylation(GO:0046854) |
Gene overrepresentation in cellular component category:
| Log-likelihood per target | Total log-likelihood | Term | Description |
|---|---|---|---|
| 10.5 | 42.0 | GO:0070032 | synaptobrevin 2-SNAP-25-syntaxin-1a-complexin I complex(GO:0070032) |
| 4.8 | 14.5 | GO:0071148 | TEAD-1-YAP complex(GO:0071148) |
| 4.6 | 23.0 | GO:0031673 | H zone(GO:0031673) |
| 3.8 | 38.0 | GO:0045180 | basal cortex(GO:0045180) |
| 3.5 | 17.5 | GO:0043527 | tRNA methyltransferase complex(GO:0043527) |
| 3.4 | 47.4 | GO:0035253 | ciliary rootlet(GO:0035253) |
| 3.2 | 16.1 | GO:0005854 | nascent polypeptide-associated complex(GO:0005854) |
| 2.1 | 15.0 | GO:0098560 | cytoplasmic side of late endosome membrane(GO:0098560) |
| 2.1 | 21.4 | GO:0000220 | vacuolar proton-transporting V-type ATPase, V0 domain(GO:0000220) |
| 1.8 | 12.7 | GO:0032021 | NELF complex(GO:0032021) |
| 1.8 | 23.1 | GO:0042583 | chromaffin granule(GO:0042583) |
| 1.7 | 5.2 | GO:0043159 | acrosomal matrix(GO:0043159) |
| 1.7 | 6.7 | GO:0038039 | G-protein coupled receptor heterodimeric complex(GO:0038039) |
| 1.6 | 34.5 | GO:0031045 | dense core granule(GO:0031045) |
| 1.5 | 33.4 | GO:0001518 | voltage-gated sodium channel complex(GO:0001518) |
| 1.5 | 1.5 | GO:0070381 | endosome to plasma membrane transport vesicle(GO:0070381) |
| 1.5 | 29.4 | GO:0033270 | paranode region of axon(GO:0033270) |
| 1.4 | 23.2 | GO:0097512 | cardiac myofibril(GO:0097512) |
| 1.2 | 12.4 | GO:0005818 | astral microtubule(GO:0000235) aster(GO:0005818) |
| 1.2 | 14.7 | GO:0005577 | fibrinogen complex(GO:0005577) |
| 1.2 | 28.7 | GO:0044295 | axonal growth cone(GO:0044295) |
| 1.0 | 9.4 | GO:0000813 | ESCRT I complex(GO:0000813) |
| 1.0 | 16.0 | GO:0030130 | clathrin coat of trans-Golgi network vesicle(GO:0030130) |
| 1.0 | 35.5 | GO:0000421 | autophagosome membrane(GO:0000421) |
| 0.9 | 66.5 | GO:0005834 | heterotrimeric G-protein complex(GO:0005834) |
| 0.9 | 3.7 | GO:0008275 | gamma-tubulin small complex(GO:0008275) |
| 0.9 | 40.8 | GO:0000795 | synaptonemal complex(GO:0000795) |
| 0.9 | 5.5 | GO:0045252 | oxoglutarate dehydrogenase complex(GO:0045252) |
| 0.9 | 3.7 | GO:0005965 | protein farnesyltransferase complex(GO:0005965) |
| 0.9 | 4.4 | GO:0070847 | core mediator complex(GO:0070847) |
| 0.7 | 3.0 | GO:0035363 | histone locus body(GO:0035363) |
| 0.7 | 6.6 | GO:0072546 | ER membrane protein complex(GO:0072546) |
| 0.7 | 72.2 | GO:0014704 | intercalated disc(GO:0014704) |
| 0.7 | 4.9 | GO:0000127 | transcription factor TFIIIC complex(GO:0000127) |
| 0.7 | 5.9 | GO:0070652 | HAUS complex(GO:0070652) |
| 0.6 | 95.7 | GO:0030426 | growth cone(GO:0030426) |
| 0.6 | 12.0 | GO:0031082 | BLOC complex(GO:0031082) |
| 0.6 | 6.6 | GO:0032039 | integrator complex(GO:0032039) |
| 0.6 | 4.1 | GO:0017119 | Golgi transport complex(GO:0017119) |
| 0.5 | 2.7 | GO:0000408 | EKC/KEOPS complex(GO:0000408) |
| 0.5 | 7.0 | GO:0031618 | nuclear pericentric heterochromatin(GO:0031618) |
| 0.5 | 3.7 | GO:0001673 | male germ cell nucleus(GO:0001673) |
| 0.5 | 32.5 | GO:0032588 | trans-Golgi network membrane(GO:0032588) |
| 0.5 | 7.7 | GO:0044232 | organelle membrane contact site(GO:0044232) |
| 0.5 | 10.8 | GO:0055038 | recycling endosome membrane(GO:0055038) |
| 0.5 | 4.0 | GO:0035976 | AP1 complex(GO:0035976) |
| 0.5 | 45.2 | GO:0045334 | clathrin-coated endocytic vesicle(GO:0045334) |
| 0.5 | 1.4 | GO:0098536 | deuterosome(GO:0098536) |
| 0.5 | 6.6 | GO:0005869 | dynactin complex(GO:0005869) |
| 0.5 | 171.1 | GO:0060076 | excitatory synapse(GO:0060076) |
| 0.4 | 6.7 | GO:0035371 | microtubule plus-end(GO:0035371) |
| 0.4 | 5.7 | GO:0033093 | Weibel-Palade body(GO:0033093) |
| 0.4 | 3.0 | GO:0005915 | zonula adherens(GO:0005915) |
| 0.4 | 8.3 | GO:0031588 | nucleotide-activated protein kinase complex(GO:0031588) |
| 0.4 | 3.7 | GO:0043203 | axon hillock(GO:0043203) |
| 0.4 | 7.6 | GO:0030673 | axolemma(GO:0030673) |
| 0.4 | 4.9 | GO:0008385 | IkappaB kinase complex(GO:0008385) |
| 0.4 | 16.3 | GO:0016460 | myosin II complex(GO:0016460) |
| 0.4 | 2.9 | GO:0034464 | BBSome(GO:0034464) |
| 0.4 | 6.4 | GO:0031235 | intrinsic component of the cytoplasmic side of the plasma membrane(GO:0031235) |
| 0.3 | 7.9 | GO:0005921 | gap junction(GO:0005921) |
| 0.3 | 5.1 | GO:1990454 | L-type voltage-gated calcium channel complex(GO:1990454) |
| 0.3 | 41.6 | GO:0043204 | perikaryon(GO:0043204) |
| 0.3 | 20.5 | GO:0031594 | neuromuscular junction(GO:0031594) |
| 0.3 | 4.7 | GO:0005847 | mRNA cleavage and polyadenylation specificity factor complex(GO:0005847) |
| 0.3 | 12.3 | GO:1902711 | GABA receptor complex(GO:1902710) GABA-A receptor complex(GO:1902711) |
| 0.3 | 3.6 | GO:0030126 | COPI vesicle coat(GO:0030126) |
| 0.3 | 0.8 | GO:0034271 | phosphatidylinositol 3-kinase complex, class III, type I(GO:0034271) phosphatidylinositol 3-kinase complex, class III, type II(GO:0034272) |
| 0.3 | 1.1 | GO:0032937 | SREBP-SCAP-Insig complex(GO:0032937) |
| 0.3 | 3.9 | GO:0000786 | nucleosome(GO:0000786) |
| 0.2 | 7.4 | GO:0048786 | presynaptic active zone(GO:0048786) |
| 0.2 | 3.3 | GO:0005885 | Arp2/3 protein complex(GO:0005885) |
| 0.2 | 1.0 | GO:0000306 | extrinsic component of vacuolar membrane(GO:0000306) extrinsic component of endosome membrane(GO:0031313) |
| 0.2 | 3.4 | GO:0034098 | VCP-NPL4-UFD1 AAA ATPase complex(GO:0034098) |
| 0.2 | 71.8 | GO:0098857 | membrane raft(GO:0045121) membrane microdomain(GO:0098857) |
| 0.2 | 10.3 | GO:0005776 | autophagosome(GO:0005776) |
| 0.2 | 11.2 | GO:0032154 | cleavage furrow(GO:0032154) cell surface furrow(GO:0097610) |
| 0.2 | 2.4 | GO:0030478 | actin cap(GO:0030478) |
| 0.2 | 3.1 | GO:0030904 | retromer complex(GO:0030904) |
| 0.2 | 7.4 | GO:0016235 | aggresome(GO:0016235) |
| 0.2 | 6.5 | GO:0016592 | mediator complex(GO:0016592) |
| 0.2 | 12.4 | GO:0005913 | cell-cell adherens junction(GO:0005913) |
| 0.2 | 1.3 | GO:0030688 | preribosome, small subunit precursor(GO:0030688) |
| 0.2 | 4.8 | GO:0044322 | endoplasmic reticulum quality control compartment(GO:0044322) |
| 0.2 | 1.9 | GO:0000242 | pericentriolar material(GO:0000242) |
| 0.2 | 3.1 | GO:0005892 | acetylcholine-gated channel complex(GO:0005892) |
| 0.2 | 1.9 | GO:0030140 | trans-Golgi network transport vesicle(GO:0030140) |
| 0.2 | 9.3 | GO:0005801 | cis-Golgi network(GO:0005801) |
| 0.2 | 2.8 | GO:0002080 | acrosomal membrane(GO:0002080) |
| 0.1 | 1.3 | GO:0000347 | THO complex(GO:0000347) THO complex part of transcription export complex(GO:0000445) |
| 0.1 | 2.5 | GO:0042629 | mast cell granule(GO:0042629) |
| 0.1 | 1.7 | GO:0098647 | collagen type VI trimer(GO:0005589) collagen beaded filament(GO:0098647) |
| 0.1 | 3.2 | GO:0034451 | centriolar satellite(GO:0034451) |
| 0.1 | 10.0 | GO:0034705 | voltage-gated potassium channel complex(GO:0008076) potassium channel complex(GO:0034705) |
| 0.1 | 5.6 | GO:0033017 | sarcoplasmic reticulum membrane(GO:0033017) |
| 0.1 | 6.5 | GO:0097014 | axoneme(GO:0005930) ciliary plasm(GO:0097014) |
| 0.1 | 4.4 | GO:0008180 | COP9 signalosome(GO:0008180) |
| 0.1 | 33.0 | GO:0030425 | dendrite(GO:0030425) |
| 0.1 | 33.0 | GO:0005788 | endoplasmic reticulum lumen(GO:0005788) |
| 0.1 | 3.7 | GO:0043195 | terminal bouton(GO:0043195) |
| 0.1 | 29.0 | GO:0016324 | apical plasma membrane(GO:0016324) |
| 0.1 | 7.9 | GO:0032587 | ruffle membrane(GO:0032587) |
| 0.1 | 13.7 | GO:0001650 | fibrillar center(GO:0001650) |
| 0.1 | 5.1 | GO:0015030 | Cajal body(GO:0015030) |
| 0.1 | 8.0 | GO:0031901 | early endosome membrane(GO:0031901) |
| 0.1 | 1.3 | GO:0036038 | MKS complex(GO:0036038) |
| 0.1 | 5.4 | GO:0032580 | Golgi cisterna membrane(GO:0032580) |
| 0.1 | 1.2 | GO:0042101 | T cell receptor complex(GO:0042101) |
| 0.1 | 6.9 | GO:0030176 | integral component of endoplasmic reticulum membrane(GO:0030176) |
| 0.1 | 16.3 | GO:0005578 | proteinaceous extracellular matrix(GO:0005578) |
| 0.1 | 0.6 | GO:0045254 | pyruvate dehydrogenase complex(GO:0045254) |
| 0.1 | 2.2 | GO:0045211 | postsynaptic membrane(GO:0045211) |
| 0.1 | 9.9 | GO:0005741 | mitochondrial outer membrane(GO:0005741) |
| 0.0 | 6.4 | GO:0016323 | basolateral plasma membrane(GO:0016323) |
| 0.0 | 51.8 | GO:0005887 | integral component of plasma membrane(GO:0005887) |
| 0.0 | 0.6 | GO:0005662 | DNA replication factor A complex(GO:0005662) |
| 0.0 | 2.9 | GO:0031514 | motile cilium(GO:0031514) |
| 0.0 | 6.1 | GO:0005929 | cilium(GO:0005929) |
| 0.0 | 3.6 | GO:0009897 | external side of plasma membrane(GO:0009897) |
| 0.0 | 1.1 | GO:0035579 | specific granule membrane(GO:0035579) |
| 0.0 | 1.6 | GO:0000502 | proteasome complex(GO:0000502) |
| 0.0 | 19.9 | GO:0005615 | extracellular space(GO:0005615) |
Gene overrepresentation in molecular function category:
| Log-likelihood per target | Total log-likelihood | Term | Description |
|---|---|---|---|
| 6.8 | 54.4 | GO:0004111 | creatine kinase activity(GO:0004111) |
| 5.4 | 21.4 | GO:0046933 | proton-transporting ATP synthase activity, rotational mechanism(GO:0046933) |
| 4.4 | 39.8 | GO:0008597 | calcium-dependent protein serine/threonine phosphatase regulator activity(GO:0008597) |
| 4.2 | 33.4 | GO:0086006 | voltage-gated sodium channel activity involved in cardiac muscle cell action potential(GO:0086006) |
| 4.1 | 73.6 | GO:0004062 | aryl sulfotransferase activity(GO:0004062) |
| 3.8 | 11.5 | GO:0008330 | protein tyrosine/threonine phosphatase activity(GO:0008330) |
| 3.8 | 11.4 | GO:0050510 | N-acetylgalactosaminyl-proteoglycan 3-beta-glucuronosyltransferase activity(GO:0050510) |
| 3.8 | 15.1 | GO:0016434 | rRNA (cytosine) methyltransferase activity(GO:0016434) |
| 3.6 | 14.3 | GO:0008467 | [heparan sulfate]-glucosamine 3-sulfotransferase 1 activity(GO:0008467) |
| 3.4 | 54.6 | GO:0031821 | G-protein coupled serotonin receptor binding(GO:0031821) |
| 3.0 | 21.0 | GO:0030250 | cyclase activator activity(GO:0010853) guanylate cyclase activator activity(GO:0030250) |
| 2.8 | 16.8 | GO:0004013 | adenosylhomocysteinase activity(GO:0004013) trialkylsulfonium hydrolase activity(GO:0016802) |
| 2.7 | 21.6 | GO:0015235 | cobalamin transporter activity(GO:0015235) |
| 2.5 | 38.0 | GO:0042577 | lipid phosphatase activity(GO:0042577) |
| 2.5 | 25.0 | GO:0003777 | microtubule motor activity(GO:0003777) |
| 2.4 | 31.8 | GO:0016909 | JUN kinase activity(GO:0004705) SAP kinase activity(GO:0016909) |
| 2.4 | 23.6 | GO:0042731 | PH domain binding(GO:0042731) |
| 2.3 | 9.1 | GO:0004741 | [pyruvate dehydrogenase (lipoamide)] phosphatase activity(GO:0004741) |
| 2.2 | 54.7 | GO:0051010 | microtubule plus-end binding(GO:0051010) |
| 2.1 | 8.4 | GO:0004142 | diacylglycerol cholinephosphotransferase activity(GO:0004142) |
| 2.1 | 25.0 | GO:0017017 | MAP kinase tyrosine/serine/threonine phosphatase activity(GO:0017017) |
| 2.1 | 6.2 | GO:0016429 | tRNA (adenine-N1-)-methyltransferase activity(GO:0016429) |
| 1.7 | 5.2 | GO:0060001 | minus-end directed microfilament motor activity(GO:0060001) |
| 1.7 | 32.3 | GO:0030957 | Tat protein binding(GO:0030957) |
| 1.7 | 6.7 | GO:0004965 | G-protein coupled GABA receptor activity(GO:0004965) |
| 1.7 | 43.4 | GO:0035259 | glucocorticoid receptor binding(GO:0035259) |
| 1.6 | 4.9 | GO:0000992 | polymerase III regulatory region sequence-specific DNA binding(GO:0000992) RNA polymerase III type 1 promoter sequence-specific DNA binding(GO:0001002) RNA polymerase III type 2 promoter sequence-specific DNA binding(GO:0001003) |
| 1.6 | 1.6 | GO:0016426 | tRNA (adenine) methyltransferase activity(GO:0016426) |
| 1.6 | 27.0 | GO:0042043 | neurexin family protein binding(GO:0042043) |
| 1.6 | 42.4 | GO:0008574 | ATP-dependent microtubule motor activity, plus-end-directed(GO:0008574) |
| 1.5 | 21.4 | GO:0001075 | transcription factor activity, RNA polymerase II core promoter sequence-specific binding involved in preinitiation complex assembly(GO:0001075) |
| 1.5 | 20.8 | GO:0008429 | phosphatidylethanolamine binding(GO:0008429) |
| 1.5 | 10.3 | GO:0008481 | sphinganine kinase activity(GO:0008481) D-erythro-sphingosine kinase activity(GO:0017050) |
| 1.4 | 5.6 | GO:0048403 | brain-derived neurotrophic factor binding(GO:0048403) |
| 1.4 | 6.9 | GO:0045174 | glutathione dehydrogenase (ascorbate) activity(GO:0045174) methylarsonate reductase activity(GO:0050610) |
| 1.4 | 4.1 | GO:0032427 | GBD domain binding(GO:0032427) |
| 1.4 | 5.4 | GO:0047804 | cysteine-S-conjugate beta-lyase activity(GO:0047804) L-phenylalanine aminotransferase activity(GO:0070546) |
| 1.3 | 3.9 | GO:0004616 | phosphogluconate dehydrogenase (decarboxylating) activity(GO:0004616) |
| 1.3 | 43.8 | GO:0017075 | syntaxin-1 binding(GO:0017075) |
| 1.2 | 4.9 | GO:0071987 | WD40-repeat domain binding(GO:0071987) |
| 1.2 | 7.1 | GO:0000179 | rRNA (adenine-N6,N6-)-dimethyltransferase activity(GO:0000179) |
| 1.2 | 5.9 | GO:0004045 | aminoacyl-tRNA hydrolase activity(GO:0004045) |
| 1.2 | 7.0 | GO:0004468 | lysine N-acetyltransferase activity, acting on acetyl phosphate as donor(GO:0004468) |
| 1.1 | 30.9 | GO:0004708 | MAP kinase kinase activity(GO:0004708) |
| 1.1 | 5.5 | GO:0004591 | oxoglutarate dehydrogenase (succinyl-transferring) activity(GO:0004591) |
| 1.1 | 6.6 | GO:0004305 | ethanolamine kinase activity(GO:0004305) |
| 1.1 | 5.3 | GO:0004370 | glycerol kinase activity(GO:0004370) |
| 1.1 | 5.3 | GO:0003989 | acetyl-CoA carboxylase activity(GO:0003989) |
| 1.0 | 8.1 | GO:0052834 | inositol monophosphate 1-phosphatase activity(GO:0008934) inositol monophosphate 3-phosphatase activity(GO:0052832) inositol monophosphate 4-phosphatase activity(GO:0052833) inositol monophosphate phosphatase activity(GO:0052834) |
| 1.0 | 34.3 | GO:0005086 | ARF guanyl-nucleotide exchange factor activity(GO:0005086) |
| 1.0 | 2.9 | GO:0035575 | histone demethylase activity (H4-K20 specific)(GO:0035575) |
| 1.0 | 3.8 | GO:0015220 | choline transmembrane transporter activity(GO:0015220) |
| 0.9 | 3.7 | GO:0031716 | calcitonin receptor binding(GO:0031716) |
| 0.9 | 9.3 | GO:0008131 | primary amine oxidase activity(GO:0008131) |
| 0.9 | 49.5 | GO:0030507 | spectrin binding(GO:0030507) |
| 0.9 | 3.7 | GO:0004660 | protein farnesyltransferase activity(GO:0004660) |
| 0.9 | 19.2 | GO:0005247 | voltage-gated chloride channel activity(GO:0005247) |
| 0.9 | 1.8 | GO:0043183 | vascular endothelial growth factor receptor 1 binding(GO:0043183) |
| 0.9 | 3.5 | GO:0004504 | peptidylglycine monooxygenase activity(GO:0004504) peptidylamidoglycolate lyase activity(GO:0004598) |
| 0.9 | 10.6 | GO:0004726 | non-membrane spanning protein tyrosine phosphatase activity(GO:0004726) |
| 0.8 | 3.4 | GO:0035473 | lipase binding(GO:0035473) |
| 0.8 | 5.1 | GO:1904047 | S-adenosyl-L-methionine binding(GO:1904047) |
| 0.8 | 21.7 | GO:0031489 | myosin V binding(GO:0031489) |
| 0.8 | 13.1 | GO:0031702 | type 1 angiotensin receptor binding(GO:0031702) |
| 0.8 | 11.2 | GO:0015501 | glutamate:sodium symporter activity(GO:0015501) |
| 0.8 | 6.3 | GO:0004176 | ATP-dependent peptidase activity(GO:0004176) |
| 0.8 | 33.2 | GO:0042056 | chemoattractant activity(GO:0042056) |
| 0.8 | 12.2 | GO:0017110 | nucleoside-diphosphatase activity(GO:0017110) |
| 0.7 | 7.4 | GO:0055131 | C3HC4-type RING finger domain binding(GO:0055131) |
| 0.7 | 10.6 | GO:0001134 | transcription factor activity, transcription factor recruiting(GO:0001134) |
| 0.7 | 13.9 | GO:0017049 | GTP-Rho binding(GO:0017049) |
| 0.7 | 2.0 | GO:0042806 | amidase activity(GO:0004040) fucose binding(GO:0042806) |
| 0.6 | 19.1 | GO:0005212 | structural constituent of eye lens(GO:0005212) |
| 0.6 | 5.7 | GO:1904315 | neurotransmitter receptor activity involved in regulation of postsynaptic membrane potential(GO:0099529) transmitter-gated ion channel activity involved in regulation of postsynaptic membrane potential(GO:1904315) |
| 0.6 | 3.7 | GO:0051011 | microtubule minus-end binding(GO:0051011) |
| 0.6 | 6.7 | GO:0005021 | vascular endothelial growth factor-activated receptor activity(GO:0005021) |
| 0.6 | 8.9 | GO:0016813 | hydrolase activity, acting on carbon-nitrogen (but not peptide) bonds, in linear amidines(GO:0016813) |
| 0.6 | 26.1 | GO:0004115 | 3',5'-cyclic-AMP phosphodiesterase activity(GO:0004115) |
| 0.5 | 12.4 | GO:0070182 | DNA polymerase binding(GO:0070182) |
| 0.5 | 44.3 | GO:0048306 | calcium-dependent protein binding(GO:0048306) |
| 0.5 | 11.2 | GO:0008191 | metalloendopeptidase inhibitor activity(GO:0008191) |
| 0.5 | 11.0 | GO:0004862 | cAMP-dependent protein kinase inhibitor activity(GO:0004862) |
| 0.5 | 28.4 | GO:0035035 | histone acetyltransferase binding(GO:0035035) |
| 0.5 | 2.5 | GO:0005105 | type 1 fibroblast growth factor receptor binding(GO:0005105) |
| 0.5 | 7.8 | GO:0034452 | dynactin binding(GO:0034452) dynein intermediate chain binding(GO:0045505) |
| 0.5 | 4.4 | GO:0038036 | sphingosine-1-phosphate receptor activity(GO:0038036) |
| 0.5 | 4.8 | GO:0016286 | small conductance calcium-activated potassium channel activity(GO:0016286) |
| 0.5 | 28.2 | GO:0042169 | SH2 domain binding(GO:0042169) |
| 0.5 | 1.9 | GO:0015254 | glycerol channel activity(GO:0015254) |
| 0.5 | 4.3 | GO:0016015 | morphogen activity(GO:0016015) |
| 0.5 | 15.2 | GO:0043014 | alpha-tubulin binding(GO:0043014) |
| 0.4 | 60.1 | GO:0005179 | hormone activity(GO:0005179) |
| 0.4 | 6.2 | GO:0031435 | mitogen-activated protein kinase kinase kinase binding(GO:0031435) |
| 0.4 | 1.3 | GO:0050501 | hyaluronan synthase activity(GO:0050501) |
| 0.4 | 2.2 | GO:0016907 | G-protein coupled acetylcholine receptor activity(GO:0016907) |
| 0.4 | 4.8 | GO:1904264 | ubiquitin protein ligase activity involved in ERAD pathway(GO:1904264) |
| 0.4 | 2.2 | GO:0047179 | platelet-activating factor acetyltransferase activity(GO:0047179) |
| 0.4 | 6.7 | GO:0008503 | benzodiazepine receptor activity(GO:0008503) |
| 0.4 | 3.4 | GO:0097322 | 7SK snRNA binding(GO:0097322) |
| 0.4 | 1.1 | GO:0008384 | IkappaB kinase activity(GO:0008384) |
| 0.4 | 39.9 | GO:0051213 | dioxygenase activity(GO:0051213) |
| 0.4 | 1.1 | GO:0000247 | C-8 sterol isomerase activity(GO:0000247) |
| 0.4 | 1.4 | GO:0034353 | RNA pyrophosphohydrolase activity(GO:0034353) |
| 0.3 | 4.2 | GO:0038132 | neuregulin binding(GO:0038132) |
| 0.3 | 2.7 | GO:0031812 | G-protein coupled nucleotide receptor binding(GO:0031811) P2Y1 nucleotide receptor binding(GO:0031812) |
| 0.3 | 5.7 | GO:0015095 | magnesium ion transmembrane transporter activity(GO:0015095) |
| 0.3 | 14.2 | GO:0008138 | protein tyrosine/serine/threonine phosphatase activity(GO:0008138) |
| 0.3 | 3.0 | GO:0015279 | store-operated calcium channel activity(GO:0015279) |
| 0.3 | 1.9 | GO:0010465 | nerve growth factor receptor activity(GO:0010465) |
| 0.3 | 1.2 | GO:0042030 | ATPase inhibitor activity(GO:0042030) |
| 0.3 | 2.1 | GO:0043008 | ATP-dependent protein binding(GO:0043008) |
| 0.3 | 7.9 | GO:0001965 | G-protein alpha-subunit binding(GO:0001965) |
| 0.3 | 11.4 | GO:0046875 | ephrin receptor binding(GO:0046875) |
| 0.3 | 3.7 | GO:0051959 | dynein light intermediate chain binding(GO:0051959) |
| 0.3 | 1.0 | GO:0035727 | lysophosphatidic acid binding(GO:0035727) |
| 0.3 | 14.7 | GO:0016504 | peptidase activator activity(GO:0016504) |
| 0.3 | 2.6 | GO:0001042 | RNA polymerase I core binding(GO:0001042) |
| 0.3 | 6.9 | GO:0005521 | lamin binding(GO:0005521) |
| 0.2 | 27.8 | GO:0017048 | Rho GTPase binding(GO:0017048) |
| 0.2 | 3.9 | GO:0035256 | G-protein coupled glutamate receptor binding(GO:0035256) |
| 0.2 | 5.5 | GO:0042813 | Wnt-activated receptor activity(GO:0042813) |
| 0.2 | 34.2 | GO:0005200 | structural constituent of cytoskeleton(GO:0005200) |
| 0.2 | 5.3 | GO:0036041 | long-chain fatty acid binding(GO:0036041) |
| 0.2 | 8.5 | GO:0030544 | Hsp70 protein binding(GO:0030544) |
| 0.2 | 2.6 | GO:0043495 | protein anchor(GO:0043495) |
| 0.2 | 0.4 | GO:0022850 | serotonin-gated cation channel activity(GO:0022850) |
| 0.2 | 5.7 | GO:0019865 | immunoglobulin binding(GO:0019865) |
| 0.2 | 8.9 | GO:0004864 | protein phosphatase inhibitor activity(GO:0004864) |
| 0.2 | 0.9 | GO:0004994 | somatostatin receptor activity(GO:0004994) |
| 0.2 | 1.6 | GO:1990381 | ubiquitin-specific protease binding(GO:1990381) |
| 0.2 | 4.4 | GO:0004190 | aspartic-type endopeptidase activity(GO:0004190) aspartic-type peptidase activity(GO:0070001) |
| 0.2 | 49.7 | GO:0015631 | tubulin binding(GO:0015631) |
| 0.2 | 9.7 | GO:0030971 | receptor tyrosine kinase binding(GO:0030971) |
| 0.2 | 4.4 | GO:0043325 | phosphatidylinositol-3,4-bisphosphate binding(GO:0043325) |
| 0.2 | 43.9 | GO:0004252 | serine-type endopeptidase activity(GO:0004252) |
| 0.2 | 8.4 | GO:0008307 | structural constituent of muscle(GO:0008307) |
| 0.2 | 0.6 | GO:0004739 | pyruvate dehydrogenase (acetyl-transferring) activity(GO:0004739) |
| 0.2 | 0.5 | GO:0003845 | 11-beta-hydroxysteroid dehydrogenase [NAD(P)] activity(GO:0003845) |
| 0.2 | 1.4 | GO:0050682 | AF-2 domain binding(GO:0050682) |
| 0.1 | 5.8 | GO:0030332 | cyclin binding(GO:0030332) |
| 0.1 | 4.1 | GO:0005001 | transmembrane receptor protein tyrosine phosphatase activity(GO:0005001) transmembrane receptor protein phosphatase activity(GO:0019198) |
| 0.1 | 6.7 | GO:0004712 | protein serine/threonine/tyrosine kinase activity(GO:0004712) |
| 0.1 | 6.5 | GO:0003899 | DNA-directed RNA polymerase activity(GO:0003899) |
| 0.1 | 4.9 | GO:0050681 | androgen receptor binding(GO:0050681) |
| 0.1 | 1.7 | GO:0044213 | intronic transcription regulatory region sequence-specific DNA binding(GO:0001161) intronic transcription regulatory region DNA binding(GO:0044213) |
| 0.1 | 2.0 | GO:0043395 | heparan sulfate proteoglycan binding(GO:0043395) |
| 0.1 | 3.1 | GO:0022848 | acetylcholine-gated cation channel activity(GO:0022848) |
| 0.1 | 2.9 | GO:0004012 | phospholipid-translocating ATPase activity(GO:0004012) |
| 0.1 | 2.4 | GO:0005523 | tropomyosin binding(GO:0005523) |
| 0.1 | 3.5 | GO:0008395 | steroid hydroxylase activity(GO:0008395) |
| 0.1 | 0.8 | GO:0009008 | DNA-methyltransferase activity(GO:0009008) |
| 0.1 | 4.6 | GO:0015026 | coreceptor activity(GO:0015026) |
| 0.1 | 4.4 | GO:0030374 | ligand-dependent nuclear receptor transcription coactivator activity(GO:0030374) |
| 0.1 | 2.3 | GO:0071837 | HMG box domain binding(GO:0071837) |
| 0.1 | 13.1 | GO:0051015 | actin filament binding(GO:0051015) |
| 0.1 | 0.7 | GO:0005004 | GPI-linked ephrin receptor activity(GO:0005004) |
| 0.1 | 17.1 | GO:0005516 | calmodulin binding(GO:0005516) |
| 0.1 | 4.2 | GO:0043022 | ribosome binding(GO:0043022) |
| 0.1 | 8.3 | GO:0042826 | histone deacetylase binding(GO:0042826) |
| 0.1 | 1.7 | GO:0071855 | neuropeptide receptor binding(GO:0071855) |
| 0.1 | 1.5 | GO:0072349 | modified amino acid transmembrane transporter activity(GO:0072349) |
| 0.1 | 0.6 | GO:0060072 | large conductance calcium-activated potassium channel activity(GO:0060072) |
| 0.1 | 2.7 | GO:0001102 | RNA polymerase II activating transcription factor binding(GO:0001102) |
| 0.1 | 1.2 | GO:0038191 | neuropilin binding(GO:0038191) |
| 0.1 | 3.2 | GO:0070888 | E-box binding(GO:0070888) |
| 0.1 | 3.1 | GO:0017112 | Rab guanyl-nucleotide exchange factor activity(GO:0017112) |
| 0.1 | 5.2 | GO:0004222 | metalloendopeptidase activity(GO:0004222) |
| 0.1 | 1.6 | GO:0004709 | MAP kinase kinase kinase activity(GO:0004709) |
| 0.1 | 7.6 | GO:0008201 | heparin binding(GO:0008201) |
| 0.1 | 0.8 | GO:0043548 | phosphatidylinositol 3-kinase binding(GO:0043548) |
| 0.1 | 2.1 | GO:0004693 | cyclin-dependent protein serine/threonine kinase activity(GO:0004693) |
| 0.1 | 1.0 | GO:0016922 | ligand-dependent nuclear receptor binding(GO:0016922) |
| 0.1 | 1.0 | GO:0043425 | bHLH transcription factor binding(GO:0043425) |
| 0.1 | 18.0 | GO:0030695 | GTPase regulator activity(GO:0030695) |
| 0.0 | 5.4 | GO:0005249 | voltage-gated potassium channel activity(GO:0005249) |
| 0.0 | 1.5 | GO:0017025 | TBP-class protein binding(GO:0017025) |
| 0.0 | 2.5 | GO:0098531 | RNA polymerase II transcription factor activity, ligand-activated sequence-specific DNA binding(GO:0004879) transcription factor activity, direct ligand regulated sequence-specific DNA binding(GO:0098531) |
| 0.0 | 0.2 | GO:0003810 | protein-glutamine gamma-glutamyltransferase activity(GO:0003810) |
| 0.0 | 0.6 | GO:0031957 | very long-chain fatty acid-CoA ligase activity(GO:0031957) |
| 0.0 | 0.8 | GO:0071617 | lysophosphatidic acid acyltransferase activity(GO:0042171) lysophospholipid acyltransferase activity(GO:0071617) |
| 0.0 | 21.2 | GO:0005509 | calcium ion binding(GO:0005509) |
| 0.0 | 0.3 | GO:0017154 | semaphorin receptor activity(GO:0017154) |
| 0.0 | 2.4 | GO:0015171 | amino acid transmembrane transporter activity(GO:0015171) |
| 0.0 | 4.3 | GO:0003823 | antigen binding(GO:0003823) |
| 0.0 | 1.0 | GO:0000049 | tRNA binding(GO:0000049) |
| 0.0 | 1.9 | GO:0004867 | serine-type endopeptidase inhibitor activity(GO:0004867) |
| 0.0 | 0.5 | GO:0005031 | tumor necrosis factor-activated receptor activity(GO:0005031) death receptor activity(GO:0005035) |
| 0.0 | 0.9 | GO:0030170 | pyridoxal phosphate binding(GO:0030170) |
| 0.0 | 1.0 | GO:0051117 | ATPase binding(GO:0051117) |
| 0.0 | 0.4 | GO:0005160 | transforming growth factor beta receptor binding(GO:0005160) |
Gene overrepresentation in curated gene sets: canonical pathways category:
| Log-likelihood per target | Total log-likelihood | Term | Description |
|---|---|---|---|
| 2.1 | 58.7 | PID S1P S1P4 PATHWAY | S1P4 pathway |
| 1.5 | 76.7 | PID P38 ALPHA BETA PATHWAY | Regulation of p38-alpha and p38-beta |
| 1.2 | 29.8 | PID S1P S1P3 PATHWAY | S1P3 pathway |
| 1.0 | 7.9 | PID ECADHERIN NASCENT AJ PATHWAY | E-cadherin signaling in the nascent adherens junction |
| 0.9 | 12.2 | ST JAK STAT PATHWAY | Jak-STAT Pathway |
| 0.9 | 10.3 | PID S1P META PATHWAY | Sphingosine 1-phosphate (S1P) pathway |
| 0.8 | 29.4 | PID P38 MK2 PATHWAY | p38 signaling mediated by MAPKAP kinases |
| 0.8 | 34.7 | ST GRANULE CELL SURVIVAL PATHWAY | Granule Cell Survival Pathway is a specific case of more general PAC1 Receptor Pathway. |
| 0.6 | 24.4 | PID HDAC CLASSIII PATHWAY | Signaling events mediated by HDAC Class III |
| 0.6 | 14.7 | PID INTEGRIN5 PATHWAY | Beta5 beta6 beta7 and beta8 integrin cell surface interactions |
| 0.5 | 20.1 | PID NETRIN PATHWAY | Netrin-mediated signaling events |
| 0.5 | 10.6 | PID IL5 PATHWAY | IL5-mediated signaling events |
| 0.4 | 24.1 | PID TCR CALCIUM PATHWAY | Calcium signaling in the CD4+ TCR pathway |
| 0.4 | 7.1 | PID EPHA FWDPATHWAY | EPHA forward signaling |
| 0.4 | 16.0 | PID RAC1 REG PATHWAY | Regulation of RAC1 activity |
| 0.4 | 1.1 | SA CASPASE CASCADE | Apoptosis is mediated by caspases, cysteine proteases arranged in a proteolytic cascade. |
| 0.3 | 16.1 | PID FANCONI PATHWAY | Fanconi anemia pathway |
| 0.3 | 18.9 | PID RHOA PATHWAY | RhoA signaling pathway |
| 0.3 | 10.4 | PID SYNDECAN 2 PATHWAY | Syndecan-2-mediated signaling events |
| 0.3 | 2.1 | PID P38 GAMMA DELTA PATHWAY | Signaling mediated by p38-gamma and p38-delta |
| 0.3 | 15.4 | PID INTEGRIN A4B1 PATHWAY | Alpha4 beta1 integrin signaling events |
| 0.3 | 1.9 | SA G2 AND M PHASES | Cdc25 activates the cdc2/cyclin B complex to induce the G2/M transition. |
| 0.3 | 3.0 | PID BCR 5PATHWAY | BCR signaling pathway |
| 0.2 | 14.6 | PID ARF6 TRAFFICKING PATHWAY | Arf6 trafficking events |
| 0.2 | 7.1 | ST MYOCYTE AD PATHWAY | Myocyte Adrenergic Pathway is a specific case of the generalized Adrenergic Pathway. |
| 0.2 | 7.8 | PID REELIN PATHWAY | Reelin signaling pathway |
| 0.2 | 3.7 | PID ARF6 DOWNSTREAM PATHWAY | Arf6 downstream pathway |
| 0.2 | 13.9 | PID CDC42 PATHWAY | CDC42 signaling events |
| 0.1 | 7.4 | NABA PROTEOGLYCANS | Genes encoding proteoglycans |
| 0.1 | 1.8 | PID VEGF VEGFR PATHWAY | VEGF and VEGFR signaling network |
| 0.1 | 2.2 | PID LIS1 PATHWAY | Lissencephaly gene (LIS1) in neuronal migration and development |
| 0.1 | 4.2 | SIG REGULATION OF THE ACTIN CYTOSKELETON BY RHO GTPASES | Genes related to regulation of the actin cytoskeleton |
| 0.1 | 1.8 | PID TGFBR PATHWAY | TGF-beta receptor signaling |
| 0.1 | 23.7 | PID P53 DOWNSTREAM PATHWAY | Direct p53 effectors |
| 0.1 | 2.2 | PID IL1 PATHWAY | IL1-mediated signaling events |
| 0.1 | 1.7 | ST GA12 PATHWAY | G alpha 12 Pathway |
| 0.1 | 4.7 | PID INTEGRIN2 PATHWAY | Beta2 integrin cell surface interactions |
| 0.1 | 6.1 | PID DELTA NP63 PATHWAY | Validated transcriptional targets of deltaNp63 isoforms |
| 0.1 | 2.1 | PID ARF 3PATHWAY | Arf1 pathway |
| 0.1 | 1.5 | PID CIRCADIAN PATHWAY | Circadian rhythm pathway |
| 0.1 | 4.2 | PID A6B1 A6B4 INTEGRIN PATHWAY | a6b1 and a6b4 Integrin signaling |
| 0.1 | 2.1 | ST DIFFERENTIATION PATHWAY IN PC12 CELLS | Differentiation Pathway in PC12 Cells; this is a specific case of PAC1 Receptor Pathway. |
| 0.1 | 2.0 | PID GLYPICAN 1PATHWAY | Glypican 1 network |
| 0.1 | 1.7 | NABA BASEMENT MEMBRANES | Genes encoding structural components of basement membranes |
| 0.1 | 2.6 | SIG PIP3 SIGNALING IN CARDIAC MYOCTES | Genes related to PIP3 signaling in cardiac myocytes |
| 0.1 | 3.1 | PID AR TF PATHWAY | Regulation of Androgen receptor activity |
| 0.0 | 2.2 | PID SHP2 PATHWAY | SHP2 signaling |
| 0.0 | 1.1 | PID TOLL ENDOGENOUS PATHWAY | Endogenous TLR signaling |
| 0.0 | 1.3 | PID NCADHERIN PATHWAY | N-cadherin signaling events |
| 0.0 | 1.3 | PID NFAT TFPATHWAY | Calcineurin-regulated NFAT-dependent transcription in lymphocytes |
| 0.0 | 5.2 | NABA ECM GLYCOPROTEINS | Genes encoding structural ECM glycoproteins |
| 0.0 | 5.1 | NABA ECM AFFILIATED | Genes encoding proteins affiliated structurally or functionally to extracellular matrix proteins |
| 0.0 | 1.2 | PID CD8 TCR DOWNSTREAM PATHWAY | Downstream signaling in naïve CD8+ T cells |
| 0.0 | 0.8 | PID FGF PATHWAY | FGF signaling pathway |
| 0.0 | 0.5 | PID IL12 2PATHWAY | IL12-mediated signaling events |
| 0.0 | 0.8 | PID PI3KCI PATHWAY | Class I PI3K signaling events |
| 0.0 | 0.2 | PID IL27 PATHWAY | IL27-mediated signaling events |
| 0.0 | 0.4 | PID RXR VDR PATHWAY | RXR and RAR heterodimerization with other nuclear receptor |
Gene overrepresentation in curated gene sets: REACTOME pathways category:
| Log-likelihood per target | Total log-likelihood | Term | Description |
|---|---|---|---|
| 3.6 | 81.8 | REACTOME DOPAMINE NEUROTRANSMITTER RELEASE CYCLE | Genes involved in Dopamine Neurotransmitter Release Cycle |
| 3.2 | 73.6 | REACTOME CYTOSOLIC SULFONATION OF SMALL MOLECULES | Genes involved in Cytosolic sulfonation of small molecules |
| 3.1 | 9.3 | REACTOME NOREPINEPHRINE NEUROTRANSMITTER RELEASE CYCLE | Genes involved in Norepinephrine Neurotransmitter Release Cycle |
| 1.6 | 66.6 | REACTOME INHIBITION OF INSULIN SECRETION BY ADRENALINE NORADRENALINE | Genes involved in Inhibition of Insulin Secretion by Adrenaline/Noradrenaline |
| 1.3 | 16.1 | REACTOME REGULATION OF THE FANCONI ANEMIA PATHWAY | Genes involved in Regulation of the Fanconi anemia pathway |
| 1.3 | 28.0 | REACTOME INSULIN SYNTHESIS AND PROCESSING | Genes involved in Insulin Synthesis and Processing |
| 1.3 | 34.7 | REACTOME ACTIVATION OF THE AP1 FAMILY OF TRANSCRIPTION FACTORS | Genes involved in Activation of the AP-1 family of transcription factors |
| 1.2 | 14.9 | REACTOME NEGATIVE REGULATION OF THE PI3K AKT NETWORK | Genes involved in Negative regulation of the PI3K/AKT network |
| 0.9 | 33.1 | REACTOME SYNTHESIS SECRETION AND INACTIVATION OF GIP | Genes involved in Synthesis, Secretion, and Inactivation of Glucose-dependent Insulinotropic Polypeptide (GIP) |
| 0.8 | 21.4 | REACTOME INSULIN RECEPTOR RECYCLING | Genes involved in Insulin receptor recycling |
| 0.8 | 22.4 | REACTOME POST CHAPERONIN TUBULIN FOLDING PATHWAY | Genes involved in Post-chaperonin tubulin folding pathway |
| 0.7 | 31.6 | REACTOME INTERACTION BETWEEN L1 AND ANKYRINS | Genes involved in Interaction between L1 and Ankyrins |
| 0.6 | 3.2 | REACTOME DSCAM INTERACTIONS | Genes involved in DSCAM interactions |
| 0.6 | 9.7 | REACTOME REGULATION OF PYRUVATE DEHYDROGENASE PDH COMPLEX | Genes involved in Regulation of pyruvate dehydrogenase (PDH) complex |
| 0.6 | 19.8 | REACTOME IONOTROPIC ACTIVITY OF KAINATE RECEPTORS | Genes involved in Ionotropic activity of Kainate Receptors |
| 0.5 | 7.4 | REACTOME GAP JUNCTION DEGRADATION | Genes involved in Gap junction degradation |
| 0.5 | 10.2 | REACTOME SHC RELATED EVENTS | Genes involved in SHC-related events |
| 0.5 | 8.5 | REACTOME VEGF LIGAND RECEPTOR INTERACTIONS | Genes involved in VEGF ligand-receptor interactions |
| 0.5 | 2.7 | REACTOME INCRETIN SYNTHESIS SECRETION AND INACTIVATION | Genes involved in Incretin Synthesis, Secretion, and Inactivation |
| 0.4 | 13.4 | REACTOME EGFR DOWNREGULATION | Genes involved in EGFR downregulation |
| 0.4 | 11.4 | REACTOME CHONDROITIN SULFATE BIOSYNTHESIS | Genes involved in Chondroitin sulfate biosynthesis |
| 0.4 | 6.5 | REACTOME P38MAPK EVENTS | Genes involved in p38MAPK events |
| 0.4 | 7.9 | REACTOME APOPTOTIC CLEAVAGE OF CELL ADHESION PROTEINS | Genes involved in Apoptotic cleavage of cell adhesion proteins |
| 0.4 | 12.6 | REACTOME YAP1 AND WWTR1 TAZ STIMULATED GENE EXPRESSION | Genes involved in YAP1- and WWTR1 (TAZ)-stimulated gene expression |
| 0.3 | 8.9 | REACTOME DCC MEDIATED ATTRACTIVE SIGNALING | Genes involved in DCC mediated attractive signaling |
| 0.3 | 3.7 | REACTOME RECRUITMENT OF NUMA TO MITOTIC CENTROSOMES | Genes involved in Recruitment of NuMA to mitotic centrosomes |
| 0.3 | 6.7 | REACTOME CLASS C 3 METABOTROPIC GLUTAMATE PHEROMONE RECEPTORS | Genes involved in Class C/3 (Metabotropic glutamate/pheromone receptors) |
| 0.3 | 5.7 | REACTOME PLATELET ADHESION TO EXPOSED COLLAGEN | Genes involved in Platelet Adhesion to exposed collagen |
| 0.3 | 3.6 | REACTOME COPI MEDIATED TRANSPORT | Genes involved in COPI Mediated Transport |
| 0.3 | 12.3 | REACTOME GABA A RECEPTOR ACTIVATION | Genes involved in GABA A receptor activation |
| 0.3 | 3.3 | REACTOME SCF BETA TRCP MEDIATED DEGRADATION OF EMI1 | Genes involved in SCF-beta-TrCP mediated degradation of Emi1 |
| 0.3 | 4.1 | REACTOME ACTIVATION OF RAC | Genes involved in Activation of Rac |
| 0.3 | 7.8 | REACTOME PKA MEDIATED PHOSPHORYLATION OF CREB | Genes involved in PKA-mediated phosphorylation of CREB |
| 0.2 | 6.9 | REACTOME GLUTATHIONE CONJUGATION | Genes involved in Glutathione conjugation |
| 0.2 | 63.2 | REACTOME METABOLISM OF AMINO ACIDS AND DERIVATIVES | Genes involved in Metabolism of amino acids and derivatives |
| 0.2 | 31.3 | REACTOME G ALPHA S SIGNALLING EVENTS | Genes involved in G alpha (s) signalling events |
| 0.2 | 11.2 | REACTOME AMINO ACID AND OLIGOPEPTIDE SLC TRANSPORTERS | Genes involved in Amino acid and oligopeptide SLC transporters |
| 0.2 | 18.6 | REACTOME NUCLEAR RECEPTOR TRANSCRIPTION PATHWAY | Genes involved in Nuclear Receptor transcription pathway |
| 0.2 | 3.2 | REACTOME TGF BETA RECEPTOR SIGNALING IN EMT EPITHELIAL TO MESENCHYMAL TRANSITION | Genes involved in TGF-beta receptor signaling in EMT (epithelial to mesenchymal transition) |
| 0.2 | 4.2 | REACTOME DOWNREGULATION OF ERBB2 ERBB3 SIGNALING | Genes involved in Downregulation of ERBB2:ERBB3 signaling |
| 0.2 | 10.6 | REACTOME ACTIVATION OF CHAPERONE GENES BY XBP1S | Genes involved in Activation of Chaperone Genes by XBP1(S) |
| 0.2 | 3.6 | REACTOME TERMINATION OF O GLYCAN BIOSYNTHESIS | Genes involved in Termination of O-glycan biosynthesis |
| 0.2 | 15.8 | REACTOME GLYCEROPHOSPHOLIPID BIOSYNTHESIS | Genes involved in Glycerophospholipid biosynthesis |
| 0.1 | 17.7 | REACTOME CELL SURFACE INTERACTIONS AT THE VASCULAR WALL | Genes involved in Cell surface interactions at the vascular wall |
| 0.1 | 3.1 | REACTOME PRESYNAPTIC NICOTINIC ACETYLCHOLINE RECEPTORS | Genes involved in Presynaptic nicotinic acetylcholine receptors |
| 0.1 | 1.9 | REACTOME PASSIVE TRANSPORT BY AQUAPORINS | Genes involved in Passive Transport by Aquaporins |
| 0.1 | 27.8 | REACTOME G ALPHA I SIGNALLING EVENTS | Genes involved in G alpha (i) signalling events |
| 0.1 | 1.1 | REACTOME IRAK1 RECRUITS IKK COMPLEX | Genes involved in IRAK1 recruits IKK complex |
| 0.1 | 13.5 | REACTOME SIGNALING BY PDGF | Genes involved in Signaling by PDGF |
| 0.1 | 3.5 | REACTOME SYNTHESIS OF BILE ACIDS AND BILE SALTS | Genes involved in Synthesis of bile acids and bile salts |
| 0.1 | 4.2 | REACTOME RNA POL III TRANSCRIPTION INITIATION FROM TYPE 3 PROMOTER | Genes involved in RNA Polymerase III Transcription Initiation From Type 3 Promoter |
| 0.1 | 2.5 | REACTOME SIGNALING BY FGFR3 MUTANTS | Genes involved in Signaling by FGFR3 mutants |
| 0.1 | 3.0 | REACTOME ELONGATION ARREST AND RECOVERY | Genes involved in Elongation arrest and recovery |
| 0.1 | 5.8 | REACTOME VOLTAGE GATED POTASSIUM CHANNELS | Genes involved in Voltage gated Potassium channels |
| 0.1 | 0.6 | REACTOME ROLE OF SECOND MESSENGERS IN NETRIN1 SIGNALING | Genes involved in Role of second messengers in netrin-1 signaling |
| 0.1 | 4.6 | REACTOME NRAGE SIGNALS DEATH THROUGH JNK | Genes involved in NRAGE signals death through JNK |
| 0.1 | 4.5 | REACTOME POTASSIUM CHANNELS | Genes involved in Potassium Channels |
| 0.1 | 0.5 | REACTOME MEMBRANE BINDING AND TARGETTING OF GAG PROTEINS | Genes involved in Membrane binding and targetting of GAG proteins |
| 0.1 | 7.2 | REACTOME PPARA ACTIVATES GENE EXPRESSION | Genes involved in PPARA Activates Gene Expression |
| 0.1 | 1.5 | REACTOME PRE NOTCH PROCESSING IN GOLGI | Genes involved in Pre-NOTCH Processing in Golgi |
| 0.1 | 2.9 | REACTOME ION TRANSPORT BY P TYPE ATPASES | Genes involved in Ion transport by P-type ATPases |
| 0.1 | 0.1 | REACTOME ACETYLCHOLINE NEUROTRANSMITTER RELEASE CYCLE | Genes involved in Acetylcholine Neurotransmitter Release Cycle |
| 0.1 | 1.5 | REACTOME REGULATION OF BETA CELL DEVELOPMENT | Genes involved in Regulation of beta-cell development |
| 0.0 | 1.0 | REACTOME BMAL1 CLOCK NPAS2 ACTIVATES CIRCADIAN EXPRESSION | Genes involved in BMAL1:CLOCK/NPAS2 Activates Circadian Expression |
| 0.0 | 0.4 | REACTOME ION CHANNEL TRANSPORT | Genes involved in Ion channel transport |
| 0.0 | 0.5 | REACTOME REGULATION OF RHEB GTPASE ACTIVITY BY AMPK | Genes involved in Regulation of Rheb GTPase activity by AMPK |
| 0.0 | 0.3 | REACTOME SEMA3A PLEXIN REPULSION SIGNALING BY INHIBITING INTEGRIN ADHESION | Genes involved in SEMA3A-Plexin repulsion signaling by inhibiting Integrin adhesion |
| 0.0 | 3.4 | REACTOME G ALPHA Q SIGNALLING EVENTS | Genes involved in G alpha (q) signalling events |
| 0.0 | 0.5 | REACTOME STEROID HORMONES | Genes involved in Steroid hormones |
| 0.0 | 0.3 | REACTOME PROTEOLYTIC CLEAVAGE OF SNARE COMPLEX PROTEINS | Genes involved in Proteolytic cleavage of SNARE complex proteins |
| 0.0 | 1.2 | REACTOME IMMUNOREGULATORY INTERACTIONS BETWEEN A LYMPHOID AND A NON LYMPHOID CELL | Genes involved in Immunoregulatory interactions between a Lymphoid and a non-Lymphoid cell |