Project
GNF SymAtlas + NCI-60 cancer cell lines, human (Su, 2004; Ross, 2000)
Navigation
Downloads
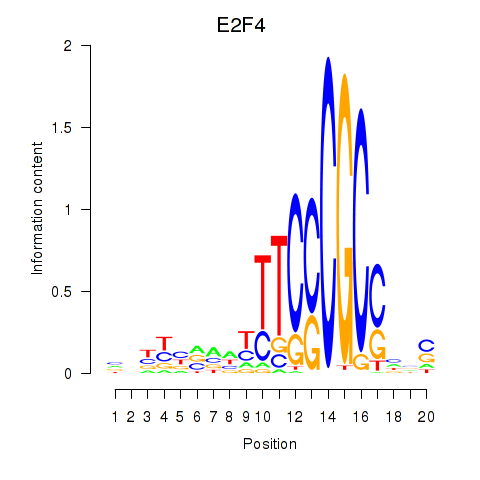
Results for E2F4
Z-value: 0.99
Motif logo
Transcription factors associated with E2F4
| Gene Symbol | Gene ID | Gene Info |
|---|---|---|
|
E2F4
|
ENSG00000205250.9 | E2F4 |
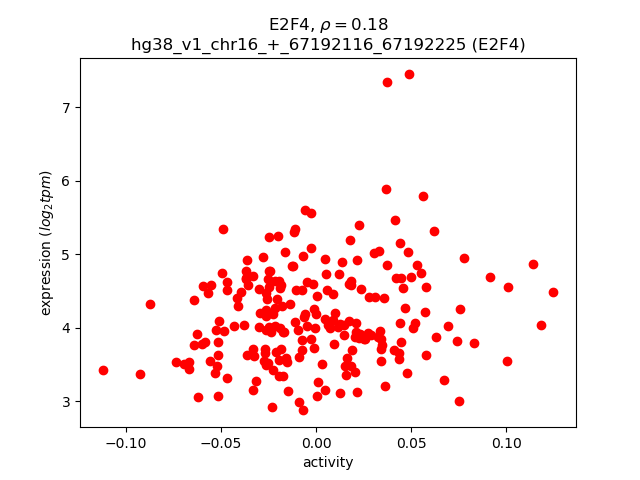
Activity-expression correlation:
| Gene | Promoter | Pearson corr. coef. | P-value | Plot |
|---|---|---|---|---|
| E2F4 | hg38_v1_chr16_+_67192116_67192225 | 0.18 | 8.3e-03 | Click! |
Activity profile of E2F4 motif
Sorted Z-values of E2F4 motif
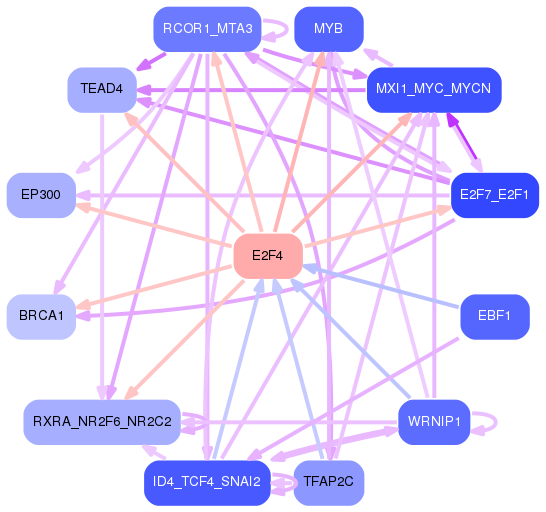
Network of associatons between targets according to the STRING database.

First level regulatory network of E2F4
Gene Ontology Analysis
Gene overrepresentation in biological process category:
| Log-likelihood per target | Total log-likelihood | Term | Description |
|---|---|---|---|
| 12.8 | 38.4 | GO:0009786 | regulation of asymmetric cell division(GO:0009786) |
| 8.8 | 26.5 | GO:0010520 | meiotic gene conversion(GO:0006311) regulation of reciprocal meiotic recombination(GO:0010520) |
| 7.7 | 23.2 | GO:1990922 | regulation of hepatic stellate cell proliferation(GO:1904897) positive regulation of hepatic stellate cell proliferation(GO:1904899) hepatic stellate cell proliferation(GO:1990922) |
| 5.0 | 19.9 | GO:0090096 | metanephric cap development(GO:0072185) metanephric cap morphogenesis(GO:0072186) metanephric cap mesenchymal cell proliferation involved in metanephros development(GO:0090094) regulation of metanephric cap mesenchymal cell proliferation(GO:0090095) positive regulation of metanephric cap mesenchymal cell proliferation(GO:0090096) |
| 4.4 | 57.4 | GO:0006268 | DNA unwinding involved in DNA replication(GO:0006268) |
| 4.2 | 37.7 | GO:0034723 | DNA replication-dependent nucleosome assembly(GO:0006335) DNA replication-dependent nucleosome organization(GO:0034723) |
| 3.8 | 95.1 | GO:0009263 | deoxyribonucleotide biosynthetic process(GO:0009263) |
| 3.7 | 22.3 | GO:0006398 | mRNA 3'-end processing by stem-loop binding and cleavage(GO:0006398) |
| 3.3 | 16.7 | GO:1900264 | regulation of DNA-directed DNA polymerase activity(GO:1900262) positive regulation of DNA-directed DNA polymerase activity(GO:1900264) |
| 3.3 | 9.9 | GO:1902299 | pre-replicative complex assembly involved in nuclear cell cycle DNA replication(GO:0006267) pre-replicative complex assembly(GO:0036388) pre-replicative complex assembly involved in cell cycle DNA replication(GO:1902299) |
| 3.2 | 9.7 | GO:0046452 | dihydrofolate metabolic process(GO:0046452) |
| 2.9 | 11.6 | GO:1904117 | traversing start control point of mitotic cell cycle(GO:0007089) response to vasopressin(GO:1904116) cellular response to vasopressin(GO:1904117) |
| 2.8 | 8.3 | GO:0006166 | purine ribonucleoside salvage(GO:0006166) |
| 2.7 | 8.0 | GO:0070510 | regulation of histone H4-K20 methylation(GO:0070510) positive regulation of histone H4-K20 methylation(GO:0070512) |
| 2.5 | 7.6 | GO:0018312 | peptidyl-serine ADP-ribosylation(GO:0018312) |
| 2.4 | 4.9 | GO:0043504 | mitochondrial DNA repair(GO:0043504) |
| 2.2 | 13.4 | GO:0015853 | adenine transport(GO:0015853) |
| 1.8 | 11.0 | GO:0000727 | double-strand break repair via break-induced replication(GO:0000727) |
| 1.7 | 5.2 | GO:0071163 | DNA replication preinitiation complex assembly(GO:0071163) regulation of DNA replication origin binding(GO:1902595) |
| 1.7 | 20.4 | GO:0045654 | positive regulation of megakaryocyte differentiation(GO:0045654) |
| 1.7 | 5.1 | GO:0044205 | 'de novo' UMP biosynthetic process(GO:0044205) |
| 1.6 | 4.8 | GO:1904742 | regulation of telomeric DNA binding(GO:1904742) |
| 1.6 | 4.7 | GO:0034085 | establishment of sister chromatid cohesion(GO:0034085) regulation of chromosome condensation(GO:0060623) cohesin loading(GO:0071921) regulation of cohesin loading(GO:0071922) |
| 1.6 | 9.4 | GO:0010032 | meiotic chromosome condensation(GO:0010032) |
| 1.5 | 9.2 | GO:0071460 | cellular response to cell-matrix adhesion(GO:0071460) |
| 1.5 | 10.6 | GO:0070562 | regulation of vitamin D receptor signaling pathway(GO:0070562) |
| 1.3 | 9.1 | GO:0006662 | glycerol ether metabolic process(GO:0006662) |
| 1.3 | 3.8 | GO:0001732 | formation of cytoplasmic translation initiation complex(GO:0001732) |
| 1.3 | 16.4 | GO:2001032 | regulation of double-strand break repair via nonhomologous end joining(GO:2001032) |
| 1.3 | 8.8 | GO:0000389 | mRNA 3'-splice site recognition(GO:0000389) |
| 1.2 | 10.8 | GO:0031936 | negative regulation of chromatin silencing(GO:0031936) |
| 1.2 | 12.8 | GO:2000645 | negative regulation of receptor catabolic process(GO:2000645) |
| 1.1 | 4.6 | GO:0033567 | DNA replication, Okazaki fragment processing(GO:0033567) |
| 1.1 | 3.4 | GO:0051821 | negative regulation of transcription from RNA polymerase II promoter in response to UV-induced DNA damage(GO:0010768) transmission of virus(GO:0019089) dissemination or transmission of symbiont from host(GO:0044007) development involved in symbiotic interaction(GO:0044111) dissemination or transmission of organism from other organism involved in symbiotic interaction(GO:0051821) |
| 1.1 | 5.6 | GO:0006177 | GMP biosynthetic process(GO:0006177) |
| 1.1 | 11.8 | GO:0007144 | female meiosis I(GO:0007144) |
| 1.1 | 3.2 | GO:0000965 | mitochondrial RNA 3'-end processing(GO:0000965) |
| 1.0 | 3.0 | GO:0015798 | myo-inositol transport(GO:0015798) |
| 0.9 | 3.8 | GO:0007538 | primary sex determination(GO:0007538) |
| 0.9 | 8.5 | GO:0000710 | meiotic mismatch repair(GO:0000710) |
| 0.9 | 2.8 | GO:0018406 | protein C-linked glycosylation(GO:0018103) peptidyl-tryptophan modification(GO:0018211) protein C-linked glycosylation via tryptophan(GO:0018317) protein C-linked glycosylation via 2'-alpha-mannosyl-L-tryptophan(GO:0018406) |
| 0.9 | 4.6 | GO:0031022 | nuclear migration along microfilament(GO:0031022) |
| 0.9 | 5.4 | GO:0003164 | His-Purkinje system development(GO:0003164) |
| 0.9 | 4.4 | GO:0006535 | cysteine biosynthetic process from serine(GO:0006535) |
| 0.8 | 4.1 | GO:0044806 | G-quadruplex DNA unwinding(GO:0044806) cellular response to camptothecin(GO:0072757) |
| 0.8 | 4.0 | GO:0019348 | dolichol metabolic process(GO:0019348) |
| 0.8 | 7.2 | GO:0009157 | deoxyribonucleoside monophosphate biosynthetic process(GO:0009157) |
| 0.8 | 7.7 | GO:0001833 | inner cell mass cell proliferation(GO:0001833) |
| 0.7 | 2.8 | GO:1990086 | lens fiber cell apoptotic process(GO:1990086) |
| 0.7 | 7.5 | GO:0010756 | positive regulation of plasminogen activation(GO:0010756) |
| 0.7 | 2.7 | GO:0002501 | peptide antigen assembly with MHC protein complex(GO:0002501) |
| 0.7 | 8.5 | GO:2000271 | positive regulation of fibroblast apoptotic process(GO:2000271) |
| 0.6 | 2.6 | GO:0046121 | deoxyribonucleoside catabolic process(GO:0046121) |
| 0.6 | 10.4 | GO:0032201 | telomere maintenance via semi-conservative replication(GO:0032201) |
| 0.6 | 7.3 | GO:2000628 | regulation of miRNA metabolic process(GO:2000628) |
| 0.6 | 1.8 | GO:0006421 | asparaginyl-tRNA aminoacylation(GO:0006421) |
| 0.6 | 19.1 | GO:0006270 | DNA replication initiation(GO:0006270) |
| 0.6 | 4.0 | GO:0090666 | scaRNA localization to Cajal body(GO:0090666) |
| 0.6 | 1.7 | GO:0090521 | glomerular visceral epithelial cell migration(GO:0090521) |
| 0.6 | 2.8 | GO:0018076 | N-terminal peptidyl-lysine acetylation(GO:0018076) |
| 0.6 | 1.7 | GO:0003099 | positive regulation of the force of heart contraction by chemical signal(GO:0003099) |
| 0.5 | 4.7 | GO:0000290 | deadenylation-dependent decapping of nuclear-transcribed mRNA(GO:0000290) |
| 0.5 | 2.1 | GO:0035986 | senescence-associated heterochromatin focus assembly(GO:0035986) |
| 0.5 | 10.1 | GO:0007095 | mitotic G2 DNA damage checkpoint(GO:0007095) |
| 0.5 | 6.0 | GO:0001682 | tRNA 5'-leader removal(GO:0001682) |
| 0.5 | 9.8 | GO:0008334 | histone mRNA metabolic process(GO:0008334) |
| 0.5 | 2.4 | GO:0010825 | positive regulation of centrosome duplication(GO:0010825) |
| 0.5 | 2.9 | GO:0051694 | pointed-end actin filament capping(GO:0051694) |
| 0.5 | 2.9 | GO:0006021 | inositol biosynthetic process(GO:0006021) |
| 0.5 | 11.7 | GO:0051290 | protein heterotetramerization(GO:0051290) |
| 0.5 | 3.7 | GO:0097411 | hypoxia-inducible factor-1alpha signaling pathway(GO:0097411) |
| 0.4 | 3.0 | GO:0031339 | negative regulation of vesicle fusion(GO:0031339) |
| 0.4 | 1.3 | GO:0031990 | regulation of chromatin assembly(GO:0010847) mRNA export from nucleus in response to heat stress(GO:0031990) positive regulation of chromatin assembly or disassembly(GO:0045799) |
| 0.4 | 3.6 | GO:0060235 | lens induction in camera-type eye(GO:0060235) |
| 0.4 | 5.2 | GO:0071372 | cellular response to follicle-stimulating hormone stimulus(GO:0071372) |
| 0.4 | 1.6 | GO:0010266 | response to vitamin B1(GO:0010266) |
| 0.4 | 8.0 | GO:0042532 | negative regulation of tyrosine phosphorylation of STAT protein(GO:0042532) |
| 0.4 | 1.9 | GO:0007386 | compartment pattern specification(GO:0007386) |
| 0.4 | 6.8 | GO:0044030 | regulation of DNA methylation(GO:0044030) |
| 0.4 | 3.3 | GO:0035608 | protein deglutamylation(GO:0035608) |
| 0.4 | 9.9 | GO:0043968 | histone H2A acetylation(GO:0043968) |
| 0.3 | 2.4 | GO:0010499 | proteasomal ubiquitin-independent protein catabolic process(GO:0010499) |
| 0.3 | 2.0 | GO:0046654 | tetrahydrofolate biosynthetic process(GO:0046654) |
| 0.3 | 2.3 | GO:0061087 | positive regulation of histone H3-K27 methylation(GO:0061087) |
| 0.3 | 3.2 | GO:0000712 | resolution of meiotic recombination intermediates(GO:0000712) |
| 0.3 | 1.3 | GO:0003415 | chondrocyte hypertrophy(GO:0003415) |
| 0.3 | 1.3 | GO:0035407 | histone H3-T11 phosphorylation(GO:0035407) |
| 0.3 | 4.6 | GO:0035970 | peptidyl-threonine dephosphorylation(GO:0035970) |
| 0.3 | 6.3 | GO:0070935 | 3'-UTR-mediated mRNA stabilization(GO:0070935) |
| 0.3 | 3.9 | GO:0021796 | cerebral cortex regionalization(GO:0021796) |
| 0.3 | 24.1 | GO:0032392 | DNA geometric change(GO:0032392) |
| 0.3 | 1.2 | GO:0072711 | cellular response to hydroxyurea(GO:0072711) |
| 0.3 | 1.7 | GO:0030538 | embryonic genitalia morphogenesis(GO:0030538) embryonic hindgut morphogenesis(GO:0048619) |
| 0.3 | 2.5 | GO:0098902 | regulation of membrane depolarization during action potential(GO:0098902) |
| 0.3 | 1.4 | GO:2000042 | negative regulation of double-strand break repair via homologous recombination(GO:2000042) |
| 0.3 | 4.7 | GO:0042761 | fatty acid elongation(GO:0030497) very long-chain fatty acid biosynthetic process(GO:0042761) |
| 0.3 | 2.2 | GO:0033211 | adiponectin-activated signaling pathway(GO:0033211) |
| 0.3 | 4.9 | GO:0006750 | glutathione biosynthetic process(GO:0006750) |
| 0.3 | 1.3 | GO:0042276 | error-prone translesion synthesis(GO:0042276) |
| 0.3 | 1.6 | GO:0043985 | histone H4-R3 methylation(GO:0043985) |
| 0.3 | 8.4 | GO:0006363 | termination of RNA polymerase I transcription(GO:0006363) |
| 0.3 | 6.3 | GO:2000637 | positive regulation of posttranscriptional gene silencing(GO:0060148) positive regulation of gene silencing by miRNA(GO:2000637) |
| 0.3 | 22.1 | GO:0032781 | positive regulation of ATPase activity(GO:0032781) |
| 0.3 | 2.8 | GO:0070933 | histone H4 deacetylation(GO:0070933) |
| 0.3 | 3.0 | GO:0014894 | response to muscle inactivity involved in regulation of muscle adaptation(GO:0014877) response to denervation involved in regulation of muscle adaptation(GO:0014894) |
| 0.3 | 9.3 | GO:0006409 | tRNA export from nucleus(GO:0006409) tRNA-containing ribonucleoprotein complex export from nucleus(GO:0071431) |
| 0.2 | 1.0 | GO:0072133 | kidney mesenchyme morphogenesis(GO:0072131) metanephric mesenchyme morphogenesis(GO:0072133) |
| 0.2 | 0.7 | GO:0006432 | phenylalanyl-tRNA aminoacylation(GO:0006432) |
| 0.2 | 2.1 | GO:0000012 | single strand break repair(GO:0000012) |
| 0.2 | 1.6 | GO:0040031 | snRNA modification(GO:0040031) |
| 0.2 | 3.9 | GO:0034975 | protein folding in endoplasmic reticulum(GO:0034975) |
| 0.2 | 2.8 | GO:0000715 | nucleotide-excision repair, DNA damage recognition(GO:0000715) |
| 0.2 | 2.3 | GO:1904322 | response to forskolin(GO:1904321) cellular response to forskolin(GO:1904322) |
| 0.2 | 1.8 | GO:0089700 | protein kinase D signaling(GO:0089700) |
| 0.2 | 1.0 | GO:0008063 | Toll signaling pathway(GO:0008063) |
| 0.2 | 0.4 | GO:0003420 | regulation of growth plate cartilage chondrocyte proliferation(GO:0003420) |
| 0.2 | 0.6 | GO:0061536 | glycine secretion(GO:0061536) glycine secretion, neurotransmission(GO:0061537) |
| 0.2 | 18.5 | GO:0071427 | mRNA export from nucleus(GO:0006406) mRNA-containing ribonucleoprotein complex export from nucleus(GO:0071427) |
| 0.2 | 3.0 | GO:0006488 | dolichol-linked oligosaccharide biosynthetic process(GO:0006488) |
| 0.2 | 2.7 | GO:0043248 | proteasome assembly(GO:0043248) |
| 0.2 | 2.6 | GO:0030150 | protein import into mitochondrial matrix(GO:0030150) |
| 0.2 | 4.5 | GO:0006337 | nucleosome disassembly(GO:0006337) |
| 0.2 | 0.6 | GO:0071802 | negative regulation of podosome assembly(GO:0071802) |
| 0.1 | 1.3 | GO:1902897 | regulation of postsynaptic density protein 95 clustering(GO:1902897) |
| 0.1 | 1.9 | GO:0010668 | ectodermal cell differentiation(GO:0010668) |
| 0.1 | 0.7 | GO:0042986 | positive regulation of amyloid precursor protein biosynthetic process(GO:0042986) |
| 0.1 | 1.8 | GO:0006610 | ribosomal protein import into nucleus(GO:0006610) |
| 0.1 | 4.1 | GO:0009649 | entrainment of circadian clock(GO:0009649) |
| 0.1 | 1.0 | GO:2000587 | negative regulation of platelet-derived growth factor receptor-beta signaling pathway(GO:2000587) |
| 0.1 | 1.7 | GO:0007016 | cytoskeletal anchoring at plasma membrane(GO:0007016) |
| 0.1 | 5.0 | GO:0035329 | hippo signaling(GO:0035329) |
| 0.1 | 5.7 | GO:0051123 | RNA polymerase II transcriptional preinitiation complex assembly(GO:0051123) |
| 0.1 | 4.0 | GO:0048255 | mRNA stabilization(GO:0048255) |
| 0.1 | 0.5 | GO:1904381 | Golgi apparatus mannose trimming(GO:1904381) |
| 0.1 | 0.8 | GO:0031087 | deadenylation-independent decapping of nuclear-transcribed mRNA(GO:0031087) |
| 0.1 | 1.6 | GO:0006122 | mitochondrial electron transport, ubiquinol to cytochrome c(GO:0006122) |
| 0.1 | 2.1 | GO:0016254 | preassembly of GPI anchor in ER membrane(GO:0016254) |
| 0.1 | 1.7 | GO:0006607 | NLS-bearing protein import into nucleus(GO:0006607) |
| 0.1 | 0.7 | GO:0002051 | osteoblast fate commitment(GO:0002051) |
| 0.1 | 6.7 | GO:0001541 | ovarian follicle development(GO:0001541) |
| 0.1 | 8.4 | GO:0060999 | positive regulation of dendritic spine development(GO:0060999) |
| 0.1 | 1.7 | GO:0040015 | negative regulation of multicellular organism growth(GO:0040015) |
| 0.1 | 12.3 | GO:0043488 | regulation of mRNA stability(GO:0043488) |
| 0.1 | 1.5 | GO:0048172 | regulation of short-term neuronal synaptic plasticity(GO:0048172) |
| 0.1 | 5.3 | GO:0030490 | maturation of SSU-rRNA(GO:0030490) |
| 0.1 | 6.2 | GO:0006611 | protein export from nucleus(GO:0006611) |
| 0.1 | 1.9 | GO:0019371 | cyclooxygenase pathway(GO:0019371) |
| 0.1 | 0.3 | GO:2000270 | negative regulation of fibroblast apoptotic process(GO:2000270) |
| 0.1 | 7.4 | GO:0045071 | negative regulation of viral genome replication(GO:0045071) |
| 0.1 | 3.6 | GO:0030224 | monocyte differentiation(GO:0030224) |
| 0.1 | 2.0 | GO:2000144 | positive regulation of DNA-templated transcription, initiation(GO:2000144) |
| 0.1 | 4.7 | GO:0071806 | protein transmembrane transport(GO:0071806) |
| 0.1 | 1.0 | GO:0035162 | embryonic hemopoiesis(GO:0035162) |
| 0.1 | 4.2 | GO:0006306 | DNA alkylation(GO:0006305) DNA methylation(GO:0006306) |
| 0.1 | 0.6 | GO:1902414 | protein localization to cell junction(GO:1902414) |
| 0.1 | 2.9 | GO:0051028 | mRNA transport(GO:0051028) |
| 0.1 | 0.7 | GO:0035518 | histone H2A monoubiquitination(GO:0035518) |
| 0.1 | 0.6 | GO:0098914 | membrane repolarization during atrial cardiac muscle cell action potential(GO:0098914) |
| 0.1 | 4.0 | GO:0035722 | interleukin-12-mediated signaling pathway(GO:0035722) cellular response to interleukin-12(GO:0071349) |
| 0.1 | 3.9 | GO:0045454 | cell redox homeostasis(GO:0045454) |
| 0.1 | 1.2 | GO:0036344 | platelet morphogenesis(GO:0036344) |
| 0.0 | 3.7 | GO:0070125 | mitochondrial translational elongation(GO:0070125) |
| 0.0 | 0.3 | GO:0010606 | positive regulation of cytoplasmic mRNA processing body assembly(GO:0010606) |
| 0.0 | 5.3 | GO:0051225 | spindle assembly(GO:0051225) |
| 0.0 | 1.7 | GO:0042491 | auditory receptor cell differentiation(GO:0042491) |
| 0.0 | 1.2 | GO:0007080 | mitotic metaphase plate congression(GO:0007080) |
| 0.0 | 1.6 | GO:0010824 | regulation of centrosome duplication(GO:0010824) |
| 0.0 | 0.8 | GO:0001921 | positive regulation of receptor recycling(GO:0001921) |
| 0.0 | 3.2 | GO:0032436 | positive regulation of proteasomal ubiquitin-dependent protein catabolic process(GO:0032436) |
| 0.0 | 0.8 | GO:0045724 | positive regulation of cilium assembly(GO:0045724) |
| 0.0 | 2.5 | GO:0006120 | mitochondrial electron transport, NADH to ubiquinone(GO:0006120) |
| 0.0 | 0.4 | GO:0021800 | cerebral cortex tangential migration(GO:0021800) interneuron migration from the subpallium to the cortex(GO:0021830) cerebral cortex GABAergic interneuron migration(GO:0021853) interneuron migration(GO:1904936) |
| 0.0 | 0.3 | GO:0006777 | Mo-molybdopterin cofactor biosynthetic process(GO:0006777) Mo-molybdopterin cofactor metabolic process(GO:0019720) |
| 0.0 | 2.6 | GO:0031110 | regulation of microtubule polymerization or depolymerization(GO:0031110) |
| 0.0 | 0.9 | GO:0007216 | G-protein coupled glutamate receptor signaling pathway(GO:0007216) |
| 0.0 | 0.9 | GO:1903077 | negative regulation of protein localization to plasma membrane(GO:1903077) negative regulation of protein localization to cell periphery(GO:1904376) |
| 0.0 | 1.2 | GO:0021795 | cerebral cortex cell migration(GO:0021795) |
| 0.0 | 4.6 | GO:0046718 | viral entry into host cell(GO:0046718) |
| 0.0 | 0.9 | GO:0006284 | base-excision repair(GO:0006284) |
| 0.0 | 0.1 | GO:0070650 | endoplasmic reticulum polarization(GO:0061163) actin filament bundle retrograde transport(GO:0061573) actin filament bundle distribution(GO:0070650) |
| 0.0 | 0.2 | GO:0070459 | prolactin secretion(GO:0070459) |
| 0.0 | 2.2 | GO:0070268 | cornification(GO:0070268) |
| 0.0 | 0.6 | GO:0006303 | double-strand break repair via nonhomologous end joining(GO:0006303) |
| 0.0 | 0.9 | GO:0001510 | RNA methylation(GO:0001510) |
| 0.0 | 0.4 | GO:0006376 | mRNA splice site selection(GO:0006376) |
| 0.0 | 1.6 | GO:0006911 | phagocytosis, engulfment(GO:0006911) |
| 0.0 | 0.4 | GO:0016578 | histone deubiquitination(GO:0016578) |
| 0.0 | 3.6 | GO:0042254 | ribosome biogenesis(GO:0042254) |
| 0.0 | 0.3 | GO:0042590 | antigen processing and presentation of exogenous peptide antigen via MHC class I(GO:0042590) |
| 0.0 | 0.3 | GO:0019372 | lipoxygenase pathway(GO:0019372) |
Gene overrepresentation in cellular component category:
| Log-likelihood per target | Total log-likelihood | Term | Description |
|---|---|---|---|
| 21.2 | 84.9 | GO:0005971 | ribonucleoside-diphosphate reductase complex(GO:0005971) |
| 7.0 | 35.0 | GO:0032301 | MutSalpha complex(GO:0032301) |
| 4.8 | 62.8 | GO:0042555 | MCM complex(GO:0042555) |
| 4.6 | 18.6 | GO:0033186 | CAF-1 complex(GO:0033186) |
| 3.8 | 34.6 | GO:0036449 | microtubule minus-end(GO:0036449) |
| 3.3 | 9.9 | GO:0036387 | nuclear pre-replicative complex(GO:0005656) pre-replicative complex(GO:0036387) |
| 2.9 | 20.3 | GO:0005663 | DNA replication factor C complex(GO:0005663) |
| 2.3 | 13.7 | GO:0001940 | male pronucleus(GO:0001940) |
| 2.1 | 8.5 | GO:0071942 | XPC complex(GO:0071942) |
| 2.1 | 10.6 | GO:0005726 | perichromatin fibrils(GO:0005726) |
| 2.1 | 16.5 | GO:0000796 | condensin complex(GO:0000796) |
| 2.0 | 22.3 | GO:0071204 | histone pre-mRNA 3'end processing complex(GO:0071204) |
| 2.0 | 9.8 | GO:0005683 | U7 snRNP(GO:0005683) |
| 1.6 | 8.0 | GO:0031436 | BRCA1-BARD1 complex(GO:0031436) |
| 1.5 | 4.5 | GO:0005760 | gamma DNA polymerase complex(GO:0005760) |
| 1.3 | 4.0 | GO:0097135 | cyclin E2-CDK2 complex(GO:0097135) |
| 1.3 | 5.3 | GO:0034457 | Mpp10 complex(GO:0034457) |
| 1.1 | 3.2 | GO:0071821 | FANCM-MHF complex(GO:0071821) |
| 1.0 | 6.0 | GO:0000172 | ribonuclease MRP complex(GO:0000172) |
| 0.9 | 4.7 | GO:0042025 | host cell nucleus(GO:0042025) host cell nuclear part(GO:0044094) |
| 0.9 | 7.5 | GO:0000015 | phosphopyruvate hydratase complex(GO:0000015) |
| 0.9 | 2.8 | GO:0035189 | Rb-E2F complex(GO:0035189) |
| 0.8 | 11.8 | GO:0001673 | male germ cell nucleus(GO:0001673) |
| 0.7 | 2.2 | GO:0005956 | protein kinase CK2 complex(GO:0005956) |
| 0.7 | 2.6 | GO:0001405 | presequence translocase-associated import motor(GO:0001405) |
| 0.6 | 1.9 | GO:1903349 | omegasome membrane(GO:1903349) |
| 0.6 | 4.8 | GO:0070187 | telosome(GO:0070187) |
| 0.6 | 4.7 | GO:0005742 | mitochondrial outer membrane translocase complex(GO:0005742) |
| 0.6 | 2.9 | GO:0043625 | delta DNA polymerase complex(GO:0043625) |
| 0.6 | 1.7 | GO:0044611 | nuclear pore inner ring(GO:0044611) |
| 0.5 | 9.3 | GO:0031080 | nuclear pore outer ring(GO:0031080) |
| 0.5 | 10.4 | GO:0031011 | Ino80 complex(GO:0031011) DNA helicase complex(GO:0033202) |
| 0.5 | 11.6 | GO:0046930 | pore complex(GO:0046930) |
| 0.5 | 5.8 | GO:0000800 | lateral element(GO:0000800) |
| 0.5 | 4.7 | GO:0008278 | cohesin complex(GO:0008278) |
| 0.5 | 6.8 | GO:0060293 | P granule(GO:0043186) pole plasm(GO:0045495) germ plasm(GO:0060293) |
| 0.5 | 6.8 | GO:0005641 | nuclear envelope lumen(GO:0005641) |
| 0.4 | 2.7 | GO:0042824 | MHC class I peptide loading complex(GO:0042824) |
| 0.4 | 6.7 | GO:0005736 | DNA-directed RNA polymerase I complex(GO:0005736) |
| 0.4 | 4.5 | GO:0000940 | condensed chromosome outer kinetochore(GO:0000940) |
| 0.4 | 1.6 | GO:0031510 | SUMO activating enzyme complex(GO:0031510) |
| 0.4 | 3.8 | GO:0071541 | eukaryotic translation initiation factor 3 complex, eIF3m(GO:0071541) |
| 0.4 | 11.8 | GO:0051233 | spindle midzone(GO:0051233) |
| 0.4 | 4.3 | GO:0030008 | TRAPP complex(GO:0030008) |
| 0.4 | 4.6 | GO:0034993 | microtubule organizing center attachment site(GO:0034992) LINC complex(GO:0034993) |
| 0.3 | 7.5 | GO:0070822 | Sin3-type complex(GO:0070822) |
| 0.3 | 1.3 | GO:0005658 | alpha DNA polymerase:primase complex(GO:0005658) |
| 0.3 | 9.1 | GO:0035145 | exon-exon junction complex(GO:0035145) |
| 0.3 | 4.0 | GO:0005750 | mitochondrial respiratory chain complex III(GO:0005750) respiratory chain complex III(GO:0045275) |
| 0.3 | 2.4 | GO:0019773 | proteasome core complex, alpha-subunit complex(GO:0019773) |
| 0.3 | 4.0 | GO:0002199 | zona pellucida receptor complex(GO:0002199) |
| 0.3 | 45.9 | GO:0016363 | nuclear matrix(GO:0016363) |
| 0.3 | 7.3 | GO:0000178 | exosome (RNase complex)(GO:0000178) |
| 0.3 | 2.1 | GO:0035985 | senescence-associated heterochromatin focus(GO:0035985) |
| 0.3 | 0.8 | GO:0098536 | deuterosome(GO:0098536) |
| 0.2 | 2.7 | GO:0008541 | proteasome regulatory particle, lid subcomplex(GO:0008541) |
| 0.2 | 3.9 | GO:0005686 | U2 snRNP(GO:0005686) |
| 0.2 | 1.9 | GO:0072546 | ER membrane protein complex(GO:0072546) |
| 0.2 | 16.0 | GO:0000118 | histone deacetylase complex(GO:0000118) |
| 0.2 | 3.9 | GO:0005662 | DNA replication factor A complex(GO:0005662) |
| 0.2 | 5.1 | GO:0030992 | intraciliary transport particle B(GO:0030992) |
| 0.2 | 1.6 | GO:0034709 | methylosome(GO:0034709) |
| 0.2 | 13.6 | GO:0005637 | nuclear inner membrane(GO:0005637) |
| 0.2 | 5.4 | GO:0030057 | desmosome(GO:0030057) |
| 0.2 | 17.8 | GO:0071013 | catalytic step 2 spliceosome(GO:0071013) |
| 0.2 | 1.3 | GO:0042575 | DNA polymerase complex(GO:0042575) |
| 0.2 | 1.5 | GO:0001739 | sex chromatin(GO:0001739) |
| 0.2 | 9.0 | GO:0045171 | intercellular bridge(GO:0045171) |
| 0.2 | 8.0 | GO:0019005 | SCF ubiquitin ligase complex(GO:0019005) |
| 0.1 | 8.4 | GO:0000794 | condensed nuclear chromosome(GO:0000794) |
| 0.1 | 16.0 | GO:0000793 | condensed chromosome(GO:0000793) |
| 0.1 | 4.5 | GO:0016514 | SWI/SNF complex(GO:0016514) |
| 0.1 | 8.5 | GO:0032592 | integral component of mitochondrial membrane(GO:0032592) |
| 0.1 | 1.9 | GO:0030056 | hemidesmosome(GO:0030056) |
| 0.1 | 6.3 | GO:0043034 | costamere(GO:0043034) |
| 0.1 | 3.0 | GO:0005763 | organellar small ribosomal subunit(GO:0000314) mitochondrial small ribosomal subunit(GO:0005763) |
| 0.1 | 1.5 | GO:0042405 | nuclear inclusion body(GO:0042405) |
| 0.1 | 14.5 | GO:0031901 | early endosome membrane(GO:0031901) |
| 0.1 | 3.2 | GO:0042645 | nucleoid(GO:0009295) mitochondrial nucleoid(GO:0042645) |
| 0.1 | 8.7 | GO:0000932 | cytoplasmic mRNA processing body(GO:0000932) |
| 0.1 | 0.4 | GO:0070847 | core mediator complex(GO:0070847) |
| 0.1 | 2.9 | GO:0005865 | striated muscle thin filament(GO:0005865) |
| 0.1 | 2.4 | GO:0016235 | aggresome(GO:0016235) |
| 0.1 | 1.8 | GO:0034399 | nuclear periphery(GO:0034399) |
| 0.1 | 2.7 | GO:0043198 | dendritic shaft(GO:0043198) |
| 0.0 | 1.2 | GO:0005680 | anaphase-promoting complex(GO:0005680) |
| 0.0 | 2.8 | GO:0017053 | transcriptional repressor complex(GO:0017053) |
| 0.0 | 1.6 | GO:0000159 | protein phosphatase type 2A complex(GO:0000159) |
| 0.0 | 6.4 | GO:0000922 | spindle pole(GO:0000922) |
| 0.0 | 2.1 | GO:0005669 | transcription factor TFIID complex(GO:0005669) |
| 0.0 | 2.5 | GO:0005747 | mitochondrial respiratory chain complex I(GO:0005747) NADH dehydrogenase complex(GO:0030964) respiratory chain complex I(GO:0045271) |
| 0.0 | 1.6 | GO:0072686 | mitotic spindle(GO:0072686) |
| 0.0 | 2.4 | GO:0000502 | proteasome complex(GO:0000502) |
| 0.0 | 1.9 | GO:0000775 | chromosome, centromeric region(GO:0000775) |
| 0.0 | 2.9 | GO:0001669 | acrosomal vesicle(GO:0001669) |
| 0.0 | 0.9 | GO:0016327 | apicolateral plasma membrane(GO:0016327) |
| 0.0 | 2.8 | GO:0016605 | PML body(GO:0016605) |
| 0.0 | 2.4 | GO:0000123 | histone acetyltransferase complex(GO:0000123) |
| 0.0 | 1.3 | GO:0032154 | cleavage furrow(GO:0032154) cell surface furrow(GO:0097610) |
| 0.0 | 1.0 | GO:0034451 | centriolar satellite(GO:0034451) |
| 0.0 | 1.0 | GO:0002102 | podosome(GO:0002102) |
| 0.0 | 1.6 | GO:0005643 | nuclear pore(GO:0005643) |
| 0.0 | 2.4 | GO:0005884 | actin filament(GO:0005884) |
| 0.0 | 5.3 | GO:0043292 | contractile fiber(GO:0043292) |
| 0.0 | 8.0 | GO:0005694 | chromosome(GO:0005694) |
| 0.0 | 4.7 | GO:0005635 | nuclear envelope(GO:0005635) |
| 0.0 | 4.6 | GO:0019866 | organelle inner membrane(GO:0019866) |
| 0.0 | 0.7 | GO:0036464 | cytoplasmic ribonucleoprotein granule(GO:0036464) |
Gene overrepresentation in molecular function category:
| Log-likelihood per target | Total log-likelihood | Term | Description |
|---|---|---|---|
| 21.2 | 84.9 | GO:0061731 | ribonucleoside-diphosphate reductase activity, thioredoxin disulfide as acceptor(GO:0004748) oxidoreductase activity, acting on CH or CH2 groups, disulfide as acceptor(GO:0016728) ribonucleoside-diphosphate reductase activity(GO:0061731) |
| 8.0 | 32.2 | GO:0071208 | histone pre-mRNA DCP binding(GO:0071208) |
| 7.0 | 35.0 | GO:0032143 | single thymine insertion binding(GO:0032143) |
| 5.1 | 20.4 | GO:0044378 | non-sequence-specific DNA binding, bending(GO:0044378) |
| 3.4 | 10.3 | GO:0004170 | dUTP diphosphatase activity(GO:0004170) |
| 2.9 | 20.3 | GO:0003689 | DNA clamp loader activity(GO:0003689) protein-DNA loading ATPase activity(GO:0033170) |
| 2.4 | 9.7 | GO:0004146 | dihydrofolate reductase activity(GO:0004146) |
| 2.1 | 23.2 | GO:0001135 | transcription factor activity, RNA polymerase II transcription factor recruiting(GO:0001135) |
| 1.9 | 11.5 | GO:0047134 | protein-disulfide reductase activity(GO:0047134) |
| 1.7 | 5.2 | GO:0004421 | hydroxymethylglutaryl-CoA synthase activity(GO:0004421) |
| 1.7 | 5.1 | GO:0080023 | 3R-hydroxyacyl-CoA dehydratase activity(GO:0080023) |
| 1.7 | 13.4 | GO:0015288 | porin activity(GO:0015288) |
| 1.5 | 7.7 | GO:0061649 | ubiquitinated histone binding(GO:0061649) |
| 1.5 | 8.8 | GO:0043142 | single-stranded DNA-dependent ATPase activity(GO:0043142) |
| 1.5 | 11.7 | GO:0005087 | Ran guanyl-nucleotide exchange factor activity(GO:0005087) |
| 1.3 | 11.9 | GO:1990226 | histone methyltransferase binding(GO:1990226) |
| 1.3 | 5.1 | GO:0004088 | carbamoyl-phosphate synthase (ammonia) activity(GO:0004087) carbamoyl-phosphate synthase (glutamine-hydrolyzing) activity(GO:0004088) |
| 1.2 | 53.5 | GO:0004003 | ATP-dependent DNA helicase activity(GO:0004003) |
| 1.2 | 16.9 | GO:0043138 | 3'-5' DNA helicase activity(GO:0043138) |
| 1.2 | 10.6 | GO:0034056 | estrogen response element binding(GO:0034056) |
| 1.1 | 4.5 | GO:0000405 | bubble DNA binding(GO:0000405) |
| 1.0 | 7.2 | GO:0004797 | thymidine kinase activity(GO:0004797) |
| 1.0 | 4.0 | GO:0003976 | UDP-N-acetylglucosamine-lysosomal-enzyme N-acetylglucosaminephosphotransferase activity(GO:0003976) |
| 1.0 | 22.6 | GO:0010485 | H4 histone acetyltransferase activity(GO:0010485) |
| 0.9 | 7.5 | GO:0004634 | phosphopyruvate hydratase activity(GO:0004634) |
| 0.9 | 4.4 | GO:0004122 | cystathionine beta-synthase activity(GO:0004122) |
| 0.8 | 33.5 | GO:0031492 | nucleosomal DNA binding(GO:0031492) |
| 0.7 | 15.8 | GO:0052629 | phosphatidylinositol-3,5-bisphosphate 3-phosphatase activity(GO:0052629) |
| 0.7 | 2.1 | GO:0033699 | DNA 5'-adenosine monophosphate hydrolase activity(GO:0033699) |
| 0.7 | 2.1 | GO:0004307 | ethanolaminephosphotransferase activity(GO:0004307) |
| 0.7 | 5.4 | GO:0086083 | cell adhesive protein binding involved in bundle of His cell-Purkinje myocyte communication(GO:0086083) |
| 0.6 | 11.0 | GO:0000400 | four-way junction DNA binding(GO:0000400) |
| 0.6 | 10.9 | GO:0035925 | mRNA 3'-UTR AU-rich region binding(GO:0035925) |
| 0.6 | 4.6 | GO:0003910 | DNA ligase (ATP) activity(GO:0003910) |
| 0.6 | 5.0 | GO:0033592 | RNA strand annealing activity(GO:0033592) |
| 0.5 | 9.3 | GO:0004549 | tRNA-specific ribonuclease activity(GO:0004549) |
| 0.5 | 5.6 | GO:0016884 | carbon-nitrogen ligase activity, with glutamine as amido-N-donor(GO:0016884) |
| 0.5 | 3.0 | GO:0015166 | polyol transmembrane transporter activity(GO:0015166) |
| 0.5 | 4.0 | GO:0016681 | ubiquinol-cytochrome-c reductase activity(GO:0008121) oxidoreductase activity, acting on diphenols and related substances as donors, cytochrome as acceptor(GO:0016681) |
| 0.5 | 2.9 | GO:0051033 | nucleic acid transmembrane transporter activity(GO:0051032) RNA transmembrane transporter activity(GO:0051033) |
| 0.5 | 3.4 | GO:0050815 | phosphoserine binding(GO:0050815) |
| 0.5 | 2.8 | GO:0004468 | lysine N-acetyltransferase activity, acting on acetyl phosphate as donor(GO:0004468) |
| 0.4 | 4.9 | GO:0016755 | transferase activity, transferring amino-acyl groups(GO:0016755) |
| 0.4 | 1.3 | GO:0003896 | DNA primase activity(GO:0003896) |
| 0.4 | 6.7 | GO:0001054 | RNA polymerase I activity(GO:0001054) |
| 0.4 | 6.2 | GO:0005049 | nuclear export signal receptor activity(GO:0005049) |
| 0.4 | 2.0 | GO:0008853 | exodeoxyribonuclease III activity(GO:0008853) |
| 0.4 | 2.0 | GO:0016882 | cyclo-ligase activity(GO:0016882) |
| 0.4 | 1.9 | GO:0050220 | prostaglandin-E synthase activity(GO:0050220) |
| 0.4 | 2.7 | GO:0001849 | complement component C1q binding(GO:0001849) |
| 0.4 | 6.9 | GO:0070182 | DNA polymerase binding(GO:0070182) |
| 0.4 | 5.8 | GO:0046527 | glucosyltransferase activity(GO:0046527) |
| 0.4 | 2.9 | GO:0052834 | inositol monophosphate 1-phosphatase activity(GO:0008934) inositol monophosphate 3-phosphatase activity(GO:0052832) inositol monophosphate 4-phosphatase activity(GO:0052833) inositol monophosphate phosphatase activity(GO:0052834) |
| 0.4 | 29.9 | GO:0003684 | damaged DNA binding(GO:0003684) |
| 0.3 | 9.8 | GO:0005487 | nucleocytoplasmic transporter activity(GO:0005487) |
| 0.3 | 1.3 | GO:0035402 | histone kinase activity (H3-T11 specific)(GO:0035402) |
| 0.3 | 19.9 | GO:0070888 | E-box binding(GO:0070888) |
| 0.3 | 4.7 | GO:0022884 | protein transmembrane transporter activity(GO:0008320) macromolecule transmembrane transporter activity(GO:0022884) |
| 0.3 | 5.0 | GO:0004535 | poly(A)-specific ribonuclease activity(GO:0004535) |
| 0.3 | 1.7 | GO:0031708 | endothelin B receptor binding(GO:0031708) |
| 0.3 | 1.6 | GO:0044020 | histone methyltransferase activity (H4-R3 specific)(GO:0044020) |
| 0.3 | 6.8 | GO:0032794 | GTPase activating protein binding(GO:0032794) |
| 0.2 | 0.7 | GO:0071535 | RING-like zinc finger domain binding(GO:0071535) |
| 0.2 | 1.7 | GO:0001165 | RNA polymerase I upstream control element sequence-specific DNA binding(GO:0001165) |
| 0.2 | 0.7 | GO:0052739 | phosphatidylserine 1-acylhydrolase activity(GO:0052739) |
| 0.2 | 1.6 | GO:0005497 | androgen binding(GO:0005497) |
| 0.2 | 0.7 | GO:0034736 | sterol O-acyltransferase activity(GO:0004772) cholesterol O-acyltransferase activity(GO:0034736) |
| 0.2 | 8.5 | GO:0005123 | death receptor binding(GO:0005123) |
| 0.2 | 1.7 | GO:0008269 | JAK pathway signal transduction adaptor activity(GO:0008269) |
| 0.2 | 8.5 | GO:0005164 | tumor necrosis factor receptor binding(GO:0005164) |
| 0.2 | 1.5 | GO:0008379 | thioredoxin peroxidase activity(GO:0008379) |
| 0.2 | 6.0 | GO:0004707 | MAP kinase activity(GO:0004707) |
| 0.2 | 3.3 | GO:0004887 | thyroid hormone receptor activity(GO:0004887) |
| 0.2 | 6.7 | GO:0017025 | TBP-class protein binding(GO:0017025) |
| 0.2 | 1.7 | GO:0030274 | LIM domain binding(GO:0030274) |
| 0.2 | 1.7 | GO:0017056 | structural constituent of nuclear pore(GO:0017056) |
| 0.2 | 4.0 | GO:0008494 | translation activator activity(GO:0008494) |
| 0.2 | 1.6 | GO:0044388 | small protein activating enzyme binding(GO:0044388) |
| 0.2 | 1.8 | GO:0004645 | phosphorylase activity(GO:0004645) |
| 0.2 | 32.3 | GO:0042393 | histone binding(GO:0042393) |
| 0.2 | 1.9 | GO:0038132 | neuregulin binding(GO:0038132) |
| 0.2 | 5.1 | GO:0031624 | ubiquitin conjugating enzyme binding(GO:0031624) |
| 0.1 | 0.7 | GO:0004826 | phenylalanine-tRNA ligase activity(GO:0004826) |
| 0.1 | 0.6 | GO:0015375 | glycine:sodium symporter activity(GO:0015375) |
| 0.1 | 1.8 | GO:0070700 | BMP receptor binding(GO:0070700) |
| 0.1 | 0.9 | GO:0099602 | acetylcholine receptor regulator activity(GO:0030548) neurotransmitter receptor regulator activity(GO:0099602) |
| 0.1 | 3.6 | GO:0016702 | oxidoreductase activity, acting on single donors with incorporation of molecular oxygen, incorporation of two atoms of oxygen(GO:0016702) |
| 0.1 | 2.8 | GO:0000030 | mannosyltransferase activity(GO:0000030) |
| 0.1 | 3.5 | GO:0008139 | nuclear localization sequence binding(GO:0008139) |
| 0.1 | 2.9 | GO:0005523 | tropomyosin binding(GO:0005523) |
| 0.1 | 3.3 | GO:0004181 | metallocarboxypeptidase activity(GO:0004181) |
| 0.1 | 12.2 | GO:0004386 | helicase activity(GO:0004386) |
| 0.1 | 1.6 | GO:0070016 | armadillo repeat domain binding(GO:0070016) |
| 0.1 | 4.0 | GO:0044183 | protein binding involved in protein folding(GO:0044183) |
| 0.1 | 1.2 | GO:0046976 | histone methyltransferase activity (H3-K27 specific)(GO:0046976) |
| 0.1 | 6.2 | GO:0003743 | translation initiation factor activity(GO:0003743) |
| 0.1 | 12.8 | GO:0031072 | heat shock protein binding(GO:0031072) |
| 0.1 | 4.3 | GO:0017112 | Rab guanyl-nucleotide exchange factor activity(GO:0017112) |
| 0.1 | 2.4 | GO:0004298 | threonine-type endopeptidase activity(GO:0004298) threonine-type peptidase activity(GO:0070003) |
| 0.1 | 0.6 | GO:0086089 | voltage-gated potassium channel activity involved in atrial cardiac muscle cell action potential repolarization(GO:0086089) |
| 0.1 | 1.8 | GO:0004697 | protein kinase C activity(GO:0004697) |
| 0.1 | 0.8 | GO:0097602 | cullin family protein binding(GO:0097602) |
| 0.1 | 1.0 | GO:0004726 | non-membrane spanning protein tyrosine phosphatase activity(GO:0004726) |
| 0.1 | 2.1 | GO:0051059 | NF-kappaB binding(GO:0051059) |
| 0.1 | 11.8 | GO:0001078 | transcriptional repressor activity, RNA polymerase II core promoter proximal region sequence-specific binding(GO:0001078) |
| 0.1 | 1.2 | GO:0048531 | beta-1,3-galactosyltransferase activity(GO:0048531) |
| 0.1 | 19.0 | GO:0005516 | calmodulin binding(GO:0005516) |
| 0.1 | 0.9 | GO:0035256 | G-protein coupled glutamate receptor binding(GO:0035256) |
| 0.1 | 0.3 | GO:0047066 | phospholipid-hydroperoxide glutathione peroxidase activity(GO:0047066) |
| 0.1 | 0.6 | GO:0032183 | SUMO binding(GO:0032183) |
| 0.1 | 0.5 | GO:0004571 | mannosyl-oligosaccharide 1,2-alpha-mannosidase activity(GO:0004571) |
| 0.1 | 4.9 | GO:0051082 | unfolded protein binding(GO:0051082) |
| 0.1 | 4.0 | GO:0004722 | protein serine/threonine phosphatase activity(GO:0004722) |
| 0.1 | 2.1 | GO:0046966 | thyroid hormone receptor binding(GO:0046966) |
| 0.1 | 0.7 | GO:0043425 | bHLH transcription factor binding(GO:0043425) |
| 0.0 | 2.7 | GO:0008173 | RNA methyltransferase activity(GO:0008173) |
| 0.0 | 0.4 | GO:0019784 | NEDD8-specific protease activity(GO:0019784) |
| 0.0 | 2.5 | GO:0050136 | NADH dehydrogenase (ubiquinone) activity(GO:0008137) NADH dehydrogenase (quinone) activity(GO:0050136) |
| 0.0 | 0.9 | GO:0003887 | DNA-directed DNA polymerase activity(GO:0003887) |
| 0.0 | 1.1 | GO:0070717 | poly-purine tract binding(GO:0070717) |
| 0.0 | 1.9 | GO:0001205 | transcriptional activator activity, RNA polymerase II distal enhancer sequence-specific binding(GO:0001205) |
| 0.0 | 0.9 | GO:0001965 | G-protein alpha-subunit binding(GO:0001965) |
| 0.0 | 0.8 | GO:0017075 | syntaxin-1 binding(GO:0017075) |
| 0.0 | 4.1 | GO:0004721 | phosphoprotein phosphatase activity(GO:0004721) |
| 0.0 | 0.1 | GO:0042015 | interleukin-20 binding(GO:0042015) |
| 0.0 | 2.2 | GO:0043021 | ribonucleoprotein complex binding(GO:0043021) |
| 0.0 | 2.3 | GO:0009055 | electron carrier activity(GO:0009055) |
| 0.0 | 0.6 | GO:0030676 | Rac guanyl-nucleotide exchange factor activity(GO:0030676) |
| 0.0 | 7.4 | GO:0046982 | protein heterodimerization activity(GO:0046982) |
| 0.0 | 0.5 | GO:0033613 | activating transcription factor binding(GO:0033613) |
| 0.0 | 1.6 | GO:0017048 | Rho GTPase binding(GO:0017048) |
| 0.0 | 2.8 | GO:0003735 | structural constituent of ribosome(GO:0003735) |
Gene overrepresentation in curated gene sets: canonical pathways category:
| Log-likelihood per target | Total log-likelihood | Term | Description |
|---|---|---|---|
| 1.4 | 185.3 | PID E2F PATHWAY | E2F transcription factor network |
| 0.9 | 49.9 | PID ATR PATHWAY | ATR signaling pathway |
| 0.5 | 19.5 | PID MYC PATHWAY | C-MYC pathway |
| 0.5 | 12.6 | PID ATM PATHWAY | ATM pathway |
| 0.4 | 26.7 | PID IL2 PI3K PATHWAY | IL2 signaling events mediated by PI3K |
| 0.2 | 1.7 | PID PI3KCI AKT PATHWAY | Class I PI3K signaling events mediated by Akt |
| 0.2 | 17.3 | PID AR TF PATHWAY | Regulation of Androgen receptor activity |
| 0.2 | 3.6 | SA G1 AND S PHASES | Cdk2, 4, and 6 bind cyclin D in G1, while cdk2/cyclin E promotes the G1/S transition. |
| 0.2 | 7.6 | PID SMAD2 3PATHWAY | Regulation of cytoplasmic and nuclear SMAD2/3 signaling |
| 0.2 | 23.5 | PID MYC ACTIV PATHWAY | Validated targets of C-MYC transcriptional activation |
| 0.2 | 6.9 | PID P38 MKK3 6PATHWAY | p38 MAPK signaling pathway |
| 0.2 | 9.4 | PID AURORA B PATHWAY | Aurora B signaling |
| 0.2 | 4.3 | PID DNA PK PATHWAY | DNA-PK pathway in nonhomologous end joining |
| 0.2 | 26.3 | PID P53 DOWNSTREAM PATHWAY | Direct p53 effectors |
| 0.1 | 6.5 | PID PLK1 PATHWAY | PLK1 signaling events |
| 0.1 | 3.4 | PID PS1 PATHWAY | Presenilin action in Notch and Wnt signaling |
| 0.1 | 12.7 | PID CMYB PATHWAY | C-MYB transcription factor network |
| 0.1 | 5.8 | PID ARF6 PATHWAY | Arf6 signaling events |
| 0.1 | 1.6 | PID RANBP2 PATHWAY | Sumoylation by RanBP2 regulates transcriptional repression |
| 0.1 | 1.9 | PID INTEGRIN4 PATHWAY | Alpha6 beta4 integrin-ligand interactions |
| 0.1 | 0.7 | ST JAK STAT PATHWAY | Jak-STAT Pathway |
| 0.1 | 1.5 | PID FANCONI PATHWAY | Fanconi anemia pathway |
| 0.1 | 8.2 | WNT SIGNALING | Genes related to Wnt-mediated signal transduction |
| 0.1 | 5.2 | PID HNF3B PATHWAY | FOXA2 and FOXA3 transcription factor networks |
| 0.1 | 3.0 | PID TELOMERASE PATHWAY | Regulation of Telomerase |
| 0.1 | 1.0 | PID ALK2 PATHWAY | ALK2 signaling events |
| 0.0 | 1.9 | PID IFNG PATHWAY | IFN-gamma pathway |
| 0.0 | 1.7 | PID IL2 1PATHWAY | IL2-mediated signaling events |
| 0.0 | 1.7 | PID ERBB1 RECEPTOR PROXIMAL PATHWAY | EGF receptor (ErbB1) signaling pathway |
| 0.0 | 1.9 | PID FAS PATHWAY | FAS (CD95) signaling pathway |
| 0.0 | 1.0 | PID KIT PATHWAY | Signaling events mediated by Stem cell factor receptor (c-Kit) |
| 0.0 | 0.6 | PID REELIN PATHWAY | Reelin signaling pathway |
| 0.0 | 0.6 | ST MYOCYTE AD PATHWAY | Myocyte Adrenergic Pathway is a specific case of the generalized Adrenergic Pathway. |
| 0.0 | 0.7 | PID RB 1PATHWAY | Regulation of retinoblastoma protein |
| 0.0 | 0.9 | PID TRKR PATHWAY | Neurotrophic factor-mediated Trk receptor signaling |
Gene overrepresentation in curated gene sets: REACTOME pathways category:
| Log-likelihood per target | Total log-likelihood | Term | Description |
|---|---|---|---|
| 5.1 | 77.2 | REACTOME UNWINDING OF DNA | Genes involved in Unwinding of DNA |
| 3.6 | 106.9 | REACTOME G1 S SPECIFIC TRANSCRIPTION | Genes involved in G1/S-Specific Transcription |
| 2.1 | 32.2 | REACTOME SLBP DEPENDENT PROCESSING OF REPLICATION DEPENDENT HISTONE PRE MRNAS | Genes involved in SLBP Dependent Processing of Replication-Dependent Histone Pre-mRNAs |
| 1.6 | 20.9 | REACTOME POL SWITCHING | Genes involved in Polymerase switching |
| 1.5 | 13.3 | REACTOME DNA STRAND ELONGATION | Genes involved in DNA strand elongation |
| 1.5 | 22.1 | REACTOME APOPTOSIS INDUCED DNA FRAGMENTATION | Genes involved in Apoptosis induced DNA fragmentation |
| 1.2 | 27.9 | REACTOME DEPOSITION OF NEW CENPA CONTAINING NUCLEOSOMES AT THE CENTROMERE | Genes involved in Deposition of New CENPA-containing Nucleosomes at the Centromere |
| 1.0 | 29.7 | REACTOME PYRIMIDINE METABOLISM | Genes involved in Pyrimidine metabolism |
| 0.9 | 14.5 | REACTOME SYNTHESIS OF PIPS AT THE LATE ENDOSOME MEMBRANE | Genes involved in Synthesis of PIPs at the late endosome membrane |
| 0.7 | 11.0 | REACTOME ACTIVATION OF THE PRE REPLICATIVE COMPLEX | Genes involved in Activation of the pre-replicative complex |
| 0.6 | 12.5 | REACTOME HOMOLOGOUS RECOMBINATION REPAIR OF REPLICATION INDEPENDENT DOUBLE STRAND BREAKS | Genes involved in Homologous recombination repair of replication-independent double-strand breaks |
| 0.6 | 4.8 | REACTOME PACKAGING OF TELOMERE ENDS | Genes involved in Packaging Of Telomere Ends |
| 0.5 | 9.1 | REACTOME THE NLRP3 INFLAMMASOME | Genes involved in The NLRP3 inflammasome |
| 0.5 | 7.6 | REACTOME PURINE RIBONUCLEOSIDE MONOPHOSPHATE BIOSYNTHESIS | Genes involved in Purine ribonucleoside monophosphate biosynthesis |
| 0.4 | 29.6 | REACTOME TRANSPORT OF MATURE TRANSCRIPT TO CYTOPLASM | Genes involved in Transport of Mature Transcript to Cytoplasm |
| 0.4 | 8.5 | REACTOME ACTIVATION OF BH3 ONLY PROTEINS | Genes involved in Activation of BH3-only proteins |
| 0.4 | 38.1 | REACTOME CYCLIN E ASSOCIATED EVENTS DURING G1 S TRANSITION | Genes involved in Cyclin E associated events during G1/S transition |
| 0.3 | 8.5 | REACTOME GLOBAL GENOMIC NER GG NER | Genes involved in Global Genomic NER (GG-NER) |
| 0.3 | 6.7 | REACTOME RNA POL III CHAIN ELONGATION | Genes involved in RNA Polymerase III Chain Elongation |
| 0.3 | 10.9 | REACTOME SIGNALING BY FGFR1 FUSION MUTANTS | Genes involved in Signaling by FGFR1 fusion mutants |
| 0.3 | 7.3 | REACTOME DESTABILIZATION OF MRNA BY KSRP | Genes involved in Destabilization of mRNA by KSRP |
| 0.3 | 6.5 | REACTOME PURINE SALVAGE | Genes involved in Purine salvage |
| 0.3 | 5.4 | REACTOME APOPTOTIC CLEAVAGE OF CELL ADHESION PROTEINS | Genes involved in Apoptotic cleavage of cell adhesion proteins |
| 0.2 | 7.0 | REACTOME BIOSYNTHESIS OF THE N GLYCAN PRECURSOR DOLICHOL LIPID LINKED OLIGOSACCHARIDE LLO AND TRANSFER TO A NASCENT PROTEIN | Genes involved in Biosynthesis of the N-glycan precursor (dolichol lipid-linked oligosaccharide, LLO) and transfer to a nascent protein |
| 0.2 | 3.9 | REACTOME MEIOTIC RECOMBINATION | Genes involved in Meiotic Recombination |
| 0.2 | 1.7 | REACTOME RNA POL I PROMOTER OPENING | Genes involved in RNA Polymerase I Promoter Opening |
| 0.2 | 2.7 | REACTOME ACTIVATION OF CHAPERONE GENES BY ATF6 ALPHA | Genes involved in Activation of Chaperone Genes by ATF6-alpha |
| 0.2 | 6.3 | REACTOME REGULATION OF MRNA STABILITY BY PROTEINS THAT BIND AU RICH ELEMENTS | Genes involved in Regulation of mRNA Stability by Proteins that Bind AU-rich Elements |
| 0.2 | 28.1 | REACTOME FACTORS INVOLVED IN MEGAKARYOCYTE DEVELOPMENT AND PLATELET PRODUCTION | Genes involved in Factors involved in megakaryocyte development and platelet production |
| 0.2 | 19.3 | REACTOME MRNA SPLICING | Genes involved in mRNA Splicing |
| 0.2 | 5.6 | REACTOME DEADENYLATION OF MRNA | Genes involved in Deadenylation of mRNA |
| 0.2 | 5.8 | REACTOME YAP1 AND WWTR1 TAZ STIMULATED GENE EXPRESSION | Genes involved in YAP1- and WWTR1 (TAZ)-stimulated gene expression |
| 0.2 | 4.2 | REACTOME SULFUR AMINO ACID METABOLISM | Genes involved in Sulfur amino acid metabolism |
| 0.1 | 4.9 | REACTOME GLUTATHIONE CONJUGATION | Genes involved in Glutathione conjugation |
| 0.1 | 8.5 | REACTOME LATE PHASE OF HIV LIFE CYCLE | Genes involved in Late Phase of HIV Life Cycle |
| 0.1 | 5.2 | REACTOME CHOLESTEROL BIOSYNTHESIS | Genes involved in Cholesterol biosynthesis |
| 0.1 | 4.0 | REACTOME FORMATION OF TUBULIN FOLDING INTERMEDIATES BY CCT TRIC | Genes involved in Formation of tubulin folding intermediates by CCT/TriC |
| 0.1 | 1.6 | REACTOME REGULATION OF IFNG SIGNALING | Genes involved in Regulation of IFNG signaling |
| 0.1 | 4.7 | REACTOME ANTIVIRAL MECHANISM BY IFN STIMULATED GENES | Genes involved in Antiviral mechanism by IFN-stimulated genes |
| 0.1 | 2.1 | REACTOME SYNTHESIS OF GLYCOSYLPHOSPHATIDYLINOSITOL GPI | Genes involved in Synthesis of glycosylphosphatidylinositol (GPI) |
| 0.1 | 1.7 | REACTOME SEMA3A PLEXIN REPULSION SIGNALING BY INHIBITING INTEGRIN ADHESION | Genes involved in SEMA3A-Plexin repulsion signaling by inhibiting Integrin adhesion |
| 0.1 | 6.1 | REACTOME FORMATION OF THE TERNARY COMPLEX AND SUBSEQUENTLY THE 43S COMPLEX | Genes involved in Formation of the ternary complex, and subsequently, the 43S complex |
| 0.1 | 6.5 | REACTOME RESPIRATORY ELECTRON TRANSPORT | Genes involved in Respiratory electron transport |
| 0.1 | 4.0 | REACTOME GLUCONEOGENESIS | Genes involved in Gluconeogenesis |
| 0.1 | 0.9 | REACTOME G ALPHA Z SIGNALLING EVENTS | Genes involved in G alpha (z) signalling events |
| 0.1 | 5.2 | REACTOME LOSS OF NLP FROM MITOTIC CENTROSOMES | Genes involved in Loss of Nlp from mitotic centrosomes |
| 0.1 | 1.7 | REACTOME GROWTH HORMONE RECEPTOR SIGNALING | Genes involved in Growth hormone receptor signaling |
| 0.1 | 1.2 | REACTOME AUTODEGRADATION OF CDH1 BY CDH1 APC C | Genes involved in Autodegradation of Cdh1 by Cdh1:APC/C |
| 0.1 | 0.8 | REACTOME MRNA DECAY BY 5 TO 3 EXORIBONUCLEASE | Genes involved in mRNA Decay by 5' to 3' Exoribonuclease |
| 0.1 | 1.8 | REACTOME MEIOTIC SYNAPSIS | Genes involved in Meiotic Synapsis |
| 0.0 | 2.6 | REACTOME MITOCHONDRIAL PROTEIN IMPORT | Genes involved in Mitochondrial Protein Import |
| 0.0 | 0.5 | REACTOME RNA POL I TRANSCRIPTION INITIATION | Genes involved in RNA Polymerase I Transcription Initiation |
| 0.0 | 1.8 | REACTOME SIGNAL TRANSDUCTION BY L1 | Genes involved in Signal transduction by L1 |
| 0.0 | 0.8 | REACTOME TRAFFICKING OF GLUR2 CONTAINING AMPA RECEPTORS | Genes involved in Trafficking of GluR2-containing AMPA receptors |
| 0.0 | 1.2 | REACTOME O LINKED GLYCOSYLATION OF MUCINS | Genes involved in O-linked glycosylation of mucins |
| 0.0 | 3.1 | REACTOME ANTIGEN PROCESSING UBIQUITINATION PROTEASOME DEGRADATION | Genes involved in Antigen processing: Ubiquitination & Proteasome degradation |
| 0.0 | 2.8 | REACTOME SIGNALING BY RHO GTPASES | Genes involved in Signaling by Rho GTPases |