Project
GNF SymAtlas + NCI-60 cancer cell lines, human (Su, 2004; Ross, 2000)
Navigation
Downloads
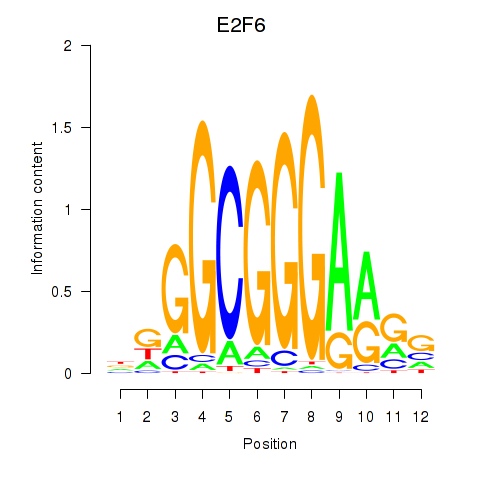
Results for E2F6
Z-value: 1.26
Motif logo
Transcription factors associated with E2F6
| Gene Symbol | Gene ID | Gene Info |
|---|---|---|
|
E2F6
|
ENSG00000169016.17 | E2F6 |
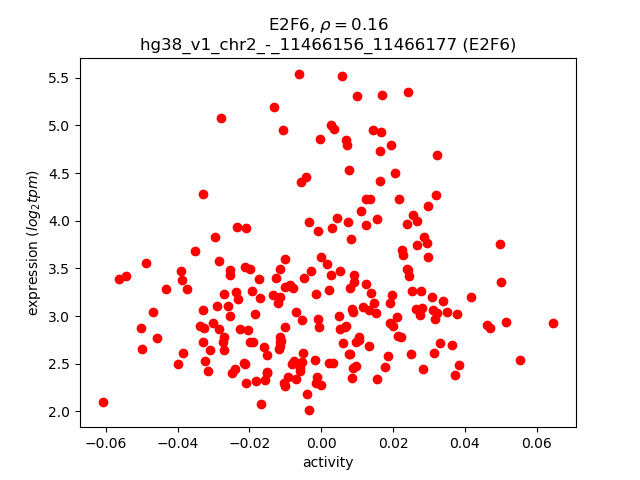
Activity-expression correlation:
| Gene | Promoter | Pearson corr. coef. | P-value | Plot |
|---|---|---|---|---|
| E2F6 | hg38_v1_chr2_-_11466156_11466177 | 0.16 | 1.9e-02 | Click! |
Activity profile of E2F6 motif
Sorted Z-values of E2F6 motif
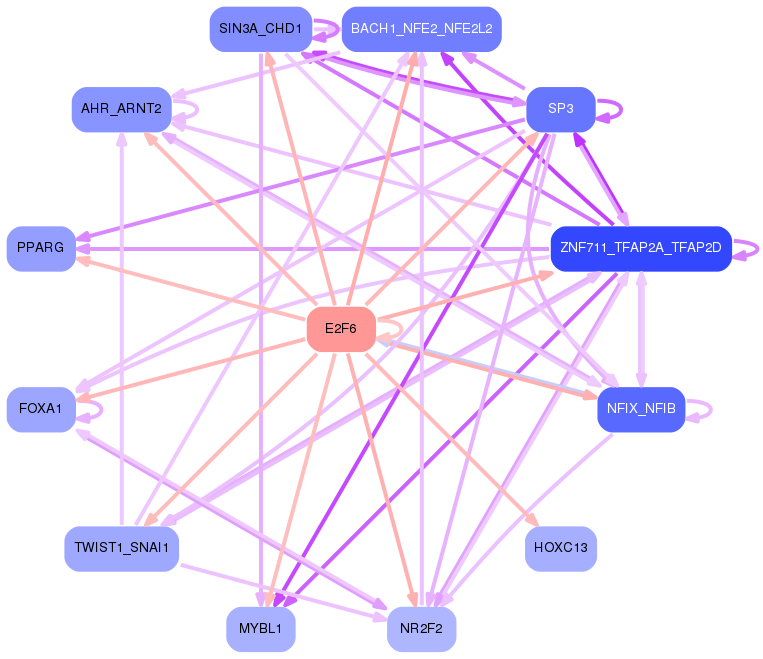
Network of associatons between targets according to the STRING database.

First level regulatory network of E2F6
Gene Ontology Analysis
Gene overrepresentation in biological process category:
| Log-likelihood per target | Total log-likelihood | Term | Description |
|---|---|---|---|
| 9.7 | 38.8 | GO:1900085 | negative regulation of peptidyl-tyrosine autophosphorylation(GO:1900085) negative regulation of inward rectifier potassium channel activity(GO:1903609) |
| 7.7 | 54.2 | GO:0030421 | defecation(GO:0030421) |
| 4.9 | 19.4 | GO:0070358 | actin polymerization-dependent cell motility(GO:0070358) |
| 3.8 | 11.5 | GO:0052047 | interaction with other organism via secreted substance involved in symbiotic interaction(GO:0052047) |
| 3.8 | 15.2 | GO:0048627 | myoblast development(GO:0048627) |
| 3.8 | 18.8 | GO:0003065 | positive regulation of heart rate by epinephrine(GO:0003065) |
| 3.5 | 17.3 | GO:1901350 | cell-cell signaling involved in cell-cell junction organization(GO:1901350) |
| 3.4 | 6.8 | GO:0019065 | receptor-mediated endocytosis of virus by host cell(GO:0019065) endocytosis involved in viral entry into host cell(GO:0075509) |
| 3.4 | 13.6 | GO:0003409 | optic cup structural organization(GO:0003409) |
| 2.9 | 32.4 | GO:0021740 | trigeminal sensory nucleus development(GO:0021730) principal sensory nucleus of trigeminal nerve development(GO:0021740) negative regulation of epithelial cell proliferation involved in lung morphogenesis(GO:2000795) |
| 2.9 | 8.6 | GO:1901254 | modulation by host of viral RNA genome replication(GO:0044830) positive regulation of intracellular transport of viral material(GO:1901254) |
| 2.8 | 11.2 | GO:0001519 | peptide amidation(GO:0001519) protein amidation(GO:0018032) peptide modification(GO:0031179) |
| 2.7 | 10.7 | GO:0072180 | mesonephric duct morphogenesis(GO:0072180) |
| 2.6 | 7.8 | GO:1901420 | negative regulation of response to alcohol(GO:1901420) |
| 2.6 | 5.2 | GO:0060434 | bronchus morphogenesis(GO:0060434) |
| 2.6 | 7.8 | GO:0016476 | regulation of embryonic cell shape(GO:0016476) |
| 2.4 | 9.6 | GO:1904753 | negative regulation of vascular associated smooth muscle cell migration(GO:1904753) |
| 2.4 | 28.6 | GO:0009414 | response to water deprivation(GO:0009414) |
| 2.2 | 6.5 | GO:2001045 | negative regulation of integrin-mediated signaling pathway(GO:2001045) |
| 2.2 | 8.6 | GO:0061304 | retinal blood vessel morphogenesis(GO:0061304) |
| 2.1 | 16.7 | GO:0003433 | chondrocyte development involved in endochondral bone morphogenesis(GO:0003433) |
| 2.1 | 6.3 | GO:2000793 | cell proliferation involved in heart valve development(GO:2000793) |
| 2.1 | 6.2 | GO:0044861 | protein transport into plasma membrane raft(GO:0044861) |
| 2.1 | 12.4 | GO:0071896 | protein localization to adherens junction(GO:0071896) |
| 2.0 | 6.1 | GO:0061445 | endocardial cell fate commitment(GO:0060957) endocardial cushion cell fate commitment(GO:0061445) |
| 2.0 | 20.2 | GO:0048386 | positive regulation of retinoic acid receptor signaling pathway(GO:0048386) |
| 2.0 | 6.0 | GO:1903553 | positive regulation of extracellular exosome assembly(GO:1903553) |
| 2.0 | 7.9 | GO:0060741 | prostate gland stromal morphogenesis(GO:0060741) |
| 1.9 | 5.8 | GO:0007037 | vacuolar phosphate transport(GO:0007037) positive regulation of mitotic cell cycle DNA replication(GO:1903465) positive regulation of parathyroid hormone secretion(GO:2000830) |
| 1.9 | 5.8 | GO:0045715 | negative regulation of low-density lipoprotein particle receptor biosynthetic process(GO:0045715) |
| 1.9 | 5.8 | GO:1901674 | histone H3-K27 acetylation(GO:0043974) regulation of histone H3-K27 acetylation(GO:1901674) |
| 1.9 | 7.6 | GO:1902528 | regulation of protein linear polyubiquitination(GO:1902528) positive regulation of protein linear polyubiquitination(GO:1902530) |
| 1.8 | 11.0 | GO:1904274 | tricellular tight junction assembly(GO:1904274) |
| 1.8 | 9.0 | GO:1902766 | skeletal muscle satellite cell migration(GO:1902766) |
| 1.8 | 5.3 | GO:0044313 | protein K6-linked deubiquitination(GO:0044313) |
| 1.8 | 24.8 | GO:2000680 | rubidium ion transport(GO:0035826) regulation of rubidium ion transport(GO:2000680) |
| 1.7 | 6.9 | GO:0009956 | radial pattern formation(GO:0009956) |
| 1.7 | 8.4 | GO:0044111 | development involved in symbiotic interaction(GO:0044111) |
| 1.6 | 1.6 | GO:1903526 | negative regulation of membrane tubulation(GO:1903526) |
| 1.6 | 8.2 | GO:1903224 | regulation of endodermal cell differentiation(GO:1903224) negative regulation of gastrulation(GO:2000542) |
| 1.6 | 6.4 | GO:0030047 | actin modification(GO:0030047) |
| 1.6 | 4.8 | GO:0036071 | N-glycan fucosylation(GO:0036071) |
| 1.6 | 6.4 | GO:0002541 | activation of plasma proteins involved in acute inflammatory response(GO:0002541) |
| 1.6 | 9.6 | GO:0035105 | sterol regulatory element binding protein import into nucleus(GO:0035105) |
| 1.6 | 7.9 | GO:0042986 | positive regulation of amyloid precursor protein biosynthetic process(GO:0042986) |
| 1.5 | 7.7 | GO:0007161 | calcium-independent cell-matrix adhesion(GO:0007161) |
| 1.5 | 6.0 | GO:0060061 | Spemann organizer formation(GO:0060061) |
| 1.5 | 3.0 | GO:0060510 | Type II pneumocyte differentiation(GO:0060510) |
| 1.5 | 8.8 | GO:0003164 | His-Purkinje system development(GO:0003164) |
| 1.4 | 4.2 | GO:0002368 | B cell cytokine production(GO:0002368) |
| 1.4 | 5.5 | GO:0072166 | posterior mesonephric tubule development(GO:0072166) negative regulation of metanephric glomerulus development(GO:0072299) negative regulation of metanephric glomerular mesangial cell proliferation(GO:0072302) |
| 1.4 | 6.9 | GO:0035986 | senescence-associated heterochromatin focus assembly(GO:0035986) |
| 1.4 | 4.1 | GO:1903892 | negative regulation of ATF6-mediated unfolded protein response(GO:1903892) |
| 1.3 | 4.0 | GO:0060398 | regulation of growth hormone receptor signaling pathway(GO:0060398) |
| 1.3 | 5.4 | GO:0061358 | negative regulation of Wnt protein secretion(GO:0061358) |
| 1.3 | 9.4 | GO:2000230 | negative regulation of pancreatic stellate cell proliferation(GO:2000230) |
| 1.3 | 4.0 | GO:2000301 | negative regulation of synaptic vesicle exocytosis(GO:2000301) |
| 1.3 | 5.2 | GO:0033594 | response to hydroxyisoflavone(GO:0033594) |
| 1.3 | 6.4 | GO:1904637 | response to ionomycin(GO:1904636) cellular response to ionomycin(GO:1904637) |
| 1.3 | 6.3 | GO:1902414 | protein localization to cell junction(GO:1902414) |
| 1.3 | 3.8 | GO:0070384 | olfactory pit development(GO:0060166) Harderian gland development(GO:0070384) |
| 1.2 | 17.2 | GO:0038063 | collagen-activated tyrosine kinase receptor signaling pathway(GO:0038063) |
| 1.2 | 3.6 | GO:0042412 | taurine biosynthetic process(GO:0042412) |
| 1.2 | 4.8 | GO:1901165 | positive regulation of trophoblast cell migration(GO:1901165) |
| 1.2 | 9.6 | GO:0032534 | regulation of microvillus assembly(GO:0032534) |
| 1.2 | 3.5 | GO:0014740 | negative regulation of muscle hyperplasia(GO:0014740) |
| 1.1 | 3.4 | GO:0036166 | phenotypic switching(GO:0036166) regulation of phenotypic switching(GO:1900239) |
| 1.1 | 3.3 | GO:0018211 | protein C-linked glycosylation(GO:0018103) peptidyl-tryptophan modification(GO:0018211) protein C-linked glycosylation via tryptophan(GO:0018317) protein C-linked glycosylation via 2'-alpha-mannosyl-L-tryptophan(GO:0018406) |
| 1.1 | 3.3 | GO:0015888 | thiamine transport(GO:0015888) thiamine transmembrane transport(GO:0071934) |
| 1.1 | 26.4 | GO:0051764 | actin crosslink formation(GO:0051764) |
| 1.1 | 4.4 | GO:0032595 | B cell receptor transport within lipid bilayer(GO:0032595) B cell receptor transport into membrane raft(GO:0032597) protein transport out of membrane raft(GO:0032599) chemokine receptor transport out of membrane raft(GO:0032600) negative regulation of transforming growth factor beta3 production(GO:0032913) chemokine receptor transport within lipid bilayer(GO:0033606) |
| 1.1 | 2.2 | GO:0010986 | positive regulation of lipoprotein particle clearance(GO:0010986) |
| 1.1 | 6.5 | GO:0006065 | UDP-glucuronate biosynthetic process(GO:0006065) |
| 1.1 | 6.5 | GO:0072236 | metanephric loop of Henle development(GO:0072236) |
| 1.1 | 5.4 | GO:0070836 | caveola assembly(GO:0070836) |
| 1.1 | 5.4 | GO:1990164 | histone H2A phosphorylation(GO:1990164) |
| 1.1 | 5.3 | GO:0030579 | ubiquitin-dependent SMAD protein catabolic process(GO:0030579) |
| 1.0 | 3.1 | GO:0031550 | positive regulation of brain-derived neurotrophic factor receptor signaling pathway(GO:0031550) |
| 1.0 | 1.0 | GO:0048807 | female genitalia morphogenesis(GO:0048807) |
| 1.0 | 17.4 | GO:0070208 | protein heterotrimerization(GO:0070208) |
| 1.0 | 4.1 | GO:1904849 | positive regulation of cell chemotaxis to fibroblast growth factor(GO:1904849) positive regulation of endothelial cell chemotaxis to fibroblast growth factor(GO:2000546) |
| 1.0 | 4.1 | GO:0060214 | endocardium formation(GO:0060214) |
| 1.0 | 3.0 | GO:0060278 | regulation of ovulation(GO:0060278) positive regulation of ovulation(GO:0060279) |
| 1.0 | 1.0 | GO:0048843 | negative regulation of axon extension involved in axon guidance(GO:0048843) |
| 1.0 | 14.9 | GO:0035878 | nail development(GO:0035878) |
| 1.0 | 4.0 | GO:0080154 | regulation of fertilization(GO:0080154) |
| 1.0 | 3.0 | GO:0007181 | transforming growth factor beta receptor complex assembly(GO:0007181) |
| 1.0 | 3.9 | GO:0021759 | globus pallidus development(GO:0021759) |
| 1.0 | 4.8 | GO:0021997 | neural plate axis specification(GO:0021997) |
| 1.0 | 1.0 | GO:1904048 | regulation of spontaneous neurotransmitter secretion(GO:1904048) |
| 1.0 | 2.9 | GO:1900194 | negative regulation of oocyte maturation(GO:1900194) |
| 1.0 | 9.6 | GO:0043353 | enucleate erythrocyte differentiation(GO:0043353) |
| 0.9 | 0.9 | GO:0060596 | mammary placode formation(GO:0060596) |
| 0.9 | 11.2 | GO:0000733 | DNA strand renaturation(GO:0000733) |
| 0.9 | 8.4 | GO:0089700 | protein kinase D signaling(GO:0089700) |
| 0.9 | 6.5 | GO:0046929 | negative regulation of neurotransmitter secretion(GO:0046929) |
| 0.9 | 6.3 | GO:0035290 | trunk segmentation(GO:0035290) trunk neural crest cell migration(GO:0036484) ventral trunk neural crest cell migration(GO:0036486) |
| 0.9 | 0.9 | GO:0061032 | visceral serous pericardium development(GO:0061032) |
| 0.9 | 3.6 | GO:1902463 | protein localization to cell leading edge(GO:1902463) |
| 0.9 | 11.6 | GO:0045794 | response to carbon monoxide(GO:0034465) negative regulation of cell volume(GO:0045794) |
| 0.9 | 3.5 | GO:0061299 | retina vasculature morphogenesis in camera-type eye(GO:0061299) |
| 0.9 | 2.6 | GO:0000103 | sulfate assimilation(GO:0000103) |
| 0.9 | 3.4 | GO:1990834 | response to odorant(GO:1990834) |
| 0.9 | 4.3 | GO:0061364 | apoptotic process involved in luteolysis(GO:0061364) |
| 0.9 | 1.7 | GO:0003358 | noradrenergic neuron development(GO:0003358) |
| 0.8 | 0.8 | GO:0038065 | collagen-activated signaling pathway(GO:0038065) |
| 0.8 | 2.5 | GO:0060392 | negative regulation of SMAD protein import into nucleus(GO:0060392) |
| 0.8 | 6.7 | GO:0034436 | glycoprotein transport(GO:0034436) |
| 0.8 | 0.8 | GO:0021637 | trigeminal nerve morphogenesis(GO:0021636) trigeminal nerve structural organization(GO:0021637) semaphorin-plexin signaling pathway involved in axon guidance(GO:1902287) |
| 0.8 | 2.5 | GO:0072365 | regulation of cellular ketone metabolic process by negative regulation of transcription from RNA polymerase II promoter(GO:0072365) |
| 0.8 | 2.5 | GO:0018395 | peptidyl-lysine hydroxylation to 5-hydroxy-L-lysine(GO:0018395) histone arginine demethylation(GO:0070077) histone H3-R2 demethylation(GO:0070078) histone H4-R3 demethylation(GO:0070079) |
| 0.8 | 3.2 | GO:0060718 | chorionic trophoblast cell differentiation(GO:0060718) |
| 0.8 | 4.0 | GO:0014886 | transition between slow and fast fiber(GO:0014886) |
| 0.8 | 6.4 | GO:0030473 | nucleokinesis involved in cell motility in cerebral cortex radial glia guided migration(GO:0021817) nuclear migration along microtubule(GO:0030473) |
| 0.8 | 4.0 | GO:0061343 | cell adhesion involved in heart morphogenesis(GO:0061343) |
| 0.8 | 1.6 | GO:0070172 | positive regulation of tooth mineralization(GO:0070172) |
| 0.8 | 3.1 | GO:0086053 | SA node cell to atrial cardiac muscle cell communication by electrical coupling(GO:0086021) AV node cell to bundle of His cell communication by electrical coupling(GO:0086053) |
| 0.8 | 2.4 | GO:0060995 | cell-cell signaling involved in kidney development(GO:0060995) Wnt signaling pathway involved in kidney development(GO:0061289) canonical Wnt signaling pathway involved in metanephric kidney development(GO:0061290) cell-cell signaling involved in metanephros development(GO:0072204) |
| 0.8 | 0.8 | GO:0031335 | regulation of sulfur amino acid metabolic process(GO:0031335) regulation of homocysteine metabolic process(GO:0050666) |
| 0.8 | 8.5 | GO:0070307 | lens fiber cell development(GO:0070307) |
| 0.8 | 6.9 | GO:0060613 | fat pad development(GO:0060613) |
| 0.8 | 1.5 | GO:0044333 | Wnt signaling pathway involved in digestive tract morphogenesis(GO:0044333) |
| 0.8 | 3.0 | GO:0030950 | establishment or maintenance of actin cytoskeleton polarity(GO:0030950) |
| 0.7 | 15.0 | GO:2000675 | negative regulation of type B pancreatic cell apoptotic process(GO:2000675) |
| 0.7 | 2.9 | GO:0021502 | neural fold elevation formation(GO:0021502) |
| 0.7 | 6.5 | GO:1900223 | positive regulation of beta-amyloid clearance(GO:1900223) |
| 0.7 | 2.2 | GO:1902283 | negative regulation of primary amine oxidase activity(GO:1902283) |
| 0.7 | 14.2 | GO:1904778 | regulation of protein localization to cell cortex(GO:1904776) positive regulation of protein localization to cell cortex(GO:1904778) |
| 0.7 | 13.3 | GO:0019614 | catechol-containing compound catabolic process(GO:0019614) catecholamine catabolic process(GO:0042424) |
| 0.7 | 2.8 | GO:1904117 | response to vasopressin(GO:1904116) cellular response to vasopressin(GO:1904117) |
| 0.7 | 0.7 | GO:0071393 | cellular response to progesterone stimulus(GO:0071393) |
| 0.7 | 4.1 | GO:0001765 | membrane raft assembly(GO:0001765) |
| 0.7 | 2.0 | GO:0015798 | myo-inositol transport(GO:0015798) |
| 0.7 | 2.7 | GO:0031443 | fast-twitch skeletal muscle fiber contraction(GO:0031443) |
| 0.7 | 4.8 | GO:0018095 | protein polyglutamylation(GO:0018095) |
| 0.7 | 2.0 | GO:0048391 | apoptotic process involved in endocardial cushion morphogenesis(GO:0003277) intermediate mesoderm development(GO:0048389) intermediate mesoderm morphogenesis(GO:0048390) intermediate mesoderm formation(GO:0048391) intermediate mesodermal cell differentiation(GO:0048392) regulation of cardiac muscle fiber development(GO:0055018) positive regulation of cardiac muscle fiber development(GO:0055020) bud dilation involved in lung branching(GO:0060503) regulation of transcription from RNA polymerase II promoter involved in kidney development(GO:0060994) BMP signaling pathway involved in ureter morphogenesis(GO:0061149) renal system segmentation(GO:0061150) BMP signaling pathway involved in renal system segmentation(GO:0061151) pulmonary artery endothelial tube morphogenesis(GO:0061155) regulation of transcription from RNA polymerase II promoter involved in mesonephros development(GO:0061216) pattern specification involved in mesonephros development(GO:0061227) BMP signaling pathway involved in nephric duct formation(GO:0071893) negative regulation of branch elongation involved in ureteric bud branching(GO:0072096) negative regulation of branch elongation involved in ureteric bud branching by BMP signaling pathway(GO:0072097) anterior/posterior pattern specification involved in kidney development(GO:0072098) anterior/posterior pattern specification involved in ureteric bud development(GO:0072099) specification of ureteric bud anterior/posterior symmetry(GO:0072100) specification of ureteric bud anterior/posterior symmetry by BMP signaling pathway(GO:0072101) ureter urothelium development(GO:0072190) ureter epithelial cell differentiation(GO:0072192) ureter morphogenesis(GO:0072197) negative regulation of mesenchymal cell proliferation involved in ureter development(GO:0072200) positive regulation of cell proliferation involved in outflow tract morphogenesis(GO:1901964) cardiac jelly development(GO:1905072) regulation of metanephric S-shaped body morphogenesis(GO:2000004) negative regulation of metanephric S-shaped body morphogenesis(GO:2000005) regulation of metanephric comma-shaped body morphogenesis(GO:2000006) negative regulation of metanephric comma-shaped body morphogenesis(GO:2000007) negative regulation of cell proliferation involved in heart morphogenesis(GO:2000137) |
| 0.7 | 9.9 | GO:0045793 | positive regulation of cell size(GO:0045793) |
| 0.7 | 2.0 | GO:0003150 | muscular septum morphogenesis(GO:0003150) |
| 0.7 | 4.6 | GO:0090210 | regulation of establishment of blood-brain barrier(GO:0090210) |
| 0.6 | 1.9 | GO:0048104 | establishment of body hair or bristle planar orientation(GO:0048104) establishment of body hair planar orientation(GO:0048105) dichotomous subdivision of terminal units involved in lung branching(GO:0060448) |
| 0.6 | 2.6 | GO:0019401 | glycerol biosynthetic process(GO:0006114) alditol biosynthetic process(GO:0019401) |
| 0.6 | 2.5 | GO:0033484 | nitric oxide homeostasis(GO:0033484) |
| 0.6 | 2.5 | GO:0006175 | adenosine salvage(GO:0006169) dATP biosynthetic process(GO:0006175) purine deoxyribonucleoside triphosphate biosynthetic process(GO:0009216) |
| 0.6 | 1.9 | GO:1900275 | negative regulation of phospholipase C activity(GO:1900275) |
| 0.6 | 2.5 | GO:0061107 | seminal vesicle development(GO:0061107) |
| 0.6 | 2.5 | GO:0070295 | renal water absorption(GO:0070295) |
| 0.6 | 3.8 | GO:0071910 | determination of pancreatic left/right asymmetry(GO:0035469) determination of liver left/right asymmetry(GO:0071910) |
| 0.6 | 3.1 | GO:1901911 | diadenosine polyphosphate catabolic process(GO:0015961) diphosphoinositol polyphosphate metabolic process(GO:0071543) diadenosine pentaphosphate metabolic process(GO:1901906) diadenosine pentaphosphate catabolic process(GO:1901907) diadenosine hexaphosphate metabolic process(GO:1901908) diadenosine hexaphosphate catabolic process(GO:1901909) adenosine 5'-(hexahydrogen pentaphosphate) metabolic process(GO:1901910) adenosine 5'-(hexahydrogen pentaphosphate) catabolic process(GO:1901911) |
| 0.6 | 1.9 | GO:0014813 | skeletal muscle satellite cell commitment(GO:0014813) |
| 0.6 | 2.5 | GO:0002408 | myeloid dendritic cell chemotaxis(GO:0002408) |
| 0.6 | 8.1 | GO:1900028 | negative regulation of ruffle assembly(GO:1900028) |
| 0.6 | 1.8 | GO:0060689 | cell differentiation involved in salivary gland development(GO:0060689) |
| 0.6 | 3.0 | GO:0060800 | regulation of cell differentiation involved in embryonic placenta development(GO:0060800) |
| 0.6 | 5.9 | GO:0032000 | positive regulation of fatty acid beta-oxidation(GO:0032000) |
| 0.6 | 1.8 | GO:0006679 | glucosylceramide biosynthetic process(GO:0006679) negative regulation of sphingolipid biosynthetic process(GO:0090155) negative regulation of ceramide biosynthetic process(GO:1900060) |
| 0.6 | 1.2 | GO:0036304 | umbilical cord morphogenesis(GO:0036304) umbilical cord development(GO:0061027) |
| 0.6 | 0.6 | GO:1990791 | dorsal root ganglion development(GO:1990791) |
| 0.6 | 2.3 | GO:0003095 | pressure natriuresis(GO:0003095) |
| 0.6 | 0.6 | GO:0044828 | negative regulation by host of viral genome replication(GO:0044828) |
| 0.6 | 12.5 | GO:0031581 | hemidesmosome assembly(GO:0031581) |
| 0.6 | 1.7 | GO:0035507 | regulation of myosin-light-chain-phosphatase activity(GO:0035507) |
| 0.6 | 1.7 | GO:1904398 | positive regulation of neuromuscular junction development(GO:1904398) |
| 0.6 | 3.4 | GO:1904781 | positive regulation of protein localization to centrosome(GO:1904781) |
| 0.6 | 9.0 | GO:0010603 | regulation of cytoplasmic mRNA processing body assembly(GO:0010603) |
| 0.6 | 3.3 | GO:0006021 | inositol biosynthetic process(GO:0006021) |
| 0.6 | 2.8 | GO:0010481 | epidermal cell division(GO:0010481) regulation of epidermal cell division(GO:0010482) |
| 0.5 | 2.2 | GO:0010643 | cell communication by chemical coupling(GO:0010643) |
| 0.5 | 8.7 | GO:1902373 | negative regulation of mRNA catabolic process(GO:1902373) |
| 0.5 | 2.2 | GO:0001826 | inner cell mass cell differentiation(GO:0001826) |
| 0.5 | 3.2 | GO:0061143 | alveolar primary septum development(GO:0061143) |
| 0.5 | 0.5 | GO:0010840 | regulation of circadian sleep/wake cycle, wakefulness(GO:0010840) circadian sleep/wake cycle, wakefulness(GO:0042746) |
| 0.5 | 9.5 | GO:0060272 | embryonic skeletal joint morphogenesis(GO:0060272) |
| 0.5 | 2.1 | GO:0072137 | condensed mesenchymal cell proliferation(GO:0072137) |
| 0.5 | 0.5 | GO:1903911 | positive regulation of receptor clustering(GO:1903911) |
| 0.5 | 1.6 | GO:1904440 | antigen processing and presentation of peptide antigen via MHC class Ib(GO:0002428) positive regulation of iron ion transport(GO:0034758) positive regulation of iron ion transmembrane transport(GO:0034761) cellular response to iron(III) ion(GO:0071283) regulation of iron ion import(GO:1900390) regulation of ferrous iron import into cell(GO:1903989) positive regulation of ferrous iron import into cell(GO:1903991) regulation of ferrous iron binding(GO:1904432) positive regulation of ferrous iron binding(GO:1904434) regulation of transferrin receptor binding(GO:1904435) positive regulation of transferrin receptor binding(GO:1904437) regulation of ferrous iron import across plasma membrane(GO:1904438) positive regulation of ferrous iron import across plasma membrane(GO:1904440) |
| 0.5 | 6.8 | GO:1901621 | negative regulation of smoothened signaling pathway involved in dorsal/ventral neural tube patterning(GO:1901621) |
| 0.5 | 2.6 | GO:2000286 | receptor internalization involved in canonical Wnt signaling pathway(GO:2000286) |
| 0.5 | 2.6 | GO:0060355 | positive regulation of cell adhesion molecule production(GO:0060355) |
| 0.5 | 3.1 | GO:0033314 | mitotic DNA replication checkpoint(GO:0033314) |
| 0.5 | 3.1 | GO:0032487 | regulation of Rap protein signal transduction(GO:0032487) |
| 0.5 | 3.1 | GO:0032525 | somite rostral/caudal axis specification(GO:0032525) |
| 0.5 | 1.5 | GO:0009386 | translational attenuation(GO:0009386) |
| 0.5 | 1.0 | GO:0051088 | PMA-inducible membrane protein ectodomain proteolysis(GO:0051088) |
| 0.5 | 4.6 | GO:0035860 | glial cell-derived neurotrophic factor receptor signaling pathway(GO:0035860) |
| 0.5 | 1.5 | GO:0021960 | anterior commissure morphogenesis(GO:0021960) |
| 0.5 | 0.5 | GO:0021678 | fourth ventricle development(GO:0021592) third ventricle development(GO:0021678) |
| 0.5 | 2.5 | GO:0055059 | asymmetric neuroblast division(GO:0055059) |
| 0.5 | 3.9 | GO:2000601 | positive regulation of Arp2/3 complex-mediated actin nucleation(GO:2000601) |
| 0.5 | 1.5 | GO:0042823 | pyridoxine metabolic process(GO:0008614) pyridoxine biosynthetic process(GO:0008615) vitamin B6 biosynthetic process(GO:0042819) pyridoxal phosphate metabolic process(GO:0042822) pyridoxal phosphate biosynthetic process(GO:0042823) |
| 0.5 | 4.4 | GO:2000344 | positive regulation of acrosome reaction(GO:2000344) |
| 0.5 | 1.5 | GO:0014707 | branchiomeric skeletal muscle development(GO:0014707) |
| 0.5 | 1.9 | GO:0060023 | soft palate development(GO:0060023) |
| 0.5 | 3.9 | GO:0043570 | maintenance of DNA repeat elements(GO:0043570) |
| 0.5 | 4.8 | GO:0036066 | protein O-linked fucosylation(GO:0036066) |
| 0.5 | 1.4 | GO:1904582 | regulation of intracellular mRNA localization(GO:1904580) positive regulation of intracellular mRNA localization(GO:1904582) |
| 0.5 | 1.9 | GO:1904381 | Golgi apparatus mannose trimming(GO:1904381) |
| 0.5 | 3.8 | GO:0071578 | zinc II ion transmembrane import(GO:0071578) |
| 0.5 | 8.1 | GO:1900120 | regulation of receptor binding(GO:1900120) |
| 0.5 | 1.4 | GO:0031017 | exocrine pancreas development(GO:0031017) |
| 0.5 | 4.2 | GO:2000074 | regulation of type B pancreatic cell development(GO:2000074) |
| 0.5 | 4.2 | GO:0001845 | phagolysosome assembly(GO:0001845) |
| 0.5 | 2.8 | GO:0006104 | succinyl-CoA metabolic process(GO:0006104) |
| 0.5 | 6.0 | GO:0034501 | protein localization to kinetochore(GO:0034501) |
| 0.5 | 0.5 | GO:2001302 | lipoxin biosynthetic process(GO:2001301) lipoxin A4 metabolic process(GO:2001302) lipoxin A4 biosynthetic process(GO:2001303) |
| 0.5 | 1.4 | GO:0097112 | gamma-aminobutyric acid receptor clustering(GO:0097112) |
| 0.5 | 3.2 | GO:1904352 | positive regulation of protein catabolic process in the vacuole(GO:1904352) |
| 0.5 | 3.2 | GO:0006489 | dolichyl diphosphate biosynthetic process(GO:0006489) dolichyl diphosphate metabolic process(GO:0046465) |
| 0.5 | 1.8 | GO:0035750 | protein localization to myelin sheath abaxonal region(GO:0035750) |
| 0.5 | 1.8 | GO:0060734 | regulation of endoplasmic reticulum stress-induced eIF2 alpha phosphorylation(GO:0060734) |
| 0.4 | 2.2 | GO:0019464 | glycine catabolic process(GO:0006546) glycine decarboxylation via glycine cleavage system(GO:0019464) |
| 0.4 | 4.9 | GO:0021520 | spinal cord motor neuron cell fate specification(GO:0021520) |
| 0.4 | 12.4 | GO:0014850 | response to muscle activity(GO:0014850) |
| 0.4 | 3.5 | GO:0042118 | endothelial cell activation(GO:0042118) |
| 0.4 | 0.4 | GO:0097499 | protein localization to nonmotile primary cilium(GO:0097499) |
| 0.4 | 3.1 | GO:0038031 | non-canonical Wnt signaling pathway via JNK cascade(GO:0038031) |
| 0.4 | 1.7 | GO:0061188 | regulation of chromatin silencing at rDNA(GO:0061187) negative regulation of chromatin silencing at rDNA(GO:0061188) |
| 0.4 | 2.6 | GO:0051549 | positive regulation of keratinocyte migration(GO:0051549) |
| 0.4 | 5.6 | GO:0071468 | cellular response to acidic pH(GO:0071468) |
| 0.4 | 8.2 | GO:0032515 | negative regulation of phosphoprotein phosphatase activity(GO:0032515) |
| 0.4 | 9.8 | GO:0030325 | adrenal gland development(GO:0030325) |
| 0.4 | 5.1 | GO:0001778 | plasma membrane repair(GO:0001778) |
| 0.4 | 5.0 | GO:0042487 | regulation of odontogenesis of dentin-containing tooth(GO:0042487) |
| 0.4 | 1.3 | GO:0010808 | positive regulation of synaptic vesicle priming(GO:0010808) |
| 0.4 | 2.1 | GO:0030167 | proteoglycan catabolic process(GO:0030167) |
| 0.4 | 7.1 | GO:0097320 | membrane tubulation(GO:0097320) |
| 0.4 | 0.8 | GO:0036100 | leukotriene catabolic process(GO:0036100) leukotriene B4 catabolic process(GO:0036101) leukotriene B4 metabolic process(GO:0036102) icosanoid catabolic process(GO:1901523) fatty acid derivative catabolic process(GO:1901569) |
| 0.4 | 3.7 | GO:0043569 | negative regulation of insulin-like growth factor receptor signaling pathway(GO:0043569) |
| 0.4 | 4.5 | GO:0051639 | actin filament network formation(GO:0051639) |
| 0.4 | 10.2 | GO:0000185 | activation of MAPKKK activity(GO:0000185) |
| 0.4 | 4.1 | GO:0097205 | renal filtration(GO:0097205) |
| 0.4 | 5.7 | GO:0046325 | negative regulation of glucose import(GO:0046325) |
| 0.4 | 6.8 | GO:0034356 | NAD biosynthesis via nicotinamide riboside salvage pathway(GO:0034356) |
| 0.4 | 0.4 | GO:0019336 | phenol-containing compound catabolic process(GO:0019336) |
| 0.4 | 0.8 | GO:0048808 | male genitalia morphogenesis(GO:0048808) male anatomical structure morphogenesis(GO:0090598) |
| 0.4 | 1.5 | GO:0070460 | thyroid-stimulating hormone secretion(GO:0070460) regulation of thyroid-stimulating hormone secretion(GO:2000612) |
| 0.4 | 2.3 | GO:0061298 | retina vasculature development in camera-type eye(GO:0061298) |
| 0.4 | 4.2 | GO:0036445 | forebrain neuroblast division(GO:0021873) neuronal stem cell division(GO:0036445) neuroblast division(GO:0055057) |
| 0.4 | 0.8 | GO:0017055 | negative regulation of RNA polymerase II transcriptional preinitiation complex assembly(GO:0017055) |
| 0.4 | 4.6 | GO:0001833 | inner cell mass cell proliferation(GO:0001833) |
| 0.4 | 2.3 | GO:1901896 | positive regulation of calcium-transporting ATPase activity(GO:1901896) |
| 0.4 | 1.5 | GO:0048669 | collateral sprouting in absence of injury(GO:0048669) |
| 0.4 | 6.3 | GO:0030497 | fatty acid elongation(GO:0030497) very long-chain fatty acid biosynthetic process(GO:0042761) |
| 0.4 | 1.5 | GO:0048861 | leukemia inhibitory factor signaling pathway(GO:0048861) |
| 0.4 | 0.4 | GO:0071947 | protein deubiquitination involved in ubiquitin-dependent protein catabolic process(GO:0071947) |
| 0.4 | 0.7 | GO:0010825 | positive regulation of centrosome duplication(GO:0010825) |
| 0.4 | 4.0 | GO:0090136 | epithelial cell-cell adhesion(GO:0090136) |
| 0.4 | 0.4 | GO:0072301 | metanephric glomerular mesangial cell proliferation involved in metanephros development(GO:0072262) regulation of metanephric glomerular mesangial cell proliferation(GO:0072301) |
| 0.4 | 1.5 | GO:0018008 | N-terminal peptidyl-glycine N-myristoylation(GO:0018008) peptidyl-glycine modification(GO:0018201) |
| 0.4 | 1.5 | GO:1902954 | regulation of early endosome to recycling endosome transport(GO:1902954) |
| 0.4 | 2.9 | GO:1901187 | regulation of ephrin receptor signaling pathway(GO:1901187) |
| 0.4 | 1.4 | GO:0046946 | hydroxylysine metabolic process(GO:0046946) hydroxylysine biosynthetic process(GO:0046947) |
| 0.4 | 3.2 | GO:0097084 | vascular smooth muscle cell development(GO:0097084) |
| 0.4 | 2.1 | GO:0032328 | alanine transport(GO:0032328) |
| 0.4 | 2.1 | GO:2000587 | negative regulation of platelet-derived growth factor receptor-beta signaling pathway(GO:2000587) |
| 0.4 | 1.4 | GO:0050917 | sensory perception of umami taste(GO:0050917) |
| 0.4 | 3.2 | GO:0060670 | branching involved in labyrinthine layer morphogenesis(GO:0060670) |
| 0.4 | 1.1 | GO:0090341 | negative regulation of secretion of lysosomal enzymes(GO:0090341) |
| 0.3 | 2.8 | GO:0098535 | de novo centriole assembly(GO:0098535) |
| 0.3 | 1.0 | GO:0045013 | carbon catabolite repression of transcription(GO:0045013) negative regulation of transcription by glucose(GO:0045014) |
| 0.3 | 5.9 | GO:1903830 | magnesium ion transmembrane transport(GO:1903830) |
| 0.3 | 2.1 | GO:0000707 | meiotic DNA recombinase assembly(GO:0000707) |
| 0.3 | 2.4 | GO:0098722 | germ-line stem cell division(GO:0042078) male germ-line stem cell asymmetric division(GO:0048133) asymmetric stem cell division(GO:0098722) germline stem cell asymmetric division(GO:0098728) |
| 0.3 | 1.4 | GO:0051462 | cortisol secretion(GO:0043400) regulation of cortisol secretion(GO:0051462) |
| 0.3 | 15.5 | GO:0071377 | cellular response to glucagon stimulus(GO:0071377) |
| 0.3 | 1.7 | GO:0060040 | retinal bipolar neuron differentiation(GO:0060040) |
| 0.3 | 0.3 | GO:0061153 | trachea submucosa development(GO:0061152) trachea gland development(GO:0061153) |
| 0.3 | 0.7 | GO:0097252 | oligodendrocyte apoptotic process(GO:0097252) |
| 0.3 | 1.3 | GO:2001034 | positive regulation of double-strand break repair via nonhomologous end joining(GO:2001034) |
| 0.3 | 2.0 | GO:0060750 | epithelial cell proliferation involved in mammary gland duct elongation(GO:0060750) |
| 0.3 | 1.0 | GO:0045906 | negative regulation of vasoconstriction(GO:0045906) |
| 0.3 | 2.3 | GO:0035583 | sequestering of TGFbeta in extracellular matrix(GO:0035583) |
| 0.3 | 4.9 | GO:0039532 | negative regulation of viral-induced cytoplasmic pattern recognition receptor signaling pathway(GO:0039532) |
| 0.3 | 0.6 | GO:1903691 | positive regulation of wound healing, spreading of epidermal cells(GO:1903691) |
| 0.3 | 1.0 | GO:0097021 | lymphocyte migration into lymphoid organs(GO:0097021) |
| 0.3 | 1.6 | GO:0000414 | regulation of histone H3-K36 methylation(GO:0000414) |
| 0.3 | 6.4 | GO:2000009 | negative regulation of protein localization to cell surface(GO:2000009) |
| 0.3 | 7.4 | GO:0030502 | negative regulation of bone mineralization(GO:0030502) |
| 0.3 | 1.0 | GO:1902269 | positive regulation of polyamine transmembrane transport(GO:1902269) |
| 0.3 | 1.3 | GO:0015871 | choline transport(GO:0015871) |
| 0.3 | 1.3 | GO:0071110 | protein biotinylation(GO:0009305) histone biotinylation(GO:0071110) |
| 0.3 | 4.1 | GO:0006449 | regulation of translational termination(GO:0006449) |
| 0.3 | 3.5 | GO:0042373 | vitamin K metabolic process(GO:0042373) |
| 0.3 | 2.2 | GO:0001842 | neural fold formation(GO:0001842) |
| 0.3 | 1.3 | GO:0006620 | posttranslational protein targeting to membrane(GO:0006620) |
| 0.3 | 0.6 | GO:0002159 | desmosome assembly(GO:0002159) |
| 0.3 | 2.2 | GO:2000647 | negative regulation of stem cell proliferation(GO:2000647) |
| 0.3 | 3.4 | GO:0001977 | renal system process involved in regulation of blood volume(GO:0001977) |
| 0.3 | 3.4 | GO:0048251 | elastic fiber assembly(GO:0048251) |
| 0.3 | 3.1 | GO:0031274 | positive regulation of pseudopodium assembly(GO:0031274) |
| 0.3 | 1.5 | GO:0030174 | regulation of DNA-dependent DNA replication initiation(GO:0030174) |
| 0.3 | 1.2 | GO:0018242 | protein O-linked glycosylation via serine(GO:0018242) |
| 0.3 | 2.7 | GO:1902897 | regulation of postsynaptic density protein 95 clustering(GO:1902897) |
| 0.3 | 1.5 | GO:0046167 | glycerol-3-phosphate biosynthetic process(GO:0046167) |
| 0.3 | 0.6 | GO:0021869 | forebrain ventricular zone progenitor cell division(GO:0021869) |
| 0.3 | 0.9 | GO:0045586 | regulation of gamma-delta T cell differentiation(GO:0045586) |
| 0.3 | 0.6 | GO:0003174 | mitral valve development(GO:0003174) |
| 0.3 | 1.8 | GO:0031936 | negative regulation of chromatin silencing(GO:0031936) |
| 0.3 | 2.4 | GO:0010998 | regulation of translational initiation by eIF2 alpha phosphorylation(GO:0010998) |
| 0.3 | 0.9 | GO:0021763 | subthalamic nucleus development(GO:0021763) prolactin secreting cell differentiation(GO:0060127) left lung morphogenesis(GO:0060460) pulmonary vein morphogenesis(GO:0060577) superior vena cava morphogenesis(GO:0060578) |
| 0.3 | 1.2 | GO:0002501 | peptide antigen assembly with MHC protein complex(GO:0002501) |
| 0.3 | 5.9 | GO:0016254 | preassembly of GPI anchor in ER membrane(GO:0016254) |
| 0.3 | 2.3 | GO:0048262 | determination of dorsal/ventral asymmetry(GO:0048262) |
| 0.3 | 2.0 | GO:0010669 | epithelial structure maintenance(GO:0010669) |
| 0.3 | 4.1 | GO:0016024 | CDP-diacylglycerol biosynthetic process(GO:0016024) |
| 0.3 | 1.4 | GO:1903936 | cellular response to sodium arsenite(GO:1903936) |
| 0.3 | 0.6 | GO:0090403 | oxidative stress-induced premature senescence(GO:0090403) |
| 0.3 | 2.3 | GO:0055129 | proline biosynthetic process(GO:0006561) L-proline biosynthetic process(GO:0055129) |
| 0.3 | 1.7 | GO:0051045 | negative regulation of membrane protein ectodomain proteolysis(GO:0051045) |
| 0.3 | 1.1 | GO:0098903 | regulation of membrane repolarization during action potential(GO:0098903) |
| 0.3 | 2.5 | GO:0071492 | cellular response to UV-A(GO:0071492) |
| 0.3 | 2.2 | GO:0008298 | intracellular mRNA localization(GO:0008298) |
| 0.3 | 0.6 | GO:2000325 | regulation of ligand-dependent nuclear receptor transcription coactivator activity(GO:2000325) positive regulation of ligand-dependent nuclear receptor transcription coactivator activity(GO:2000327) |
| 0.3 | 2.0 | GO:0035879 | plasma membrane lactate transport(GO:0035879) |
| 0.3 | 0.8 | GO:0072008 | mesangial cell differentiation(GO:0072007) glomerular mesangial cell differentiation(GO:0072008) kidney interstitial fibroblast differentiation(GO:0072071) renal interstitial fibroblast development(GO:0072141) mesangial cell development(GO:0072143) glomerular mesangial cell development(GO:0072144) pericyte cell differentiation(GO:1904238) |
| 0.3 | 0.6 | GO:0071879 | positive regulation of adrenergic receptor signaling pathway(GO:0071879) |
| 0.3 | 2.0 | GO:0006662 | glycerol ether metabolic process(GO:0006662) |
| 0.3 | 0.8 | GO:0005989 | lactose metabolic process(GO:0005988) lactose biosynthetic process(GO:0005989) |
| 0.3 | 5.0 | GO:0071711 | basement membrane organization(GO:0071711) |
| 0.3 | 6.3 | GO:0035635 | entry of bacterium into host cell(GO:0035635) |
| 0.3 | 1.1 | GO:0019074 | viral genome packaging(GO:0019072) viral RNA genome packaging(GO:0019074) |
| 0.3 | 1.7 | GO:0061767 | negative regulation of lung blood pressure(GO:0061767) |
| 0.3 | 1.1 | GO:1900454 | positive regulation of long term synaptic depression(GO:1900454) |
| 0.3 | 5.5 | GO:0046320 | regulation of fatty acid oxidation(GO:0046320) |
| 0.3 | 2.5 | GO:0000050 | urea cycle(GO:0000050) |
| 0.3 | 20.2 | GO:1901016 | regulation of potassium ion transmembrane transporter activity(GO:1901016) |
| 0.3 | 1.1 | GO:0021615 | glossopharyngeal nerve morphogenesis(GO:0021615) |
| 0.3 | 4.9 | GO:0075522 | IRES-dependent viral translational initiation(GO:0075522) |
| 0.3 | 1.3 | GO:0033133 | positive regulation of glucokinase activity(GO:0033133) |
| 0.3 | 1.6 | GO:0006983 | ER overload response(GO:0006983) |
| 0.3 | 7.0 | GO:2000811 | negative regulation of anoikis(GO:2000811) |
| 0.3 | 0.5 | GO:2000586 | regulation of platelet-derived growth factor receptor-beta signaling pathway(GO:2000586) |
| 0.3 | 5.1 | GO:0022011 | myelination in peripheral nervous system(GO:0022011) peripheral nervous system axon ensheathment(GO:0032292) |
| 0.3 | 1.6 | GO:0060084 | synaptic transmission involved in micturition(GO:0060084) |
| 0.3 | 2.9 | GO:0034384 | high-density lipoprotein particle clearance(GO:0034384) |
| 0.3 | 4.0 | GO:0071577 | zinc II ion transmembrane transport(GO:0071577) |
| 0.3 | 1.1 | GO:0032916 | transforming growth factor beta3 production(GO:0032907) regulation of transforming growth factor beta3 production(GO:0032910) positive regulation of transforming growth factor beta3 production(GO:0032916) |
| 0.3 | 0.8 | GO:0048733 | sebaceous gland development(GO:0048733) |
| 0.3 | 1.1 | GO:0051944 | positive regulation of dopamine uptake involved in synaptic transmission(GO:0051586) positive regulation of catecholamine uptake involved in synaptic transmission(GO:0051944) |
| 0.3 | 2.1 | GO:0035087 | siRNA loading onto RISC involved in RNA interference(GO:0035087) |
| 0.3 | 1.8 | GO:2000766 | negative regulation of cytoplasmic translation(GO:2000766) |
| 0.3 | 0.8 | GO:0071460 | cellular response to cell-matrix adhesion(GO:0071460) |
| 0.3 | 1.3 | GO:0006127 | glycerophosphate shuttle(GO:0006127) |
| 0.3 | 0.5 | GO:2000170 | regulation of renal output by angiotensin(GO:0002019) positive regulation of peptidyl-cysteine S-nitrosylation(GO:2000170) |
| 0.3 | 2.3 | GO:0070508 | sterol import(GO:0035376) cholesterol import(GO:0070508) |
| 0.3 | 0.5 | GO:2000195 | negative regulation of female gonad development(GO:2000195) |
| 0.3 | 0.8 | GO:0051684 | maintenance of Golgi location(GO:0051684) |
| 0.3 | 0.8 | GO:0098582 | innate vocalization behavior(GO:0098582) |
| 0.2 | 0.5 | GO:0070662 | mast cell proliferation(GO:0070662) |
| 0.2 | 0.2 | GO:0001554 | luteolysis(GO:0001554) |
| 0.2 | 7.8 | GO:0007176 | regulation of epidermal growth factor-activated receptor activity(GO:0007176) |
| 0.2 | 1.0 | GO:1904783 | negative regulation of glutamate receptor signaling pathway(GO:1900450) negative regulation of NMDA glutamate receptor activity(GO:1904782) positive regulation of NMDA glutamate receptor activity(GO:1904783) |
| 0.2 | 11.3 | GO:0043297 | apical junction assembly(GO:0043297) |
| 0.2 | 1.4 | GO:2000158 | positive regulation of ubiquitin-specific protease activity(GO:2000158) |
| 0.2 | 1.4 | GO:0097396 | response to interleukin-17(GO:0097396) cellular response to interleukin-17(GO:0097398) |
| 0.2 | 0.7 | GO:1900042 | positive regulation of interleukin-2 secretion(GO:1900042) |
| 0.2 | 0.7 | GO:0046452 | dihydrofolate metabolic process(GO:0046452) |
| 0.2 | 0.9 | GO:0070278 | extracellular matrix constituent secretion(GO:0070278) |
| 0.2 | 0.5 | GO:0046533 | negative regulation of photoreceptor cell differentiation(GO:0046533) |
| 0.2 | 8.9 | GO:0006896 | Golgi to vacuole transport(GO:0006896) |
| 0.2 | 0.2 | GO:0010694 | positive regulation of alkaline phosphatase activity(GO:0010694) |
| 0.2 | 0.2 | GO:0060364 | frontal suture morphogenesis(GO:0060364) |
| 0.2 | 2.3 | GO:0034315 | regulation of Arp2/3 complex-mediated actin nucleation(GO:0034315) |
| 0.2 | 0.9 | GO:0060282 | positive regulation of oocyte development(GO:0060282) |
| 0.2 | 3.3 | GO:0006828 | manganese ion transport(GO:0006828) |
| 0.2 | 2.0 | GO:0060445 | branching involved in salivary gland morphogenesis(GO:0060445) |
| 0.2 | 2.9 | GO:0043518 | negative regulation of DNA damage response, signal transduction by p53 class mediator(GO:0043518) |
| 0.2 | 0.4 | GO:0035822 | gene conversion(GO:0035822) |
| 0.2 | 0.7 | GO:0042369 | vitamin D catabolic process(GO:0042369) |
| 0.2 | 0.7 | GO:0048691 | modulation by virus of host transcription(GO:0019056) positive regulation of sprouting of injured axon(GO:0048687) positive regulation of axon extension involved in regeneration(GO:0048691) modulation by symbiont of host transcription(GO:0052026) |
| 0.2 | 4.3 | GO:0051085 | chaperone mediated protein folding requiring cofactor(GO:0051085) |
| 0.2 | 0.7 | GO:0070966 | nuclear-transcribed mRNA catabolic process, no-go decay(GO:0070966) |
| 0.2 | 0.6 | GO:0002184 | cytoplasmic translational termination(GO:0002184) |
| 0.2 | 1.3 | GO:0014054 | positive regulation of gamma-aminobutyric acid secretion(GO:0014054) |
| 0.2 | 1.3 | GO:0016926 | protein desumoylation(GO:0016926) |
| 0.2 | 1.9 | GO:0030807 | positive regulation of cyclic nucleotide catabolic process(GO:0030807) positive regulation of cAMP catabolic process(GO:0030822) |
| 0.2 | 0.6 | GO:0030920 | N-terminal peptidyl-serine acetylation(GO:0017198) N-terminal peptidyl-glutamic acid acetylation(GO:0018002) peptidyl-serine acetylation(GO:0030920) |
| 0.2 | 0.6 | GO:0032815 | negative regulation of natural killer cell activation(GO:0032815) |
| 0.2 | 1.7 | GO:0061484 | hematopoietic stem cell homeostasis(GO:0061484) |
| 0.2 | 2.5 | GO:0034380 | high-density lipoprotein particle assembly(GO:0034380) |
| 0.2 | 0.6 | GO:2000317 | negative regulation of T-helper 17 type immune response(GO:2000317) negative regulation of T-helper 17 cell differentiation(GO:2000320) |
| 0.2 | 1.0 | GO:0007197 | adenylate cyclase-inhibiting G-protein coupled acetylcholine receptor signaling pathway(GO:0007197) |
| 0.2 | 1.0 | GO:0060267 | positive regulation of respiratory burst(GO:0060267) |
| 0.2 | 0.4 | GO:0035691 | macrophage migration inhibitory factor signaling pathway(GO:0035691) |
| 0.2 | 5.5 | GO:0035329 | hippo signaling(GO:0035329) |
| 0.2 | 2.9 | GO:0003215 | cardiac right ventricle morphogenesis(GO:0003215) |
| 0.2 | 3.7 | GO:0033622 | integrin activation(GO:0033622) |
| 0.2 | 0.2 | GO:0090521 | glomerular visceral epithelial cell migration(GO:0090521) |
| 0.2 | 1.4 | GO:0051084 | 'de novo' posttranslational protein folding(GO:0051084) |
| 0.2 | 1.2 | GO:0006710 | androgen catabolic process(GO:0006710) |
| 0.2 | 2.0 | GO:0030322 | stabilization of membrane potential(GO:0030322) |
| 0.2 | 5.4 | GO:0007216 | G-protein coupled glutamate receptor signaling pathway(GO:0007216) |
| 0.2 | 9.9 | GO:0007157 | heterophilic cell-cell adhesion via plasma membrane cell adhesion molecules(GO:0007157) |
| 0.2 | 18.5 | GO:0042035 | regulation of cytokine biosynthetic process(GO:0042035) |
| 0.2 | 3.3 | GO:0019800 | peptide cross-linking via chondroitin 4-sulfate glycosaminoglycan(GO:0019800) |
| 0.2 | 3.5 | GO:0048009 | insulin-like growth factor receptor signaling pathway(GO:0048009) |
| 0.2 | 0.6 | GO:0043415 | myoblast fate determination(GO:0007518) positive regulation of skeletal muscle tissue regeneration(GO:0043415) regulation of skeletal muscle tissue regeneration(GO:0043416) |
| 0.2 | 1.0 | GO:1903588 | negative regulation of blood vessel endothelial cell proliferation involved in sprouting angiogenesis(GO:1903588) |
| 0.2 | 0.2 | GO:0048631 | regulation of skeletal muscle tissue growth(GO:0048631) |
| 0.2 | 0.8 | GO:0000379 | tRNA-type intron splice site recognition and cleavage(GO:0000379) |
| 0.2 | 2.4 | GO:1990001 | inhibition of cysteine-type endopeptidase activity involved in apoptotic process(GO:1990001) |
| 0.2 | 2.8 | GO:0042340 | keratan sulfate catabolic process(GO:0042340) |
| 0.2 | 3.4 | GO:0045109 | intermediate filament organization(GO:0045109) |
| 0.2 | 2.2 | GO:0043922 | negative regulation by host of viral transcription(GO:0043922) |
| 0.2 | 0.7 | GO:1903803 | glutamine secretion(GO:0010585) L-glutamine import(GO:0036229) L-glutamine import into cell(GO:1903803) |
| 0.2 | 4.1 | GO:2000352 | negative regulation of endothelial cell apoptotic process(GO:2000352) |
| 0.2 | 0.2 | GO:0031269 | cell motility involved in cerebral cortex radial glia guided migration(GO:0021814) modulation of microtubule cytoskeleton involved in cerebral cortex radial glia guided migration(GO:0021815) pseudopodium assembly(GO:0031269) |
| 0.2 | 1.7 | GO:0046007 | negative regulation of activated T cell proliferation(GO:0046007) |
| 0.2 | 1.8 | GO:0034138 | toll-like receptor 3 signaling pathway(GO:0034138) |
| 0.2 | 2.0 | GO:0043249 | erythrocyte maturation(GO:0043249) |
| 0.2 | 1.7 | GO:1903800 | positive regulation of production of miRNAs involved in gene silencing by miRNA(GO:1903800) |
| 0.2 | 5.1 | GO:0007080 | mitotic metaphase plate congression(GO:0007080) |
| 0.2 | 0.4 | GO:1902285 | semaphorin-plexin signaling pathway involved in neuron projection guidance(GO:1902285) |
| 0.2 | 0.4 | GO:0042481 | regulation of odontogenesis(GO:0042481) |
| 0.2 | 1.3 | GO:0015705 | iodide transport(GO:0015705) |
| 0.2 | 0.2 | GO:0030540 | female genitalia development(GO:0030540) |
| 0.2 | 1.8 | GO:0033689 | negative regulation of osteoblast proliferation(GO:0033689) |
| 0.2 | 1.1 | GO:0031666 | positive regulation of lipopolysaccharide-mediated signaling pathway(GO:0031666) |
| 0.2 | 0.5 | GO:0043435 | response to corticotropin-releasing hormone(GO:0043435) cellular response to corticotropin-releasing hormone stimulus(GO:0071376) |
| 0.2 | 0.9 | GO:1902044 | regulation of Fas signaling pathway(GO:1902044) |
| 0.2 | 1.8 | GO:1904896 | ESCRT complex disassembly(GO:1904896) ESCRT III complex disassembly(GO:1904903) |
| 0.2 | 1.1 | GO:0006987 | activation of signaling protein activity involved in unfolded protein response(GO:0006987) |
| 0.2 | 0.9 | GO:0035973 | aggrephagy(GO:0035973) |
| 0.2 | 0.7 | GO:0035413 | positive regulation of catenin import into nucleus(GO:0035413) |
| 0.2 | 0.2 | GO:0014878 | response to electrical stimulus involved in regulation of muscle adaptation(GO:0014878) |
| 0.2 | 2.8 | GO:0033234 | negative regulation of protein sumoylation(GO:0033234) |
| 0.2 | 6.0 | GO:0002011 | morphogenesis of an epithelial sheet(GO:0002011) |
| 0.2 | 1.2 | GO:0034587 | piRNA metabolic process(GO:0034587) |
| 0.2 | 1.2 | GO:0046541 | saliva secretion(GO:0046541) |
| 0.2 | 1.5 | GO:0032330 | regulation of chondrocyte differentiation(GO:0032330) |
| 0.2 | 7.1 | GO:0071470 | cellular response to osmotic stress(GO:0071470) |
| 0.2 | 0.2 | GO:0038163 | thrombopoietin-mediated signaling pathway(GO:0038163) |
| 0.2 | 4.1 | GO:0030488 | tRNA methylation(GO:0030488) |
| 0.2 | 0.3 | GO:0035854 | regulation of primitive erythrocyte differentiation(GO:0010725) eosinophil fate commitment(GO:0035854) regulation of forebrain neuron differentiation(GO:2000977) |
| 0.2 | 5.7 | GO:0043277 | apoptotic cell clearance(GO:0043277) |
| 0.2 | 1.8 | GO:1904380 | endoplasmic reticulum mannose trimming(GO:1904380) |
| 0.2 | 4.2 | GO:0060384 | innervation(GO:0060384) |
| 0.2 | 1.3 | GO:0036500 | ATF6-mediated unfolded protein response(GO:0036500) |
| 0.2 | 0.8 | GO:0016198 | axon choice point recognition(GO:0016198) |
| 0.2 | 1.0 | GO:0048266 | behavioral response to pain(GO:0048266) |
| 0.2 | 0.7 | GO:0060766 | negative regulation of androgen receptor signaling pathway(GO:0060766) |
| 0.2 | 2.2 | GO:0033617 | mitochondrial respiratory chain complex IV assembly(GO:0033617) |
| 0.2 | 0.5 | GO:0051127 | positive regulation of actin nucleation(GO:0051127) |
| 0.2 | 0.3 | GO:1900114 | positive regulation of histone H3-K9 trimethylation(GO:1900114) |
| 0.2 | 2.0 | GO:0046085 | adenosine metabolic process(GO:0046085) |
| 0.2 | 1.3 | GO:0032793 | positive regulation of CREB transcription factor activity(GO:0032793) |
| 0.2 | 1.5 | GO:0032331 | negative regulation of chondrocyte differentiation(GO:0032331) |
| 0.2 | 1.0 | GO:0042713 | sperm ejaculation(GO:0042713) |
| 0.2 | 2.0 | GO:0001829 | trophectodermal cell differentiation(GO:0001829) |
| 0.2 | 2.1 | GO:0015732 | prostaglandin transport(GO:0015732) |
| 0.2 | 0.8 | GO:0060081 | membrane hyperpolarization(GO:0060081) |
| 0.2 | 1.8 | GO:0034472 | snRNA 3'-end processing(GO:0034472) |
| 0.2 | 1.1 | GO:0046755 | viral budding(GO:0046755) multi-organism organelle organization(GO:1902590) multi-organism membrane budding(GO:1902592) |
| 0.2 | 5.4 | GO:0001706 | endoderm formation(GO:0001706) |
| 0.2 | 0.3 | GO:0097211 | response to gonadotropin-releasing hormone(GO:0097210) cellular response to gonadotropin-releasing hormone(GO:0097211) |
| 0.2 | 1.3 | GO:0035694 | mitochondrial protein catabolic process(GO:0035694) |
| 0.2 | 0.6 | GO:0033197 | response to vitamin E(GO:0033197) |
| 0.2 | 2.2 | GO:0034975 | protein folding in endoplasmic reticulum(GO:0034975) |
| 0.2 | 0.8 | GO:2000467 | positive regulation of glycogen (starch) synthase activity(GO:2000467) |
| 0.2 | 1.6 | GO:1900112 | regulation of histone H3-K9 trimethylation(GO:1900112) |
| 0.2 | 0.3 | GO:0021986 | epithalamus development(GO:0021538) habenula development(GO:0021986) |
| 0.2 | 2.3 | GO:0030199 | collagen fibril organization(GO:0030199) |
| 0.2 | 2.0 | GO:0003091 | renal water homeostasis(GO:0003091) |
| 0.2 | 0.3 | GO:0021800 | cerebral cortex tangential migration(GO:0021800) |
| 0.2 | 0.5 | GO:0008626 | granzyme-mediated apoptotic signaling pathway(GO:0008626) |
| 0.2 | 0.9 | GO:0022027 | interkinetic nuclear migration(GO:0022027) |
| 0.1 | 1.0 | GO:0045023 | G0 to G1 transition(GO:0045023) |
| 0.1 | 1.8 | GO:0001569 | patterning of blood vessels(GO:0001569) |
| 0.1 | 1.5 | GO:0045717 | negative regulation of fatty acid biosynthetic process(GO:0045717) |
| 0.1 | 1.8 | GO:0033169 | histone H3-K9 demethylation(GO:0033169) |
| 0.1 | 8.3 | GO:0016266 | O-glycan processing(GO:0016266) |
| 0.1 | 1.3 | GO:2000576 | positive regulation of microtubule motor activity(GO:2000576) |
| 0.1 | 0.1 | GO:0003415 | chondrocyte hypertrophy(GO:0003415) |
| 0.1 | 0.6 | GO:0000389 | mRNA 3'-splice site recognition(GO:0000389) |
| 0.1 | 1.0 | GO:0070255 | regulation of mucus secretion(GO:0070255) positive regulation of mucus secretion(GO:0070257) |
| 0.1 | 1.4 | GO:0044341 | sodium-dependent phosphate transport(GO:0044341) |
| 0.1 | 1.4 | GO:0001574 | ganglioside biosynthetic process(GO:0001574) |
| 0.1 | 0.6 | GO:0099558 | maintenance of synapse structure(GO:0099558) |
| 0.1 | 2.9 | GO:0045746 | negative regulation of Notch signaling pathway(GO:0045746) |
| 0.1 | 1.5 | GO:0034638 | phosphatidylcholine catabolic process(GO:0034638) |
| 0.1 | 0.8 | GO:0002353 | kinin cascade(GO:0002254) plasma kallikrein-kinin cascade(GO:0002353) |
| 0.1 | 0.7 | GO:0030916 | otic vesicle formation(GO:0030916) |
| 0.1 | 0.3 | GO:1902358 | sulfate transmembrane transport(GO:1902358) |
| 0.1 | 3.9 | GO:0006783 | heme biosynthetic process(GO:0006783) |
| 0.1 | 3.8 | GO:0051017 | actin filament bundle assembly(GO:0051017) |
| 0.1 | 1.2 | GO:0046940 | nucleoside monophosphate phosphorylation(GO:0046940) |
| 0.1 | 0.3 | GO:1902630 | regulation of membrane hyperpolarization(GO:1902630) |
| 0.1 | 2.8 | GO:0048665 | neuron fate specification(GO:0048665) |
| 0.1 | 0.9 | GO:0070127 | tRNA aminoacylation for mitochondrial protein translation(GO:0070127) |
| 0.1 | 2.1 | GO:0032780 | negative regulation of ATPase activity(GO:0032780) |
| 0.1 | 3.2 | GO:0051292 | nuclear pore complex assembly(GO:0051292) |
| 0.1 | 1.3 | GO:0010457 | centriole-centriole cohesion(GO:0010457) |
| 0.1 | 1.8 | GO:0021957 | corticospinal tract morphogenesis(GO:0021957) |
| 0.1 | 0.7 | GO:0071394 | cellular response to testosterone stimulus(GO:0071394) |
| 0.1 | 0.7 | GO:1900262 | regulation of DNA-directed DNA polymerase activity(GO:1900262) positive regulation of DNA-directed DNA polymerase activity(GO:1900264) |
| 0.1 | 0.7 | GO:0070863 | positive regulation of protein exit from endoplasmic reticulum(GO:0070863) |
| 0.1 | 0.9 | GO:0046600 | negative regulation of centriole replication(GO:0046600) |
| 0.1 | 3.4 | GO:0006465 | signal peptide processing(GO:0006465) |
| 0.1 | 2.5 | GO:0071425 | hematopoietic stem cell proliferation(GO:0071425) |
| 0.1 | 0.3 | GO:1905064 | negative regulation of vascular smooth muscle cell differentiation(GO:1905064) |
| 0.1 | 0.4 | GO:1904491 | protein localization to ciliary transition zone(GO:1904491) |
| 0.1 | 1.0 | GO:0070475 | rRNA base methylation(GO:0070475) |
| 0.1 | 0.4 | GO:0006391 | transcription initiation from mitochondrial promoter(GO:0006391) |
| 0.1 | 0.6 | GO:1900452 | regulation of long term synaptic depression(GO:1900452) |
| 0.1 | 1.1 | GO:0071926 | endocannabinoid signaling pathway(GO:0071926) regulation of endocannabinoid signaling pathway(GO:2000124) |
| 0.1 | 1.9 | GO:0007141 | male meiosis I(GO:0007141) |
| 0.1 | 0.6 | GO:0045872 | positive regulation of rhodopsin gene expression(GO:0045872) |
| 0.1 | 0.4 | GO:0014745 | negative regulation of muscle adaptation(GO:0014745) |
| 0.1 | 0.5 | GO:0006238 | CMP salvage(GO:0006238) CMP biosynthetic process(GO:0009224) CMP metabolic process(GO:0046035) |
| 0.1 | 1.1 | GO:0061339 | establishment of monopolar cell polarity(GO:0061162) establishment or maintenance of monopolar cell polarity(GO:0061339) |
| 0.1 | 1.5 | GO:0006610 | ribosomal protein import into nucleus(GO:0006610) |
| 0.1 | 0.9 | GO:0033327 | Leydig cell differentiation(GO:0033327) |
| 0.1 | 0.9 | GO:0015712 | hexose phosphate transport(GO:0015712) glucose-6-phosphate transport(GO:0015760) |
| 0.1 | 0.1 | GO:0032353 | negative regulation of glucocorticoid metabolic process(GO:0031944) negative regulation of glucocorticoid biosynthetic process(GO:0031947) negative regulation of hormone biosynthetic process(GO:0032353) negative regulation of steroid hormone biosynthetic process(GO:0090032) |
| 0.1 | 3.0 | GO:0030252 | growth hormone secretion(GO:0030252) |
| 0.1 | 3.2 | GO:1904659 | hexose transmembrane transport(GO:0035428) glucose transmembrane transport(GO:1904659) |
| 0.1 | 1.7 | GO:0040015 | negative regulation of multicellular organism growth(GO:0040015) |
| 0.1 | 1.2 | GO:0032025 | response to cobalt ion(GO:0032025) |
| 0.1 | 0.8 | GO:0060056 | mammary gland involution(GO:0060056) |
| 0.1 | 0.5 | GO:0048149 | behavioral response to ethanol(GO:0048149) |
| 0.1 | 0.8 | GO:0001825 | blastocyst formation(GO:0001825) |
| 0.1 | 0.5 | GO:0035754 | B cell chemotaxis(GO:0035754) |
| 0.1 | 4.6 | GO:0070884 | regulation of calcineurin-NFAT signaling cascade(GO:0070884) |
| 0.1 | 4.8 | GO:0010761 | fibroblast migration(GO:0010761) |
| 0.1 | 1.1 | GO:0072520 | seminiferous tubule development(GO:0072520) |
| 0.1 | 8.5 | GO:0001523 | retinoid metabolic process(GO:0001523) |
| 0.1 | 1.4 | GO:2000505 | regulation of energy homeostasis(GO:2000505) |
| 0.1 | 0.7 | GO:0070120 | ciliary neurotrophic factor-mediated signaling pathway(GO:0070120) |
| 0.1 | 0.7 | GO:0048485 | sympathetic nervous system development(GO:0048485) |
| 0.1 | 6.3 | GO:0030282 | bone mineralization(GO:0030282) |
| 0.1 | 0.3 | GO:0098974 | postsynaptic actin cytoskeleton organization(GO:0098974) |
| 0.1 | 0.4 | GO:0090301 | fibroblast growth factor receptor signaling pathway involved in neural plate anterior/posterior pattern formation(GO:0060825) regulation of neural crest formation(GO:0090299) negative regulation of neural crest formation(GO:0090301) regulation of fibroblast growth factor receptor signaling pathway involved in neural plate anterior/posterior pattern formation(GO:2000313) negative regulation of fibroblast growth factor receptor signaling pathway involved in neural plate anterior/posterior pattern formation(GO:2000314) |
| 0.1 | 4.8 | GO:0030574 | collagen catabolic process(GO:0030574) |
| 0.1 | 0.6 | GO:0046092 | deoxycytidine metabolic process(GO:0046092) |
| 0.1 | 0.6 | GO:0072719 | cellular response to cisplatin(GO:0072719) |
| 0.1 | 0.5 | GO:0038042 | dimeric G-protein coupled receptor signaling pathway(GO:0038042) calcitonin family receptor signaling pathway(GO:0097646) amylin receptor signaling pathway(GO:0097647) |
| 0.1 | 1.3 | GO:0010811 | positive regulation of cell-substrate adhesion(GO:0010811) |
| 0.1 | 0.2 | GO:0035407 | histone H3-T11 phosphorylation(GO:0035407) |
| 0.1 | 0.4 | GO:0048730 | epidermis morphogenesis(GO:0048730) |
| 0.1 | 0.7 | GO:0021846 | cell proliferation in forebrain(GO:0021846) |
| 0.1 | 0.3 | GO:1900025 | negative regulation of substrate adhesion-dependent cell spreading(GO:1900025) |
| 0.1 | 0.6 | GO:0006907 | pinocytosis(GO:0006907) |
| 0.1 | 0.5 | GO:0071455 | cellular response to hyperoxia(GO:0071455) |
| 0.1 | 3.4 | GO:0034446 | substrate adhesion-dependent cell spreading(GO:0034446) |
| 0.1 | 1.0 | GO:0002227 | innate immune response in mucosa(GO:0002227) |
| 0.1 | 0.3 | GO:1990086 | lens fiber cell apoptotic process(GO:1990086) |
| 0.1 | 0.4 | GO:0001880 | Mullerian duct regression(GO:0001880) |
| 0.1 | 1.1 | GO:0035246 | peptidyl-arginine N-methylation(GO:0035246) |
| 0.1 | 5.4 | GO:0015701 | bicarbonate transport(GO:0015701) |
| 0.1 | 2.7 | GO:0045214 | sarcomere organization(GO:0045214) |
| 0.1 | 0.2 | GO:0030035 | microspike assembly(GO:0030035) |
| 0.1 | 0.3 | GO:1901804 | beta-glucoside metabolic process(GO:1901804) beta-glucoside catabolic process(GO:1901805) positive regulation of neuronal action potential(GO:1904457) |
| 0.1 | 3.6 | GO:0000027 | ribosomal large subunit assembly(GO:0000027) |
| 0.1 | 0.1 | GO:1900756 | protein processing in phagocytic vesicle(GO:1900756) regulation of protein processing in phagocytic vesicle(GO:1903921) positive regulation of protein processing in phagocytic vesicle(GO:1903923) |
| 0.1 | 0.6 | GO:0048711 | positive regulation of astrocyte differentiation(GO:0048711) |
| 0.1 | 2.8 | GO:0000715 | nucleotide-excision repair, DNA damage recognition(GO:0000715) |
| 0.1 | 0.3 | GO:0090009 | primitive streak formation(GO:0090009) |
| 0.1 | 1.3 | GO:0045948 | positive regulation of translational initiation(GO:0045948) |
| 0.1 | 1.0 | GO:0015812 | gamma-aminobutyric acid transport(GO:0015812) |
| 0.1 | 0.7 | GO:0051775 | response to redox state(GO:0051775) |
| 0.1 | 0.3 | GO:0006990 | positive regulation of transcription from RNA polymerase II promoter involved in unfolded protein response(GO:0006990) |
| 0.1 | 0.5 | GO:0071027 | nuclear RNA surveillance(GO:0071027) nuclear mRNA surveillance(GO:0071028) |
| 0.1 | 1.4 | GO:2000179 | positive regulation of neural precursor cell proliferation(GO:2000179) |
| 0.1 | 0.2 | GO:0071623 | negative regulation of granulocyte chemotaxis(GO:0071623) negative regulation of neutrophil chemotaxis(GO:0090024) negative regulation of neutrophil migration(GO:1902623) |
| 0.1 | 6.3 | GO:0007229 | integrin-mediated signaling pathway(GO:0007229) |
| 0.1 | 0.3 | GO:0098908 | regulation of neuronal action potential(GO:0098908) |
| 0.1 | 2.7 | GO:0045600 | positive regulation of fat cell differentiation(GO:0045600) |
| 0.1 | 0.6 | GO:1902741 | type I interferon secretion(GO:0072641) interferon-alpha secretion(GO:0072642) regulation of interferon-alpha secretion(GO:1902739) positive regulation of interferon-alpha secretion(GO:1902741) |
| 0.1 | 1.4 | GO:0003310 | pancreatic A cell differentiation(GO:0003310) |
| 0.1 | 0.8 | GO:0046951 | ketone body biosynthetic process(GO:0046951) |
| 0.1 | 0.3 | GO:0098703 | calcium ion import across plasma membrane(GO:0098703) calcium ion import into cell(GO:1990035) |
| 0.1 | 1.0 | GO:1903441 | protein localization to ciliary membrane(GO:1903441) |
| 0.1 | 1.5 | GO:0032098 | regulation of appetite(GO:0032098) |
| 0.1 | 1.2 | GO:0070935 | 3'-UTR-mediated mRNA stabilization(GO:0070935) |
| 0.1 | 0.4 | GO:0014820 | tonic smooth muscle contraction(GO:0014820) artery smooth muscle contraction(GO:0014824) |
| 0.1 | 0.9 | GO:0048535 | lymph node development(GO:0048535) |
| 0.1 | 1.5 | GO:0046069 | cGMP catabolic process(GO:0046069) |
| 0.1 | 0.5 | GO:0003096 | renal sodium ion transport(GO:0003096) renal sodium ion absorption(GO:0070294) |
| 0.1 | 0.8 | GO:0043552 | positive regulation of phosphatidylinositol 3-kinase activity(GO:0043552) |
| 0.1 | 2.0 | GO:0006622 | protein targeting to lysosome(GO:0006622) |
| 0.1 | 2.0 | GO:0009083 | branched-chain amino acid catabolic process(GO:0009083) |
| 0.1 | 1.2 | GO:0010510 | regulation of acetyl-CoA biosynthetic process from pyruvate(GO:0010510) |
| 0.1 | 0.5 | GO:0045054 | constitutive secretory pathway(GO:0045054) regulation of constitutive secretory pathway(GO:1903433) |
| 0.1 | 2.6 | GO:0030888 | regulation of B cell proliferation(GO:0030888) |
| 0.1 | 0.8 | GO:1902018 | negative regulation of cilium assembly(GO:1902018) |
| 0.1 | 0.2 | GO:0071529 | cementum mineralization(GO:0071529) |
| 0.1 | 0.5 | GO:0060628 | regulation of ER to Golgi vesicle-mediated transport(GO:0060628) |
| 0.1 | 0.1 | GO:0060033 | anatomical structure regression(GO:0060033) |
| 0.1 | 0.5 | GO:0042797 | 5S class rRNA transcription from RNA polymerase III type 1 promoter(GO:0042791) tRNA transcription from RNA polymerase III promoter(GO:0042797) |
| 0.1 | 1.8 | GO:0009303 | rRNA transcription(GO:0009303) |
| 0.1 | 4.4 | GO:0007218 | neuropeptide signaling pathway(GO:0007218) |
| 0.1 | 0.3 | GO:0098814 | spontaneous neurotransmitter secretion(GO:0061669) spontaneous synaptic transmission(GO:0098814) |
| 0.1 | 0.9 | GO:0006600 | creatine metabolic process(GO:0006600) |
| 0.1 | 0.1 | GO:1900084 | regulation of peptidyl-tyrosine autophosphorylation(GO:1900084) |
| 0.1 | 1.6 | GO:1901185 | negative regulation of ERBB signaling pathway(GO:1901185) |
| 0.1 | 0.5 | GO:0002566 | somatic diversification of immune receptors via somatic mutation(GO:0002566) somatic hypermutation of immunoglobulin genes(GO:0016446) |
| 0.1 | 0.3 | GO:1903012 | positive regulation of bone development(GO:1903012) positive regulation of osteoclast development(GO:2001206) |
| 0.1 | 1.9 | GO:0032755 | positive regulation of interleukin-6 production(GO:0032755) |
| 0.1 | 1.2 | GO:0009880 | embryonic pattern specification(GO:0009880) |
| 0.1 | 1.2 | GO:0000289 | nuclear-transcribed mRNA poly(A) tail shortening(GO:0000289) |
| 0.1 | 0.5 | GO:0060736 | prostate gland growth(GO:0060736) |
| 0.1 | 1.1 | GO:0045589 | regulation of regulatory T cell differentiation(GO:0045589) |
| 0.1 | 0.4 | GO:0007530 | sex determination(GO:0007530) |
| 0.1 | 0.2 | GO:0060087 | relaxation of smooth muscle(GO:0044557) relaxation of vascular smooth muscle(GO:0060087) |
| 0.1 | 0.5 | GO:0040020 | regulation of meiotic nuclear division(GO:0040020) |
| 0.1 | 0.2 | GO:2000270 | negative regulation of fibroblast apoptotic process(GO:2000270) |
| 0.1 | 6.7 | GO:0007156 | homophilic cell adhesion via plasma membrane adhesion molecules(GO:0007156) |
| 0.1 | 3.8 | GO:0030330 | DNA damage response, signal transduction by p53 class mediator(GO:0030330) |
| 0.1 | 2.3 | GO:1901385 | regulation of voltage-gated calcium channel activity(GO:1901385) |
| 0.1 | 0.5 | GO:0031442 | positive regulation of mRNA 3'-end processing(GO:0031442) |
| 0.1 | 2.5 | GO:0051965 | positive regulation of synapse assembly(GO:0051965) |
| 0.1 | 0.8 | GO:0003334 | keratinocyte development(GO:0003334) |
| 0.1 | 2.0 | GO:0060395 | SMAD protein signal transduction(GO:0060395) |
| 0.0 | 0.3 | GO:0042255 | ribosome assembly(GO:0042255) |
| 0.0 | 0.7 | GO:0043550 | regulation of lipid kinase activity(GO:0043550) |
| 0.0 | 0.2 | GO:0046125 | thymidine metabolic process(GO:0046104) pyrimidine deoxyribonucleoside metabolic process(GO:0046125) |
| 0.0 | 0.1 | GO:0071233 | cellular response to leucine(GO:0071233) |
| 0.0 | 0.4 | GO:0032875 | regulation of DNA endoreduplication(GO:0032875) DNA endoreduplication(GO:0042023) |
| 0.0 | 0.3 | GO:0000028 | ribosomal small subunit assembly(GO:0000028) |
| 0.0 | 0.1 | GO:0051445 | regulation of meiotic cell cycle(GO:0051445) |
| 0.0 | 0.8 | GO:1901663 | ubiquinone biosynthetic process(GO:0006744) quinone biosynthetic process(GO:1901663) |
| 0.0 | 0.5 | GO:0001755 | neural crest cell migration(GO:0001755) |
| 0.0 | 0.8 | GO:0006359 | regulation of transcription from RNA polymerase III promoter(GO:0006359) |
| 0.0 | 0.6 | GO:0048240 | sperm capacitation(GO:0048240) |
| 0.0 | 0.1 | GO:2001028 | positive regulation of endothelial cell chemotaxis(GO:2001028) |
| 0.0 | 0.2 | GO:0042748 | circadian sleep/wake cycle, non-REM sleep(GO:0042748) regulation of circadian sleep/wake cycle, non-REM sleep(GO:0045188) |
| 0.0 | 0.2 | GO:0023021 | termination of signal transduction(GO:0023021) |
| 0.0 | 0.5 | GO:0034498 | early endosome to Golgi transport(GO:0034498) |
| 0.0 | 0.1 | GO:0006003 | fructose 2,6-bisphosphate metabolic process(GO:0006003) |
| 0.0 | 0.3 | GO:0007379 | segment specification(GO:0007379) |
| 0.0 | 1.0 | GO:0030224 | monocyte differentiation(GO:0030224) |
| 0.0 | 0.4 | GO:0043011 | myeloid dendritic cell differentiation(GO:0043011) |
| 0.0 | 0.9 | GO:0050912 | detection of chemical stimulus involved in sensory perception of taste(GO:0050912) |
| 0.0 | 0.5 | GO:0045662 | negative regulation of myoblast differentiation(GO:0045662) |
| 0.0 | 1.3 | GO:0019228 | neuronal action potential(GO:0019228) |
| 0.0 | 0.0 | GO:0048304 | positive regulation of isotype switching to IgG isotypes(GO:0048304) |
| 0.0 | 0.0 | GO:0021562 | vestibulocochlear nerve development(GO:0021562) |
| 0.0 | 0.6 | GO:0000042 | protein targeting to Golgi(GO:0000042) |
| 0.0 | 0.2 | GO:0018343 | protein farnesylation(GO:0018343) |
| 0.0 | 0.4 | GO:0030828 | positive regulation of cGMP biosynthetic process(GO:0030828) |
| 0.0 | 0.1 | GO:0002903 | negative regulation of B cell apoptotic process(GO:0002903) |
| 0.0 | 0.5 | GO:0098779 | mitophagy in response to mitochondrial depolarization(GO:0098779) |
| 0.0 | 0.6 | GO:0006482 | protein demethylation(GO:0006482) protein dealkylation(GO:0008214) |
| 0.0 | 0.2 | GO:0031339 | negative regulation of vesicle fusion(GO:0031339) |
| 0.0 | 0.3 | GO:0072383 | plus-end-directed vesicle transport along microtubule(GO:0072383) |
| 0.0 | 0.5 | GO:0090083 | regulation of inclusion body assembly(GO:0090083) |
| 0.0 | 0.4 | GO:0051256 | mitotic spindle midzone assembly(GO:0051256) |
| 0.0 | 0.5 | GO:0044458 | motile cilium assembly(GO:0044458) |
| 0.0 | 0.9 | GO:0000281 | mitotic cytokinesis(GO:0000281) |
| 0.0 | 0.7 | GO:0051482 | positive regulation of cytosolic calcium ion concentration involved in phospholipase C-activating G-protein coupled signaling pathway(GO:0051482) |
| 0.0 | 0.2 | GO:2000042 | negative regulation of double-strand break repair via homologous recombination(GO:2000042) |
| 0.0 | 4.5 | GO:0006665 | sphingolipid metabolic process(GO:0006665) |
| 0.0 | 0.5 | GO:0050891 | multicellular organismal water homeostasis(GO:0050891) |
| 0.0 | 0.4 | GO:0034067 | protein localization to Golgi apparatus(GO:0034067) |
| 0.0 | 0.2 | GO:0045671 | negative regulation of osteoclast differentiation(GO:0045671) |
| 0.0 | 0.8 | GO:1903959 | regulation of anion transmembrane transport(GO:1903959) |
| 0.0 | 0.7 | GO:0072488 | ammonium transmembrane transport(GO:0072488) |
| 0.0 | 0.2 | GO:0032218 | riboflavin transport(GO:0032218) |
| 0.0 | 0.3 | GO:0035589 | G-protein coupled purinergic nucleotide receptor signaling pathway(GO:0035589) |
| 0.0 | 0.3 | GO:0030728 | ovulation(GO:0030728) |
| 0.0 | 0.8 | GO:0030490 | maturation of SSU-rRNA(GO:0030490) |
| 0.0 | 0.5 | GO:0001657 | ureteric bud development(GO:0001657) mesonephric epithelium development(GO:0072163) mesonephric tubule development(GO:0072164) |
| 0.0 | 0.1 | GO:0038203 | TORC2 signaling(GO:0038203) |
| 0.0 | 1.9 | GO:0007160 | cell-matrix adhesion(GO:0007160) |
| 0.0 | 0.5 | GO:0007043 | cell-cell junction assembly(GO:0007043) |
| 0.0 | 0.5 | GO:0000038 | very long-chain fatty acid metabolic process(GO:0000038) |
| 0.0 | 0.0 | GO:0060687 | regulation of branching involved in prostate gland morphogenesis(GO:0060687) |
| 0.0 | 0.3 | GO:0009798 | axis specification(GO:0009798) |
| 0.0 | 0.0 | GO:0043376 | regulation of CD8-positive, alpha-beta T cell differentiation(GO:0043376) |
| 0.0 | 1.4 | GO:0048207 | vesicle coating(GO:0006901) vesicle targeting, rough ER to cis-Golgi(GO:0048207) COPII vesicle coating(GO:0048208) |
| 0.0 | 2.6 | GO:0006613 | cotranslational protein targeting to membrane(GO:0006613) |
| 0.0 | 0.9 | GO:0042273 | ribosomal large subunit biogenesis(GO:0042273) |
| 0.0 | 0.1 | GO:0072176 | nephric duct development(GO:0072176) |
| 0.0 | 0.2 | GO:1901409 | positive regulation of phosphorylation of RNA polymerase II C-terminal domain(GO:1901409) |
| 0.0 | 0.2 | GO:0032354 | response to follicle-stimulating hormone(GO:0032354) |
| 0.0 | 0.2 | GO:0051131 | chaperone-mediated protein complex assembly(GO:0051131) |
| 0.0 | 1.7 | GO:0050911 | detection of chemical stimulus involved in sensory perception of smell(GO:0050911) |
| 0.0 | 0.1 | GO:0033564 | anterior/posterior axon guidance(GO:0033564) |
| 0.0 | 1.9 | GO:0031032 | actomyosin structure organization(GO:0031032) |
| 0.0 | 0.2 | GO:0098914 | membrane repolarization during atrial cardiac muscle cell action potential(GO:0098914) |
| 0.0 | 0.1 | GO:0015671 | oxygen transport(GO:0015671) |
| 0.0 | 0.1 | GO:0017183 | peptidyl-diphthamide metabolic process(GO:0017182) peptidyl-diphthamide biosynthetic process from peptidyl-histidine(GO:0017183) |
| 0.0 | 0.2 | GO:0071320 | cellular response to cAMP(GO:0071320) |
| 0.0 | 0.3 | GO:0046597 | negative regulation of viral entry into host cell(GO:0046597) |
| 0.0 | 0.1 | GO:0060008 | Sertoli cell differentiation(GO:0060008) |
| 0.0 | 0.4 | GO:0033275 | muscle filament sliding(GO:0030049) actin-myosin filament sliding(GO:0033275) |
Gene overrepresentation in cellular component category:
| Log-likelihood per target | Total log-likelihood | Term | Description |
|---|---|---|---|
| 3.2 | 12.8 | GO:0070435 | Shc-EGFR complex(GO:0070435) |
| 3.1 | 24.7 | GO:0005587 | collagen type IV trimer(GO:0005587) |
| 3.0 | 11.8 | GO:0034667 | integrin alpha3-beta1 complex(GO:0034667) |
| 2.9 | 8.6 | GO:1902737 | dendritic filopodium(GO:1902737) |
| 2.7 | 27.0 | GO:0097487 | multivesicular body, internal vesicle(GO:0097487) |
| 2.4 | 16.8 | GO:0044354 | pinosome(GO:0044352) macropinosome(GO:0044354) |
| 2.3 | 6.8 | GO:0043259 | laminin-10 complex(GO:0043259) laminin-11 complex(GO:0043260) |
| 2.2 | 37.4 | GO:0034098 | VCP-NPL4-UFD1 AAA ATPase complex(GO:0034098) |
| 2.0 | 6.1 | GO:0034686 | integrin alphav-beta8 complex(GO:0034686) |
| 1.9 | 25.2 | GO:0098643 | fibrillar collagen trimer(GO:0005583) banded collagen fibril(GO:0098643) |
| 1.8 | 7.1 | GO:0048179 | activin receptor complex(GO:0048179) |
| 1.7 | 14.9 | GO:0071953 | elastic fiber(GO:0071953) |
| 1.5 | 31.6 | GO:0044300 | cerebellar mossy fiber(GO:0044300) |
| 1.5 | 4.4 | GO:0034455 | t-UTP complex(GO:0034455) |
| 1.4 | 11.1 | GO:0061689 | tricellular tight junction(GO:0061689) |
| 1.3 | 18.3 | GO:0005862 | muscle thin filament tropomyosin(GO:0005862) |
| 1.3 | 6.5 | GO:0070847 | core mediator complex(GO:0070847) |
| 1.3 | 5.0 | GO:0000818 | nuclear MIS12/MIND complex(GO:0000818) |
| 1.2 | 17.0 | GO:0017146 | NMDA selective glutamate receptor complex(GO:0017146) |
| 1.1 | 11.5 | GO:0016011 | dystroglycan complex(GO:0016011) |
| 1.1 | 14.2 | GO:0005915 | zonula adherens(GO:0005915) |
| 1.1 | 17.2 | GO:0097470 | ribbon synapse(GO:0097470) |
| 1.0 | 11.5 | GO:0005577 | fibrinogen complex(GO:0005577) |
| 1.0 | 3.1 | GO:0032426 | stereocilium tip(GO:0032426) |
| 1.0 | 2.0 | GO:0005899 | insulin receptor complex(GO:0005899) |
| 1.0 | 3.0 | GO:0043512 | inhibin complex(GO:0043511) inhibin A complex(GO:0043512) |
| 1.0 | 4.9 | GO:0070381 | endosome to plasma membrane transport vesicle(GO:0070381) |
| 1.0 | 6.9 | GO:0035985 | senescence-associated heterochromatin focus(GO:0035985) |
| 1.0 | 6.7 | GO:0071664 | beta-catenin-TCF7L2 complex(GO:0070369) catenin-TCF7L2 complex(GO:0071664) |
| 0.9 | 3.7 | GO:0071942 | XPC complex(GO:0071942) |
| 0.9 | 4.5 | GO:0034673 | inhibin-betaglycan-ActRII complex(GO:0034673) |
| 0.9 | 2.7 | GO:0097135 | cyclin E2-CDK2 complex(GO:0097135) |
| 0.8 | 1.7 | GO:0071062 | alphav-beta3 integrin-vitronectin complex(GO:0071062) |
| 0.8 | 0.8 | GO:0034681 | integrin alpha11-beta1 complex(GO:0034681) |
| 0.8 | 4.2 | GO:0016589 | NURF complex(GO:0016589) |
| 0.8 | 30.6 | GO:0031092 | platelet alpha granule membrane(GO:0031092) |
| 0.8 | 4.8 | GO:0031501 | mannosyltransferase complex(GO:0031501) |
| 0.8 | 4.0 | GO:0031673 | H zone(GO:0031673) |
| 0.8 | 2.4 | GO:0071148 | TEAD-1-YAP complex(GO:0071148) |
| 0.8 | 2.3 | GO:0098536 | deuterosome(GO:0098536) |
| 0.8 | 6.8 | GO:0019907 | cyclin-dependent protein kinase activating kinase holoenzyme complex(GO:0019907) |
| 0.7 | 6.6 | GO:0000938 | GARP complex(GO:0000938) |
| 0.7 | 5.8 | GO:0033655 | host cell cytoplasm(GO:0030430) host cell cytoplasm part(GO:0033655) |
| 0.7 | 22.3 | GO:0005921 | gap junction(GO:0005921) |
| 0.7 | 16.2 | GO:0005916 | fascia adherens(GO:0005916) |
| 0.7 | 4.1 | GO:0034751 | aryl hydrocarbon receptor complex(GO:0034751) |
| 0.7 | 10.7 | GO:0046658 | anchored component of plasma membrane(GO:0046658) |
| 0.6 | 11.0 | GO:0030056 | hemidesmosome(GO:0030056) |
| 0.6 | 6.9 | GO:0005638 | lamin filament(GO:0005638) |
| 0.6 | 3.0 | GO:0071458 | integral component of cytoplasmic side of endoplasmic reticulum membrane(GO:0071458) |
| 0.6 | 3.0 | GO:0032302 | MutSbeta complex(GO:0032302) |
| 0.6 | 1.2 | GO:0071546 | pi-body(GO:0071546) |
| 0.6 | 1.8 | GO:0070939 | Dsl1p complex(GO:0070939) |
| 0.6 | 13.8 | GO:0002080 | acrosomal membrane(GO:0002080) |
| 0.6 | 4.0 | GO:0030991 | intraciliary transport particle A(GO:0030991) |
| 0.6 | 7.4 | GO:0098647 | collagen type VI trimer(GO:0005589) collagen beaded filament(GO:0098647) |
| 0.6 | 1.7 | GO:0097123 | cyclin A1-CDK2 complex(GO:0097123) |
| 0.6 | 2.2 | GO:0005960 | glycine cleavage complex(GO:0005960) |
| 0.6 | 0.6 | GO:0097059 | CNTFR-CLCF1 complex(GO:0097059) |
| 0.5 | 17.9 | GO:0031233 | intrinsic component of external side of plasma membrane(GO:0031233) |
| 0.5 | 3.2 | GO:0005610 | laminin-5 complex(GO:0005610) |
| 0.5 | 1.6 | GO:0005600 | collagen type XIII trimer(GO:0005600) transmembrane collagen trimer(GO:0030936) |
| 0.5 | 3.2 | GO:0014802 | terminal cisterna(GO:0014802) |
| 0.5 | 1.6 | GO:0070701 | mucus layer(GO:0070701) |
| 0.5 | 5.2 | GO:0031941 | filamentous actin(GO:0031941) |
| 0.5 | 9.3 | GO:0030014 | CCR4-NOT complex(GO:0030014) |
| 0.5 | 4.4 | GO:0033391 | chromatoid body(GO:0033391) |
| 0.5 | 1.4 | GO:0044609 | DBIRD complex(GO:0044609) |
| 0.5 | 0.9 | GO:0060201 | clathrin-sculpted acetylcholine transport vesicle(GO:0060200) clathrin-sculpted acetylcholine transport vesicle membrane(GO:0060201) |
| 0.5 | 2.8 | GO:0030062 | mitochondrial tricarboxylic acid cycle enzyme complex(GO:0030062) |
| 0.5 | 7.3 | GO:0035102 | PRC1 complex(GO:0035102) |
| 0.5 | 4.1 | GO:0072546 | ER membrane protein complex(GO:0072546) |
| 0.4 | 4.0 | GO:0005787 | signal peptidase complex(GO:0005787) |
| 0.4 | 6.0 | GO:0030285 | integral component of synaptic vesicle membrane(GO:0030285) intrinsic component of synaptic vesicle membrane(GO:0098563) |
| 0.4 | 2.5 | GO:0031232 | extrinsic component of external side of plasma membrane(GO:0031232) |
| 0.4 | 43.5 | GO:0005796 | Golgi lumen(GO:0005796) |
| 0.4 | 1.1 | GO:0034991 | nuclear meiotic cohesin complex(GO:0034991) |
| 0.4 | 3.7 | GO:0051286 | cell tip(GO:0051286) |
| 0.4 | 35.9 | GO:0032432 | actin filament bundle(GO:0032432) |
| 0.4 | 1.1 | GO:0090571 | RNA polymerase II transcription repressor complex(GO:0090571) |
| 0.4 | 1.8 | GO:1990761 | growth cone lamellipodium(GO:1990761) |
| 0.4 | 1.1 | GO:0031515 | tRNA (m1A) methyltransferase complex(GO:0031515) |
| 0.3 | 2.1 | GO:0033061 | DNA recombinase mediator complex(GO:0033061) Rad51B-Rad51C-Rad51D-XRCC2 complex(GO:0033063) |
| 0.3 | 6.8 | GO:1990124 | messenger ribonucleoprotein complex(GO:1990124) |
| 0.3 | 2.0 | GO:0005785 | signal recognition particle receptor complex(GO:0005785) |
| 0.3 | 3.7 | GO:0070775 | H3 histone acetyltransferase complex(GO:0070775) MOZ/MORF histone acetyltransferase complex(GO:0070776) |
| 0.3 | 6.7 | GO:0031588 | nucleotide-activated protein kinase complex(GO:0031588) |
| 0.3 | 4.0 | GO:0030126 | COPI vesicle coat(GO:0030126) |
| 0.3 | 3.3 | GO:0097443 | sorting endosome(GO:0097443) |
| 0.3 | 2.6 | GO:0005845 | mRNA cap binding complex(GO:0005845) |
| 0.3 | 1.0 | GO:0031262 | Ndc80 complex(GO:0031262) |
| 0.3 | 1.6 | GO:0031905 | early endosome lumen(GO:0031905) |
| 0.3 | 4.0 | GO:0036057 | filtration diaphragm(GO:0036056) slit diaphragm(GO:0036057) |
| 0.3 | 0.9 | GO:0033593 | BRCA2-MAGE-D1 complex(GO:0033593) |
| 0.3 | 2.2 | GO:0070110 | ciliary neurotrophic factor receptor complex(GO:0070110) |
| 0.3 | 5.7 | GO:0031089 | platelet dense granule lumen(GO:0031089) |
| 0.3 | 0.9 | GO:0032301 | MutSalpha complex(GO:0032301) |
| 0.3 | 4.2 | GO:0034663 | endoplasmic reticulum chaperone complex(GO:0034663) |
| 0.3 | 6.7 | GO:0030057 | desmosome(GO:0030057) |
| 0.3 | 0.6 | GO:1990425 | ryanodine receptor complex(GO:1990425) |
| 0.3 | 2.5 | GO:0002193 | MAML1-RBP-Jkappa- ICN1 complex(GO:0002193) |
| 0.3 | 1.7 | GO:0071144 | SMAD2-SMAD3 protein complex(GO:0071144) |
| 0.3 | 2.4 | GO:0016327 | apicolateral plasma membrane(GO:0016327) |
| 0.3 | 2.4 | GO:0032133 | chromosome passenger complex(GO:0032133) |
| 0.3 | 0.5 | GO:0044305 | calyx of Held(GO:0044305) |
| 0.3 | 1.1 | GO:1990589 | ATF4-CREB1 transcription factor complex(GO:1990589) |
| 0.3 | 1.8 | GO:0036021 | endolysosome lumen(GO:0036021) |
| 0.3 | 0.5 | GO:0016342 | catenin complex(GO:0016342) |
| 0.2 | 1.0 | GO:0044307 | dendritic branch(GO:0044307) |
| 0.2 | 2.4 | GO:0034993 | microtubule organizing center attachment site(GO:0034992) LINC complex(GO:0034993) |
| 0.2 | 8.6 | GO:0000421 | autophagosome membrane(GO:0000421) |
| 0.2 | 7.6 | GO:0032809 | neuronal cell body membrane(GO:0032809) cell body membrane(GO:0044298) |
| 0.2 | 4.0 | GO:0008091 | spectrin(GO:0008091) |
| 0.2 | 3.2 | GO:0031235 | intrinsic component of the cytoplasmic side of the plasma membrane(GO:0031235) |
| 0.2 | 4.4 | GO:0036038 | MKS complex(GO:0036038) |
| 0.2 | 1.8 | GO:0043219 | lateral loop(GO:0043219) |
| 0.2 | 1.1 | GO:0032444 | activin responsive factor complex(GO:0032444) |
| 0.2 | 4.7 | GO:0044447 | axoneme part(GO:0044447) |
| 0.2 | 1.3 | GO:0005816 | spindle pole body(GO:0005816) |
| 0.2 | 1.3 | GO:0001940 | male pronucleus(GO:0001940) |
| 0.2 | 9.8 | GO:0043034 | costamere(GO:0043034) |
| 0.2 | 1.1 | GO:0005713 | recombination nodule(GO:0005713) |
| 0.2 | 1.3 | GO:0000306 | extrinsic component of vacuolar membrane(GO:0000306) extrinsic component of endosome membrane(GO:0031313) |
| 0.2 | 19.4 | GO:0005913 | cell-cell adherens junction(GO:0005913) |
| 0.2 | 1.3 | GO:0009331 | glycerol-3-phosphate dehydrogenase complex(GO:0009331) |
| 0.2 | 0.6 | GO:0018444 | translation release factor complex(GO:0018444) |
| 0.2 | 6.0 | GO:0034361 | very-low-density lipoprotein particle(GO:0034361) triglyceride-rich lipoprotein particle(GO:0034385) |
| 0.2 | 0.9 | GO:0070876 | SOSS complex(GO:0070876) |
| 0.2 | 2.3 | GO:0016593 | Cdc73/Paf1 complex(GO:0016593) |
| 0.2 | 1.2 | GO:0072687 | meiotic spindle(GO:0072687) |
| 0.2 | 1.4 | GO:0097165 | nuclear stress granule(GO:0097165) |
| 0.2 | 4.0 | GO:0097025 | MPP7-DLG1-LIN7 complex(GO:0097025) |
| 0.2 | 1.2 | GO:0042824 | MHC class I peptide loading complex(GO:0042824) |
| 0.2 | 1.1 | GO:0071797 | LUBAC complex(GO:0071797) |
| 0.2 | 1.1 | GO:0033269 | internode region of axon(GO:0033269) |
| 0.2 | 2.0 | GO:0031465 | Cul4B-RING E3 ubiquitin ligase complex(GO:0031465) |
| 0.2 | 5.8 | GO:1902711 | GABA-A receptor complex(GO:1902711) |
| 0.2 | 9.8 | GO:0005581 | collagen trimer(GO:0005581) |
| 0.2 | 11.7 | GO:0005902 | microvillus(GO:0005902) |
| 0.2 | 22.3 | GO:0005793 | endoplasmic reticulum-Golgi intermediate compartment(GO:0005793) |
| 0.2 | 3.3 | GO:0032590 | dendrite membrane(GO:0032590) |
| 0.2 | 0.8 | GO:0070826 | paraferritin complex(GO:0070826) |
| 0.2 | 2.5 | GO:0014731 | spectrin-associated cytoskeleton(GO:0014731) |
| 0.2 | 1.8 | GO:0099738 | cell cortex region(GO:0099738) |
| 0.2 | 1.8 | GO:0005853 | eukaryotic translation elongation factor 1 complex(GO:0005853) |
| 0.2 | 1.6 | GO:0060293 | P granule(GO:0043186) pole plasm(GO:0045495) germ plasm(GO:0060293) |
| 0.2 | 0.9 | GO:0033553 | rDNA heterochromatin(GO:0033553) |
| 0.2 | 0.5 | GO:0031933 | telomeric heterochromatin(GO:0031933) |
| 0.2 | 0.5 | GO:0097224 | sperm connecting piece(GO:0097224) |
| 0.2 | 2.0 | GO:0016010 | dystrophin-associated glycoprotein complex(GO:0016010) glycoprotein complex(GO:0090665) |
| 0.2 | 0.6 | GO:0002945 | cyclin K-CDK13 complex(GO:0002945) |
| 0.2 | 0.8 | GO:0000214 | tRNA-intron endonuclease complex(GO:0000214) |
| 0.1 | 2.5 | GO:0035869 | ciliary transition zone(GO:0035869) |
| 0.1 | 2.1 | GO:0008074 | guanylate cyclase complex, soluble(GO:0008074) |
| 0.1 | 0.4 | GO:0030906 | retromer, cargo-selective complex(GO:0030906) |
| 0.1 | 18.2 | GO:0043296 | apical junction complex(GO:0043296) |
| 0.1 | 1.3 | GO:0005652 | nuclear lamina(GO:0005652) |
| 0.1 | 2.9 | GO:0034364 | high-density lipoprotein particle(GO:0034364) |
| 0.1 | 1.7 | GO:0043240 | Fanconi anaemia nuclear complex(GO:0043240) |
| 0.1 | 36.5 | GO:0005578 | proteinaceous extracellular matrix(GO:0005578) |
| 0.1 | 0.9 | GO:0000138 | Golgi trans cisterna(GO:0000138) |
| 0.1 | 1.0 | GO:0044294 | dendritic growth cone(GO:0044294) |
| 0.1 | 0.5 | GO:0030893 | meiotic cohesin complex(GO:0030893) |
| 0.1 | 1.2 | GO:0071141 | SMAD protein complex(GO:0071141) |
| 0.1 | 0.6 | GO:0032280 | symmetric synapse(GO:0032280) |
| 0.1 | 1.3 | GO:0044666 | MLL3/4 complex(GO:0044666) |
| 0.1 | 5.9 | GO:0031526 | brush border membrane(GO:0031526) |
| 0.1 | 0.5 | GO:0034274 | Atg12-Atg5-Atg16 complex(GO:0034274) |
| 0.1 | 1.7 | GO:0031616 | spindle pole centrosome(GO:0031616) |
| 0.1 | 1.6 | GO:0031095 | platelet dense tubular network membrane(GO:0031095) |
| 0.1 | 2.0 | GO:0031045 | dense core granule(GO:0031045) |
| 0.1 | 9.0 | GO:0032580 | Golgi cisterna membrane(GO:0032580) |
| 0.1 | 0.6 | GO:0097524 | sperm plasma membrane(GO:0097524) |
| 0.1 | 1.6 | GO:0030478 | actin cap(GO:0030478) |
| 0.1 | 0.7 | GO:0031390 | Ctf18 RFC-like complex(GO:0031390) |
| 0.1 | 2.4 | GO:0034451 | centriolar satellite(GO:0034451) |
| 0.1 | 1.0 | GO:0045180 | basal cortex(GO:0045180) |
| 0.1 | 0.4 | GO:0097550 | transcriptional preinitiation complex(GO:0097550) |
| 0.1 | 0.4 | GO:0030914 | STAGA complex(GO:0030914) |
| 0.1 | 6.4 | GO:0055038 | recycling endosome membrane(GO:0055038) |
| 0.1 | 0.5 | GO:1990316 | ATG1/ULK1 kinase complex(GO:1990316) |
| 0.1 | 0.5 | GO:0089701 | U2AF(GO:0089701) |
| 0.1 | 1.5 | GO:0030867 | rough endoplasmic reticulum membrane(GO:0030867) |
| 0.1 | 0.4 | GO:0033257 | Bcl3/NF-kappaB2 complex(GO:0033257) |
| 0.1 | 0.6 | GO:0097208 | alveolar lamellar body(GO:0097208) |
| 0.1 | 0.3 | GO:0035189 | Rb-E2F complex(GO:0035189) |
| 0.1 | 8.2 | GO:0005901 | caveola(GO:0005901) |
| 0.1 | 1.1 | GO:0031209 | SCAR complex(GO:0031209) |
| 0.1 | 0.3 | GO:0070695 | FHF complex(GO:0070695) |
| 0.1 | 3.7 | GO:0034707 | chloride channel complex(GO:0034707) |
| 0.1 | 0.9 | GO:0010369 | chromocenter(GO:0010369) |
| 0.1 | 0.5 | GO:0043083 | synaptic cleft(GO:0043083) |
| 0.1 | 0.3 | GO:0016939 | kinesin II complex(GO:0016939) |
| 0.1 | 0.8 | GO:0000145 | exocyst(GO:0000145) |
| 0.1 | 0.8 | GO:0000506 | glycosylphosphatidylinositol-N-acetylglucosaminyltransferase (GPI-GnT) complex(GO:0000506) |
| 0.1 | 2.4 | GO:0008305 | integrin complex(GO:0008305) |
| 0.1 | 2.7 | GO:0032154 | cleavage furrow(GO:0032154) cell surface furrow(GO:0097610) |
| 0.1 | 0.9 | GO:0070449 | elongin complex(GO:0070449) |
| 0.1 | 5.0 | GO:0005891 | voltage-gated calcium channel complex(GO:0005891) |
| 0.1 | 0.8 | GO:0000800 | lateral element(GO:0000800) |
| 0.1 | 1.7 | GO:0001891 | phagocytic cup(GO:0001891) |
| 0.1 | 0.3 | GO:0042584 | chromaffin granule membrane(GO:0042584) |
| 0.1 | 1.3 | GO:0051233 | spindle midzone(GO:0051233) |
| 0.1 | 3.6 | GO:0005844 | polysome(GO:0005844) |
| 0.1 | 7.9 | GO:0022625 | cytosolic large ribosomal subunit(GO:0022625) |
| 0.1 | 1.5 | GO:0034706 | sodium channel complex(GO:0034706) |
| 0.1 | 0.6 | GO:0032045 | guanyl-nucleotide exchange factor complex(GO:0032045) |
| 0.1 | 0.9 | GO:0097225 | sperm midpiece(GO:0097225) |
| 0.1 | 0.8 | GO:0097431 | mitotic spindle pole(GO:0097431) |
| 0.1 | 0.5 | GO:0000127 | transcription factor TFIIIC complex(GO:0000127) |
| 0.1 | 7.1 | GO:0005814 | centriole(GO:0005814) |
| 0.1 | 0.2 | GO:0044611 | nuclear pore inner ring(GO:0044611) |
| 0.1 | 1.7 | GO:0002102 | podosome(GO:0002102) |
| 0.1 | 3.0 | GO:0030315 | T-tubule(GO:0030315) |
| 0.1 | 0.9 | GO:0005847 | mRNA cleavage and polyadenylation specificity factor complex(GO:0005847) |
| 0.1 | 1.4 | GO:0070971 | endoplasmic reticulum exit site(GO:0070971) |
| 0.1 | 0.5 | GO:1903440 | calcitonin family receptor complex(GO:1903439) amylin receptor complex(GO:1903440) |
| 0.1 | 0.4 | GO:0060091 | kinocilium(GO:0060091) |
| 0.1 | 0.4 | GO:0070554 | synaptobrevin 2-SNAP-25-syntaxin-3-complexin complex(GO:0070554) |
| 0.1 | 0.5 | GO:0035253 | ciliary rootlet(GO:0035253) |
| 0.1 | 0.4 | GO:0031415 | N-terminal protein acetyltransferase complex(GO:0031414) NatA complex(GO:0031415) |
| 0.1 | 0.2 | GO:0030289 | protein phosphatase 4 complex(GO:0030289) |
| 0.1 | 0.5 | GO:0005672 | transcription factor TFIIA complex(GO:0005672) |
| 0.1 | 1.2 | GO:0097546 | ciliary base(GO:0097546) |
| 0.1 | 1.3 | GO:0031201 | SNARE complex(GO:0031201) |
| 0.1 | 4.0 | GO:0032588 | trans-Golgi network membrane(GO:0032588) |
| 0.1 | 1.6 | GO:0005892 | acetylcholine-gated channel complex(GO:0005892) |
| 0.1 | 22.5 | GO:0005925 | focal adhesion(GO:0005925) |
| 0.1 | 1.0 | GO:0032839 | dendrite cytoplasm(GO:0032839) |
| 0.1 | 5.8 | GO:0017053 | transcriptional repressor complex(GO:0017053) |
| 0.1 | 0.5 | GO:0000780 | condensed nuclear chromosome, centromeric region(GO:0000780) |
| 0.1 | 3.3 | GO:0031093 | platelet alpha granule lumen(GO:0031093) |
| 0.1 | 1.4 | GO:0035145 | exon-exon junction complex(GO:0035145) |
| 0.1 | 0.2 | GO:0005965 | protein farnesyltransferase complex(GO:0005965) |
| 0.1 | 1.0 | GO:0034704 | calcium channel complex(GO:0034704) |
| 0.0 | 8.5 | GO:0044798 | nuclear transcription factor complex(GO:0044798) |
| 0.0 | 0.7 | GO:0031312 | extrinsic component of organelle membrane(GO:0031312) |
| 0.0 | 0.3 | GO:0000930 | gamma-tubulin complex(GO:0000930) |
| 0.0 | 1.2 | GO:0000314 | organellar small ribosomal subunit(GO:0000314) mitochondrial small ribosomal subunit(GO:0005763) |
| 0.0 | 1.2 | GO:0005865 | striated muscle thin filament(GO:0005865) |
| 0.0 | 7.2 | GO:0005788 | endoplasmic reticulum lumen(GO:0005788) |
| 0.0 | 0.3 | GO:0061700 | GATOR2 complex(GO:0061700) |
| 0.0 | 0.9 | GO:0001533 | cornified envelope(GO:0001533) |
| 0.0 | 1.0 | GO:0005852 | eukaryotic translation initiation factor 3 complex(GO:0005852) |
| 0.0 | 0.2 | GO:0070852 | cell body fiber(GO:0070852) |
| 0.0 | 1.6 | GO:0005930 | axoneme(GO:0005930) ciliary plasm(GO:0097014) |
| 0.0 | 0.8 | GO:0042629 | mast cell granule(GO:0042629) |
| 0.0 | 1.0 | GO:0031307 | integral component of mitochondrial outer membrane(GO:0031307) |
| 0.0 | 0.3 | GO:0030008 | TRAPP complex(GO:0030008) |
| 0.0 | 19.9 | GO:0009986 | cell surface(GO:0009986) |
| 0.0 | 1.0 | GO:0005791 | rough endoplasmic reticulum(GO:0005791) |
| 0.0 | 0.2 | GO:0030896 | checkpoint clamp complex(GO:0030896) |
| 0.0 | 0.5 | GO:0038201 | TOR complex(GO:0038201) |
| 0.0 | 0.3 | GO:0070419 | nonhomologous end joining complex(GO:0070419) |
| 0.0 | 0.3 | GO:0032281 | AMPA glutamate receptor complex(GO:0032281) |
| 0.0 | 0.3 | GO:0033588 | Elongator holoenzyme complex(GO:0033588) |
| 0.0 | 2.5 | GO:0005840 | ribosome(GO:0005840) |
| 0.0 | 0.1 | GO:0000811 | GINS complex(GO:0000811) |
| 0.0 | 2.7 | GO:0001650 | fibrillar center(GO:0001650) |
| 0.0 | 0.5 | GO:0045095 | keratin filament(GO:0045095) |
| 0.0 | 0.2 | GO:0042599 | lamellar body(GO:0042599) |
| 0.0 | 2.8 | GO:0005741 | mitochondrial outer membrane(GO:0005741) |
| 0.0 | 0.1 | GO:0034448 | EGO complex(GO:0034448) Gtr1-Gtr2 GTPase complex(GO:1990131) |
| 0.0 | 0.4 | GO:0005771 | multivesicular body(GO:0005771) |
| 0.0 | 1.0 | GO:0035579 | specific granule membrane(GO:0035579) |
Gene overrepresentation in molecular function category:
| Log-likelihood per target | Total log-likelihood | Term | Description |
|---|---|---|---|
| 9.7 | 38.8 | GO:0070320 | inward rectifier potassium channel inhibitor activity(GO:0070320) |
| 3.6 | 10.7 | GO:0060422 | peptidyl-dipeptidase inhibitor activity(GO:0060422) |
| 3.0 | 38.7 | GO:0048407 | platelet-derived growth factor binding(GO:0048407) |
| 2.8 | 11.2 | GO:0004598 | peptidylglycine monooxygenase activity(GO:0004504) peptidylamidoglycolate lyase activity(GO:0004598) |
| 2.1 | 6.2 | GO:0005010 | insulin-like growth factor-activated receptor activity(GO:0005010) |
| 2.0 | 6.0 | GO:0060001 | minus-end directed microfilament motor activity(GO:0060001) |
| 2.0 | 6.0 | GO:0080023 | 3R-hydroxyacyl-CoA dehydratase activity(GO:0080023) |
| 2.0 | 5.9 | GO:0034189 | very-low-density lipoprotein particle binding(GO:0034189) |
| 1.7 | 12.0 | GO:0016618 | hydroxypyruvate reductase activity(GO:0016618) glyoxylate reductase (NADP) activity(GO:0030267) |
| 1.7 | 8.4 | GO:1990254 | keratin filament binding(GO:1990254) |
| 1.7 | 5.0 | GO:0034736 | sterol O-acyltransferase activity(GO:0004772) cholesterol O-acyltransferase activity(GO:0034736) |
| 1.6 | 11.3 | GO:0048408 | epidermal growth factor binding(GO:0048408) |
| 1.6 | 4.8 | GO:0046921 | glycoprotein 6-alpha-L-fucosyltransferase activity(GO:0008424) alpha-(1->6)-fucosyltransferase activity(GO:0046921) |
| 1.6 | 4.8 | GO:0004584 | dolichyl-phosphate-mannose-glycolipid alpha-mannosyltransferase activity(GO:0004584) |
| 1.5 | 6.1 | GO:1990430 | extracellular matrix protein binding(GO:1990430) |
| 1.5 | 6.0 | GO:0032184 | SUMO polymer binding(GO:0032184) |
| 1.5 | 8.8 | GO:0016361 | activin receptor activity, type I(GO:0016361) |
| 1.4 | 4.1 | GO:0004874 | aryl hydrocarbon receptor activity(GO:0004874) |
| 1.3 | 5.4 | GO:0038047 | beta-endorphin receptor activity(GO:0004979) morphine receptor activity(GO:0038047) |
| 1.3 | 11.6 | GO:0060072 | large conductance calcium-activated potassium channel activity(GO:0060072) |
| 1.3 | 5.1 | GO:0047288 | monosialoganglioside sialyltransferase activity(GO:0047288) |
| 1.3 | 14.1 | GO:0042301 | phosphate ion binding(GO:0042301) |
| 1.2 | 3.7 | GO:0003845 | 11-beta-hydroxysteroid dehydrogenase [NAD(P)] activity(GO:0003845) |
| 1.2 | 3.6 | GO:0004782 | sulfinoalanine decarboxylase activity(GO:0004782) |
| 1.2 | 7.1 | GO:0034046 | poly(G) binding(GO:0034046) |
| 1.2 | 5.9 | GO:0019834 | phospholipase A2 inhibitor activity(GO:0019834) |
| 1.2 | 5.9 | GO:0044729 | hemi-methylated DNA-binding(GO:0044729) |
| 1.1 | 9.0 | GO:0098639 | collagen binding involved in cell-matrix adhesion(GO:0098639) |
| 1.1 | 11.2 | GO:0036310 | annealing helicase activity(GO:0036310) |
| 1.1 | 3.3 | GO:0015234 | thiamine transmembrane transporter activity(GO:0015234) thiamine uptake transmembrane transporter activity(GO:0015403) |
| 1.1 | 3.2 | GO:0070290 | N-acylphosphatidylethanolamine-specific phospholipase D activity(GO:0070290) |
| 1.0 | 3.0 | GO:0044323 | retinoic acid-responsive element binding(GO:0044323) |
| 0.9 | 9.4 | GO:0050692 | DBD domain binding(GO:0050692) |
| 0.9 | 3.7 | GO:0019828 | aspartic-type endopeptidase inhibitor activity(GO:0019828) |
| 0.9 | 4.6 | GO:0004991 | parathyroid hormone receptor activity(GO:0004991) |
| 0.9 | 2.8 | GO:0008426 | protein kinase C inhibitor activity(GO:0008426) |
| 0.9 | 6.3 | GO:0005134 | interleukin-2 receptor binding(GO:0005134) |
| 0.9 | 5.4 | GO:0042392 | sphingosine-1-phosphate phosphatase activity(GO:0042392) |
| 0.9 | 4.3 | GO:0047280 | nicotinamide phosphoribosyltransferase activity(GO:0047280) |
| 0.9 | 3.4 | GO:0005169 | neurotrophin TRKB receptor binding(GO:0005169) |
| 0.8 | 2.5 | GO:0033749 | histone demethylase activity (H3-R2 specific)(GO:0033746) histone demethylase activity (H4-R3 specific)(GO:0033749) |
| 0.8 | 3.3 | GO:0038085 | vascular endothelial growth factor binding(GO:0038085) |
| 0.8 | 8.0 | GO:0042731 | PH domain binding(GO:0042731) |
| 0.8 | 8.0 | GO:0010859 | calcium-dependent cysteine-type endopeptidase inhibitor activity(GO:0010859) |
| 0.8 | 7.2 | GO:0045499 | chemorepellent activity(GO:0045499) |
| 0.8 | 8.0 | GO:0008131 | primary amine oxidase activity(GO:0008131) |
| 0.8 | 22.2 | GO:0017166 | vinculin binding(GO:0017166) |
| 0.8 | 3.1 | GO:0086077 | gap junction channel activity involved in SA node cell-atrial cardiac muscle cell electrical coupling(GO:0086020) gap junction channel activity involved in AV node cell-bundle of His cell electrical coupling(GO:0086077) |
| 0.8 | 8.5 | GO:0038132 | neuregulin binding(GO:0038132) |
| 0.8 | 4.5 | GO:0061575 | cyclin-dependent protein serine/threonine kinase activator activity(GO:0061575) |
| 0.7 | 3.0 | GO:0030274 | LIM domain binding(GO:0030274) |
| 0.7 | 1.5 | GO:0030226 | apolipoprotein receptor activity(GO:0030226) |
| 0.7 | 5.1 | GO:1904288 | BAT3 complex binding(GO:1904288) |
| 0.7 | 5.8 | GO:0060002 | plus-end directed microfilament motor activity(GO:0060002) |
| 0.7 | 3.6 | GO:0008332 | low voltage-gated calcium channel activity(GO:0008332) |
| 0.7 | 3.5 | GO:0070051 | fibrinogen binding(GO:0070051) |
| 0.7 | 5.6 | GO:0086083 | cell adhesive protein binding involved in bundle of His cell-Purkinje myocyte communication(GO:0086083) |
| 0.7 | 4.2 | GO:0034186 | apolipoprotein A-I binding(GO:0034186) |
| 0.7 | 2.1 | GO:0098808 | mRNA cap binding(GO:0098808) |
| 0.7 | 2.8 | GO:0042134 | rRNA primary transcript binding(GO:0042134) |
| 0.7 | 6.2 | GO:0016206 | catechol O-methyltransferase activity(GO:0016206) |
| 0.7 | 3.5 | GO:0001010 | transcription factor activity, sequence-specific DNA binding transcription factor recruiting(GO:0001010) |
| 0.7 | 2.0 | GO:0030305 | heparanase activity(GO:0030305) |
| 0.7 | 6.8 | GO:0035374 | chondroitin sulfate binding(GO:0035374) |
| 0.6 | 1.3 | GO:0016715 | oxidoreductase activity, acting on paired donors, with incorporation or reduction of molecular oxygen, reduced ascorbate as one donor, and incorporation of one atom of oxygen(GO:0016715) |
| 0.6 | 2.5 | GO:0004001 | adenosine kinase activity(GO:0004001) |
| 0.6 | 4.4 | GO:1904929 | coreceptor activity involved in Wnt signaling pathway, planar cell polarity pathway(GO:1904929) |
| 0.6 | 3.1 | GO:0052845 | endopolyphosphatase activity(GO:0000298) diphosphoinositol-polyphosphate diphosphatase activity(GO:0008486) bis(5'-adenosyl)-hexaphosphatase activity(GO:0034431) bis(5'-adenosyl)-pentaphosphatase activity(GO:0034432) inositol diphosphate tetrakisphosphate diphosphatase activity(GO:0052840) inositol bisdiphosphate tetrakisphosphate diphosphatase activity(GO:0052841) inositol diphosphate pentakisphosphate diphosphatase activity(GO:0052842) inositol-1-diphosphate-2,3,4,5,6-pentakisphosphate diphosphatase activity(GO:0052843) inositol-3-diphosphate-1,2,4,5,6-pentakisphosphate diphosphatase activity(GO:0052844) inositol-5-diphosphate-1,2,3,4,6-pentakisphosphate diphosphatase activity(GO:0052845) inositol-1,5-bisdiphosphate-2,3,4,6-tetrakisphosphate 1-diphosphatase activity(GO:0052846) inositol-1,5-bisdiphosphate-2,3,4,6-tetrakisphosphate 5-diphosphatase activity(GO:0052847) inositol-3,5-bisdiphosphate-2,3,4,6-tetrakisphosphate 5-diphosphatase activity(GO:0052848) |
| 0.6 | 3.1 | GO:0017002 | activin-activated receptor activity(GO:0017002) |
| 0.6 | 6.8 | GO:0039706 | co-receptor binding(GO:0039706) |
| 0.6 | 3.0 | GO:0032181 | double-strand/single-strand DNA junction binding(GO:0000406) dinucleotide repeat insertion binding(GO:0032181) |
| 0.6 | 3.0 | GO:0034711 | inhibin binding(GO:0034711) |
| 0.6 | 1.8 | GO:0004613 | phosphoenolpyruvate carboxykinase activity(GO:0004611) phosphoenolpyruvate carboxykinase (GTP) activity(GO:0004613) |
| 0.6 | 1.8 | GO:0000252 | C-3 sterol dehydrogenase (C-4 sterol decarboxylase) activity(GO:0000252) sterol-4-alpha-carboxylate 3-dehydrogenase (decarboxylating) activity(GO:0047012) |
| 0.6 | 1.8 | GO:0047322 | [hydroxymethylglutaryl-CoA reductase (NADPH)] kinase activity(GO:0047322) [acetyl-CoA carboxylase] kinase activity(GO:0050405) |
| 0.6 | 4.7 | GO:0034235 | GPI anchor binding(GO:0034235) |
| 0.6 | 3.5 | GO:0005534 | galactose binding(GO:0005534) |
| 0.6 | 13.9 | GO:0001968 | fibronectin binding(GO:0001968) |
| 0.6 | 2.3 | GO:0030023 | extracellular matrix constituent conferring elasticity(GO:0030023) |
| 0.6 | 2.8 | GO:0004774 | succinate-CoA ligase activity(GO:0004774) |
| 0.6 | 3.9 | GO:0015166 | polyol transmembrane transporter activity(GO:0015166) |
| 0.6 | 2.2 | GO:0004741 | [pyruvate dehydrogenase (lipoamide)] phosphatase activity(GO:0004741) |
| 0.6 | 3.3 | GO:0047057 | oxidoreductase activity, acting on the CH-OH group of donors, disulfide as acceptor(GO:0016900) vitamin-K-epoxide reductase (warfarin-sensitive) activity(GO:0047057) |
| 0.5 | 2.7 | GO:0016427 | tRNA (cytosine) methyltransferase activity(GO:0016427) |
| 0.5 | 3.7 | GO:0016167 | glial cell-derived neurotrophic factor receptor activity(GO:0016167) |
| 0.5 | 3.1 | GO:0050051 | leukotriene-B4 20-monooxygenase activity(GO:0050051) |
| 0.5 | 1.5 | GO:0070984 | SET domain binding(GO:0070984) |
| 0.5 | 1.0 | GO:0035373 | chondroitin sulfate proteoglycan binding(GO:0035373) |
| 0.5 | 1.5 | GO:0004923 | leukemia inhibitory factor receptor activity(GO:0004923) |
| 0.5 | 3.0 | GO:0019237 | centromeric DNA binding(GO:0019237) |
| 0.5 | 3.4 | GO:0003747 | translation release factor activity(GO:0003747) translation termination factor activity(GO:0008079) |
| 0.5 | 10.2 | GO:0005385 | zinc ion transmembrane transporter activity(GO:0005385) |
| 0.5 | 9.7 | GO:0008510 | sodium:bicarbonate symporter activity(GO:0008510) |
| 0.5 | 4.3 | GO:0048185 | activin binding(GO:0048185) |
| 0.5 | 2.4 | GO:0033906 | hyaluronoglucuronidase activity(GO:0033906) |
| 0.5 | 0.5 | GO:0047977 | hepoxilin-epoxide hydrolase activity(GO:0047977) |
| 0.5 | 18.4 | GO:0048027 | mRNA 5'-UTR binding(GO:0048027) |
| 0.5 | 73.3 | GO:0005178 | integrin binding(GO:0005178) |
| 0.5 | 1.4 | GO:0008330 | protein tyrosine/threonine phosphatase activity(GO:0008330) |
| 0.4 | 12.2 | GO:0005109 | frizzled binding(GO:0005109) |
| 0.4 | 4.4 | GO:0005237 | inhibitory extracellular ligand-gated ion channel activity(GO:0005237) |
| 0.4 | 4.7 | GO:0004679 | AMP-activated protein kinase activity(GO:0004679) |
| 0.4 | 18.9 | GO:0003785 | actin monomer binding(GO:0003785) |
| 0.4 | 5.6 | GO:0016405 | CoA-ligase activity(GO:0016405) |
| 0.4 | 3.4 | GO:0045159 | myosin II binding(GO:0045159) |
| 0.4 | 6.3 | GO:0070411 | I-SMAD binding(GO:0070411) |
| 0.4 | 9.2 | GO:0042813 | Wnt-activated receptor activity(GO:0042813) |
| 0.4 | 77.6 | GO:0008083 | growth factor activity(GO:0008083) |
| 0.4 | 34.5 | GO:0005201 | extracellular matrix structural constituent(GO:0005201) |
| 0.4 | 1.2 | GO:0050510 | N-acetylgalactosaminyl-proteoglycan 3-beta-glucuronosyltransferase activity(GO:0050510) |
| 0.4 | 7.6 | GO:0097602 | cullin family protein binding(GO:0097602) |
| 0.4 | 4.8 | GO:0001758 | retinal dehydrogenase activity(GO:0001758) |
| 0.4 | 2.0 | GO:0043546 | molybdopterin cofactor binding(GO:0043546) |
| 0.4 | 4.7 | GO:0001206 | transcriptional repressor activity, RNA polymerase II distal enhancer sequence-specific binding(GO:0001206) |
| 0.4 | 2.0 | GO:0046899 | nucleoside triphosphate adenylate kinase activity(GO:0046899) |
| 0.4 | 5.1 | GO:0032050 | clathrin heavy chain binding(GO:0032050) |
| 0.4 | 1.1 | GO:0035529 | NADH pyrophosphatase activity(GO:0035529) |
| 0.4 | 1.9 | GO:0031871 | proteinase activated receptor binding(GO:0031871) |
| 0.4 | 7.3 | GO:0030296 | protein tyrosine kinase activator activity(GO:0030296) |
| 0.4 | 1.5 | GO:0019107 | glycylpeptide N-tetradecanoyltransferase activity(GO:0004379) myristoyltransferase activity(GO:0019107) |
| 0.4 | 1.8 | GO:0048763 | calcium-induced calcium release activity(GO:0048763) |
| 0.4 | 1.8 | GO:0004694 | eukaryotic translation initiation factor 2alpha kinase activity(GO:0004694) |
| 0.4 | 1.4 | GO:0008475 | procollagen-lysine 5-dioxygenase activity(GO:0008475) procollagen glucosyltransferase activity(GO:0033823) |
| 0.4 | 4.3 | GO:0005007 | fibroblast growth factor-activated receptor activity(GO:0005007) |
| 0.4 | 1.4 | GO:0035800 | deubiquitinase activator activity(GO:0035800) |
| 0.4 | 1.4 | GO:0000822 | inositol hexakisphosphate binding(GO:0000822) |
| 0.4 | 1.1 | GO:0016429 | tRNA (adenine-N1-)-methyltransferase activity(GO:0016429) |
| 0.4 | 6.0 | GO:0042809 | vitamin D receptor binding(GO:0042809) |
| 0.3 | 5.9 | GO:0015095 | magnesium ion transmembrane transporter activity(GO:0015095) |
| 0.3 | 1.4 | GO:0008467 | [heparan sulfate]-glucosamine 3-sulfotransferase 1 activity(GO:0008467) |
| 0.3 | 2.4 | GO:0071558 | histone demethylase activity (H3-K27 specific)(GO:0071558) |
| 0.3 | 6.8 | GO:0035497 | cAMP response element binding(GO:0035497) |
| 0.3 | 8.8 | GO:0098641 | cadherin binding involved in cell-cell adhesion(GO:0098641) |
| 0.3 | 1.7 | GO:0004999 | vasoactive intestinal polypeptide receptor activity(GO:0004999) |
| 0.3 | 1.0 | GO:0004047 | aminomethyltransferase activity(GO:0004047) |
| 0.3 | 2.3 | GO:0001640 | adenylate cyclase inhibiting G-protein coupled glutamate receptor activity(GO:0001640) G-protein coupled glutamate receptor activity(GO:0098988) |
| 0.3 | 1.7 | GO:0070016 | armadillo repeat domain binding(GO:0070016) |
| 0.3 | 4.6 | GO:0008253 | 5'-nucleotidase activity(GO:0008253) |
| 0.3 | 16.4 | GO:0001103 | RNA polymerase II repressing transcription factor binding(GO:0001103) |
| 0.3 | 1.3 | GO:0052591 | sn-glycerol-3-phosphate:ubiquinone oxidoreductase activity(GO:0052590) sn-glycerol-3-phosphate:ubiquinone-8 oxidoreductase activity(GO:0052591) |
| 0.3 | 1.3 | GO:0004142 | diacylglycerol cholinephosphotransferase activity(GO:0004142) |
| 0.3 | 1.3 | GO:0015111 | iodide transmembrane transporter activity(GO:0015111) |
| 0.3 | 2.2 | GO:0010997 | anaphase-promoting complex binding(GO:0010997) |
| 0.3 | 1.3 | GO:0015220 | choline transmembrane transporter activity(GO:0015220) |
| 0.3 | 1.3 | GO:0018271 | biotin-[acetyl-CoA-carboxylase] ligase activity(GO:0004077) biotin-[methylcrotonoyl-CoA-carboxylase] ligase activity(GO:0004078) biotin-[methylmalonyl-CoA-carboxytransferase] ligase activity(GO:0004079) biotin-[propionyl-CoA-carboxylase (ATP-hydrolyzing)] ligase activity(GO:0004080) biotin-protein ligase activity(GO:0018271) |
| 0.3 | 3.8 | GO:0010314 | phosphatidylinositol-5-phosphate binding(GO:0010314) |
| 0.3 | 2.2 | GO:0030160 | GKAP/Homer scaffold activity(GO:0030160) |
| 0.3 | 2.2 | GO:0004465 | lipoprotein lipase activity(GO:0004465) |
| 0.3 | 1.6 | GO:0032795 | heterotrimeric G-protein binding(GO:0032795) |
| 0.3 | 3.1 | GO:0004726 | non-membrane spanning protein tyrosine phosphatase activity(GO:0004726) |
| 0.3 | 1.8 | GO:0004035 | alkaline phosphatase activity(GO:0004035) |
| 0.3 | 1.5 | GO:0004370 | glycerol kinase activity(GO:0004370) |
| 0.3 | 8.7 | GO:0008187 | poly-pyrimidine tract binding(GO:0008187) |
| 0.3 | 1.2 | GO:0035939 | microsatellite binding(GO:0035939) |
| 0.3 | 0.6 | GO:0086007 | voltage-gated calcium channel activity involved in cardiac muscle cell action potential(GO:0086007) |
| 0.3 | 0.9 | GO:0032142 | single guanine insertion binding(GO:0032142) |
| 0.3 | 1.4 | GO:0001594 | trace-amine receptor activity(GO:0001594) |
| 0.3 | 1.7 | GO:0043023 | ribosomal large subunit binding(GO:0043023) |
| 0.3 | 0.9 | GO:0050309 | glucose-6-phosphatase activity(GO:0004346) sugar-terminal-phosphatase activity(GO:0050309) |
| 0.3 | 1.4 | GO:0015319 | sodium:inorganic phosphate symporter activity(GO:0015319) |
| 0.3 | 3.1 | GO:0005005 | transmembrane-ephrin receptor activity(GO:0005005) |
| 0.3 | 0.8 | GO:0033699 | DNA 5'-adenosine monophosphate hydrolase activity(GO:0033699) |
| 0.3 | 2.5 | GO:0015279 | store-operated calcium channel activity(GO:0015279) |
| 0.3 | 1.7 | GO:0000179 | rRNA (adenine-N6,N6-)-dimethyltransferase activity(GO:0000179) |
| 0.3 | 1.4 | GO:0044547 | DNA topoisomerase binding(GO:0044547) |
| 0.3 | 3.6 | GO:0005520 | insulin-like growth factor binding(GO:0005520) |
| 0.3 | 1.7 | GO:0031962 | mineralocorticoid receptor binding(GO:0031962) |
| 0.3 | 5.7 | GO:0003756 | protein disulfide isomerase activity(GO:0003756) intramolecular oxidoreductase activity, transposing S-S bonds(GO:0016864) |
| 0.3 | 0.8 | GO:0034437 | glycoprotein transporter activity(GO:0034437) |
| 0.3 | 1.1 | GO:0004461 | lactose synthase activity(GO:0004461) |
| 0.3 | 0.8 | GO:0003974 | UDP-N-acetylglucosamine 4-epimerase activity(GO:0003974) UDP-glucose 4-epimerase activity(GO:0003978) |
| 0.3 | 0.3 | GO:0004307 | ethanolaminephosphotransferase activity(GO:0004307) |
| 0.3 | 1.1 | GO:0032810 | sterol response element binding(GO:0032810) |
| 0.3 | 0.8 | GO:0050698 | proteoglycan sulfotransferase activity(GO:0050698) |
| 0.3 | 1.8 | GO:0043522 | leucine zipper domain binding(GO:0043522) |
| 0.2 | 3.5 | GO:0008140 | cAMP response element binding protein binding(GO:0008140) |
| 0.2 | 1.0 | GO:0043237 | laminin-1 binding(GO:0043237) |
| 0.2 | 0.7 | GO:0004421 | hydroxymethylglutaryl-CoA synthase activity(GO:0004421) |
| 0.2 | 1.5 | GO:0003873 | 6-phosphofructo-2-kinase activity(GO:0003873) |
| 0.2 | 1.7 | GO:0051011 | microtubule minus-end binding(GO:0051011) |
| 0.2 | 7.1 | GO:0001972 | retinoic acid binding(GO:0001972) |
| 0.2 | 2.9 | GO:0019215 | intermediate filament binding(GO:0019215) |
| 0.2 | 1.9 | GO:0004571 | mannosyl-oligosaccharide 1,2-alpha-mannosidase activity(GO:0004571) |
| 0.2 | 1.2 | GO:0048248 | CXCR3 chemokine receptor binding(GO:0048248) |
| 0.2 | 3.8 | GO:0044213 | intronic transcription regulatory region sequence-specific DNA binding(GO:0001161) intronic transcription regulatory region DNA binding(GO:0044213) |
| 0.2 | 2.8 | GO:0017017 | MAP kinase tyrosine/serine/threonine phosphatase activity(GO:0017017) |
| 0.2 | 23.6 | GO:0004867 | serine-type endopeptidase inhibitor activity(GO:0004867) |
| 0.2 | 25.0 | GO:0005070 | SH3/SH2 adaptor activity(GO:0005070) |
| 0.2 | 0.2 | GO:0050682 | AF-2 domain binding(GO:0050682) |
| 0.2 | 0.9 | GO:0005277 | acetylcholine transmembrane transporter activity(GO:0005277) acetate ester transmembrane transporter activity(GO:1901375) |
| 0.2 | 20.2 | GO:0008307 | structural constituent of muscle(GO:0008307) |
| 0.2 | 3.3 | GO:0055056 | D-glucose transmembrane transporter activity(GO:0055056) |
| 0.2 | 2.1 | GO:0000150 | recombinase activity(GO:0000150) |
| 0.2 | 0.9 | GO:0005113 | patched binding(GO:0005113) |
| 0.2 | 1.1 | GO:0004910 | interleukin-1, Type II, blocking receptor activity(GO:0004910) |
| 0.2 | 0.7 | GO:0015616 | DNA translocase activity(GO:0015616) |
| 0.2 | 3.5 | GO:0032454 | histone demethylase activity (H3-K9 specific)(GO:0032454) |
| 0.2 | 5.4 | GO:0004697 | protein kinase C activity(GO:0004697) |
| 0.2 | 1.7 | GO:0043426 | MRF binding(GO:0043426) |
| 0.2 | 0.9 | GO:0035500 | MH2 domain binding(GO:0035500) |
| 0.2 | 2.6 | GO:0008429 | phosphatidylethanolamine binding(GO:0008429) |
| 0.2 | 1.3 | GO:0016929 | SUMO-specific protease activity(GO:0016929) |
| 0.2 | 11.4 | GO:0005546 | phosphatidylinositol-4,5-bisphosphate binding(GO:0005546) |
| 0.2 | 0.6 | GO:1990190 | peptide-glutamate-N-acetyltransferase activity(GO:1990190) |
| 0.2 | 1.9 | GO:0034056 | estrogen response element binding(GO:0034056) |
| 0.2 | 1.3 | GO:0015272 | ATP-activated inward rectifier potassium channel activity(GO:0015272) |
| 0.2 | 0.8 | GO:0008449 | N-acetylglucosamine-6-sulfatase activity(GO:0008449) |
| 0.2 | 8.2 | GO:0001221 | transcription cofactor binding(GO:0001221) |
| 0.2 | 2.1 | GO:0031013 | troponin I binding(GO:0031013) |
| 0.2 | 4.2 | GO:0005545 | 1-phosphatidylinositol binding(GO:0005545) |
| 0.2 | 1.0 | GO:0016907 | G-protein coupled acetylcholine receptor activity(GO:0016907) |
| 0.2 | 1.0 | GO:0016941 | natriuretic peptide receptor activity(GO:0016941) |
| 0.2 | 3.0 | GO:0003708 | retinoic acid receptor activity(GO:0003708) |
| 0.2 | 3.0 | GO:0030898 | actin-dependent ATPase activity(GO:0030898) |
| 0.2 | 1.8 | GO:0000340 | RNA 7-methylguanosine cap binding(GO:0000340) |
| 0.2 | 0.6 | GO:0008384 | IkappaB kinase activity(GO:0008384) |
| 0.2 | 1.5 | GO:0004996 | thyroid-stimulating hormone receptor activity(GO:0004996) |
| 0.2 | 1.3 | GO:0004844 | uracil DNA N-glycosylase activity(GO:0004844) deaminated base DNA N-glycosylase activity(GO:0097506) |
| 0.2 | 2.1 | GO:0045294 | alpha-catenin binding(GO:0045294) |
| 0.2 | 0.8 | GO:0000213 | tRNA-intron endonuclease activity(GO:0000213) |
| 0.2 | 3.9 | GO:0070888 | E-box binding(GO:0070888) |
| 0.2 | 1.3 | GO:0050815 | phosphoserine binding(GO:0050815) |
| 0.2 | 6.4 | GO:0030332 | cyclin binding(GO:0030332) |
| 0.2 | 2.3 | GO:0032052 | bile acid binding(GO:0032052) |
| 0.2 | 0.7 | GO:0004146 | dihydrofolate reductase activity(GO:0004146) |
| 0.2 | 1.2 | GO:0008172 | S-methyltransferase activity(GO:0008172) |
| 0.2 | 1.0 | GO:0016918 | retinal binding(GO:0016918) |
| 0.2 | 1.2 | GO:0042500 | aspartic endopeptidase activity, intramembrane cleaving(GO:0042500) |
| 0.2 | 0.7 | GO:0004102 | choline O-acetyltransferase activity(GO:0004102) |
| 0.2 | 0.5 | GO:0070573 | metallodipeptidase activity(GO:0070573) |
| 0.2 | 69.0 | GO:0001077 | transcriptional activator activity, RNA polymerase II core promoter proximal region sequence-specific binding(GO:0001077) |
| 0.2 | 1.5 | GO:0047499 | calcium-independent phospholipase A2 activity(GO:0047499) |
| 0.2 | 3.4 | GO:0019870 | potassium channel inhibitor activity(GO:0019870) |
| 0.2 | 0.2 | GO:0061629 | titin binding(GO:0031432) RNA polymerase II sequence-specific DNA binding transcription factor binding(GO:0061629) |
| 0.2 | 6.5 | GO:0050840 | extracellular matrix binding(GO:0050840) |
| 0.2 | 0.7 | GO:0008046 | axon guidance receptor activity(GO:0008046) |
| 0.2 | 2.5 | GO:0005112 | Notch binding(GO:0005112) |
| 0.2 | 0.8 | GO:0015094 | cadmium ion transmembrane transporter activity(GO:0015086) cobalt ion transmembrane transporter activity(GO:0015087) ferrous iron transmembrane transporter activity(GO:0015093) lead ion transmembrane transporter activity(GO:0015094) ferrous iron uptake transmembrane transporter activity(GO:0015639) |
| 0.2 | 2.0 | GO:0015129 | lactate transmembrane transporter activity(GO:0015129) |
| 0.2 | 3.1 | GO:0005537 | mannose binding(GO:0005537) |
| 0.2 | 6.9 | GO:0005044 | scavenger receptor activity(GO:0005044) |
| 0.2 | 2.1 | GO:0005003 | ephrin receptor activity(GO:0005003) |
| 0.2 | 11.7 | GO:0008013 | beta-catenin binding(GO:0008013) |
| 0.2 | 0.8 | GO:0005499 | vitamin D binding(GO:0005499) |
| 0.2 | 3.2 | GO:0008409 | 5'-3' exonuclease activity(GO:0008409) |
| 0.2 | 2.0 | GO:0004887 | thyroid hormone receptor activity(GO:0004887) |
| 0.2 | 1.7 | GO:0070273 | phosphatidylinositol-4-phosphate binding(GO:0070273) |
| 0.2 | 0.5 | GO:0032027 | myosin light chain binding(GO:0032027) |
| 0.2 | 2.1 | GO:0004653 | polypeptide N-acetylgalactosaminyltransferase activity(GO:0004653) |
| 0.2 | 3.3 | GO:0000030 | mannosyltransferase activity(GO:0000030) |
| 0.2 | 1.5 | GO:0015250 | water channel activity(GO:0015250) |
| 0.1 | 4.6 | GO:0005035 | tumor necrosis factor-activated receptor activity(GO:0005031) death receptor activity(GO:0005035) |
| 0.1 | 1.9 | GO:0008527 | taste receptor activity(GO:0008527) |
| 0.1 | 0.9 | GO:0097617 | annealing activity(GO:0097617) |
| 0.1 | 2.9 | GO:0005041 | low-density lipoprotein receptor activity(GO:0005041) |
| 0.1 | 1.1 | GO:0004176 | ATP-dependent peptidase activity(GO:0004176) |
| 0.1 | 1.0 | GO:0042799 | histone methyltransferase activity (H4-K20 specific)(GO:0042799) |
| 0.1 | 0.6 | GO:0004517 | nitric-oxide synthase activity(GO:0004517) |
| 0.1 | 4.3 | GO:0051059 | NF-kappaB binding(GO:0051059) |
| 0.1 | 1.7 | GO:0019957 | C-C chemokine binding(GO:0019957) |
| 0.1 | 2.7 | GO:0008349 | MAP kinase kinase kinase kinase activity(GO:0008349) |
| 0.1 | 1.0 | GO:0042978 | ornithine decarboxylase activator activity(GO:0042978) |
| 0.1 | 3.8 | GO:0005547 | phosphatidylinositol-3,4,5-trisphosphate binding(GO:0005547) |
| 0.1 | 4.7 | GO:0005154 | epidermal growth factor receptor binding(GO:0005154) |
| 0.1 | 0.7 | GO:0070576 | vitamin D 24-hydroxylase activity(GO:0070576) |
| 0.1 | 0.5 | GO:0004948 | calcitonin receptor activity(GO:0004948) |
| 0.1 | 0.4 | GO:0005072 | transforming growth factor beta receptor, cytoplasmic mediator activity(GO:0005072) transforming growth factor beta receptor, pathway-specific cytoplasmic mediator activity(GO:0030618) |
| 0.1 | 1.5 | GO:0004118 | cGMP-stimulated cyclic-nucleotide phosphodiesterase activity(GO:0004118) |
| 0.1 | 1.5 | GO:0017049 | GTP-Rho binding(GO:0017049) |
| 0.1 | 0.9 | GO:1990459 | transferrin receptor binding(GO:1990459) |
| 0.1 | 0.4 | GO:0036487 | nitric-oxide synthase inhibitor activity(GO:0036487) |
| 0.1 | 3.5 | GO:0031434 | mitogen-activated protein kinase kinase binding(GO:0031434) |
| 0.1 | 0.4 | GO:0019166 | trans-2-enoyl-CoA reductase (NADPH) activity(GO:0019166) |
| 0.1 | 1.5 | GO:0051378 | amine binding(GO:0043176) serotonin binding(GO:0051378) |
| 0.1 | 1.1 | GO:0032036 | myosin heavy chain binding(GO:0032036) |
| 0.1 | 1.2 | GO:0047035 | testosterone dehydrogenase (NAD+) activity(GO:0047035) |
| 0.1 | 4.8 | GO:0043022 | ribosome binding(GO:0043022) |
| 0.1 | 1.8 | GO:0051010 | microtubule plus-end binding(GO:0051010) |
| 0.1 | 1.6 | GO:0015245 | fatty acid transporter activity(GO:0015245) |
| 0.1 | 0.8 | GO:0004797 | thymidine kinase activity(GO:0004797) |
| 0.1 | 0.5 | GO:0008508 | bile acid:sodium symporter activity(GO:0008508) |
| 0.1 | 0.1 | GO:0033549 | MAP kinase phosphatase activity(GO:0033549) |
| 0.1 | 1.7 | GO:0047372 | acylglycerol lipase activity(GO:0047372) |
| 0.1 | 3.0 | GO:0003746 | translation elongation factor activity(GO:0003746) |
| 0.1 | 0.8 | GO:0003828 | alpha-N-acetylneuraminate alpha-2,8-sialyltransferase activity(GO:0003828) |
| 0.1 | 2.1 | GO:0016303 | 1-phosphatidylinositol-3-kinase activity(GO:0016303) |
| 0.1 | 0.7 | GO:0004897 | ciliary neurotrophic factor receptor activity(GO:0004897) |
| 0.1 | 0.3 | GO:0015275 | stretch-activated, cation-selective, calcium channel activity(GO:0015275) |
| 0.1 | 0.3 | GO:0098973 | structural constituent of synapse(GO:0098918) structural constituent of postsynaptic actin cytoskeleton(GO:0098973) |
| 0.1 | 1.5 | GO:0010181 | FMN binding(GO:0010181) |
| 0.1 | 3.8 | GO:0035591 | signaling adaptor activity(GO:0035591) |
| 0.1 | 0.2 | GO:0035402 | histone kinase activity (H3-T11 specific)(GO:0035402) |
| 0.1 | 0.3 | GO:0043533 | inositol 1,3,4,5 tetrakisphosphate binding(GO:0043533) |
| 0.1 | 0.2 | GO:0004660 | protein farnesyltransferase activity(GO:0004660) |
| 0.1 | 1.2 | GO:0016594 | glycine binding(GO:0016594) |
| 0.1 | 0.8 | GO:0005332 | gamma-aminobutyric acid:sodium symporter activity(GO:0005332) gamma-aminobutyric acid transmembrane transporter activity(GO:0015185) |
| 0.1 | 0.2 | GO:0035184 | histone threonine kinase activity(GO:0035184) |
| 0.1 | 0.5 | GO:0003956 | NAD(P)+-protein-arginine ADP-ribosyltransferase activity(GO:0003956) |
| 0.1 | 1.4 | GO:0016854 | racemase and epimerase activity(GO:0016854) |
| 0.1 | 0.7 | GO:0003689 | DNA clamp loader activity(GO:0003689) protein-DNA loading ATPase activity(GO:0033170) |
| 0.1 | 0.5 | GO:0019776 | Atg8 ligase activity(GO:0019776) |
| 0.1 | 0.7 | GO:0015186 | L-glutamine transmembrane transporter activity(GO:0015186) |
| 0.1 | 0.3 | GO:0015116 | sulfate transmembrane transporter activity(GO:0015116) |
| 0.1 | 0.3 | GO:0061752 | telomeric repeat-containing RNA binding(GO:0061752) |
| 0.1 | 5.3 | GO:0001085 | RNA polymerase II transcription factor binding(GO:0001085) |
| 0.1 | 3.1 | GO:0051183 | vitamin transporter activity(GO:0051183) |
| 0.1 | 1.1 | GO:0016274 | arginine N-methyltransferase activity(GO:0016273) protein-arginine N-methyltransferase activity(GO:0016274) |
| 0.1 | 2.8 | GO:0008331 | high voltage-gated calcium channel activity(GO:0008331) |
| 0.1 | 0.5 | GO:0039552 | RIG-I binding(GO:0039552) |
| 0.1 | 0.3 | GO:0005104 | fibroblast growth factor receptor binding(GO:0005104) |
| 0.1 | 1.1 | GO:0004383 | guanylate cyclase activity(GO:0004383) |
| 0.1 | 0.8 | GO:0004117 | calmodulin-dependent cyclic-nucleotide phosphodiesterase activity(GO:0004117) |
| 0.1 | 2.6 | GO:0070182 | DNA polymerase binding(GO:0070182) |
| 0.1 | 2.7 | GO:0030971 | receptor tyrosine kinase binding(GO:0030971) |
| 0.1 | 2.2 | GO:0008483 | transaminase activity(GO:0008483) |
| 0.1 | 0.8 | GO:0017176 | phosphatidylinositol N-acetylglucosaminyltransferase activity(GO:0017176) |
| 0.1 | 0.4 | GO:0004966 | galanin receptor activity(GO:0004966) |
| 0.1 | 1.6 | GO:0032266 | phosphatidylinositol-3-phosphate binding(GO:0032266) |
| 0.1 | 2.4 | GO:0030676 | Rac guanyl-nucleotide exchange factor activity(GO:0030676) |
| 0.1 | 1.4 | GO:0001786 | phosphatidylserine binding(GO:0001786) |
| 0.1 | 0.3 | GO:0004551 | nucleotide diphosphatase activity(GO:0004551) |
| 0.1 | 2.2 | GO:0016702 | oxidoreductase activity, acting on single donors with incorporation of molecular oxygen, incorporation of two atoms of oxygen(GO:0016702) |
| 0.1 | 1.3 | GO:0071837 | HMG box domain binding(GO:0071837) |
| 0.1 | 0.4 | GO:0008889 | glycerophosphodiester phosphodiesterase activity(GO:0008889) |
| 0.1 | 0.5 | GO:0017151 | DEAD/H-box RNA helicase binding(GO:0017151) |
| 0.1 | 9.6 | GO:0020037 | heme binding(GO:0020037) |
| 0.1 | 1.0 | GO:0008649 | rRNA methyltransferase activity(GO:0008649) |
| 0.1 | 0.4 | GO:0004800 | thyroxine 5'-deiodinase activity(GO:0004800) |
| 0.1 | 1.4 | GO:0016709 | oxidoreductase activity, acting on paired donors, with incorporation or reduction of molecular oxygen, NAD(P)H as one donor, and incorporation of one atom of oxygen(GO:0016709) |
| 0.1 | 0.5 | GO:0008597 | calcium-dependent protein serine/threonine phosphatase regulator activity(GO:0008597) |
| 0.1 | 1.2 | GO:0016813 | hydrolase activity, acting on carbon-nitrogen (but not peptide) bonds, in linear amidines(GO:0016813) |
| 0.1 | 8.0 | GO:0004222 | metalloendopeptidase activity(GO:0004222) |
| 0.1 | 1.1 | GO:0005049 | nuclear export signal receptor activity(GO:0005049) |
| 0.1 | 7.1 | GO:0005254 | chloride channel activity(GO:0005254) |
| 0.1 | 0.4 | GO:0047134 | protein-disulfide reductase activity(GO:0047134) |
| 0.1 | 0.4 | GO:0005021 | vascular endothelial growth factor-activated receptor activity(GO:0005021) |
| 0.1 | 0.6 | GO:1990829 | C-rich single-stranded DNA binding(GO:1990829) |
| 0.1 | 0.5 | GO:0035612 | AP-2 adaptor complex binding(GO:0035612) |
| 0.1 | 2.2 | GO:0035035 | histone acetyltransferase binding(GO:0035035) |
| 0.1 | 1.0 | GO:0017034 | Rap guanyl-nucleotide exchange factor activity(GO:0017034) |
| 0.1 | 0.3 | GO:0004348 | glucosylceramidase activity(GO:0004348) |
| 0.1 | 1.4 | GO:0010485 | H4 histone acetyltransferase activity(GO:0010485) |
| 0.1 | 5.6 | GO:0019003 | GDP binding(GO:0019003) |
| 0.1 | 0.6 | GO:0051184 | cofactor transporter activity(GO:0051184) |
| 0.1 | 2.1 | GO:0048487 | beta-tubulin binding(GO:0048487) |
| 0.1 | 0.3 | GO:0000405 | bubble DNA binding(GO:0000405) |
| 0.1 | 0.4 | GO:0031708 | endothelin B receptor binding(GO:0031708) |
| 0.1 | 2.0 | GO:0008188 | neuropeptide receptor activity(GO:0008188) |
| 0.1 | 1.1 | GO:0005095 | GTPase inhibitor activity(GO:0005095) |
| 0.1 | 1.4 | GO:0003707 | steroid hormone receptor activity(GO:0003707) |
| 0.1 | 0.4 | GO:0017162 | aryl hydrocarbon receptor binding(GO:0017162) |
| 0.1 | 0.4 | GO:0017040 | ceramidase activity(GO:0017040) |
| 0.1 | 7.4 | GO:0004896 | cytokine receptor activity(GO:0004896) |
| 0.1 | 0.2 | GO:0047751 | 3-oxo-5-alpha-steroid 4-dehydrogenase activity(GO:0003865) steroid dehydrogenase activity, acting on the CH-CH group of donors(GO:0033765) cholestenone 5-alpha-reductase activity(GO:0047751) |
| 0.1 | 0.9 | GO:0047555 | 3',5'-cyclic-GMP phosphodiesterase activity(GO:0047555) |
| 0.1 | 1.0 | GO:0008569 | ATP-dependent microtubule motor activity, minus-end-directed(GO:0008569) |
| 0.1 | 1.6 | GO:0042166 | acetylcholine binding(GO:0042166) |
| 0.1 | 0.5 | GO:0022841 | potassium ion leak channel activity(GO:0022841) |
| 0.1 | 0.2 | GO:0004878 | complement component C5a receptor activity(GO:0004878) |
| 0.1 | 0.6 | GO:0005243 | gap junction channel activity(GO:0005243) |
| 0.1 | 0.2 | GO:0004711 | ribosomal protein S6 kinase activity(GO:0004711) |
| 0.1 | 0.6 | GO:0004017 | adenylate kinase activity(GO:0004017) |
| 0.1 | 0.3 | GO:0036033 | mediator complex binding(GO:0036033) |
| 0.1 | 2.2 | GO:0008138 | protein tyrosine/serine/threonine phosphatase activity(GO:0008138) |
| 0.1 | 1.3 | GO:0043539 | protein serine/threonine kinase activator activity(GO:0043539) |
| 0.1 | 1.4 | GO:0001106 | RNA polymerase II transcription corepressor activity(GO:0001106) |
| 0.0 | 0.4 | GO:0004993 | G-protein coupled serotonin receptor activity(GO:0004993) |
| 0.0 | 0.1 | GO:0016774 | phosphotransferase activity, carboxyl group as acceptor(GO:0016774) |
| 0.0 | 0.3 | GO:0004111 | creatine kinase activity(GO:0004111) |
| 0.0 | 0.7 | GO:0003688 | DNA replication origin binding(GO:0003688) |
| 0.0 | 0.1 | GO:0008511 | sodium:potassium:chloride symporter activity(GO:0008511) |
| 0.0 | 0.7 | GO:0008175 | tRNA methyltransferase activity(GO:0008175) |
| 0.0 | 0.4 | GO:0102338 | fatty acid elongase activity(GO:0009922) 3-oxo-arachidoyl-CoA synthase activity(GO:0102336) 3-oxo-cerotoyl-CoA synthase activity(GO:0102337) 3-oxo-lignoceronyl-CoA synthase activity(GO:0102338) |
| 0.0 | 0.6 | GO:0015280 | ligand-gated sodium channel activity(GO:0015280) |
| 0.0 | 0.6 | GO:0008376 | acetylgalactosaminyltransferase activity(GO:0008376) |
| 0.0 | 0.4 | GO:0004691 | cAMP-dependent protein kinase activity(GO:0004691) |
| 0.0 | 0.6 | GO:0008417 | fucosyltransferase activity(GO:0008417) |
| 0.0 | 0.8 | GO:0008239 | dipeptidyl-peptidase activity(GO:0008239) |
| 0.0 | 0.3 | GO:0004652 | polynucleotide adenylyltransferase activity(GO:0004652) |
| 0.0 | 0.3 | GO:0016500 | protein-hormone receptor activity(GO:0016500) |
| 0.0 | 0.2 | GO:0030548 | acetylcholine receptor regulator activity(GO:0030548) neurotransmitter receptor regulator activity(GO:0099602) |
| 0.0 | 0.6 | GO:0048156 | tau protein binding(GO:0048156) |
| 0.0 | 0.3 | GO:0051434 | BH3 domain binding(GO:0051434) |
| 0.0 | 0.3 | GO:0035197 | siRNA binding(GO:0035197) |
| 0.0 | 4.2 | GO:0000982 | transcription factor activity, RNA polymerase II core promoter proximal region sequence-specific binding(GO:0000982) |
| 0.0 | 0.1 | GO:0008321 | Ral guanyl-nucleotide exchange factor activity(GO:0008321) |
| 0.0 | 0.3 | GO:0017147 | Wnt-protein binding(GO:0017147) |
| 0.0 | 0.7 | GO:0000049 | tRNA binding(GO:0000049) |
| 0.0 | 0.6 | GO:0034237 | protein kinase A regulatory subunit binding(GO:0034237) |
| 0.0 | 10.7 | GO:0045296 | cadherin binding(GO:0045296) |
| 0.0 | 0.4 | GO:0017134 | fibroblast growth factor binding(GO:0017134) |
| 0.0 | 0.3 | GO:0016671 | oxidoreductase activity, acting on a sulfur group of donors, disulfide as acceptor(GO:0016671) |
| 0.0 | 0.2 | GO:0005220 | inositol 1,4,5-trisphosphate-sensitive calcium-release channel activity(GO:0005220) |
| 0.0 | 0.4 | GO:0031005 | filamin binding(GO:0031005) |
| 0.0 | 0.6 | GO:0005123 | death receptor binding(GO:0005123) |
| 0.0 | 0.8 | GO:0008028 | monocarboxylic acid transmembrane transporter activity(GO:0008028) |
| 0.0 | 1.4 | GO:0004869 | cysteine-type endopeptidase inhibitor activity(GO:0004869) |
| 0.0 | 0.4 | GO:1901612 | cardiolipin binding(GO:1901612) |
| 0.0 | 3.7 | GO:0001228 | transcriptional activator activity, RNA polymerase II transcription regulatory region sequence-specific binding(GO:0001228) |
| 0.0 | 0.2 | GO:0097322 | 7SK snRNA binding(GO:0097322) |
| 0.0 | 0.8 | GO:0097200 | cysteine-type endopeptidase activity involved in execution phase of apoptosis(GO:0097200) |
| 0.0 | 0.8 | GO:0022839 | ion gated channel activity(GO:0022839) |
| 0.0 | 0.8 | GO:0030374 | ligand-dependent nuclear receptor transcription coactivator activity(GO:0030374) |
| 0.0 | 0.2 | GO:0017160 | Ral GTPase binding(GO:0017160) |
| 0.0 | 0.5 | GO:0070566 | adenylyltransferase activity(GO:0070566) |
| 0.0 | 1.7 | GO:0004984 | olfactory receptor activity(GO:0004984) |
| 0.0 | 0.2 | GO:0008603 | cAMP-dependent protein kinase regulator activity(GO:0008603) |
| 0.0 | 0.3 | GO:0045028 | G-protein coupled nucleotide receptor activity(GO:0001608) G-protein coupled purinergic nucleotide receptor activity(GO:0045028) |
| 0.0 | 0.4 | GO:0051721 | protein phosphatase 2A binding(GO:0051721) |
| 0.0 | 1.6 | GO:0005179 | hormone activity(GO:0005179) |
| 0.0 | 0.1 | GO:0004767 | sphingomyelin phosphodiesterase activity(GO:0004767) |
| 0.0 | 0.1 | GO:0016724 | ferroxidase activity(GO:0004322) oxidoreductase activity, oxidizing metal ions, oxygen as acceptor(GO:0016724) |
| 0.0 | 0.1 | GO:0001871 | pattern binding(GO:0001871) polysaccharide binding(GO:0030247) |
| 0.0 | 0.1 | GO:0005158 | insulin receptor binding(GO:0005158) |
Gene overrepresentation in curated gene sets: canonical pathways category:
| Log-likelihood per target | Total log-likelihood | Term | Description |
|---|---|---|---|
| 1.5 | 105.6 | PID SYNDECAN 4 PATHWAY | Syndecan-4-mediated signaling events |
| 1.3 | 63.6 | NABA COLLAGENS | Genes encoding collagen proteins |
| 1.2 | 47.9 | PID PDGFRA PATHWAY | PDGFR-alpha signaling pathway |
| 1.1 | 15.3 | PID INTEGRIN4 PATHWAY | Alpha6 beta4 integrin-ligand interactions |
| 0.7 | 13.7 | SA REG CASCADE OF CYCLIN EXPR | Expression of cyclins regulates progression through the cell cycle by activating cyclin-dependent kinases. |
| 0.7 | 52.6 | PID HNF3A PATHWAY | FOXA1 transcription factor network |
| 0.7 | 8.2 | NABA BASEMENT MEMBRANES | Genes encoding structural components of basement membranes |
| 0.7 | 15.4 | PID INTEGRIN5 PATHWAY | Beta5 beta6 beta7 and beta8 integrin cell surface interactions |
| 0.6 | 3.8 | PID ALK1 PATHWAY | ALK1 signaling events |
| 0.6 | 32.0 | PID A6B1 A6B4 INTEGRIN PATHWAY | a6b1 and a6b4 Integrin signaling |
| 0.6 | 11.4 | SA TRKA RECEPTOR | The TrkA receptor binds nerve growth factor to activate MAP kinase pathways and promote cell growth. |
| 0.6 | 6.7 | PID SMAD2 3PATHWAY | Regulation of cytoplasmic and nuclear SMAD2/3 signaling |
| 0.5 | 15.8 | PID WNT SIGNALING PATHWAY | Wnt signaling network |
| 0.5 | 0.5 | PID ERB GENOMIC PATHWAY | Validated nuclear estrogen receptor beta network |
| 0.5 | 4.6 | PID TCR RAS PATHWAY | Ras signaling in the CD4+ TCR pathway |
| 0.4 | 8.9 | PID ALK2 PATHWAY | ALK2 signaling events |
| 0.4 | 16.0 | PID RET PATHWAY | Signaling events regulated by Ret tyrosine kinase |
| 0.4 | 6.4 | PID PS1 PATHWAY | Presenilin action in Notch and Wnt signaling |
| 0.4 | 2.0 | PID ER NONGENOMIC PATHWAY | Plasma membrane estrogen receptor signaling |
| 0.4 | 22.3 | PID ECADHERIN NASCENT AJ PATHWAY | E-cadherin signaling in the nascent adherens junction |
| 0.4 | 2.9 | PID VEGFR1 PATHWAY | VEGFR1 specific signals |
| 0.4 | 6.0 | PID LPA4 PATHWAY | LPA4-mediated signaling events |
| 0.3 | 6.4 | PID CIRCADIAN PATHWAY | Circadian rhythm pathway |
| 0.3 | 11.6 | PID UPA UPAR PATHWAY | Urokinase-type plasminogen activator (uPA) and uPAR-mediated signaling |
| 0.3 | 12.3 | PID SYNDECAN 2 PATHWAY | Syndecan-2-mediated signaling events |
| 0.3 | 12.9 | PID ECADHERIN STABILIZATION PATHWAY | Stabilization and expansion of the E-cadherin adherens junction |
| 0.3 | 5.5 | PID VEGF VEGFR PATHWAY | VEGF and VEGFR signaling network |
| 0.3 | 8.2 | PID ERBB NETWORK PATHWAY | ErbB receptor signaling network |
| 0.3 | 26.0 | PID CASPASE PATHWAY | Caspase cascade in apoptosis |
| 0.3 | 14.3 | PID RXR VDR PATHWAY | RXR and RAR heterodimerization with other nuclear receptor |
| 0.3 | 1.9 | ST G ALPHA S PATHWAY | G alpha s Pathway |
| 0.3 | 17.2 | PID RAC1 REG PATHWAY | Regulation of RAC1 activity |
| 0.3 | 2.9 | ST JAK STAT PATHWAY | Jak-STAT Pathway |
| 0.2 | 10.6 | ST GA13 PATHWAY | G alpha 13 Pathway |
| 0.2 | 9.4 | PID P38 MKK3 6PATHWAY | p38 MAPK signaling pathway |
| 0.2 | 7.1 | PID TOLL ENDOGENOUS PATHWAY | Endogenous TLR signaling |
| 0.2 | 40.9 | NABA ECM GLYCOPROTEINS | Genes encoding structural ECM glycoproteins |
| 0.2 | 4.6 | PID INTEGRIN1 PATHWAY | Beta1 integrin cell surface interactions |
| 0.2 | 16.8 | PID TELOMERASE PATHWAY | Regulation of Telomerase |
| 0.2 | 1.8 | PID RANBP2 PATHWAY | Sumoylation by RanBP2 regulates transcriptional repression |
| 0.2 | 8.0 | PID FOXM1 PATHWAY | FOXM1 transcription factor network |
| 0.2 | 9.8 | PID P75 NTR PATHWAY | p75(NTR)-mediated signaling |
| 0.2 | 6.7 | ST MYOCYTE AD PATHWAY | Myocyte Adrenergic Pathway is a specific case of the generalized Adrenergic Pathway. |
| 0.2 | 2.4 | PID AURORA A PATHWAY | Aurora A signaling |
| 0.2 | 42.9 | NABA ECM REGULATORS | Genes encoding enzymes and their regulators involved in the remodeling of the extracellular matrix |
| 0.2 | 9.7 | ST FAS SIGNALING PATHWAY | Fas Signaling Pathway |
| 0.2 | 2.1 | ST GA12 PATHWAY | G alpha 12 Pathway |
| 0.1 | 2.7 | ST DIFFERENTIATION PATHWAY IN PC12 CELLS | Differentiation Pathway in PC12 Cells; this is a specific case of PAC1 Receptor Pathway. |
| 0.1 | 7.1 | PID TAP63 PATHWAY | Validated transcriptional targets of TAp63 isoforms |
| 0.1 | 1.2 | SA FAS SIGNALING | The TNF-type receptor Fas induces apoptosis on ligand binding. |
| 0.1 | 2.3 | ST TUMOR NECROSIS FACTOR PATHWAY | Tumor Necrosis Factor Pathway. |
| 0.1 | 1.7 | PID IL2 1PATHWAY | IL2-mediated signaling events |
| 0.1 | 0.5 | PID AR NONGENOMIC PATHWAY | Nongenotropic Androgen signaling |
| 0.1 | 1.8 | PID PI3K PLC TRK PATHWAY | Trk receptor signaling mediated by PI3K and PLC-gamma |
| 0.1 | 6.0 | PID MTOR 4PATHWAY | mTOR signaling pathway |
| 0.1 | 1.9 | ST WNT BETA CATENIN PATHWAY | Wnt/beta-catenin Pathway |
| 0.1 | 2.6 | SIG INSULIN RECEPTOR PATHWAY IN CARDIAC MYOCYTES | Genes related to the insulin receptor pathway |
| 0.1 | 1.7 | PID PI3KCI AKT PATHWAY | Class I PI3K signaling events mediated by Akt |
| 0.1 | 5.1 | PID FGF PATHWAY | FGF signaling pathway |
| 0.1 | 1.7 | PID EPHA FWDPATHWAY | EPHA forward signaling |
| 0.1 | 17.8 | NABA ECM AFFILIATED | Genes encoding proteins affiliated structurally or functionally to extracellular matrix proteins |
| 0.1 | 0.4 | PID NFKAPPAB ATYPICAL PATHWAY | Atypical NF-kappaB pathway |
| 0.1 | 1.0 | PID MAPK TRK PATHWAY | Trk receptor signaling mediated by the MAPK pathway |
| 0.1 | 7.7 | WNT SIGNALING | Genes related to Wnt-mediated signal transduction |
| 0.1 | 8.3 | PID BETA CATENIN NUC PATHWAY | Regulation of nuclear beta catenin signaling and target gene transcription |
| 0.1 | 0.7 | PID RHOA PATHWAY | RhoA signaling pathway |
| 0.1 | 22.9 | NABA SECRETED FACTORS | Genes encoding secreted soluble factors |
| 0.1 | 1.1 | PID DNA PK PATHWAY | DNA-PK pathway in nonhomologous end joining |
| 0.1 | 2.5 | PID HES HEY PATHWAY | Notch-mediated HES/HEY network |
| 0.1 | 2.2 | PID FANCONI PATHWAY | Fanconi anemia pathway |
| 0.1 | 1.2 | PID AVB3 OPN PATHWAY | Osteopontin-mediated events |
| 0.1 | 3.6 | PID HNF3B PATHWAY | FOXA2 and FOXA3 transcription factor networks |
| 0.1 | 0.6 | PID ERBB2 ERBB3 PATHWAY | ErbB2/ErbB3 signaling events |
| 0.1 | 0.9 | PID INTEGRIN3 PATHWAY | Beta3 integrin cell surface interactions |
| 0.1 | 1.2 | PID CDC42 PATHWAY | CDC42 signaling events |
| 0.1 | 0.7 | PID HEDGEHOG 2PATHWAY | Signaling events mediated by the Hedgehog family |
| 0.0 | 0.5 | PID MET PATHWAY | Signaling events mediated by Hepatocyte Growth Factor Receptor (c-Met) |
| 0.0 | 0.6 | PID CD40 PATHWAY | CD40/CD40L signaling |
| 0.0 | 2.1 | PID REG GR PATHWAY | Glucocorticoid receptor regulatory network |
| 0.0 | 0.2 | PID P38 ALPHA BETA PATHWAY | Regulation of p38-alpha and p38-beta |
| 0.0 | 2.4 | PID IL4 2PATHWAY | IL4-mediated signaling events |
| 0.0 | 0.6 | PID BCR 5PATHWAY | BCR signaling pathway |
| 0.0 | 1.7 | NABA MATRISOME | Ensemble of genes encoding extracellular matrix and extracellular matrix-associated proteins |
| 0.0 | 0.8 | PID CERAMIDE PATHWAY | Ceramide signaling pathway |
| 0.0 | 0.5 | PID BMP PATHWAY | BMP receptor signaling |
| 0.0 | 1.3 | PID ARF6 TRAFFICKING PATHWAY | Arf6 trafficking events |
| 0.0 | 0.5 | SA MMP CYTOKINE CONNECTION | Cytokines can induce activation of matrix metalloproteinases, which degrade extracellular matrix. |
| 0.0 | 2.5 | PID ERBB1 DOWNSTREAM PATHWAY | ErbB1 downstream signaling |
| 0.0 | 0.4 | PID IL27 PATHWAY | IL27-mediated signaling events |
| 0.0 | 0.4 | PID ATM PATHWAY | ATM pathway |
| 0.0 | 0.8 | PID NFAT TFPATHWAY | Calcineurin-regulated NFAT-dependent transcription in lymphocytes |
| 0.0 | 1.4 | PID P73PATHWAY | p73 transcription factor network |
| 0.0 | 1.0 | PID AURORA B PATHWAY | Aurora B signaling |
| 0.0 | 0.2 | PID INTEGRIN A4B1 PATHWAY | Alpha4 beta1 integrin signaling events |
| 0.0 | 0.1 | SA G2 AND M PHASES | Cdc25 activates the cdc2/cyclin B complex to induce the G2/M transition. |
Gene overrepresentation in curated gene sets: REACTOME pathways category:
| Log-likelihood per target | Total log-likelihood | Term | Description |
|---|---|---|---|
| 2.3 | 4.5 | REACTOME SCFSKP2 MEDIATED DEGRADATION OF P27 P21 | Genes involved in SCF(Skp2)-mediated degradation of p27/p21 |
| 1.7 | 44.9 | REACTOME HS GAG DEGRADATION | Genes involved in HS-GAG degradation |
| 1.3 | 85.1 | REACTOME COLLAGEN FORMATION | Genes involved in Collagen formation |
| 1.2 | 1.2 | REACTOME ACYL CHAIN REMODELLING OF PS | Genes involved in Acyl chain remodelling of PS |
| 1.1 | 38.0 | REACTOME ENOS ACTIVATION AND REGULATION | Genes involved in eNOS activation and regulation |
| 1.1 | 23.9 | REACTOME APOPTOTIC CLEAVAGE OF CELL ADHESION PROTEINS | Genes involved in Apoptotic cleavage of cell adhesion proteins |
| 0.8 | 27.6 | REACTOME RNA POL III TRANSCRIPTION TERMINATION | Genes involved in RNA Polymerase III Transcription Termination |
| 0.7 | 22.4 | REACTOME G BETA GAMMA SIGNALLING THROUGH PI3KGAMMA | Genes involved in G beta:gamma signalling through PI3Kgamma |
| 0.6 | 20.7 | REACTOME CELL EXTRACELLULAR MATRIX INTERACTIONS | Genes involved in Cell-extracellular matrix interactions |
| 0.6 | 10.2 | REACTOME ZINC TRANSPORTERS | Genes involved in Zinc transporters |
| 0.6 | 19.7 | REACTOME ADHERENS JUNCTIONS INTERACTIONS | Genes involved in Adherens junctions interactions |
| 0.5 | 9.8 | REACTOME REGULATION OF RHEB GTPASE ACTIVITY BY AMPK | Genes involved in Regulation of Rheb GTPase activity by AMPK |
| 0.5 | 10.1 | REACTOME SIGNALING BY ACTIVATED POINT MUTANTS OF FGFR1 | Genes involved in Signaling by activated point mutants of FGFR1 |
| 0.5 | 24.0 | REACTOME SMOOTH MUSCLE CONTRACTION | Genes involved in Smooth Muscle Contraction |
| 0.5 | 67.0 | REACTOME RESPONSE TO ELEVATED PLATELET CYTOSOLIC CA2 | Genes involved in Response to elevated platelet cytosolic Ca2+ |
| 0.5 | 7.3 | REACTOME YAP1 AND WWTR1 TAZ STIMULATED GENE EXPRESSION | Genes involved in YAP1- and WWTR1 (TAZ)-stimulated gene expression |
| 0.4 | 3.1 | REACTOME CIRCADIAN REPRESSION OF EXPRESSION BY REV ERBA | Genes involved in Circadian Repression of Expression by REV-ERBA |
| 0.4 | 8.2 | REACTOME SYNTHESIS SECRETION AND DEACYLATION OF GHRELIN | Genes involved in Synthesis, Secretion, and Deacylation of Ghrelin |
| 0.4 | 8.5 | REACTOME SIGNAL ATTENUATION | Genes involved in Signal attenuation |
| 0.3 | 3.6 | REACTOME VEGF LIGAND RECEPTOR INTERACTIONS | Genes involved in VEGF ligand-receptor interactions |
| 0.3 | 32.9 | REACTOME TRANSCRIPTIONAL REGULATION OF WHITE ADIPOCYTE DIFFERENTIATION | Genes involved in Transcriptional Regulation of White Adipocyte Differentiation |
| 0.3 | 4.1 | REACTOME ACTIVATION OF CHAPERONE GENES BY ATF6 ALPHA | Genes involved in Activation of Chaperone Genes by ATF6-alpha |
| 0.3 | 4.1 | REACTOME CDC6 ASSOCIATION WITH THE ORC ORIGIN COMPLEX | Genes involved in CDC6 association with the ORC:origin complex |
| 0.3 | 2.0 | REACTOME TANDEM PORE DOMAIN POTASSIUM CHANNELS | Genes involved in Tandem pore domain potassium channels |
| 0.3 | 2.3 | REACTOME ACYL CHAIN REMODELLING OF PE | Genes involved in Acyl chain remodelling of PE |
| 0.3 | 1.6 | REACTOME ACETYLCHOLINE NEUROTRANSMITTER RELEASE CYCLE | Genes involved in Acetylcholine Neurotransmitter Release Cycle |
| 0.3 | 1.9 | REACTOME ADP SIGNALLING THROUGH P2RY12 | Genes involved in ADP signalling through P2Y purinoceptor 12 |
| 0.3 | 6.5 | REACTOME GLUCURONIDATION | Genes involved in Glucuronidation |
| 0.3 | 3.4 | REACTOME PASSIVE TRANSPORT BY AQUAPORINS | Genes involved in Passive Transport by Aquaporins |
| 0.3 | 5.9 | REACTOME SYNTHESIS OF GLYCOSYLPHOSPHATIDYLINOSITOL GPI | Genes involved in Synthesis of glycosylphosphatidylinositol (GPI) |
| 0.3 | 3.0 | REACTOME GLYCOPROTEIN HORMONES | Genes involved in Glycoprotein hormones |
| 0.2 | 8.4 | REACTOME GAP JUNCTION TRAFFICKING | Genes involved in Gap junction trafficking |
| 0.2 | 10.3 | REACTOME SIGNALING BY BMP | Genes involved in Signaling by BMP |
| 0.2 | 3.4 | REACTOME SEROTONIN RECEPTORS | Genes involved in Serotonin receptors |
| 0.2 | 2.6 | REACTOME MEMBRANE BINDING AND TARGETTING OF GAG PROTEINS | Genes involved in Membrane binding and targetting of GAG proteins |
| 0.2 | 4.2 | REACTOME G PROTEIN ACTIVATION | Genes involved in G-protein activation |
| 0.2 | 1.5 | REACTOME ANTIGEN ACTIVATES B CELL RECEPTOR LEADING TO GENERATION OF SECOND MESSENGERS | Genes involved in Antigen Activates B Cell Receptor Leading to Generation of Second Messengers |
| 0.2 | 2.8 | REACTOME KERATAN SULFATE DEGRADATION | Genes involved in Keratan sulfate degradation |
| 0.2 | 10.6 | REACTOME STRIATED MUSCLE CONTRACTION | Genes involved in Striated Muscle Contraction |
| 0.2 | 1.9 | REACTOME ERKS ARE INACTIVATED | Genes involved in ERKs are inactivated |
| 0.2 | 6.8 | REACTOME NUCLEAR EVENTS KINASE AND TRANSCRIPTION FACTOR ACTIVATION | Genes involved in Nuclear Events (kinase and transcription factor activation) |
| 0.2 | 10.5 | REACTOME MEIOTIC SYNAPSIS | Genes involved in Meiotic Synapsis |
| 0.2 | 12.3 | REACTOME CELL JUNCTION ORGANIZATION | Genes involved in Cell junction organization |
| 0.2 | 1.4 | REACTOME METAL ION SLC TRANSPORTERS | Genes involved in Metal ion SLC transporters |
| 0.2 | 2.0 | REACTOME INHIBITION OF INSULIN SECRETION BY ADRENALINE NORADRENALINE | Genes involved in Inhibition of Insulin Secretion by Adrenaline/Noradrenaline |
| 0.2 | 0.8 | REACTOME RECEPTOR LIGAND BINDING INITIATES THE SECOND PROTEOLYTIC CLEAVAGE OF NOTCH RECEPTOR | Genes involved in Receptor-ligand binding initiates the second proteolytic cleavage of Notch receptor |
| 0.2 | 1.7 | REACTOME ELEVATION OF CYTOSOLIC CA2 LEVELS | Genes involved in Elevation of cytosolic Ca2+ levels |
| 0.2 | 6.8 | REACTOME DEADENYLATION OF MRNA | Genes involved in Deadenylation of mRNA |
| 0.2 | 2.7 | REACTOME GLUTAMATE NEUROTRANSMITTER RELEASE CYCLE | Genes involved in Glutamate Neurotransmitter Release Cycle |
| 0.2 | 7.4 | REACTOME NCAM1 INTERACTIONS | Genes involved in NCAM1 interactions |
| 0.2 | 3.1 | REACTOME NOREPINEPHRINE NEUROTRANSMITTER RELEASE CYCLE | Genes involved in Norepinephrine Neurotransmitter Release Cycle |
| 0.2 | 3.4 | REACTOME CS DS DEGRADATION | Genes involved in CS/DS degradation |
| 0.2 | 6.9 | REACTOME O LINKED GLYCOSYLATION OF MUCINS | Genes involved in O-linked glycosylation of mucins |
| 0.2 | 2.9 | REACTOME SIGNALING BY CONSTITUTIVELY ACTIVE EGFR | Genes involved in Signaling by constitutively active EGFR |
| 0.2 | 2.8 | REACTOME FANCONI ANEMIA PATHWAY | Genes involved in Fanconi Anemia pathway |
| 0.2 | 3.2 | REACTOME FACILITATIVE NA INDEPENDENT GLUCOSE TRANSPORTERS | Genes involved in Facilitative Na+-independent glucose transporters |
| 0.2 | 1.4 | REACTOME RNA POL III TRANSCRIPTION INITIATION FROM TYPE 2 PROMOTER | Genes involved in RNA Polymerase III Transcription Initiation From Type 2 Promoter |
| 0.2 | 2.2 | REACTOME NEF MEDIATED DOWNREGULATION OF MHC CLASS I COMPLEX CELL SURFACE EXPRESSION | Genes involved in Nef mediated downregulation of MHC class I complex cell surface expression |
| 0.2 | 1.3 | REACTOME PEPTIDE CHAIN ELONGATION | Genes involved in Peptide chain elongation |
| 0.2 | 3.0 | REACTOME HYALURONAN UPTAKE AND DEGRADATION | Genes involved in Hyaluronan uptake and degradation |
| 0.2 | 2.5 | REACTOME NOTCH HLH TRANSCRIPTION PATHWAY | Genes involved in Notch-HLH transcription pathway |
| 0.2 | 1.8 | REACTOME TRAFFICKING AND PROCESSING OF ENDOSOMAL TLR | Genes involved in Trafficking and processing of endosomal TLR |
| 0.2 | 1.8 | REACTOME BMAL1 CLOCK NPAS2 ACTIVATES CIRCADIAN EXPRESSION | Genes involved in BMAL1:CLOCK/NPAS2 Activates Circadian Expression |
| 0.1 | 4.6 | REACTOME SPHINGOLIPID DE NOVO BIOSYNTHESIS | Genes involved in Sphingolipid de novo biosynthesis |
| 0.1 | 5.5 | REACTOME GABA A RECEPTOR ACTIVATION | Genes involved in GABA A receptor activation |
| 0.1 | 1.6 | REACTOME COPI MEDIATED TRANSPORT | Genes involved in COPI Mediated Transport |
| 0.1 | 1.7 | REACTOME AKT PHOSPHORYLATES TARGETS IN THE CYTOSOL | Genes involved in AKT phosphorylates targets in the cytosol |
| 0.1 | 2.2 | REACTOME SPRY REGULATION OF FGF SIGNALING | Genes involved in Spry regulation of FGF signaling |
| 0.1 | 6.1 | REACTOME INTRINSIC PATHWAY FOR APOPTOSIS | Genes involved in Intrinsic Pathway for Apoptosis |
| 0.1 | 2.1 | REACTOME ENDOSOMAL SORTING COMPLEX REQUIRED FOR TRANSPORT ESCRT | Genes involved in Endosomal Sorting Complex Required For Transport (ESCRT) |
| 0.1 | 6.9 | REACTOME TRANSPORT TO THE GOLGI AND SUBSEQUENT MODIFICATION | Genes involved in Transport to the Golgi and subsequent modification |
| 0.1 | 1.7 | REACTOME SIGNALING BY HIPPO | Genes involved in Signaling by Hippo |
| 0.1 | 2.0 | REACTOME BILE SALT AND ORGANIC ANION SLC TRANSPORTERS | Genes involved in Bile salt and organic anion SLC transporters |
| 0.1 | 2.2 | REACTOME OXYGEN DEPENDENT PROLINE HYDROXYLATION OF HYPOXIA INDUCIBLE FACTOR ALPHA | Genes involved in Oxygen-dependent Proline Hydroxylation of Hypoxia-inducible Factor Alpha |
| 0.1 | 2.6 | REACTOME CYTOSOLIC SULFONATION OF SMALL MOLECULES | Genes involved in Cytosolic sulfonation of small molecules |
| 0.1 | 10.3 | REACTOME NUCLEAR RECEPTOR TRANSCRIPTION PATHWAY | Genes involved in Nuclear Receptor transcription pathway |
| 0.1 | 1.8 | REACTOME TRANSPORT OF ORGANIC ANIONS | Genes involved in Transport of organic anions |
| 0.1 | 3.2 | REACTOME STEROID HORMONES | Genes involved in Steroid hormones |
| 0.1 | 2.8 | REACTOME SHC1 EVENTS IN ERBB4 SIGNALING | Genes involved in SHC1 events in ERBB4 signaling |
| 0.1 | 2.0 | REACTOME G0 AND EARLY G1 | Genes involved in G0 and Early G1 |
| 0.1 | 2.5 | REACTOME PURINE SALVAGE | Genes involved in Purine salvage |
| 0.1 | 0.5 | REACTOME REGULATION OF KIT SIGNALING | Genes involved in Regulation of KIT signaling |
| 0.1 | 1.4 | REACTOME SYNTHESIS OF SUBSTRATES IN N GLYCAN BIOSYTHESIS | Genes involved in Synthesis of substrates in N-glycan biosythesis |
| 0.1 | 3.5 | REACTOME REGULATION OF BETA CELL DEVELOPMENT | Genes involved in Regulation of beta-cell development |
| 0.1 | 0.7 | REACTOME APC C CDH1 MEDIATED DEGRADATION OF CDC20 AND OTHER APC C CDH1 TARGETED PROTEINS IN LATE MITOSIS EARLY G1 | Genes involved in APC/C:Cdh1 mediated degradation of Cdc20 and other APC/C:Cdh1 targeted proteins in late mitosis/early G1 |
| 0.1 | 1.6 | REACTOME INITIAL TRIGGERING OF COMPLEMENT | Genes involved in Initial triggering of complement |
| 0.1 | 0.2 | REACTOME MTORC1 MEDIATED SIGNALLING | Genes involved in mTORC1-mediated signalling |
| 0.1 | 0.4 | REACTOME INFLUENZA VIRAL RNA TRANSCRIPTION AND REPLICATION | Genes involved in Influenza Viral RNA Transcription and Replication |
| 0.1 | 10.5 | REACTOME DIABETES PATHWAYS | Genes involved in Diabetes pathways |
| 0.1 | 1.4 | REACTOME GPCR LIGAND BINDING | Genes involved in GPCR ligand binding |
| 0.1 | 2.3 | REACTOME IONOTROPIC ACTIVITY OF KAINATE RECEPTORS | Genes involved in Ionotropic activity of Kainate Receptors |
| 0.1 | 2.8 | REACTOME EXTRACELLULAR MATRIX ORGANIZATION | Genes involved in Extracellular matrix organization |
| 0.1 | 1.2 | REACTOME PYRIMIDINE CATABOLISM | Genes involved in Pyrimidine catabolism |
| 0.1 | 0.9 | REACTOME SLC MEDIATED TRANSMEMBRANE TRANSPORT | Genes involved in SLC-mediated transmembrane transport |
| 0.1 | 3.8 | REACTOME NITRIC OXIDE STIMULATES GUANYLATE CYCLASE | Genes involved in Nitric oxide stimulates guanylate cyclase |
| 0.1 | 1.6 | REACTOME PRESYNAPTIC NICOTINIC ACETYLCHOLINE RECEPTORS | Genes involved in Presynaptic nicotinic acetylcholine receptors |
| 0.1 | 3.7 | REACTOME CYTOCHROME P450 ARRANGED BY SUBSTRATE TYPE | Genes involved in Cytochrome P450 - arranged by substrate type |
| 0.1 | 1.4 | REACTOME DESTABILIZATION OF MRNA BY TRISTETRAPROLIN TTP | Genes involved in Destabilization of mRNA by Tristetraprolin (TTP) |
| 0.1 | 0.7 | REACTOME REGULATION OF IFNG SIGNALING | Genes involved in Regulation of IFNG signaling |
| 0.1 | 1.1 | REACTOME MRNA DECAY BY 5 TO 3 EXORIBONUCLEASE | Genes involved in mRNA Decay by 5' to 3' Exoribonuclease |
| 0.1 | 12.2 | REACTOME 3 UTR MEDIATED TRANSLATIONAL REGULATION | Genes involved in 3' -UTR-mediated translational regulation |
| 0.1 | 1.2 | REACTOME REGULATION OF PYRUVATE DEHYDROGENASE PDH COMPLEX | Genes involved in Regulation of pyruvate dehydrogenase (PDH) complex |
| 0.1 | 2.0 | REACTOME BRANCHED CHAIN AMINO ACID CATABOLISM | Genes involved in Branched-chain amino acid catabolism |
| 0.1 | 1.6 | REACTOME SRP DEPENDENT COTRANSLATIONAL PROTEIN TARGETING TO MEMBRANE | Genes involved in SRP-dependent cotranslational protein targeting to membrane |
| 0.1 | 1.8 | REACTOME FORMATION OF FIBRIN CLOT CLOTTING CASCADE | Genes involved in Formation of Fibrin Clot (Clotting Cascade) |
| 0.1 | 3.6 | REACTOME GOLGI ASSOCIATED VESICLE BIOGENESIS | Genes involved in Golgi Associated Vesicle Biogenesis |
| 0.1 | 0.8 | REACTOME ABACAVIR TRANSPORT AND METABOLISM | Genes involved in Abacavir transport and metabolism |
| 0.1 | 1.5 | REACTOME CHOLESTEROL BIOSYNTHESIS | Genes involved in Cholesterol biosynthesis |
| 0.1 | 0.2 | REACTOME PLATELET AGGREGATION PLUG FORMATION | Genes involved in Platelet Aggregation (Plug Formation) |
| 0.1 | 2.9 | REACTOME TRANSPORT OF GLUCOSE AND OTHER SUGARS BILE SALTS AND ORGANIC ACIDS METAL IONS AND AMINE COMPOUNDS | Genes involved in Transport of glucose and other sugars, bile salts and organic acids, metal ions and amine compounds |
| 0.0 | 0.8 | REACTOME HDL MEDIATED LIPID TRANSPORT | Genes involved in HDL-mediated lipid transport |
| 0.0 | 1.3 | REACTOME PTM GAMMA CARBOXYLATION HYPUSINE FORMATION AND ARYLSULFATASE ACTIVATION | Genes involved in PTM: gamma carboxylation, hypusine formation and arylsulfatase activation |
| 0.0 | 1.8 | REACTOME SMAD2 SMAD3 SMAD4 HETEROTRIMER REGULATES TRANSCRIPTION | Genes involved in SMAD2/SMAD3:SMAD4 heterotrimer regulates transcription |
| 0.0 | 1.3 | REACTOME NONSENSE MEDIATED DECAY ENHANCED BY THE EXON JUNCTION COMPLEX | Genes involved in Nonsense Mediated Decay Enhanced by the Exon Junction Complex |
| 0.0 | 0.4 | REACTOME EGFR DOWNREGULATION | Genes involved in EGFR downregulation |
| 0.0 | 0.9 | REACTOME RECYCLING PATHWAY OF L1 | Genes involved in Recycling pathway of L1 |
| 0.0 | 0.8 | REACTOME BASE FREE SUGAR PHOSPHATE REMOVAL VIA THE SINGLE NUCLEOTIDE REPLACEMENT PATHWAY | Genes involved in Base-free sugar-phosphate removal via the single-nucleotide replacement pathway |
| 0.0 | 1.4 | REACTOME TRAF6 MEDIATED IRF7 ACTIVATION | Genes involved in TRAF6 mediated IRF7 activation |
| 0.0 | 1.4 | REACTOME REGULATION OF INSULIN SECRETION BY GLUCAGON LIKE PEPTIDE1 | Genes involved in Regulation of Insulin Secretion by Glucagon-like Peptide-1 |
| 0.0 | 3.6 | REACTOME CLASS B 2 SECRETIN FAMILY RECEPTORS | Genes involved in Class B/2 (Secretin family receptors) |
| 0.0 | 0.3 | REACTOME SYNTHESIS SECRETION AND INACTIVATION OF GIP | Genes involved in Synthesis, Secretion, and Inactivation of Glucose-dependent Insulinotropic Polypeptide (GIP) |
| 0.0 | 0.8 | REACTOME CONVERSION FROM APC C CDC20 TO APC C CDH1 IN LATE ANAPHASE | Genes involved in Conversion from APC/C:Cdc20 to APC/C:Cdh1 in late anaphase |
| 0.0 | 0.1 | REACTOME DSCAM INTERACTIONS | Genes involved in DSCAM interactions |
| 0.0 | 0.2 | REACTOME PKA MEDIATED PHOSPHORYLATION OF CREB | Genes involved in PKA-mediated phosphorylation of CREB |
| 0.0 | 1.2 | REACTOME TRIGLYCERIDE BIOSYNTHESIS | Genes involved in Triglyceride Biosynthesis |
| 0.0 | 0.4 | REACTOME TIE2 SIGNALING | Genes involved in Tie2 Signaling |
| 0.0 | 0.2 | REACTOME MICRORNA MIRNA BIOGENESIS | Genes involved in MicroRNA (miRNA) Biogenesis |
| 0.0 | 4.3 | REACTOME GENERIC TRANSCRIPTION PATHWAY | Genes involved in Generic Transcription Pathway |
| 0.0 | 0.4 | REACTOME AMINE DERIVED HORMONES | Genes involved in Amine-derived hormones |
| 0.0 | 3.9 | REACTOME PEPTIDE LIGAND BINDING RECEPTORS | Genes involved in Peptide ligand-binding receptors |
| 0.0 | 0.4 | REACTOME G ALPHA S SIGNALLING EVENTS | Genes involved in G alpha (s) signalling events |
| 0.0 | 1.7 | REACTOME OLFACTORY SIGNALING PATHWAY | Genes involved in Olfactory Signaling Pathway |
| 0.0 | 0.2 | REACTOME BASIGIN INTERACTIONS | Genes involved in Basigin interactions |
| 0.0 | 0.2 | REACTOME CTNNB1 PHOSPHORYLATION CASCADE | Genes involved in Beta-catenin phosphorylation cascade |
| 0.0 | 0.2 | REACTOME G2 M DNA DAMAGE CHECKPOINT | Genes involved in G2/M DNA damage checkpoint |
| 0.0 | 0.4 | REACTOME CREB PHOSPHORYLATION THROUGH THE ACTIVATION OF CAMKII | Genes involved in CREB phosphorylation through the activation of CaMKII |
| 0.0 | 0.4 | REACTOME SYNTHESIS OF PA | Genes involved in Synthesis of PA |
| 0.0 | 0.1 | REACTOME TRANSMEMBRANE TRANSPORT OF SMALL MOLECULES | Genes involved in Transmembrane transport of small molecules |
| 0.0 | 0.1 | REACTOME LIGAND GATED ION CHANNEL TRANSPORT | Genes involved in Ligand-gated ion channel transport |