Project
GNF SymAtlas + NCI-60 cancer cell lines, human (Su, 2004; Ross, 2000)
Navigation
Downloads
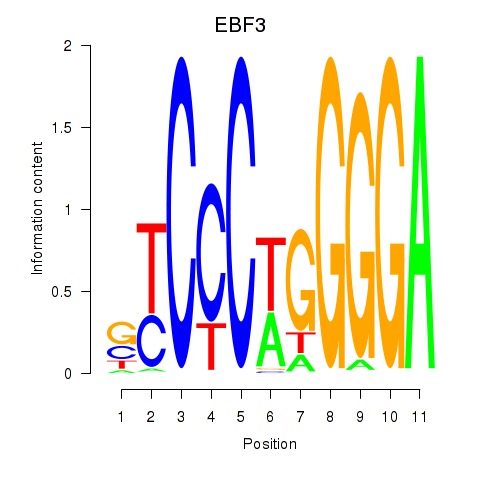
Results for EBF3
Z-value: 0.89
Motif logo
Transcription factors associated with EBF3
| Gene Symbol | Gene ID | Gene Info |
|---|---|---|
|
EBF3
|
ENSG00000108001.16 | EBF3 |
Activity profile of EBF3 motif
Sorted Z-values of EBF3 motif
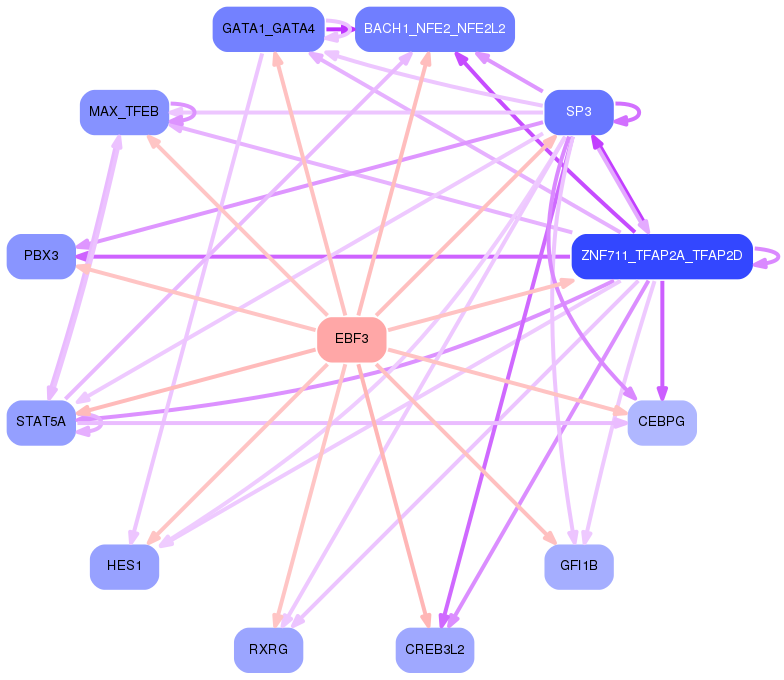
Network of associatons between targets according to the STRING database.

First level regulatory network of EBF3
Gene Ontology Analysis
Gene overrepresentation in biological process category:
| Log-likelihood per target | Total log-likelihood | Term | Description |
|---|---|---|---|
| 2.4 | 9.7 | GO:0060741 | prostate gland stromal morphogenesis(GO:0060741) |
| 2.0 | 5.9 | GO:0030221 | basophil differentiation(GO:0030221) |
| 1.6 | 6.5 | GO:0099640 | axo-dendritic protein transport(GO:0099640) |
| 1.5 | 4.5 | GO:0061011 | hepatic duct development(GO:0061011) |
| 1.5 | 11.8 | GO:0003433 | chondrocyte development involved in endochondral bone morphogenesis(GO:0003433) |
| 1.4 | 7.2 | GO:1902766 | skeletal muscle satellite cell migration(GO:1902766) |
| 1.3 | 3.9 | GO:0018364 | peptidyl-glutamine methylation(GO:0018364) |
| 1.3 | 5.1 | GO:0035606 | peptidyl-cysteine S-trans-nitrosylation(GO:0035606) |
| 1.1 | 7.8 | GO:0045653 | histone H4-R3 methylation(GO:0043985) negative regulation of megakaryocyte differentiation(GO:0045653) positive regulation of hemoglobin biosynthetic process(GO:0046985) |
| 1.1 | 4.3 | GO:0032599 | B cell receptor transport within lipid bilayer(GO:0032595) B cell receptor transport into membrane raft(GO:0032597) protein transport out of membrane raft(GO:0032599) chemokine receptor transport out of membrane raft(GO:0032600) negative regulation of transforming growth factor beta3 production(GO:0032913) chemokine receptor transport within lipid bilayer(GO:0033606) |
| 1.1 | 6.4 | GO:0006021 | inositol biosynthetic process(GO:0006021) |
| 1.0 | 4.2 | GO:1902463 | protein localization to cell leading edge(GO:1902463) |
| 1.0 | 3.1 | GO:0072249 | metanephric glomerular epithelium development(GO:0072244) metanephric glomerular visceral epithelial cell differentiation(GO:0072248) metanephric glomerular visceral epithelial cell development(GO:0072249) metanephric glomerular epithelial cell differentiation(GO:0072312) metanephric glomerular epithelial cell development(GO:0072313) |
| 1.0 | 10.7 | GO:0060753 | regulation of mast cell chemotaxis(GO:0060753) |
| 1.0 | 2.9 | GO:0034402 | recruitment of 3'-end processing factors to RNA polymerase II holoenzyme complex(GO:0034402) |
| 1.0 | 5.7 | GO:0002943 | tRNA dihydrouridine synthesis(GO:0002943) |
| 0.9 | 3.7 | GO:0030037 | actin filament reorganization involved in cell cycle(GO:0030037) |
| 0.9 | 13.7 | GO:0006600 | creatine metabolic process(GO:0006600) |
| 0.9 | 1.8 | GO:0003415 | chondrocyte hypertrophy(GO:0003415) |
| 0.9 | 4.4 | GO:1902044 | regulation of Fas signaling pathway(GO:1902044) |
| 0.9 | 3.5 | GO:0008588 | release of cytoplasmic sequestered NF-kappaB(GO:0008588) |
| 0.9 | 2.6 | GO:1903778 | positive regulation of histamine secretion by mast cell(GO:1903595) protein localization to vacuolar membrane(GO:1903778) |
| 0.9 | 4.3 | GO:0007386 | compartment pattern specification(GO:0007386) |
| 0.8 | 4.2 | GO:0097461 | ferric iron import into cell(GO:0097461) ferric iron import across plasma membrane(GO:0098706) |
| 0.8 | 2.5 | GO:0002818 | intracellular defense response(GO:0002818) |
| 0.8 | 4.9 | GO:1903282 | negative regulation of dopamine uptake involved in synaptic transmission(GO:0051585) norepinephrine uptake(GO:0051620) regulation of norepinephrine uptake(GO:0051621) negative regulation of norepinephrine uptake(GO:0051622) negative regulation of catecholamine uptake involved in synaptic transmission(GO:0051945) regulation of glutathione peroxidase activity(GO:1903282) positive regulation of glutathione peroxidase activity(GO:1903284) positive regulation of hydrogen peroxide catabolic process(GO:1903285) regulation of peroxidase activity(GO:2000468) positive regulation of peroxidase activity(GO:2000470) |
| 0.8 | 6.5 | GO:0051343 | positive regulation of cyclic-nucleotide phosphodiesterase activity(GO:0051343) |
| 0.8 | 3.9 | GO:0032747 | positive regulation of interleukin-23 production(GO:0032747) |
| 0.8 | 7.6 | GO:0043353 | enucleate erythrocyte differentiation(GO:0043353) |
| 0.7 | 2.2 | GO:0061009 | midbrain-hindbrain boundary morphogenesis(GO:0021555) trochlear nerve development(GO:0021558) regulation of timing of neuron differentiation(GO:0060164) common bile duct development(GO:0061009) |
| 0.7 | 2.9 | GO:0002501 | peptide antigen assembly with MHC protein complex(GO:0002501) |
| 0.7 | 2.2 | GO:0001923 | B-1 B cell differentiation(GO:0001923) |
| 0.7 | 2.1 | GO:0035752 | lysosomal lumen pH elevation(GO:0035752) |
| 0.7 | 2.0 | GO:0050653 | chondroitin sulfate proteoglycan biosynthetic process, polysaccharide chain biosynthetic process(GO:0050653) |
| 0.7 | 2.6 | GO:0030200 | heparan sulfate proteoglycan catabolic process(GO:0030200) |
| 0.6 | 5.8 | GO:2000587 | negative regulation of platelet-derived growth factor receptor-beta signaling pathway(GO:2000587) |
| 0.6 | 4.4 | GO:0061198 | fungiform papilla formation(GO:0061198) |
| 0.6 | 2.4 | GO:0021557 | optic cup structural organization(GO:0003409) oculomotor nerve development(GO:0021557) oculomotor nerve morphogenesis(GO:0021622) oculomotor nerve formation(GO:0021623) |
| 0.6 | 1.8 | GO:0038178 | complement component C5a signaling pathway(GO:0038178) |
| 0.6 | 45.5 | GO:0006910 | phagocytosis, recognition(GO:0006910) |
| 0.6 | 6.0 | GO:0072718 | response to cisplatin(GO:0072718) |
| 0.6 | 4.1 | GO:2000491 | positive regulation of hepatic stellate cell activation(GO:2000491) |
| 0.6 | 1.7 | GO:1902524 | positive regulation of protein K48-linked ubiquitination(GO:1902524) |
| 0.6 | 2.9 | GO:0003065 | positive regulation of heart rate by epinephrine(GO:0003065) |
| 0.6 | 2.9 | GO:1903904 | negative regulation of establishment of T cell polarity(GO:1903904) negative regulation of Rho guanyl-nucleotide exchange factor activity(GO:2001107) |
| 0.5 | 1.6 | GO:0007538 | primary sex determination(GO:0007538) |
| 0.5 | 3.2 | GO:0018916 | nitrobenzene metabolic process(GO:0018916) |
| 0.5 | 1.6 | GO:0002415 | immunoglobulin transcytosis in epithelial cells mediated by polymeric immunoglobulin receptor(GO:0002415) |
| 0.5 | 1.5 | GO:2000118 | regulation of sodium-dependent phosphate transport(GO:2000118) |
| 0.5 | 5.1 | GO:0006621 | protein retention in ER lumen(GO:0006621) |
| 0.5 | 2.3 | GO:0046642 | negative regulation of alpha-beta T cell proliferation(GO:0046642) |
| 0.4 | 14.0 | GO:0016338 | calcium-independent cell-cell adhesion via plasma membrane cell-adhesion molecules(GO:0016338) |
| 0.4 | 3.0 | GO:0032218 | riboflavin transport(GO:0032218) |
| 0.4 | 2.5 | GO:2001206 | positive regulation of osteoclast development(GO:2001206) |
| 0.4 | 2.1 | GO:0042374 | phylloquinone metabolic process(GO:0042374) phylloquinone catabolic process(GO:0042376) quinone catabolic process(GO:1901662) |
| 0.4 | 6.6 | GO:0051256 | mitotic spindle midzone assembly(GO:0051256) |
| 0.4 | 1.6 | GO:0010841 | positive regulation of circadian sleep/wake cycle, wakefulness(GO:0010841) retrograde trans-synaptic signaling by soluble gas(GO:0098923) trans-synaptic signaling by soluble gas(GO:0099543) |
| 0.4 | 6.1 | GO:0035970 | peptidyl-threonine dephosphorylation(GO:0035970) |
| 0.4 | 38.5 | GO:0006958 | complement activation, classical pathway(GO:0006958) |
| 0.4 | 2.4 | GO:0098707 | ferrous iron import into cell(GO:0097460) ferrous iron import across plasma membrane(GO:0098707) |
| 0.4 | 2.3 | GO:0003164 | His-Purkinje system development(GO:0003164) |
| 0.4 | 1.1 | GO:0061536 | glycine secretion(GO:0061536) glycine secretion, neurotransmission(GO:0061537) |
| 0.3 | 2.4 | GO:0002925 | positive regulation of humoral immune response mediated by circulating immunoglobulin(GO:0002925) |
| 0.3 | 1.4 | GO:1904154 | positive regulation of retrograde protein transport, ER to cytosol(GO:1904154) |
| 0.3 | 0.7 | GO:2000295 | regulation of hydrogen peroxide catabolic process(GO:2000295) negative regulation of hydrogen peroxide catabolic process(GO:2000296) |
| 0.3 | 8.7 | GO:0071243 | cellular response to arsenic-containing substance(GO:0071243) |
| 0.3 | 0.7 | GO:0060769 | positive regulation of epithelial cell proliferation involved in prostate gland development(GO:0060769) |
| 0.3 | 1.0 | GO:0036304 | umbilical cord morphogenesis(GO:0036304) umbilical cord development(GO:0061027) |
| 0.3 | 2.9 | GO:0019375 | galactosylceramide biosynthetic process(GO:0006682) galactolipid biosynthetic process(GO:0019375) |
| 0.3 | 23.6 | GO:0033275 | muscle filament sliding(GO:0030049) actin-myosin filament sliding(GO:0033275) |
| 0.3 | 1.8 | GO:0033133 | positive regulation of glucokinase activity(GO:0033133) |
| 0.3 | 5.9 | GO:0071712 | ER-associated misfolded protein catabolic process(GO:0071712) |
| 0.3 | 2.4 | GO:0007256 | activation of JNKK activity(GO:0007256) |
| 0.3 | 1.4 | GO:2000857 | positive regulation of mineralocorticoid secretion(GO:2000857) positive regulation of aldosterone secretion(GO:2000860) |
| 0.3 | 2.7 | GO:0070836 | caveola assembly(GO:0070836) |
| 0.3 | 0.8 | GO:0098974 | postsynaptic actin cytoskeleton organization(GO:0098974) |
| 0.3 | 2.4 | GO:0007598 | blood coagulation, extrinsic pathway(GO:0007598) |
| 0.3 | 2.3 | GO:0060088 | auditory receptor cell stereocilium organization(GO:0060088) |
| 0.2 | 3.1 | GO:0006107 | oxaloacetate metabolic process(GO:0006107) |
| 0.2 | 3.1 | GO:0042407 | cristae formation(GO:0042407) |
| 0.2 | 3.4 | GO:0043619 | regulation of transcription from RNA polymerase II promoter in response to oxidative stress(GO:0043619) |
| 0.2 | 1.0 | GO:1902283 | negative regulation of primary amine oxidase activity(GO:1902283) |
| 0.2 | 1.1 | GO:2000320 | negative regulation of T-helper 17 type immune response(GO:2000317) negative regulation of T-helper 17 cell differentiation(GO:2000320) |
| 0.2 | 5.0 | GO:0000185 | activation of MAPKKK activity(GO:0000185) |
| 0.2 | 0.6 | GO:0006117 | acetaldehyde metabolic process(GO:0006117) |
| 0.2 | 4.9 | GO:0016180 | snRNA processing(GO:0016180) |
| 0.2 | 0.6 | GO:0002378 | immunoglobulin biosynthetic process(GO:0002378) |
| 0.2 | 2.1 | GO:0032532 | regulation of microvillus length(GO:0032532) |
| 0.2 | 0.8 | GO:0000415 | negative regulation of histone H3-K36 methylation(GO:0000415) |
| 0.2 | 1.6 | GO:0015886 | heme transport(GO:0015886) |
| 0.2 | 6.1 | GO:0043277 | apoptotic cell clearance(GO:0043277) |
| 0.2 | 6.3 | GO:0051569 | regulation of histone H3-K4 methylation(GO:0051569) |
| 0.2 | 2.1 | GO:0035414 | negative regulation of catenin import into nucleus(GO:0035414) |
| 0.2 | 4.0 | GO:0051568 | histone H3-K4 methylation(GO:0051568) |
| 0.2 | 3.6 | GO:2000052 | positive regulation of non-canonical Wnt signaling pathway(GO:2000052) |
| 0.2 | 3.2 | GO:0019511 | peptidyl-proline hydroxylation(GO:0019511) |
| 0.2 | 1.9 | GO:0032808 | lacrimal gland development(GO:0032808) |
| 0.2 | 6.2 | GO:0007176 | regulation of epidermal growth factor-activated receptor activity(GO:0007176) |
| 0.2 | 0.9 | GO:0030263 | apoptotic chromosome condensation(GO:0030263) |
| 0.2 | 1.2 | GO:0032020 | ISG15-protein conjugation(GO:0032020) |
| 0.2 | 0.5 | GO:2000157 | regulation of protein K48-linked deubiquitination(GO:1903093) negative regulation of protein K48-linked deubiquitination(GO:1903094) negative regulation of ubiquitin-specific protease activity(GO:2000157) |
| 0.1 | 0.7 | GO:0001969 | activation of membrane attack complex(GO:0001905) regulation of activation of membrane attack complex(GO:0001969) negative regulation of activation of membrane attack complex(GO:0001971) |
| 0.1 | 1.6 | GO:0006268 | DNA unwinding involved in DNA replication(GO:0006268) |
| 0.1 | 1.8 | GO:0046784 | viral mRNA export from host cell nucleus(GO:0046784) |
| 0.1 | 0.6 | GO:1990637 | response to prolactin(GO:1990637) regulation of ovarian follicle development(GO:2000354) |
| 0.1 | 0.7 | GO:0038165 | oncostatin-M-mediated signaling pathway(GO:0038165) leukemia inhibitory factor signaling pathway(GO:0048861) |
| 0.1 | 2.8 | GO:0030277 | maintenance of gastrointestinal epithelium(GO:0030277) |
| 0.1 | 0.5 | GO:1903899 | regulation of endoplasmic reticulum tubular network organization(GO:1903371) positive regulation of PERK-mediated unfolded protein response(GO:1903899) |
| 0.1 | 1.6 | GO:0060372 | regulation of atrial cardiac muscle cell membrane repolarization(GO:0060372) |
| 0.1 | 1.8 | GO:0035372 | protein localization to microtubule(GO:0035372) |
| 0.1 | 0.5 | GO:0032621 | interleukin-18 production(GO:0032621) |
| 0.1 | 0.5 | GO:0086048 | membrane depolarization during bundle of His cell action potential(GO:0086048) |
| 0.1 | 1.6 | GO:0002115 | store-operated calcium entry(GO:0002115) |
| 0.1 | 1.5 | GO:0000733 | DNA strand renaturation(GO:0000733) |
| 0.1 | 4.0 | GO:0006266 | DNA ligation(GO:0006266) telomere maintenance via semi-conservative replication(GO:0032201) |
| 0.1 | 2.7 | GO:0006853 | carnitine shuttle(GO:0006853) |
| 0.1 | 5.3 | GO:0006308 | DNA catabolic process(GO:0006308) |
| 0.1 | 1.2 | GO:0043569 | negative regulation of insulin-like growth factor receptor signaling pathway(GO:0043569) |
| 0.1 | 6.4 | GO:0043268 | positive regulation of potassium ion transport(GO:0043268) |
| 0.1 | 2.5 | GO:0032515 | negative regulation of phosphoprotein phosphatase activity(GO:0032515) |
| 0.1 | 1.6 | GO:0048262 | determination of dorsal/ventral asymmetry(GO:0048262) |
| 0.1 | 1.6 | GO:1902659 | regulation of glucose mediated signaling pathway(GO:1902659) |
| 0.1 | 3.4 | GO:1901522 | positive regulation of transcription from RNA polymerase II promoter involved in cellular response to chemical stimulus(GO:1901522) |
| 0.1 | 16.1 | GO:1990830 | response to leukemia inhibitory factor(GO:1990823) cellular response to leukemia inhibitory factor(GO:1990830) |
| 0.1 | 0.5 | GO:0050915 | sensory perception of sour taste(GO:0050915) |
| 0.1 | 1.9 | GO:0050869 | negative regulation of B cell activation(GO:0050869) |
| 0.1 | 0.6 | GO:0060054 | positive regulation of epithelial cell proliferation involved in wound healing(GO:0060054) |
| 0.1 | 0.9 | GO:0060613 | fat pad development(GO:0060613) |
| 0.1 | 2.7 | GO:0090162 | establishment of epithelial cell polarity(GO:0090162) |
| 0.1 | 6.2 | GO:0006120 | mitochondrial electron transport, NADH to ubiquinone(GO:0006120) |
| 0.1 | 0.4 | GO:0043091 | L-arginine import(GO:0043091) arginine import(GO:0090467) L-arginine transport(GO:1902023) |
| 0.1 | 17.0 | GO:0001837 | epithelial to mesenchymal transition(GO:0001837) |
| 0.1 | 1.3 | GO:0043983 | histone H4-K12 acetylation(GO:0043983) |
| 0.1 | 10.0 | GO:0032945 | negative regulation of mononuclear cell proliferation(GO:0032945) negative regulation of lymphocyte proliferation(GO:0050672) |
| 0.1 | 14.1 | GO:0030968 | endoplasmic reticulum unfolded protein response(GO:0030968) |
| 0.1 | 1.6 | GO:0045662 | negative regulation of myoblast differentiation(GO:0045662) |
| 0.1 | 3.2 | GO:0030252 | growth hormone secretion(GO:0030252) |
| 0.1 | 2.6 | GO:0090141 | positive regulation of mitochondrial fission(GO:0090141) |
| 0.1 | 1.2 | GO:0003348 | cardiac endothelial cell differentiation(GO:0003348) endocardial cell differentiation(GO:0060956) |
| 0.1 | 0.7 | GO:0061088 | regulation of sequestering of zinc ion(GO:0061088) |
| 0.1 | 1.7 | GO:0018345 | protein palmitoylation(GO:0018345) |
| 0.1 | 0.7 | GO:0032262 | pyrimidine ribonucleotide salvage(GO:0010138) pyrimidine nucleotide salvage(GO:0032262) UMP salvage(GO:0044206) |
| 0.1 | 0.9 | GO:0030238 | male sex determination(GO:0030238) |
| 0.1 | 1.3 | GO:0006750 | glutathione biosynthetic process(GO:0006750) |
| 0.1 | 1.5 | GO:0070493 | thrombin receptor signaling pathway(GO:0070493) |
| 0.1 | 4.1 | GO:0045652 | regulation of megakaryocyte differentiation(GO:0045652) |
| 0.1 | 1.4 | GO:0017121 | phospholipid scrambling(GO:0017121) |
| 0.1 | 1.3 | GO:0035518 | histone H2A monoubiquitination(GO:0035518) |
| 0.1 | 3.0 | GO:0042438 | melanin biosynthetic process(GO:0042438) |
| 0.1 | 0.9 | GO:0005984 | disaccharide metabolic process(GO:0005984) |
| 0.1 | 0.3 | GO:0039516 | modulation by virus of host molecular function(GO:0039506) suppression by virus of host molecular function(GO:0039507) suppression by virus of host catalytic activity(GO:0039513) modulation by virus of host catalytic activity(GO:0039516) suppression by virus of host cysteine-type endopeptidase activity involved in apoptotic process(GO:0039650) negative regulation by symbiont of host catalytic activity(GO:0052053) negative regulation by symbiont of host molecular function(GO:0052056) modulation by symbiont of host catalytic activity(GO:0052148) |
| 0.1 | 3.1 | GO:0035904 | aorta development(GO:0035904) |
| 0.1 | 0.2 | GO:0002296 | T-helper 1 cell lineage commitment(GO:0002296) |
| 0.1 | 0.7 | GO:0001731 | formation of translation preinitiation complex(GO:0001731) |
| 0.1 | 0.5 | GO:2000189 | positive regulation of cholesterol homeostasis(GO:2000189) |
| 0.1 | 4.7 | GO:0042100 | B cell proliferation(GO:0042100) |
| 0.1 | 0.7 | GO:0090400 | stress-induced premature senescence(GO:0090400) |
| 0.1 | 1.1 | GO:0045793 | positive regulation of cell size(GO:0045793) |
| 0.1 | 1.6 | GO:0006359 | regulation of transcription from RNA polymerase III promoter(GO:0006359) |
| 0.1 | 2.7 | GO:0018208 | protein peptidyl-prolyl isomerization(GO:0000413) peptidyl-proline modification(GO:0018208) |
| 0.1 | 3.8 | GO:0051865 | protein autoubiquitination(GO:0051865) |
| 0.1 | 0.6 | GO:0042985 | negative regulation of amyloid precursor protein biosynthetic process(GO:0042985) |
| 0.1 | 0.2 | GO:1904352 | positive regulation of protein catabolic process in the vacuole(GO:1904352) |
| 0.1 | 1.5 | GO:0045730 | respiratory burst(GO:0045730) |
| 0.1 | 0.2 | GO:0000414 | regulation of histone H3-K36 methylation(GO:0000414) |
| 0.1 | 0.3 | GO:0010265 | SCF complex assembly(GO:0010265) |
| 0.1 | 2.9 | GO:0015949 | nucleobase-containing small molecule interconversion(GO:0015949) |
| 0.1 | 2.7 | GO:0016266 | O-glycan processing(GO:0016266) |
| 0.1 | 0.3 | GO:1904627 | response to phorbol 13-acetate 12-myristate(GO:1904627) cellular response to phorbol 13-acetate 12-myristate(GO:1904628) negative regulation of cellular senescence(GO:2000773) |
| 0.0 | 0.4 | GO:0042373 | vitamin K metabolic process(GO:0042373) |
| 0.0 | 2.1 | GO:0032467 | positive regulation of cytokinesis(GO:0032467) |
| 0.0 | 0.5 | GO:0035095 | behavioral response to nicotine(GO:0035095) |
| 0.0 | 0.9 | GO:0090005 | negative regulation of establishment of protein localization to plasma membrane(GO:0090005) |
| 0.0 | 0.7 | GO:0043248 | proteasome assembly(GO:0043248) |
| 0.0 | 4.2 | GO:0006334 | nucleosome assembly(GO:0006334) |
| 0.0 | 0.9 | GO:0019373 | epoxygenase P450 pathway(GO:0019373) |
| 0.0 | 1.3 | GO:0000188 | inactivation of MAPK activity(GO:0000188) |
| 0.0 | 4.0 | GO:0002377 | immunoglobulin production(GO:0002377) |
| 0.0 | 3.5 | GO:0051289 | protein homotetramerization(GO:0051289) |
| 0.0 | 0.2 | GO:1904398 | regulation of synaptic growth at neuromuscular junction(GO:0008582) positive regulation of neuromuscular junction development(GO:1904398) |
| 0.0 | 0.2 | GO:0014010 | Schwann cell proliferation(GO:0014010) |
| 0.0 | 2.5 | GO:0002479 | antigen processing and presentation of exogenous peptide antigen via MHC class I, TAP-dependent(GO:0002479) |
| 0.0 | 0.4 | GO:0034447 | very-low-density lipoprotein particle clearance(GO:0034447) |
| 0.0 | 0.3 | GO:0086024 | adrenergic receptor signaling pathway involved in positive regulation of heart rate(GO:0086024) |
| 0.0 | 0.9 | GO:0048147 | negative regulation of fibroblast proliferation(GO:0048147) |
| 0.0 | 1.2 | GO:0006409 | tRNA export from nucleus(GO:0006409) tRNA-containing ribonucleoprotein complex export from nucleus(GO:0071431) |
| 0.0 | 0.5 | GO:0071353 | cellular response to interleukin-4(GO:0071353) |
| 0.0 | 0.5 | GO:0097150 | neuronal stem cell population maintenance(GO:0097150) |
| 0.0 | 2.7 | GO:0001676 | long-chain fatty acid metabolic process(GO:0001676) |
| 0.0 | 4.6 | GO:0006909 | phagocytosis(GO:0006909) |
| 0.0 | 1.1 | GO:0000186 | activation of MAPKK activity(GO:0000186) |
| 0.0 | 1.7 | GO:0071357 | type I interferon signaling pathway(GO:0060337) cellular response to type I interferon(GO:0071357) |
| 0.0 | 0.7 | GO:0045604 | regulation of epidermal cell differentiation(GO:0045604) |
| 0.0 | 1.3 | GO:1902017 | regulation of cilium assembly(GO:1902017) |
| 0.0 | 1.2 | GO:0048678 | response to axon injury(GO:0048678) |
| 0.0 | 0.8 | GO:1901998 | toxin transport(GO:1901998) |
| 0.0 | 0.0 | GO:0061184 | canonical Wnt signaling pathway involved in negative regulation of apoptotic process(GO:0044336) dermatome development(GO:0061054) regulation of dermatome development(GO:0061183) positive regulation of dermatome development(GO:0061184) |
| 0.0 | 2.8 | GO:0030100 | regulation of endocytosis(GO:0030100) |
| 0.0 | 0.1 | GO:0010814 | substance P catabolic process(GO:0010814) calcitonin catabolic process(GO:0010816) endothelin maturation(GO:0034959) |
| 0.0 | 0.3 | GO:0034384 | high-density lipoprotein particle clearance(GO:0034384) |
| 0.0 | 0.1 | GO:0048096 | chromatin-mediated maintenance of transcription(GO:0048096) |
| 0.0 | 0.3 | GO:0007216 | G-protein coupled glutamate receptor signaling pathway(GO:0007216) |
| 0.0 | 0.2 | GO:0043984 | histone H4-K16 acetylation(GO:0043984) |
| 0.0 | 0.6 | GO:0042733 | embryonic digit morphogenesis(GO:0042733) |
| 0.0 | 1.0 | GO:0048704 | embryonic skeletal system morphogenesis(GO:0048704) |
| 0.0 | 0.4 | GO:0070423 | nucleotide-binding oligomerization domain containing signaling pathway(GO:0070423) |
| 0.0 | 0.3 | GO:0030206 | chondroitin sulfate biosynthetic process(GO:0030206) |
| 0.0 | 0.9 | GO:0006369 | termination of RNA polymerase II transcription(GO:0006369) |
| 0.0 | 2.4 | GO:0051170 | nuclear import(GO:0051170) |
| 0.0 | 0.5 | GO:0006749 | glutathione metabolic process(GO:0006749) |
| 0.0 | 0.0 | GO:0042095 | interferon-gamma biosynthetic process(GO:0042095) regulation of interferon-gamma biosynthetic process(GO:0045072) positive regulation of interferon-gamma biosynthetic process(GO:0045078) |
Gene overrepresentation in cellular component category:
| Log-likelihood per target | Total log-likelihood | Term | Description |
|---|---|---|---|
| 2.6 | 10.6 | GO:0071749 | IgA immunoglobulin complex(GO:0071745) IgA immunoglobulin complex, circulating(GO:0071746) monomeric IgA immunoglobulin complex(GO:0071748) polymeric IgA immunoglobulin complex(GO:0071749) secretory IgA immunoglobulin complex(GO:0071751) |
| 1.6 | 6.2 | GO:0070435 | Shc-EGFR complex(GO:0070435) |
| 1.2 | 3.5 | GO:0045323 | interleukin-1 receptor complex(GO:0045323) |
| 1.0 | 3.1 | GO:0043260 | laminin-11 complex(GO:0043260) |
| 0.9 | 2.8 | GO:0034515 | proteasome storage granule(GO:0034515) |
| 0.8 | 41.1 | GO:0042571 | immunoglobulin complex, circulating(GO:0042571) |
| 0.8 | 4.0 | GO:0043625 | delta DNA polymerase complex(GO:0043625) |
| 0.8 | 3.9 | GO:0001652 | dense fibrillar component(GO:0001651) granular component(GO:0001652) |
| 0.7 | 6.5 | GO:1990630 | IRE1-RACK1-PP2A complex(GO:1990630) |
| 0.6 | 12.1 | GO:0005861 | troponin complex(GO:0005861) |
| 0.6 | 2.8 | GO:0031523 | Myb complex(GO:0031523) |
| 0.5 | 3.0 | GO:0061617 | MICOS complex(GO:0061617) |
| 0.5 | 2.9 | GO:0042824 | MHC class I peptide loading complex(GO:0042824) |
| 0.5 | 7.8 | GO:0034709 | methylosome(GO:0034709) |
| 0.4 | 4.9 | GO:0032039 | integrator complex(GO:0032039) |
| 0.4 | 2.5 | GO:0097013 | phagocytic vesicle lumen(GO:0097013) |
| 0.4 | 1.9 | GO:0019814 | immunoglobulin complex(GO:0019814) |
| 0.3 | 4.5 | GO:0005862 | muscle thin filament tropomyosin(GO:0005862) |
| 0.3 | 1.2 | GO:1990876 | cytoplasmic side of nuclear pore(GO:1990876) |
| 0.3 | 4.0 | GO:0048188 | Set1C/COMPASS complex(GO:0048188) |
| 0.3 | 2.9 | GO:0016593 | Cdc73/Paf1 complex(GO:0016593) |
| 0.3 | 11.5 | GO:0032420 | stereocilium(GO:0032420) |
| 0.2 | 9.8 | GO:0005859 | muscle myosin complex(GO:0005859) |
| 0.2 | 2.5 | GO:0033180 | proton-transporting V-type ATPase, V1 domain(GO:0033180) |
| 0.2 | 1.4 | GO:0005784 | Sec61 translocon complex(GO:0005784) translocon complex(GO:0071256) |
| 0.2 | 3.4 | GO:0034663 | endoplasmic reticulum chaperone complex(GO:0034663) |
| 0.2 | 4.4 | GO:0016580 | Sin3 complex(GO:0016580) |
| 0.2 | 0.6 | GO:0035525 | NF-kappaB p50/p65 complex(GO:0035525) |
| 0.2 | 3.6 | GO:0034098 | VCP-NPL4-UFD1 AAA ATPase complex(GO:0034098) |
| 0.2 | 5.0 | GO:0031362 | anchored component of external side of plasma membrane(GO:0031362) |
| 0.2 | 1.8 | GO:0000347 | THO complex(GO:0000347) THO complex part of transcription export complex(GO:0000445) |
| 0.2 | 6.0 | GO:0031312 | extrinsic component of organelle membrane(GO:0031312) |
| 0.2 | 1.5 | GO:0032010 | phagolysosome(GO:0032010) |
| 0.2 | 5.5 | GO:0000421 | autophagosome membrane(GO:0000421) |
| 0.2 | 4.0 | GO:0042599 | lamellar body(GO:0042599) |
| 0.2 | 11.2 | GO:0030964 | mitochondrial respiratory chain complex I(GO:0005747) NADH dehydrogenase complex(GO:0030964) respiratory chain complex I(GO:0045271) |
| 0.2 | 0.7 | GO:0031838 | haptoglobin-hemoglobin complex(GO:0031838) |
| 0.2 | 2.4 | GO:1990712 | HFE-transferrin receptor complex(GO:1990712) |
| 0.2 | 15.2 | GO:0016328 | lateral plasma membrane(GO:0016328) |
| 0.1 | 2.5 | GO:0000164 | protein phosphatase type 1 complex(GO:0000164) |
| 0.1 | 2.2 | GO:0030663 | COPI-coated vesicle membrane(GO:0030663) |
| 0.1 | 9.9 | GO:0030670 | phagocytic vesicle membrane(GO:0030670) |
| 0.1 | 1.6 | GO:0017146 | NMDA selective glutamate receptor complex(GO:0017146) |
| 0.1 | 20.1 | GO:0016605 | PML body(GO:0016605) |
| 0.1 | 1.7 | GO:0001741 | XY body(GO:0001741) |
| 0.1 | 2.7 | GO:0031588 | nucleotide-activated protein kinase complex(GO:0031588) |
| 0.1 | 0.4 | GO:0035370 | UBC13-UEV1A complex(GO:0035370) |
| 0.1 | 15.8 | GO:0005793 | endoplasmic reticulum-Golgi intermediate compartment(GO:0005793) |
| 0.1 | 1.6 | GO:0042555 | MCM complex(GO:0042555) |
| 0.1 | 7.6 | GO:0045171 | intercellular bridge(GO:0045171) |
| 0.1 | 1.5 | GO:0005662 | DNA replication factor A complex(GO:0005662) |
| 0.1 | 1.1 | GO:0016342 | catenin complex(GO:0016342) |
| 0.1 | 5.3 | GO:0016459 | myosin complex(GO:0016459) |
| 0.1 | 7.9 | GO:0032580 | Golgi cisterna membrane(GO:0032580) |
| 0.1 | 0.9 | GO:0061574 | ASAP complex(GO:0061574) |
| 0.1 | 2.0 | GO:0031527 | filopodium membrane(GO:0031527) |
| 0.1 | 0.7 | GO:0097452 | GAIT complex(GO:0097452) |
| 0.1 | 11.8 | GO:0072562 | blood microparticle(GO:0072562) |
| 0.1 | 8.9 | GO:0035578 | azurophil granule lumen(GO:0035578) |
| 0.1 | 6.3 | GO:0000502 | proteasome complex(GO:0000502) |
| 0.1 | 4.2 | GO:0005771 | multivesicular body(GO:0005771) |
| 0.1 | 2.9 | GO:0005801 | cis-Golgi network(GO:0005801) |
| 0.1 | 1.9 | GO:0031307 | integral component of mitochondrial outer membrane(GO:0031307) |
| 0.1 | 0.4 | GO:0060091 | kinocilium(GO:0060091) |
| 0.1 | 0.6 | GO:0098554 | cytoplasmic side of endoplasmic reticulum membrane(GO:0098554) |
| 0.1 | 6.4 | GO:0005604 | basement membrane(GO:0005604) |
| 0.1 | 9.2 | GO:0032993 | protein-DNA complex(GO:0032993) |
| 0.1 | 3.8 | GO:0031093 | platelet alpha granule lumen(GO:0031093) |
| 0.0 | 5.7 | GO:0043202 | lysosomal lumen(GO:0043202) |
| 0.0 | 2.1 | GO:0097610 | cleavage furrow(GO:0032154) cell surface furrow(GO:0097610) |
| 0.0 | 2.4 | GO:0005902 | microvillus(GO:0005902) |
| 0.0 | 0.5 | GO:0033588 | Elongator holoenzyme complex(GO:0033588) |
| 0.0 | 2.7 | GO:0001725 | stress fiber(GO:0001725) contractile actin filament bundle(GO:0097517) |
| 0.0 | 7.6 | GO:0034774 | secretory granule lumen(GO:0034774) |
| 0.0 | 3.7 | GO:0005901 | caveola(GO:0005901) |
| 0.0 | 2.3 | GO:0005796 | Golgi lumen(GO:0005796) |
| 0.0 | 1.2 | GO:0008305 | integrin complex(GO:0008305) |
| 0.0 | 3.5 | GO:0035579 | specific granule membrane(GO:0035579) |
| 0.0 | 1.5 | GO:0045178 | basal part of cell(GO:0045178) |
| 0.0 | 0.8 | GO:0002102 | podosome(GO:0002102) |
| 0.0 | 0.2 | GO:0072487 | MSL complex(GO:0072487) |
| 0.0 | 5.0 | GO:0030667 | secretory granule membrane(GO:0030667) |
| 0.0 | 0.3 | GO:0000778 | condensed nuclear chromosome kinetochore(GO:0000778) |
| 0.0 | 1.2 | GO:0005881 | cytoplasmic microtubule(GO:0005881) |
| 0.0 | 0.1 | GO:0005960 | glycine cleavage complex(GO:0005960) |
| 0.0 | 0.5 | GO:0005892 | acetylcholine-gated channel complex(GO:0005892) |
| 0.0 | 3.4 | GO:0005741 | mitochondrial outer membrane(GO:0005741) |
| 0.0 | 0.4 | GO:0034362 | low-density lipoprotein particle(GO:0034362) |
| 0.0 | 0.1 | GO:0033093 | intrinsic component of endosome membrane(GO:0031302) intrinsic component of vacuolar membrane(GO:0031310) Weibel-Palade body(GO:0033093) |
| 0.0 | 0.3 | GO:0034364 | high-density lipoprotein particle(GO:0034364) |
| 0.0 | 0.1 | GO:0031233 | intrinsic component of external side of plasma membrane(GO:0031233) |
| 0.0 | 5.6 | GO:0031966 | mitochondrial membrane(GO:0031966) |
Gene overrepresentation in molecular function category:
| Log-likelihood per target | Total log-likelihood | Term | Description |
|---|---|---|---|
| 2.2 | 6.5 | GO:0008426 | protein kinase C inhibitor activity(GO:0008426) |
| 1.8 | 5.4 | GO:0008330 | protein tyrosine/threonine phosphatase activity(GO:0008330) |
| 1.8 | 10.5 | GO:0032038 | myosin II heavy chain binding(GO:0032038) |
| 1.7 | 5.1 | GO:0005046 | KDEL sequence binding(GO:0005046) |
| 1.7 | 5.1 | GO:0035662 | Toll-like receptor 4 binding(GO:0035662) |
| 1.3 | 7.8 | GO:0044020 | histone methyltransferase activity (H4-R3 specific)(GO:0044020) |
| 1.1 | 3.4 | GO:0061629 | RNA polymerase II sequence-specific DNA binding transcription factor binding(GO:0061629) |
| 1.0 | 4.2 | GO:0008823 | cupric reductase activity(GO:0008823) ferric-chelate reductase (NADPH) activity(GO:0052851) |
| 1.0 | 19.6 | GO:0050786 | RAGE receptor binding(GO:0050786) |
| 1.0 | 3.0 | GO:0033981 | D-dopachrome decarboxylase activity(GO:0033981) |
| 1.0 | 5.7 | GO:0017150 | tRNA dihydrouridine synthase activity(GO:0017150) |
| 0.9 | 7.3 | GO:0004111 | creatine kinase activity(GO:0004111) |
| 0.9 | 6.2 | GO:0048408 | epidermal growth factor binding(GO:0048408) |
| 0.9 | 12.1 | GO:0031014 | troponin T binding(GO:0031014) |
| 0.8 | 3.4 | GO:0004886 | 9-cis retinoic acid receptor activity(GO:0004886) |
| 0.8 | 4.9 | GO:0060961 | phospholipase D inhibitor activity(GO:0060961) |
| 0.8 | 22.9 | GO:0008301 | DNA binding, bending(GO:0008301) |
| 0.8 | 6.4 | GO:0052834 | inositol monophosphate 1-phosphatase activity(GO:0008934) inositol monophosphate 3-phosphatase activity(GO:0052832) inositol monophosphate 4-phosphatase activity(GO:0052833) inositol monophosphate phosphatase activity(GO:0052834) |
| 0.8 | 3.2 | GO:0019797 | procollagen-proline 3-dioxygenase activity(GO:0019797) |
| 0.8 | 2.4 | GO:0004998 | transferrin receptor activity(GO:0004998) |
| 0.8 | 45.5 | GO:0034987 | immunoglobulin receptor binding(GO:0034987) |
| 0.8 | 3.8 | GO:0043183 | vascular endothelial growth factor receptor 1 binding(GO:0043183) |
| 0.7 | 5.6 | GO:0071933 | Arp2/3 complex binding(GO:0071933) |
| 0.7 | 2.1 | GO:0000253 | 3-keto sterol reductase activity(GO:0000253) |
| 0.7 | 12.0 | GO:0035497 | cAMP response element binding(GO:0035497) |
| 0.7 | 6.5 | GO:0030292 | protein tyrosine kinase inhibitor activity(GO:0030292) |
| 0.6 | 2.5 | GO:0046933 | proton-transporting ATP synthase activity, rotational mechanism(GO:0046933) |
| 0.6 | 1.8 | GO:0004878 | complement component C5a receptor activity(GO:0004878) |
| 0.6 | 2.4 | GO:0004706 | JUN kinase kinase kinase activity(GO:0004706) |
| 0.6 | 2.8 | GO:0030197 | extracellular matrix constituent, lubricant activity(GO:0030197) |
| 0.5 | 9.4 | GO:0009931 | calcium-dependent protein serine/threonine kinase activity(GO:0009931) |
| 0.5 | 2.0 | GO:0098770 | FBXO family protein binding(GO:0098770) |
| 0.5 | 5.8 | GO:0004726 | non-membrane spanning protein tyrosine phosphatase activity(GO:0004726) |
| 0.4 | 3.1 | GO:0046912 | transferase activity, transferring acyl groups, acyl groups converted into alkyl on transfer(GO:0046912) |
| 0.4 | 3.0 | GO:0032217 | riboflavin transporter activity(GO:0032217) |
| 0.4 | 2.1 | GO:0008240 | tripeptidyl-peptidase activity(GO:0008240) |
| 0.4 | 2.9 | GO:0001849 | complement component C1q binding(GO:0001849) |
| 0.4 | 1.2 | GO:0098640 | integrin binding involved in cell-matrix adhesion(GO:0098640) |
| 0.4 | 1.6 | GO:0061769 | ribosylnicotinamide kinase activity(GO:0050262) ribosylnicotinate kinase activity(GO:0061769) |
| 0.4 | 2.0 | GO:0047238 | glucuronosyl-N-acetylgalactosaminyl-proteoglycan 4-beta-N-acetylgalactosaminyltransferase activity(GO:0047238) |
| 0.4 | 2.8 | GO:0004169 | dolichyl-phosphate-mannose-protein mannosyltransferase activity(GO:0004169) |
| 0.4 | 3.6 | GO:0036435 | K48-linked polyubiquitin binding(GO:0036435) |
| 0.3 | 2.4 | GO:0019863 | IgE binding(GO:0019863) |
| 0.3 | 5.7 | GO:0019864 | IgG binding(GO:0019864) |
| 0.3 | 2.5 | GO:0004865 | protein serine/threonine phosphatase inhibitor activity(GO:0004865) |
| 0.3 | 0.9 | GO:0032427 | GBD domain binding(GO:0032427) |
| 0.3 | 2.3 | GO:0086083 | cell adhesive protein binding involved in bundle of His cell-Purkinje myocyte communication(GO:0086083) |
| 0.3 | 4.4 | GO:0031078 | histone deacetylase activity (H3-K14 specific)(GO:0031078) NAD-dependent histone deacetylase activity (H3-K14 specific)(GO:0032041) |
| 0.3 | 3.0 | GO:0001135 | transcription factor activity, RNA polymerase II transcription factor recruiting(GO:0001135) |
| 0.3 | 0.8 | GO:0098918 | structural constituent of synapse(GO:0098918) structural constituent of postsynaptic actin cytoskeleton(GO:0098973) |
| 0.3 | 1.1 | GO:0015375 | glycine:sodium symporter activity(GO:0015375) |
| 0.3 | 3.2 | GO:0008607 | phosphorylase kinase regulator activity(GO:0008607) |
| 0.3 | 1.3 | GO:0003945 | N-acetyllactosamine synthase activity(GO:0003945) |
| 0.2 | 8.6 | GO:0005123 | death receptor binding(GO:0005123) |
| 0.2 | 1.2 | GO:0042296 | ISG15 transferase activity(GO:0042296) |
| 0.2 | 1.0 | GO:0035939 | microsatellite binding(GO:0035939) |
| 0.2 | 13.8 | GO:0016504 | peptidase activator activity(GO:0016504) |
| 0.2 | 1.0 | GO:0052596 | tryptamine:oxygen oxidoreductase (deaminating) activity(GO:0052593) aminoacetone:oxygen oxidoreductase(deaminating) activity(GO:0052594) aliphatic-amine oxidase activity(GO:0052595) phenethylamine:oxygen oxidoreductase (deaminating) activity(GO:0052596) |
| 0.2 | 5.8 | GO:0003756 | protein disulfide isomerase activity(GO:0003756) intramolecular oxidoreductase activity, transposing S-S bonds(GO:0016864) |
| 0.2 | 0.7 | GO:0004923 | leukemia inhibitory factor receptor activity(GO:0004923) |
| 0.2 | 3.5 | GO:0001094 | TFIID-class transcription factor binding(GO:0001094) |
| 0.2 | 1.6 | GO:0001165 | RNA polymerase I upstream control element sequence-specific DNA binding(GO:0001165) |
| 0.2 | 1.6 | GO:0086089 | voltage-gated potassium channel activity involved in atrial cardiac muscle cell action potential repolarization(GO:0086089) |
| 0.2 | 4.0 | GO:0042800 | histone methyltransferase activity (H3-K4 specific)(GO:0042800) |
| 0.2 | 6.2 | GO:0008574 | ATP-dependent microtubule motor activity, plus-end-directed(GO:0008574) |
| 0.2 | 0.9 | GO:0003831 | beta-N-acetylglucosaminylglycopeptide beta-1,4-galactosyltransferase activity(GO:0003831) |
| 0.2 | 3.5 | GO:0005149 | interleukin-1 receptor binding(GO:0005149) |
| 0.2 | 3.1 | GO:0016641 | oxidoreductase activity, acting on the CH-NH2 group of donors, oxygen as acceptor(GO:0016641) |
| 0.2 | 1.6 | GO:0015232 | heme transporter activity(GO:0015232) |
| 0.2 | 3.2 | GO:0043295 | glutathione binding(GO:0043295) |
| 0.2 | 6.0 | GO:0001965 | G-protein alpha-subunit binding(GO:0001965) |
| 0.2 | 1.6 | GO:0050694 | galactosylceramide sulfotransferase activity(GO:0001733) galactose 3-O-sulfotransferase activity(GO:0050694) |
| 0.2 | 36.1 | GO:0003823 | antigen binding(GO:0003823) |
| 0.2 | 1.4 | GO:0008454 | alpha-1,3-mannosylglycoprotein 4-beta-N-acetylglucosaminyltransferase activity(GO:0008454) |
| 0.2 | 2.7 | GO:0004653 | polypeptide N-acetylgalactosaminyltransferase activity(GO:0004653) |
| 0.2 | 2.9 | GO:0004017 | adenylate kinase activity(GO:0004017) |
| 0.2 | 1.5 | GO:0016176 | superoxide-generating NADPH oxidase activator activity(GO:0016176) |
| 0.2 | 3.5 | GO:0005522 | profilin binding(GO:0005522) |
| 0.2 | 1.6 | GO:0015279 | store-operated calcium channel activity(GO:0015279) |
| 0.2 | 3.0 | GO:0031957 | very long-chain fatty acid-CoA ligase activity(GO:0031957) |
| 0.2 | 3.0 | GO:0008349 | MAP kinase kinase kinase kinase activity(GO:0008349) |
| 0.2 | 2.9 | GO:0031702 | type 1 angiotensin receptor binding(GO:0031702) |
| 0.1 | 3.6 | GO:0005024 | transforming growth factor beta-activated receptor activity(GO:0005024) |
| 0.1 | 5.3 | GO:0030296 | protein tyrosine kinase activator activity(GO:0030296) |
| 0.1 | 5.2 | GO:0070577 | lysine-acetylated histone binding(GO:0070577) |
| 0.1 | 4.0 | GO:0003887 | DNA-directed DNA polymerase activity(GO:0003887) |
| 0.1 | 1.5 | GO:0036310 | annealing helicase activity(GO:0036310) |
| 0.1 | 0.4 | GO:0004090 | carbonyl reductase (NADPH) activity(GO:0004090) |
| 0.1 | 0.6 | GO:0071532 | ankyrin repeat binding(GO:0071532) |
| 0.1 | 2.6 | GO:0008484 | sulfuric ester hydrolase activity(GO:0008484) |
| 0.1 | 12.2 | GO:0004867 | serine-type endopeptidase inhibitor activity(GO:0004867) |
| 0.1 | 6.2 | GO:0050136 | NADH dehydrogenase (ubiquinone) activity(GO:0008137) NADH dehydrogenase (quinone) activity(GO:0050136) |
| 0.1 | 0.7 | GO:0043237 | laminin-1 binding(GO:0043237) |
| 0.1 | 2.9 | GO:0000993 | RNA polymerase II core binding(GO:0000993) |
| 0.1 | 1.1 | GO:0034713 | type I transforming growth factor beta receptor binding(GO:0034713) |
| 0.1 | 2.7 | GO:0005528 | macrolide binding(GO:0005527) FK506 binding(GO:0005528) |
| 0.1 | 2.7 | GO:0050321 | tau-protein kinase activity(GO:0050321) |
| 0.1 | 3.4 | GO:0043027 | cysteine-type endopeptidase inhibitor activity involved in apoptotic process(GO:0043027) |
| 0.1 | 1.8 | GO:0008327 | methyl-CpG binding(GO:0008327) |
| 0.1 | 2.2 | GO:0050811 | GABA receptor binding(GO:0050811) |
| 0.1 | 0.9 | GO:0004727 | prenylated protein tyrosine phosphatase activity(GO:0004727) |
| 0.1 | 2.7 | GO:0070300 | phosphatidic acid binding(GO:0070300) |
| 0.1 | 1.6 | GO:0042043 | neurexin family protein binding(GO:0042043) |
| 0.1 | 2.7 | GO:0004709 | MAP kinase kinase kinase activity(GO:0004709) |
| 0.1 | 1.7 | GO:0019707 | protein-cysteine S-palmitoyltransferase activity(GO:0019706) protein-cysteine S-acyltransferase activity(GO:0019707) |
| 0.1 | 1.4 | GO:0017128 | phospholipid scramblase activity(GO:0017128) |
| 0.1 | 2.3 | GO:0005031 | tumor necrosis factor-activated receptor activity(GO:0005031) death receptor activity(GO:0005035) |
| 0.1 | 1.2 | GO:0005049 | nuclear export signal receptor activity(GO:0005049) |
| 0.1 | 1.5 | GO:0035256 | G-protein coupled glutamate receptor binding(GO:0035256) |
| 0.1 | 1.3 | GO:0016805 | dipeptidase activity(GO:0016805) |
| 0.1 | 3.7 | GO:0001205 | transcriptional activator activity, RNA polymerase II distal enhancer sequence-specific binding(GO:0001205) |
| 0.1 | 9.0 | GO:0001085 | RNA polymerase II transcription factor binding(GO:0001085) |
| 0.1 | 1.9 | GO:0000983 | transcription factor activity, RNA polymerase II core promoter sequence-specific(GO:0000983) |
| 0.1 | 0.5 | GO:0060002 | plus-end directed microfilament motor activity(GO:0060002) |
| 0.1 | 3.2 | GO:0008138 | protein tyrosine/serine/threonine phosphatase activity(GO:0008138) |
| 0.1 | 2.8 | GO:0050699 | WW domain binding(GO:0050699) |
| 0.1 | 6.9 | GO:0000979 | RNA polymerase II core promoter sequence-specific DNA binding(GO:0000979) |
| 0.1 | 0.4 | GO:0036312 | phosphatidylinositol 3-kinase regulatory subunit binding(GO:0036312) |
| 0.1 | 2.3 | GO:0004364 | glutathione transferase activity(GO:0004364) |
| 0.1 | 2.6 | GO:0005484 | SNAP receptor activity(GO:0005484) |
| 0.1 | 2.1 | GO:0070063 | RNA polymerase binding(GO:0070063) |
| 0.1 | 0.3 | GO:0034481 | chondroitin sulfotransferase activity(GO:0034481) |
| 0.1 | 0.4 | GO:0044323 | retinoic acid-responsive element binding(GO:0044323) |
| 0.1 | 2.1 | GO:0003785 | actin monomer binding(GO:0003785) |
| 0.1 | 1.4 | GO:0042288 | MHC class I protein binding(GO:0042288) |
| 0.1 | 0.9 | GO:0043548 | phosphatidylinositol 3-kinase binding(GO:0043548) |
| 0.1 | 1.0 | GO:0008392 | arachidonic acid monooxygenase activity(GO:0008391) arachidonic acid epoxygenase activity(GO:0008392) |
| 0.1 | 4.2 | GO:0004536 | deoxyribonuclease activity(GO:0004536) |
| 0.1 | 0.4 | GO:0030229 | very-low-density lipoprotein particle receptor activity(GO:0030229) |
| 0.0 | 4.2 | GO:0019003 | GDP binding(GO:0019003) |
| 0.0 | 1.6 | GO:0004003 | ATP-dependent DNA helicase activity(GO:0004003) |
| 0.0 | 0.5 | GO:0042834 | peptidoglycan binding(GO:0042834) |
| 0.0 | 0.3 | GO:0030492 | hemoglobin binding(GO:0030492) |
| 0.0 | 0.5 | GO:0008527 | taste receptor activity(GO:0008527) |
| 0.0 | 0.4 | GO:0005384 | manganese ion transmembrane transporter activity(GO:0005384) |
| 0.0 | 0.7 | GO:0005385 | zinc ion transmembrane transporter activity(GO:0005385) |
| 0.0 | 6.6 | GO:0019887 | protein kinase regulator activity(GO:0019887) |
| 0.0 | 0.2 | GO:0003998 | acylphosphatase activity(GO:0003998) |
| 0.0 | 0.1 | GO:0022865 | transmembrane electron transfer carrier(GO:0022865) |
| 0.0 | 0.5 | GO:0004467 | long-chain fatty acid-CoA ligase activity(GO:0004467) decanoate--CoA ligase activity(GO:0102391) |
| 0.0 | 3.1 | GO:0008307 | structural constituent of muscle(GO:0008307) |
| 0.0 | 3.1 | GO:0051219 | phosphoprotein binding(GO:0051219) |
| 0.0 | 0.7 | GO:0001848 | complement binding(GO:0001848) |
| 0.0 | 0.5 | GO:0005537 | mannose binding(GO:0005537) |
| 0.0 | 4.4 | GO:0044325 | ion channel binding(GO:0044325) |
| 0.0 | 0.5 | GO:0017056 | structural constituent of nuclear pore(GO:0017056) |
| 0.0 | 2.2 | GO:0051087 | chaperone binding(GO:0051087) |
| 0.0 | 0.1 | GO:0047184 | 1-acylglycerophosphocholine O-acyltransferase activity(GO:0047184) |
| 0.0 | 1.9 | GO:0003707 | steroid hormone receptor activity(GO:0003707) |
| 0.0 | 0.5 | GO:0022848 | acetylcholine-gated cation channel activity(GO:0022848) |
| 0.0 | 2.0 | GO:0008565 | protein transporter activity(GO:0008565) |
| 0.0 | 0.2 | GO:0033691 | sialic acid binding(GO:0033691) |
| 0.0 | 0.1 | GO:0034235 | GPI anchor binding(GO:0034235) |
| 0.0 | 0.1 | GO:0016638 | oxidoreductase activity, acting on the CH-NH2 group of donors(GO:0016638) |
| 0.0 | 0.9 | GO:0008026 | ATP-dependent helicase activity(GO:0008026) purine NTP-dependent helicase activity(GO:0070035) |
| 0.0 | 1.2 | GO:0101005 | thiol-dependent ubiquitinyl hydrolase activity(GO:0036459) ubiquitinyl hydrolase activity(GO:0101005) |
| 0.0 | 0.2 | GO:0031404 | chloride ion binding(GO:0031404) |
| 0.0 | 0.1 | GO:0004873 | asialoglycoprotein receptor activity(GO:0004873) |
| 0.0 | 1.1 | GO:0051082 | unfolded protein binding(GO:0051082) |
| 0.0 | 0.5 | GO:0030374 | ligand-dependent nuclear receptor transcription coactivator activity(GO:0030374) |
Gene overrepresentation in curated gene sets: canonical pathways category:
| Log-likelihood per target | Total log-likelihood | Term | Description |
|---|---|---|---|
| 0.4 | 23.0 | ST P38 MAPK PATHWAY | p38 MAPK Pathway |
| 0.3 | 3.9 | PID LYMPH ANGIOGENESIS PATHWAY | VEGFR3 signaling in lymphatic endothelium |
| 0.3 | 15.9 | PID IL3 PATHWAY | IL3-mediated signaling events |
| 0.3 | 9.0 | PID TOLL ENDOGENOUS PATHWAY | Endogenous TLR signaling |
| 0.2 | 3.8 | PID VEGF VEGFR PATHWAY | VEGF and VEGFR signaling network |
| 0.2 | 10.4 | PID IL8 CXCR2 PATHWAY | IL8- and CXCR2-mediated signaling events |
| 0.2 | 8.5 | PID PRL SIGNALING EVENTS PATHWAY | Signaling events mediated by PRL |
| 0.2 | 3.1 | PID INTEGRIN4 PATHWAY | Alpha6 beta4 integrin-ligand interactions |
| 0.1 | 14.4 | PID RB 1PATHWAY | Regulation of retinoblastoma protein |
| 0.1 | 1.7 | ST TYPE I INTERFERON PATHWAY | Type I Interferon (alpha/beta IFN) Pathway |
| 0.1 | 3.6 | PID BETA CATENIN DEG PATHWAY | Degradation of beta catenin |
| 0.1 | 7.1 | PID HES HEY PATHWAY | Notch-mediated HES/HEY network |
| 0.1 | 2.6 | SIG IL4RECEPTOR IN B LYPHOCYTES | Genes related to IL4 rceptor signaling in B lymphocytes |
| 0.1 | 4.9 | PID ALPHA SYNUCLEIN PATHWAY | Alpha-synuclein signaling |
| 0.1 | 3.5 | PID IFNG PATHWAY | IFN-gamma pathway |
| 0.1 | 3.8 | PID RXR VDR PATHWAY | RXR and RAR heterodimerization with other nuclear receptor |
| 0.1 | 0.8 | PID HDAC CLASSII PATHWAY | Signaling events mediated by HDAC Class II |
| 0.1 | 2.0 | PID P38 MKK3 6PATHWAY | p38 MAPK signaling pathway |
| 0.1 | 2.2 | PID ARF 3PATHWAY | Arf1 pathway |
| 0.1 | 1.1 | PID TCR RAS PATHWAY | Ras signaling in the CD4+ TCR pathway |
| 0.1 | 18.0 | NABA ECM GLYCOPROTEINS | Genes encoding structural ECM glycoproteins |
| 0.1 | 1.7 | PID EPHRINB REV PATHWAY | Ephrin B reverse signaling |
| 0.1 | 2.1 | PID RHOA PATHWAY | RhoA signaling pathway |
| 0.1 | 18.3 | NABA ECM REGULATORS | Genes encoding enzymes and their regulators involved in the remodeling of the extracellular matrix |
| 0.1 | 2.0 | SA CASPASE CASCADE | Apoptosis is mediated by caspases, cysteine proteases arranged in a proteolytic cascade. |
| 0.1 | 10.6 | PID P53 DOWNSTREAM PATHWAY | Direct p53 effectors |
| 0.1 | 3.1 | PID ATR PATHWAY | ATR signaling pathway |
| 0.1 | 2.4 | PID SYNDECAN 4 PATHWAY | Syndecan-4-mediated signaling events |
| 0.1 | 0.6 | PID NFKAPPAB ATYPICAL PATHWAY | Atypical NF-kappaB pathway |
| 0.1 | 4.2 | PID AP1 PATHWAY | AP-1 transcription factor network |
| 0.1 | 2.4 | PID IL4 2PATHWAY | IL4-mediated signaling events |
| 0.1 | 1.2 | PID SMAD2 3PATHWAY | Regulation of cytoplasmic and nuclear SMAD2/3 signaling |
| 0.1 | 4.4 | PID SMAD2 3NUCLEAR PATHWAY | Regulation of nuclear SMAD2/3 signaling |
| 0.1 | 1.9 | PID BCR 5PATHWAY | BCR signaling pathway |
| 0.0 | 2.8 | PID E2F PATHWAY | E2F transcription factor network |
| 0.0 | 0.9 | PID INSULIN GLUCOSE PATHWAY | Insulin-mediated glucose transport |
| 0.0 | 1.5 | SA MMP CYTOKINE CONNECTION | Cytokines can induce activation of matrix metalloproteinases, which degrade extracellular matrix. |
| 0.0 | 1.0 | PID GLYPICAN 1PATHWAY | Glypican 1 network |
| 0.0 | 0.7 | PID HEDGEHOG 2PATHWAY | Signaling events mediated by the Hedgehog family |
| 0.0 | 0.6 | PID AR NONGENOMIC PATHWAY | Nongenotropic Androgen signaling |
| 0.0 | 0.4 | PID IL1 PATHWAY | IL1-mediated signaling events |
| 0.0 | 7.2 | NABA SECRETED FACTORS | Genes encoding secreted soluble factors |
| 0.0 | 0.6 | PID NCADHERIN PATHWAY | N-cadherin signaling events |
| 0.0 | 1.1 | PID RHOA REG PATHWAY | Regulation of RhoA activity |
| 0.0 | 0.2 | PID ERBB2 ERBB3 PATHWAY | ErbB2/ErbB3 signaling events |
| 0.0 | 0.4 | PID AURORA A PATHWAY | Aurora A signaling |
Gene overrepresentation in curated gene sets: REACTOME pathways category:
| Log-likelihood per target | Total log-likelihood | Term | Description |
|---|---|---|---|
| 0.4 | 26.4 | REACTOME STRIATED MUSCLE CONTRACTION | Genes involved in Striated Muscle Contraction |
| 0.4 | 26.3 | REACTOME COLLAGEN FORMATION | Genes involved in Collagen formation |
| 0.4 | 14.0 | REACTOME TIGHT JUNCTION INTERACTIONS | Genes involved in Tight junction interactions |
| 0.3 | 3.9 | REACTOME P75NTR RECRUITS SIGNALLING COMPLEXES | Genes involved in p75NTR recruits signalling complexes |
| 0.3 | 6.4 | REACTOME IL 7 SIGNALING | Genes involved in Interleukin-7 signaling |
| 0.3 | 4.0 | REACTOME REMOVAL OF THE FLAP INTERMEDIATE FROM THE C STRAND | Genes involved in Removal of the Flap Intermediate from the C-strand |
| 0.3 | 5.6 | REACTOME SIGNAL ATTENUATION | Genes involved in Signal attenuation |
| 0.3 | 1.6 | REACTOME RNA POL I PROMOTER OPENING | Genes involved in RNA Polymerase I Promoter Opening |
| 0.2 | 7.3 | REACTOME G0 AND EARLY G1 | Genes involved in G0 and Early G1 |
| 0.2 | 3.8 | REACTOME VEGF LIGAND RECEPTOR INTERACTIONS | Genes involved in VEGF ligand-receptor interactions |
| 0.2 | 6.2 | REACTOME KINESINS | Genes involved in Kinesins |
| 0.2 | 2.9 | REACTOME ACTIVATION OF CHAPERONE GENES BY ATF6 ALPHA | Genes involved in Activation of Chaperone Genes by ATF6-alpha |
| 0.2 | 8.6 | REACTOME SEMA4D INDUCED CELL MIGRATION AND GROWTH CONE COLLAPSE | Genes involved in Sema4D induced cell migration and growth-cone collapse |
| 0.2 | 0.6 | REACTOME NFKB IS ACTIVATED AND SIGNALS SURVIVAL | Genes involved in NF-kB is activated and signals survival |
| 0.1 | 0.9 | REACTOME A TETRASACCHARIDE LINKER SEQUENCE IS REQUIRED FOR GAG SYNTHESIS | Genes involved in A tetrasaccharide linker sequence is required for GAG synthesis |
| 0.1 | 2.7 | REACTOME REGULATION OF RHEB GTPASE ACTIVITY BY AMPK | Genes involved in Regulation of Rheb GTPase activity by AMPK |
| 0.1 | 4.2 | REACTOME TRANSFERRIN ENDOCYTOSIS AND RECYCLING | Genes involved in Transferrin endocytosis and recycling |
| 0.1 | 2.6 | REACTOME N GLYCAN ANTENNAE ELONGATION | Genes involved in N-Glycan antennae elongation |
| 0.1 | 3.8 | REACTOME HS GAG DEGRADATION | Genes involved in HS-GAG degradation |
| 0.1 | 4.5 | REACTOME GLUTATHIONE CONJUGATION | Genes involved in Glutathione conjugation |
| 0.1 | 5.5 | REACTOME AMYLOIDS | Genes involved in Amyloids |
| 0.1 | 5.5 | REACTOME LYSOSOME VESICLE BIOGENESIS | Genes involved in Lysosome Vesicle Biogenesis |
| 0.1 | 2.8 | REACTOME TERMINATION OF O GLYCAN BIOSYNTHESIS | Genes involved in Termination of O-glycan biosynthesis |
| 0.1 | 1.9 | REACTOME LATENT INFECTION OF HOMO SAPIENS WITH MYCOBACTERIUM TUBERCULOSIS | Genes involved in Latent infection of Homo sapiens with Mycobacterium tuberculosis |
| 0.1 | 9.4 | REACTOME DESTABILIZATION OF MRNA BY AUF1 HNRNP D0 | Genes involved in Destabilization of mRNA by AUF1 (hnRNP D0) |
| 0.1 | 2.7 | REACTOME O LINKED GLYCOSYLATION OF MUCINS | Genes involved in O-linked glycosylation of mucins |
| 0.1 | 1.6 | REACTOME UNWINDING OF DNA | Genes involved in Unwinding of DNA |
| 0.1 | 2.3 | REACTOME APOPTOTIC CLEAVAGE OF CELL ADHESION PROTEINS | Genes involved in Apoptotic cleavage of cell adhesion proteins |
| 0.1 | 3.5 | REACTOME CELL EXTRACELLULAR MATRIX INTERACTIONS | Genes involved in Cell-extracellular matrix interactions |
| 0.1 | 3.9 | REACTOME RECYCLING PATHWAY OF L1 | Genes involved in Recycling pathway of L1 |
| 0.1 | 0.5 | REACTOME CROSS PRESENTATION OF SOLUBLE EXOGENOUS ANTIGENS ENDOSOMES | Genes involved in Cross-presentation of soluble exogenous antigens (endosomes) |
| 0.1 | 3.7 | REACTOME FATTY ACYL COA BIOSYNTHESIS | Genes involved in Fatty Acyl-CoA Biosynthesis |
| 0.1 | 2.9 | REACTOME SYNTHESIS AND INTERCONVERSION OF NUCLEOTIDE DI AND TRIPHOSPHATES | Genes involved in Synthesis and interconversion of nucleotide di- and triphosphates |
| 0.1 | 2.3 | REACTOME CHONDROITIN SULFATE BIOSYNTHESIS | Genes involved in Chondroitin sulfate biosynthesis |
| 0.1 | 6.2 | REACTOME RESPIRATORY ELECTRON TRANSPORT | Genes involved in Respiratory electron transport |
| 0.1 | 2.7 | REACTOME SMAD2 SMAD3 SMAD4 HETEROTRIMER REGULATES TRANSCRIPTION | Genes involved in SMAD2/SMAD3:SMAD4 heterotrimer regulates transcription |
| 0.1 | 1.9 | REACTOME CYCLIN E ASSOCIATED EVENTS DURING G1 S TRANSITION | Genes involved in Cyclin E associated events during G1/S transition |
| 0.1 | 9.3 | REACTOME FACTORS INVOLVED IN MEGAKARYOCYTE DEVELOPMENT AND PLATELET PRODUCTION | Genes involved in Factors involved in megakaryocyte development and platelet production |
| 0.1 | 1.4 | REACTOME AUTODEGRADATION OF CDH1 BY CDH1 APC C | Genes involved in Autodegradation of Cdh1 by Cdh1:APC/C |
| 0.1 | 0.4 | REACTOME CONVERSION FROM APC C CDC20 TO APC C CDH1 IN LATE ANAPHASE | Genes involved in Conversion from APC/C:Cdc20 to APC/C:Cdh1 in late anaphase |
| 0.1 | 4.2 | REACTOME NOTCH1 INTRACELLULAR DOMAIN REGULATES TRANSCRIPTION | Genes involved in NOTCH1 Intracellular Domain Regulates Transcription |
| 0.1 | 1.6 | REACTOME RNA POL III TRANSCRIPTION INITIATION FROM TYPE 3 PROMOTER | Genes involved in RNA Polymerase III Transcription Initiation From Type 3 Promoter |
| 0.0 | 0.9 | REACTOME XENOBIOTICS | Genes involved in Xenobiotics |
| 0.0 | 0.7 | REACTOME PYRIMIDINE CATABOLISM | Genes involved in Pyrimidine catabolism |
| 0.0 | 0.6 | REACTOME HORMONE LIGAND BINDING RECEPTORS | Genes involved in Hormone ligand-binding receptors |
| 0.0 | 1.9 | REACTOME FORMATION OF FIBRIN CLOT CLOTTING CASCADE | Genes involved in Formation of Fibrin Clot (Clotting Cascade) |
| 0.0 | 4.2 | REACTOME NUCLEAR RECEPTOR TRANSCRIPTION PATHWAY | Genes involved in Nuclear Receptor transcription pathway |
| 0.0 | 0.7 | REACTOME ZINC TRANSPORTERS | Genes involved in Zinc transporters |
| 0.0 | 0.5 | REACTOME THE NLRP3 INFLAMMASOME | Genes involved in The NLRP3 inflammasome |
| 0.0 | 1.0 | REACTOME SHC1 EVENTS IN ERBB4 SIGNALING | Genes involved in SHC1 events in ERBB4 signaling |
| 0.0 | 1.2 | REACTOME REGULATION OF GLUCOKINASE BY GLUCOKINASE REGULATORY PROTEIN | Genes involved in Regulation of Glucokinase by Glucokinase Regulatory Protein |
| 0.0 | 3.3 | REACTOME IMMUNOREGULATORY INTERACTIONS BETWEEN A LYMPHOID AND A NON LYMPHOID CELL | Genes involved in Immunoregulatory interactions between a Lymphoid and a non-Lymphoid cell |
| 0.0 | 2.1 | REACTOME ACTIVATION OF CHAPERONE GENES BY XBP1S | Genes involved in Activation of Chaperone Genes by XBP1(S) |
| 0.0 | 4.6 | REACTOME SIGNALING BY RHO GTPASES | Genes involved in Signaling by Rho GTPases |
| 0.0 | 4.8 | REACTOME METABOLISM OF AMINO ACIDS AND DERIVATIVES | Genes involved in Metabolism of amino acids and derivatives |
| 0.0 | 1.8 | REACTOME INTEGRIN CELL SURFACE INTERACTIONS | Genes involved in Integrin cell surface interactions |
| 0.0 | 0.9 | REACTOME TRANSPORT OF MATURE TRANSCRIPT TO CYTOPLASM | Genes involved in Transport of Mature Transcript to Cytoplasm |
| 0.0 | 1.7 | REACTOME INTERFERON ALPHA BETA SIGNALING | Genes involved in Interferon alpha/beta signaling |
| 0.0 | 0.8 | REACTOME EFFECTS OF PIP2 HYDROLYSIS | Genes involved in Effects of PIP2 hydrolysis |
| 0.0 | 1.9 | REACTOME RESPONSE TO ELEVATED PLATELET CYTOSOLIC CA2 | Genes involved in Response to elevated platelet cytosolic Ca2+ |
| 0.0 | 1.5 | REACTOME LOSS OF NLP FROM MITOTIC CENTROSOMES | Genes involved in Loss of Nlp from mitotic centrosomes |
| 0.0 | 1.2 | REACTOME COSTIMULATION BY THE CD28 FAMILY | Genes involved in Costimulation by the CD28 family |
| 0.0 | 0.3 | REACTOME NFKB ACTIVATION THROUGH FADD RIP1 PATHWAY MEDIATED BY CASPASE 8 AND10 | Genes involved in NF-kB activation through FADD/RIP-1 pathway mediated by caspase-8 and -10 |
| 0.0 | 0.3 | REACTOME DARPP 32 EVENTS | Genes involved in DARPP-32 events |
| 0.0 | 0.5 | REACTOME NETRIN1 SIGNALING | Genes involved in Netrin-1 signaling |
| 0.0 | 0.3 | REACTOME DEPOSITION OF NEW CENPA CONTAINING NUCLEOSOMES AT THE CENTROMERE | Genes involved in Deposition of New CENPA-containing Nucleosomes at the Centromere |
| 0.0 | 1.0 | REACTOME L1CAM INTERACTIONS | Genes involved in L1CAM interactions |