Project
GNF SymAtlas + NCI-60 cancer cell lines, human (Su, 2004; Ross, 2000)
Navigation
Downloads
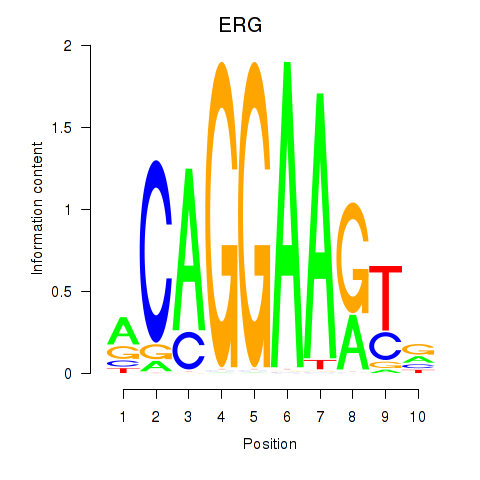
Results for ERG
Z-value: 1.68
Motif logo
Transcription factors associated with ERG
| Gene Symbol | Gene ID | Gene Info |
|---|---|---|
|
ERG
|
ENSG00000157554.19 | ERG |
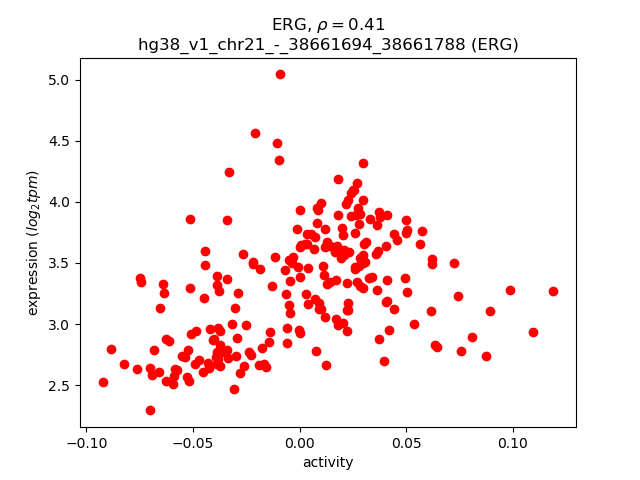
Activity-expression correlation:
| Gene | Promoter | Pearson corr. coef. | P-value | Plot |
|---|---|---|---|---|
| ERG | hg38_v1_chr21_-_38661694_38661788, hg38_v1_chr21_-_38498415_38498519 | 0.41 | 2.7e-10 | Click! |
Activity profile of ERG motif
Sorted Z-values of ERG motif
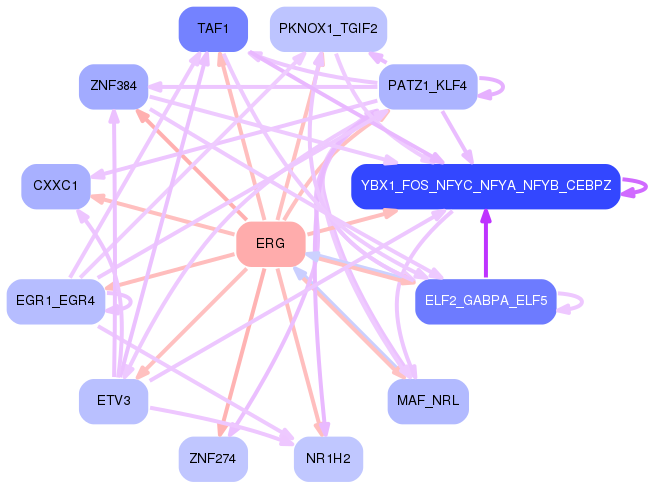
Network of associatons between targets according to the STRING database.

First level regulatory network of ERG
Gene Ontology Analysis
Gene overrepresentation in biological process category:
| Log-likelihood per target | Total log-likelihood | Term | Description |
|---|---|---|---|
| 22.6 | 67.7 | GO:1902846 | regulation of spindle elongation(GO:0032887) regulation of mitotic spindle elongation(GO:0032888) anastral spindle assembly(GO:0055048) protein localization to spindle pole body(GO:0071988) regulation of protein localization to spindle pole body(GO:1902363) positive regulation of protein localization to spindle pole body(GO:1902365) positive regulation of mitotic spindle elongation(GO:1902846) |
| 16.2 | 64.6 | GO:0002357 | defense response to tumor cell(GO:0002357) |
| 11.7 | 35.2 | GO:0071140 | resolution of recombination intermediates(GO:0071139) resolution of mitotic recombination intermediates(GO:0071140) |
| 10.8 | 32.3 | GO:0002884 | negative regulation of hypersensitivity(GO:0002884) |
| 9.3 | 37.3 | GO:0044416 | induction by symbiont of host defense response(GO:0044416) induction of host immune response by virus(GO:0046730) active induction of host immune response by virus(GO:0046732) modulation by symbiont of host defense response(GO:0052031) induction by organism of defense response of other organism involved in symbiotic interaction(GO:0052251) modulation by organism of defense response of other organism involved in symbiotic interaction(GO:0052255) positive regulation by symbiont of host defense response(GO:0052509) positive regulation by organism of defense response of other organism involved in symbiotic interaction(GO:0052510) modulation by organism of immune response of other organism involved in symbiotic interaction(GO:0052552) modulation by symbiont of host immune response(GO:0052553) modulation by virus of host immune response(GO:0075528) |
| 8.7 | 8.7 | GO:0002752 | cell surface pattern recognition receptor signaling pathway(GO:0002752) |
| 8.3 | 33.2 | GO:0035606 | peptidyl-cysteine S-trans-nitrosylation(GO:0035606) |
| 8.1 | 24.3 | GO:0002143 | tRNA wobble position uridine thiolation(GO:0002143) |
| 8.1 | 16.2 | GO:0002445 | type IIa hypersensitivity(GO:0001794) regulation of type IIa hypersensitivity(GO:0001796) type II hypersensitivity(GO:0002445) regulation of type II hypersensitivity(GO:0002892) |
| 8.0 | 23.9 | GO:0070078 | peptidyl-lysine hydroxylation to 5-hydroxy-L-lysine(GO:0018395) histone arginine demethylation(GO:0070077) histone H3-R2 demethylation(GO:0070078) histone H4-R3 demethylation(GO:0070079) |
| 8.0 | 23.9 | GO:0000350 | generation of catalytic spliceosome for second transesterification step(GO:0000350) |
| 8.0 | 23.9 | GO:1902567 | negative regulation of eosinophil activation(GO:1902567) |
| 7.7 | 30.9 | GO:0034627 | nicotinamide nucleotide biosynthetic process from aspartate(GO:0019355) 'de novo' NAD biosynthetic process(GO:0034627) 'de novo' NAD biosynthetic process from aspartate(GO:0034628) |
| 7.5 | 15.1 | GO:2000439 | positive regulation of monocyte extravasation(GO:2000439) |
| 7.3 | 29.3 | GO:2001191 | gamma-delta T cell activation involved in immune response(GO:0002290) negative regulation of interferon-beta secretion(GO:0035548) regulation of gamma-delta T cell activation involved in immune response(GO:2001191) positive regulation of gamma-delta T cell activation involved in immune response(GO:2001193) |
| 7.3 | 21.9 | GO:1903336 | negative regulation of vacuolar transport(GO:1903336) |
| 7.2 | 7.2 | GO:1904431 | positive regulation of t-circle formation(GO:1904431) |
| 6.8 | 20.3 | GO:0045643 | regulation of eosinophil differentiation(GO:0045643) positive regulation of eosinophil differentiation(GO:0045645) |
| 6.7 | 33.6 | GO:2000870 | regulation of progesterone secretion(GO:2000870) |
| 6.6 | 26.3 | GO:0036369 | transcription factor catabolic process(GO:0036369) |
| 6.5 | 38.9 | GO:0038016 | insulin receptor internalization(GO:0038016) |
| 6.4 | 25.8 | GO:1905224 | clathrin-coated pit assembly(GO:1905224) |
| 5.8 | 109.3 | GO:0042424 | catechol-containing compound catabolic process(GO:0019614) catecholamine catabolic process(GO:0042424) |
| 5.7 | 17.2 | GO:0045360 | regulation of interleukin-1 biosynthetic process(GO:0045360) positive regulation of interleukin-1 biosynthetic process(GO:0045362) |
| 5.6 | 16.8 | GO:0002416 | IgG immunoglobulin transcytosis in epithelial cells mediated by FcRn immunoglobulin receptor(GO:0002416) |
| 5.5 | 16.5 | GO:1904692 | positive regulation of type B pancreatic cell proliferation(GO:1904692) |
| 5.4 | 21.5 | GO:0002881 | negative regulation of chronic inflammatory response to non-antigenic stimulus(GO:0002881) |
| 5.3 | 21.3 | GO:0039507 | modulation by virus of host molecular function(GO:0039506) suppression by virus of host molecular function(GO:0039507) suppression by virus of host catalytic activity(GO:0039513) modulation by virus of host catalytic activity(GO:0039516) suppression by virus of host cysteine-type endopeptidase activity involved in apoptotic process(GO:0039650) negative regulation by symbiont of host catalytic activity(GO:0052053) negative regulation by symbiont of host molecular function(GO:0052056) modulation by symbiont of host catalytic activity(GO:0052148) |
| 5.3 | 21.2 | GO:0030037 | actin filament reorganization involved in cell cycle(GO:0030037) |
| 5.2 | 36.5 | GO:0045079 | negative regulation of chemokine biosynthetic process(GO:0045079) |
| 5.2 | 20.6 | GO:0090299 | fibroblast growth factor receptor signaling pathway involved in neural plate anterior/posterior pattern formation(GO:0060825) regulation of neural crest formation(GO:0090299) negative regulation of neural crest formation(GO:0090301) regulation of fibroblast growth factor receptor signaling pathway involved in neural plate anterior/posterior pattern formation(GO:2000313) negative regulation of fibroblast growth factor receptor signaling pathway involved in neural plate anterior/posterior pattern formation(GO:2000314) |
| 5.1 | 15.4 | GO:0034769 | basement membrane disassembly(GO:0034769) |
| 4.9 | 14.7 | GO:0003366 | cell-matrix adhesion involved in ameboidal cell migration(GO:0003366) |
| 4.7 | 42.3 | GO:0002291 | T cell activation via T cell receptor contact with antigen bound to MHC molecule on antigen presenting cell(GO:0002291) |
| 4.7 | 4.7 | GO:0002625 | regulation of T cell antigen processing and presentation(GO:0002625) |
| 4.7 | 18.7 | GO:0070940 | dephosphorylation of RNA polymerase II C-terminal domain(GO:0070940) |
| 4.7 | 18.6 | GO:0034445 | regulation of plasma lipoprotein particle oxidation(GO:0034444) negative regulation of plasma lipoprotein particle oxidation(GO:0034445) |
| 4.6 | 13.9 | GO:0045658 | regulation of neutrophil differentiation(GO:0045658) negative regulation of neutrophil differentiation(GO:0045659) |
| 4.6 | 18.5 | GO:1902528 | regulation of protein linear polyubiquitination(GO:1902528) positive regulation of protein linear polyubiquitination(GO:1902530) |
| 4.6 | 13.8 | GO:0071461 | cellular response to redox state(GO:0071461) |
| 4.5 | 18.0 | GO:0006049 | UDP-N-acetylglucosamine catabolic process(GO:0006049) |
| 4.5 | 26.9 | GO:1904685 | positive regulation of metalloendopeptidase activity(GO:1904685) |
| 4.4 | 17.6 | GO:0010836 | negative regulation of protein ADP-ribosylation(GO:0010836) |
| 4.4 | 17.5 | GO:0006562 | proline catabolic process(GO:0006562) |
| 4.4 | 17.4 | GO:0050904 | diapedesis(GO:0050904) |
| 4.3 | 21.7 | GO:0090182 | regulation of secretion of lysosomal enzymes(GO:0090182) |
| 4.2 | 20.9 | GO:0006154 | adenosine catabolic process(GO:0006154) inosine biosynthetic process(GO:0046103) |
| 4.2 | 8.3 | GO:1903774 | positive regulation of viral budding via host ESCRT complex(GO:1903774) |
| 4.1 | 12.4 | GO:0038178 | complement component C5a signaling pathway(GO:0038178) |
| 4.1 | 12.2 | GO:1902997 | regulation of choline O-acetyltransferase activity(GO:1902769) positive regulation of choline O-acetyltransferase activity(GO:1902771) negative regulation of tau-protein kinase activity(GO:1902948) positive regulation of early endosome to recycling endosome transport(GO:1902955) negative regulation of aspartic-type endopeptidase activity involved in amyloid precursor protein catabolic process(GO:1902960) negative regulation of neurofibrillary tangle assembly(GO:1902997) negative regulation of aspartic-type peptidase activity(GO:1905246) |
| 4.0 | 12.1 | GO:0002585 | positive regulation of antigen processing and presentation of peptide or polysaccharide antigen via MHC class II(GO:0002582) positive regulation of antigen processing and presentation of peptide antigen(GO:0002585) positive regulation of antigen processing and presentation of peptide antigen via MHC class II(GO:0002588) |
| 4.0 | 11.9 | GO:0043012 | regulation of fusion of sperm to egg plasma membrane(GO:0043012) |
| 4.0 | 4.0 | GO:1902724 | positive regulation of skeletal muscle satellite cell proliferation(GO:1902724) positive regulation of growth factor dependent skeletal muscle satellite cell proliferation(GO:1902728) |
| 3.9 | 11.8 | GO:0098974 | postsynaptic actin cytoskeleton organization(GO:0098974) |
| 3.9 | 15.6 | GO:1903070 | negative regulation of ER-associated ubiquitin-dependent protein catabolic process(GO:1903070) |
| 3.9 | 23.3 | GO:1903936 | cellular response to sodium arsenite(GO:1903936) |
| 3.9 | 11.6 | GO:1903004 | regulation of protein K63-linked deubiquitination(GO:1903004) positive regulation of protein K63-linked deubiquitination(GO:1903006) |
| 3.8 | 15.4 | GO:0031161 | phosphatidylinositol catabolic process(GO:0031161) |
| 3.8 | 11.4 | GO:0070105 | positive regulation of interleukin-6-mediated signaling pathway(GO:0070105) |
| 3.8 | 22.6 | GO:0070829 | response to vitamin B2(GO:0033274) heterochromatin maintenance(GO:0070829) |
| 3.7 | 22.4 | GO:1903378 | positive regulation of oxidative stress-induced neuron intrinsic apoptotic signaling pathway(GO:1903378) |
| 3.6 | 10.8 | GO:1901895 | negative regulation of calcium-transporting ATPase activity(GO:1901895) |
| 3.5 | 24.8 | GO:0000821 | regulation of arginine metabolic process(GO:0000821) |
| 3.5 | 3.5 | GO:2000520 | regulation of immunological synapse formation(GO:2000520) |
| 3.5 | 69.7 | GO:0002523 | leukocyte migration involved in inflammatory response(GO:0002523) |
| 3.4 | 20.6 | GO:0016926 | protein desumoylation(GO:0016926) |
| 3.4 | 30.7 | GO:2000286 | receptor internalization involved in canonical Wnt signaling pathway(GO:2000286) |
| 3.4 | 10.2 | GO:0051710 | regulation of cytolysis in other organism(GO:0051710) |
| 3.3 | 10.0 | GO:0051946 | regulation of amino acid uptake involved in synaptic transmission(GO:0051941) regulation of glutamate uptake involved in transmission of nerve impulse(GO:0051946) regulation of L-glutamate import(GO:1900920) |
| 3.3 | 13.2 | GO:0035627 | ceramide transport(GO:0035627) |
| 3.3 | 23.0 | GO:0051388 | positive regulation of neurotrophin TRK receptor signaling pathway(GO:0051388) |
| 3.3 | 9.8 | GO:0018094 | protein polyglycylation(GO:0018094) |
| 3.2 | 22.4 | GO:1901098 | positive regulation of autophagosome maturation(GO:1901098) |
| 3.2 | 3.2 | GO:0099403 | negative regulation of maintenance of sister chromatid cohesion(GO:0034092) negative regulation of maintenance of mitotic sister chromatid cohesion(GO:0034183) maintenance of mitotic sister chromatid cohesion, telomeric(GO:0099403) mitotic sister chromatid cohesion, telomeric(GO:0099404) regulation of maintenance of mitotic sister chromatid cohesion, telomeric(GO:1904907) negative regulation of maintenance of mitotic sister chromatid cohesion, telomeric(GO:1904908) |
| 3.1 | 9.3 | GO:0072365 | regulation of cellular ketone metabolic process by negative regulation of transcription from RNA polymerase II promoter(GO:0072365) |
| 3.1 | 9.2 | GO:0001915 | negative regulation of T cell mediated cytotoxicity(GO:0001915) |
| 3.0 | 15.0 | GO:0051418 | interphase microtubule nucleation by interphase microtubule organizing center(GO:0051415) microtubule nucleation by microtubule organizing center(GO:0051418) |
| 3.0 | 15.0 | GO:0016998 | cell wall macromolecule catabolic process(GO:0016998) |
| 3.0 | 44.8 | GO:1900112 | regulation of histone H3-K9 trimethylation(GO:1900112) |
| 3.0 | 5.9 | GO:1904844 | response to L-glutamine(GO:1904844) cellular response to L-glutamine(GO:1904845) |
| 3.0 | 5.9 | GO:0045409 | negative regulation of interleukin-6 biosynthetic process(GO:0045409) |
| 2.9 | 11.6 | GO:0033693 | neurofilament bundle assembly(GO:0033693) |
| 2.8 | 25.6 | GO:1903748 | negative regulation of establishment of protein localization to mitochondrion(GO:1903748) |
| 2.8 | 28.1 | GO:0097646 | calcitonin family receptor signaling pathway(GO:0097646) amylin receptor signaling pathway(GO:0097647) |
| 2.8 | 33.7 | GO:0097012 | cellular response to granulocyte macrophage colony-stimulating factor stimulus(GO:0097011) response to granulocyte macrophage colony-stimulating factor(GO:0097012) |
| 2.8 | 8.4 | GO:0002384 | hepatic immune response(GO:0002384) |
| 2.8 | 44.1 | GO:2001204 | regulation of osteoclast development(GO:2001204) |
| 2.7 | 2.7 | GO:2000412 | T-helper 1 cell cytokine production(GO:0035744) positive regulation of thymocyte migration(GO:2000412) |
| 2.7 | 10.9 | GO:0031117 | positive regulation of microtubule depolymerization(GO:0031117) |
| 2.7 | 8.2 | GO:0002590 | regulation of antigen processing and presentation of peptide antigen via MHC class I(GO:0002589) negative regulation of antigen processing and presentation of peptide antigen via MHC class I(GO:0002590) |
| 2.7 | 2.7 | GO:0048686 | regulation of sprouting of injured axon(GO:0048686) regulation of axon extension involved in regeneration(GO:0048690) |
| 2.7 | 2.7 | GO:1990502 | dense core granule maturation(GO:1990502) |
| 2.7 | 29.4 | GO:0043152 | induction of bacterial agglutination(GO:0043152) |
| 2.7 | 24.0 | GO:0043653 | mitochondrial fragmentation involved in apoptotic process(GO:0043653) |
| 2.7 | 10.6 | GO:0019086 | late viral transcription(GO:0019086) |
| 2.7 | 5.3 | GO:0070434 | positive regulation of nucleotide-binding oligomerization domain containing signaling pathway(GO:0070426) positive regulation of nucleotide-binding oligomerization domain containing 2 signaling pathway(GO:0070434) |
| 2.6 | 5.3 | GO:0009826 | unidimensional cell growth(GO:0009826) |
| 2.6 | 10.5 | GO:0032747 | positive regulation of interleukin-23 production(GO:0032747) |
| 2.6 | 7.8 | GO:0044565 | dendritic cell proliferation(GO:0044565) |
| 2.6 | 5.2 | GO:0070317 | negative regulation of G0 to G1 transition(GO:0070317) |
| 2.6 | 7.7 | GO:2000348 | regulation of CD40 signaling pathway(GO:2000348) |
| 2.6 | 10.3 | GO:1990737 | response to manganese-induced endoplasmic reticulum stress(GO:1990737) |
| 2.6 | 5.1 | GO:1903238 | positive regulation of leukocyte tethering or rolling(GO:1903238) |
| 2.6 | 43.5 | GO:0090360 | platelet-derived growth factor production(GO:0090360) regulation of platelet-derived growth factor production(GO:0090361) |
| 2.5 | 5.1 | GO:1901096 | regulation of autophagosome maturation(GO:1901096) |
| 2.5 | 20.2 | GO:0016557 | peroxisome membrane biogenesis(GO:0016557) |
| 2.5 | 2.5 | GO:0002677 | negative regulation of chronic inflammatory response(GO:0002677) |
| 2.5 | 34.9 | GO:0034498 | early endosome to Golgi transport(GO:0034498) |
| 2.5 | 7.4 | GO:0033082 | regulation of extrathymic T cell differentiation(GO:0033082) sebum secreting cell proliferation(GO:1990654) |
| 2.5 | 7.4 | GO:1902283 | negative regulation of primary amine oxidase activity(GO:1902283) |
| 2.5 | 9.8 | GO:1990928 | response to amino acid starvation(GO:1990928) |
| 2.4 | 21.6 | GO:0098535 | de novo centriole assembly(GO:0098535) |
| 2.4 | 7.2 | GO:0045084 | positive regulation of interleukin-12 biosynthetic process(GO:0045084) |
| 2.4 | 11.9 | GO:0021997 | neural plate axis specification(GO:0021997) |
| 2.4 | 23.8 | GO:0036309 | protein localization to M-band(GO:0036309) protein localization to T-tubule(GO:0036371) |
| 2.4 | 4.8 | GO:0005989 | lactose metabolic process(GO:0005988) lactose biosynthetic process(GO:0005989) |
| 2.4 | 30.8 | GO:2001300 | lipoxin metabolic process(GO:2001300) |
| 2.3 | 9.3 | GO:0042631 | cellular response to water deprivation(GO:0042631) |
| 2.3 | 39.6 | GO:0051531 | NFAT protein import into nucleus(GO:0051531) |
| 2.3 | 7.0 | GO:0021592 | midbrain-hindbrain boundary morphogenesis(GO:0021555) fourth ventricle development(GO:0021592) third ventricle development(GO:0021678) |
| 2.3 | 6.9 | GO:0002101 | tRNA wobble cytosine modification(GO:0002101) |
| 2.3 | 25.5 | GO:1904262 | negative regulation of TORC1 signaling(GO:1904262) |
| 2.3 | 46.1 | GO:0090557 | establishment of endothelial intestinal barrier(GO:0090557) |
| 2.3 | 4.6 | GO:1904529 | regulation of actin filament binding(GO:1904529) regulation of actin binding(GO:1904616) |
| 2.3 | 9.1 | GO:0014744 | positive regulation of muscle adaptation(GO:0014744) |
| 2.3 | 27.1 | GO:1903903 | regulation of establishment of T cell polarity(GO:1903903) |
| 2.3 | 49.5 | GO:0046597 | negative regulation of viral entry into host cell(GO:0046597) |
| 2.2 | 2.2 | GO:0008355 | olfactory learning(GO:0008355) |
| 2.2 | 6.7 | GO:1990168 | protein K33-linked deubiquitination(GO:1990168) |
| 2.2 | 9.0 | GO:0032416 | negative regulation of sodium:proton antiporter activity(GO:0032416) |
| 2.2 | 37.8 | GO:0034497 | protein localization to pre-autophagosomal structure(GO:0034497) |
| 2.2 | 13.3 | GO:0060971 | embryonic heart tube left/right pattern formation(GO:0060971) |
| 2.2 | 6.6 | GO:0043376 | regulation of CD8-positive, alpha-beta T cell differentiation(GO:0043376) |
| 2.2 | 15.4 | GO:0006102 | isocitrate metabolic process(GO:0006102) |
| 2.2 | 15.2 | GO:0070127 | tRNA aminoacylation for mitochondrial protein translation(GO:0070127) |
| 2.2 | 8.6 | GO:1900169 | regulation of glucocorticoid mediated signaling pathway(GO:1900169) |
| 2.1 | 17.2 | GO:0000480 | endonucleolytic cleavage in 5'-ETS of tricistronic rRNA transcript (SSU-rRNA, 5.8S rRNA, LSU-rRNA)(GO:0000480) |
| 2.1 | 6.4 | GO:1903526 | negative regulation of membrane tubulation(GO:1903526) |
| 2.1 | 19.0 | GO:0015693 | magnesium ion transport(GO:0015693) |
| 2.1 | 8.2 | GO:0035582 | sequestering of BMP in extracellular matrix(GO:0035582) sequestering of BMP from receptor via BMP binding(GO:0038098) |
| 2.1 | 4.1 | GO:1900190 | biofilm formation(GO:0042710) single-species biofilm formation(GO:0044010) single-species biofilm formation in or on host organism(GO:0044407) regulation of single-species biofilm formation(GO:1900190) negative regulation of single-species biofilm formation(GO:1900191) regulation of single-species biofilm formation in or on host organism(GO:1900228) negative regulation of single-species biofilm formation in or on host organism(GO:1900229) |
| 2.0 | 6.1 | GO:0060335 | positive regulation of response to interferon-gamma(GO:0060332) positive regulation of interferon-gamma-mediated signaling pathway(GO:0060335) |
| 2.0 | 4.0 | GO:0023035 | CD40 signaling pathway(GO:0023035) |
| 2.0 | 4.0 | GO:0070837 | dehydroascorbic acid transport(GO:0070837) |
| 2.0 | 11.8 | GO:0046092 | deoxycytidine metabolic process(GO:0046092) |
| 2.0 | 9.8 | GO:0006041 | glucosamine metabolic process(GO:0006041) |
| 2.0 | 48.8 | GO:0035428 | hexose transmembrane transport(GO:0035428) glucose transmembrane transport(GO:1904659) |
| 1.9 | 7.8 | GO:0002370 | natural killer cell cytokine production(GO:0002370) regulation of natural killer cell cytokine production(GO:0002727) |
| 1.9 | 11.6 | GO:0032252 | secretory granule localization(GO:0032252) |
| 1.9 | 7.7 | GO:0032290 | peripheral nervous system myelin formation(GO:0032290) |
| 1.9 | 1.9 | GO:0036466 | synaptic vesicle recycling via endosome(GO:0036466) |
| 1.9 | 7.7 | GO:0055099 | response to high density lipoprotein particle(GO:0055099) |
| 1.9 | 5.7 | GO:0036166 | phenotypic switching(GO:0036166) regulation of phenotypic switching(GO:1900239) |
| 1.9 | 7.6 | GO:0097676 | histone H3-K36 dimethylation(GO:0097676) |
| 1.9 | 15.1 | GO:0006013 | mannose metabolic process(GO:0006013) |
| 1.9 | 11.3 | GO:0030885 | regulation of myeloid dendritic cell activation(GO:0030885) |
| 1.9 | 5.6 | GO:0060152 | peroxisome localization(GO:0060151) microtubule-based peroxisome localization(GO:0060152) |
| 1.9 | 16.7 | GO:0060613 | fat pad development(GO:0060613) |
| 1.8 | 9.2 | GO:0071725 | toll-like receptor TLR1:TLR2 signaling pathway(GO:0038123) response to triacyl bacterial lipopeptide(GO:0071725) cellular response to triacyl bacterial lipopeptide(GO:0071727) |
| 1.8 | 9.2 | GO:0045872 | positive regulation of rhodopsin gene expression(GO:0045872) |
| 1.8 | 11.0 | GO:0035604 | fibroblast growth factor receptor signaling pathway involved in negative regulation of apoptotic process in bone marrow(GO:0035602) fibroblast growth factor receptor signaling pathway involved in hemopoiesis(GO:0035603) fibroblast growth factor receptor signaling pathway involved in positive regulation of cell proliferation in bone marrow(GO:0035604) |
| 1.8 | 5.5 | GO:0045897 | positive regulation of transcription during mitosis(GO:0045897) |
| 1.8 | 10.9 | GO:0050859 | negative regulation of B cell receptor signaling pathway(GO:0050859) |
| 1.8 | 12.7 | GO:0007000 | nucleolus organization(GO:0007000) |
| 1.8 | 23.5 | GO:1901223 | negative regulation of NIK/NF-kappaB signaling(GO:1901223) |
| 1.8 | 25.2 | GO:0051940 | regulation of dopamine uptake involved in synaptic transmission(GO:0051584) regulation of catecholamine uptake involved in synaptic transmission(GO:0051940) |
| 1.8 | 9.0 | GO:0035694 | mitochondrial protein catabolic process(GO:0035694) |
| 1.8 | 7.2 | GO:0050861 | positive regulation of B cell receptor signaling pathway(GO:0050861) |
| 1.8 | 10.7 | GO:0060770 | negative regulation of epithelial cell proliferation involved in prostate gland development(GO:0060770) |
| 1.8 | 14.3 | GO:0071649 | negative regulation of defense response to virus by host(GO:0050689) regulation of chemokine (C-C motif) ligand 5 production(GO:0071649) |
| 1.8 | 7.1 | GO:0071802 | negative regulation of podosome assembly(GO:0071802) |
| 1.8 | 14.1 | GO:0007256 | activation of JNKK activity(GO:0007256) |
| 1.8 | 14.1 | GO:0001661 | conditioned taste aversion(GO:0001661) |
| 1.8 | 8.8 | GO:2000503 | positive regulation of natural killer cell chemotaxis(GO:2000503) |
| 1.8 | 59.7 | GO:0045730 | respiratory burst(GO:0045730) |
| 1.7 | 10.5 | GO:0032377 | regulation of intracellular lipid transport(GO:0032377) regulation of intracellular sterol transport(GO:0032380) regulation of intracellular cholesterol transport(GO:0032383) |
| 1.7 | 14.0 | GO:0035771 | interleukin-4-mediated signaling pathway(GO:0035771) |
| 1.7 | 3.5 | GO:0034144 | negative regulation of toll-like receptor 4 signaling pathway(GO:0034144) |
| 1.7 | 5.2 | GO:1990166 | protein localization to site of double-strand break(GO:1990166) |
| 1.7 | 6.9 | GO:0046968 | peptide antigen transport(GO:0046968) |
| 1.7 | 17.3 | GO:0036066 | protein O-linked fucosylation(GO:0036066) |
| 1.7 | 1.7 | GO:0002314 | germinal center B cell differentiation(GO:0002314) |
| 1.7 | 3.5 | GO:0032700 | negative regulation of interleukin-17 production(GO:0032700) |
| 1.7 | 6.9 | GO:0002554 | serotonin production involved in inflammatory response(GO:0002351) serotonin secretion involved in inflammatory response(GO:0002442) serotonin secretion by platelet(GO:0002554) |
| 1.7 | 3.4 | GO:2000566 | positive regulation of CD8-positive, alpha-beta T cell proliferation(GO:2000566) |
| 1.7 | 6.8 | GO:0010979 | regulation of vitamin D 24-hydroxylase activity(GO:0010979) positive regulation of vitamin D 24-hydroxylase activity(GO:0010980) |
| 1.7 | 18.8 | GO:0015074 | DNA integration(GO:0015074) |
| 1.7 | 3.4 | GO:1902174 | positive regulation of keratinocyte apoptotic process(GO:1902174) |
| 1.7 | 3.4 | GO:1902732 | positive regulation of chondrocyte proliferation(GO:1902732) |
| 1.7 | 1.7 | GO:0032661 | regulation of interleukin-18 production(GO:0032661) |
| 1.7 | 20.3 | GO:0045651 | positive regulation of macrophage differentiation(GO:0045651) |
| 1.7 | 8.4 | GO:0090051 | negative regulation of cell migration involved in sprouting angiogenesis(GO:0090051) negative regulation of sprouting angiogenesis(GO:1903671) |
| 1.7 | 13.3 | GO:0046598 | positive regulation of viral entry into host cell(GO:0046598) |
| 1.7 | 11.7 | GO:0090527 | actin filament reorganization(GO:0090527) |
| 1.7 | 5.0 | GO:0060051 | negative regulation of protein glycosylation(GO:0060051) negative regulation of protein glycosylation in Golgi(GO:0090285) |
| 1.7 | 1.7 | GO:0045399 | interleukin-3 production(GO:0032632) regulation of interleukin-3 production(GO:0032672) positive regulation of interleukin-3 production(GO:0032752) interleukin-3 biosynthetic process(GO:0042223) regulation of interleukin-3 biosynthetic process(GO:0045399) positive regulation of interleukin-3 biosynthetic process(GO:0045401) |
| 1.6 | 3.3 | GO:0033031 | positive regulation of neutrophil apoptotic process(GO:0033031) |
| 1.6 | 21.4 | GO:0007175 | negative regulation of epidermal growth factor-activated receptor activity(GO:0007175) |
| 1.6 | 4.9 | GO:0000738 | DNA catabolic process, exonucleolytic(GO:0000738) |
| 1.6 | 4.9 | GO:0002032 | desensitization of G-protein coupled receptor protein signaling pathway by arrestin(GO:0002032) |
| 1.6 | 14.8 | GO:1901552 | positive regulation of endothelial cell development(GO:1901552) positive regulation of establishment of endothelial barrier(GO:1903142) |
| 1.6 | 13.0 | GO:0031665 | negative regulation of lipopolysaccharide-mediated signaling pathway(GO:0031665) |
| 1.6 | 8.1 | GO:0070779 | D-aspartate transport(GO:0070777) D-aspartate import(GO:0070779) |
| 1.6 | 25.8 | GO:0002313 | mature B cell differentiation involved in immune response(GO:0002313) |
| 1.6 | 3.2 | GO:0007089 | traversing start control point of mitotic cell cycle(GO:0007089) |
| 1.6 | 7.9 | GO:0060800 | regulation of cell differentiation involved in embryonic placenta development(GO:0060800) |
| 1.6 | 3.2 | GO:1904049 | negative regulation of spontaneous neurotransmitter secretion(GO:1904049) |
| 1.6 | 15.8 | GO:0036037 | CD8-positive, alpha-beta T cell activation(GO:0036037) |
| 1.6 | 12.6 | GO:0045905 | translational frameshifting(GO:0006452) positive regulation of translational termination(GO:0045905) |
| 1.6 | 11.0 | GO:1903351 | negative regulation of megakaryocyte differentiation(GO:0045653) response to dopamine(GO:1903350) cellular response to dopamine(GO:1903351) |
| 1.6 | 6.3 | GO:0070945 | neutrophil mediated killing of gram-negative bacterium(GO:0070945) |
| 1.6 | 4.7 | GO:1901899 | positive regulation of relaxation of cardiac muscle(GO:1901899) |
| 1.6 | 10.9 | GO:0034201 | response to oleic acid(GO:0034201) |
| 1.6 | 6.2 | GO:0046351 | disaccharide biosynthetic process(GO:0046351) |
| 1.6 | 4.7 | GO:0060741 | prostate gland stromal morphogenesis(GO:0060741) |
| 1.5 | 9.3 | GO:0045023 | G0 to G1 transition(GO:0045023) |
| 1.5 | 4.6 | GO:0035106 | operant conditioning(GO:0035106) |
| 1.5 | 4.6 | GO:1902202 | regulation of hepatocyte growth factor receptor signaling pathway(GO:1902202) |
| 1.5 | 26.0 | GO:0042832 | defense response to protozoan(GO:0042832) |
| 1.5 | 10.6 | GO:2000324 | positive regulation of glucocorticoid receptor signaling pathway(GO:2000324) |
| 1.5 | 4.5 | GO:0045586 | regulation of gamma-delta T cell differentiation(GO:0045586) |
| 1.5 | 1.5 | GO:0098759 | response to interleukin-8(GO:0098758) cellular response to interleukin-8(GO:0098759) |
| 1.5 | 1.5 | GO:0090241 | negative regulation of histone H4 acetylation(GO:0090241) |
| 1.5 | 4.5 | GO:1904306 | regulation of gastro-intestinal system smooth muscle contraction(GO:1904304) positive regulation of gastro-intestinal system smooth muscle contraction(GO:1904306) |
| 1.5 | 12.0 | GO:0008626 | granzyme-mediated apoptotic signaling pathway(GO:0008626) |
| 1.5 | 15.0 | GO:0002430 | complement receptor mediated signaling pathway(GO:0002430) |
| 1.5 | 6.0 | GO:0010749 | regulation of nitric oxide mediated signal transduction(GO:0010749) |
| 1.5 | 10.4 | GO:0070560 | protein secretion by platelet(GO:0070560) |
| 1.5 | 17.6 | GO:1900017 | positive regulation of cytokine production involved in inflammatory response(GO:1900017) |
| 1.5 | 5.9 | GO:0060010 | Sertoli cell fate commitment(GO:0060010) |
| 1.5 | 4.4 | GO:0016559 | peroxisome fission(GO:0016559) |
| 1.5 | 4.4 | GO:1900226 | negative regulation of NLRP3 inflammasome complex assembly(GO:1900226) |
| 1.5 | 8.7 | GO:1903232 | melanosome assembly(GO:1903232) |
| 1.4 | 10.1 | GO:0006662 | glycerol ether metabolic process(GO:0006662) |
| 1.4 | 5.8 | GO:0006701 | progesterone biosynthetic process(GO:0006701) |
| 1.4 | 17.2 | GO:0048712 | negative regulation of astrocyte differentiation(GO:0048712) |
| 1.4 | 24.2 | GO:0010763 | positive regulation of fibroblast migration(GO:0010763) |
| 1.4 | 2.8 | GO:1904379 | protein localization to cytosolic proteasome complex(GO:1904327) protein localization to cytosolic proteasome complex involved in ERAD pathway(GO:1904379) |
| 1.4 | 12.7 | GO:0046548 | retinal rod cell development(GO:0046548) |
| 1.4 | 4.2 | GO:0021999 | neural plate anterior/posterior regionalization(GO:0021999) |
| 1.4 | 36.6 | GO:0007597 | blood coagulation, intrinsic pathway(GO:0007597) |
| 1.4 | 8.4 | GO:0002767 | immune response-inhibiting signal transduction(GO:0002765) immune response-inhibiting cell surface receptor signaling pathway(GO:0002767) |
| 1.4 | 2.8 | GO:0060528 | secretory columnal luminar epithelial cell differentiation involved in prostate glandular acinus development(GO:0060528) |
| 1.4 | 11.1 | GO:1900165 | negative regulation of interleukin-6 secretion(GO:1900165) |
| 1.4 | 8.3 | GO:1903799 | negative regulation of production of miRNAs involved in gene silencing by miRNA(GO:1903799) |
| 1.4 | 24.8 | GO:0050860 | negative regulation of T cell receptor signaling pathway(GO:0050860) |
| 1.4 | 46.7 | GO:0007202 | activation of phospholipase C activity(GO:0007202) |
| 1.4 | 12.4 | GO:0000395 | mRNA 5'-splice site recognition(GO:0000395) |
| 1.4 | 13.7 | GO:1902951 | negative regulation of dendritic spine maintenance(GO:1902951) |
| 1.4 | 9.5 | GO:0050882 | voluntary musculoskeletal movement(GO:0050882) |
| 1.4 | 5.4 | GO:0097411 | hypoxia-inducible factor-1alpha signaling pathway(GO:0097411) |
| 1.4 | 8.1 | GO:0001920 | negative regulation of receptor recycling(GO:0001920) |
| 1.4 | 23.0 | GO:0090073 | positive regulation of protein homodimerization activity(GO:0090073) |
| 1.3 | 5.4 | GO:0045347 | negative regulation of MHC class II biosynthetic process(GO:0045347) |
| 1.3 | 9.4 | GO:0008627 | intrinsic apoptotic signaling pathway in response to osmotic stress(GO:0008627) |
| 1.3 | 7.9 | GO:0010732 | protein glutathionylation(GO:0010731) regulation of protein glutathionylation(GO:0010732) negative regulation of protein glutathionylation(GO:0010734) |
| 1.3 | 11.9 | GO:0002295 | T-helper cell lineage commitment(GO:0002295) T-helper 17 cell lineage commitment(GO:0072540) |
| 1.3 | 38.1 | GO:0071108 | protein K48-linked deubiquitination(GO:0071108) |
| 1.3 | 37.8 | GO:0014850 | response to muscle activity(GO:0014850) |
| 1.3 | 7.8 | GO:0071105 | response to interleukin-11(GO:0071105) |
| 1.3 | 2.6 | GO:0071073 | positive regulation of phospholipid biosynthetic process(GO:0071073) regulation of phosphatidylcholine biosynthetic process(GO:2001245) |
| 1.3 | 3.9 | GO:0060907 | positive regulation of macrophage cytokine production(GO:0060907) |
| 1.3 | 5.2 | GO:0002913 | positive regulation of T cell anergy(GO:0002669) positive regulation of lymphocyte anergy(GO:0002913) |
| 1.3 | 3.9 | GO:1990868 | response to chemokine(GO:1990868) cellular response to chemokine(GO:1990869) |
| 1.3 | 7.7 | GO:0038110 | interleukin-2-mediated signaling pathway(GO:0038110) |
| 1.3 | 11.5 | GO:0033088 | negative regulation of immature T cell proliferation in thymus(GO:0033088) |
| 1.3 | 6.4 | GO:0032929 | negative regulation of superoxide anion generation(GO:0032929) |
| 1.3 | 16.5 | GO:0033617 | mitochondrial respiratory chain complex IV assembly(GO:0033617) |
| 1.2 | 12.4 | GO:0033227 | dsRNA transport(GO:0033227) |
| 1.2 | 7.5 | GO:0071692 | sequestering of TGFbeta in extracellular matrix(GO:0035583) protein localization to extracellular region(GO:0071692) maintenance of protein location in extracellular region(GO:0071694) |
| 1.2 | 5.0 | GO:0034154 | toll-like receptor 7 signaling pathway(GO:0034154) |
| 1.2 | 7.4 | GO:0097680 | double-strand break repair via classical nonhomologous end joining(GO:0097680) |
| 1.2 | 3.6 | GO:1901731 | positive regulation of platelet aggregation(GO:1901731) |
| 1.2 | 13.2 | GO:0043249 | erythrocyte maturation(GO:0043249) |
| 1.2 | 8.4 | GO:0042713 | sperm ejaculation(GO:0042713) |
| 1.2 | 3.6 | GO:2000296 | regulation of hydrogen peroxide catabolic process(GO:2000295) negative regulation of hydrogen peroxide catabolic process(GO:2000296) |
| 1.2 | 3.5 | GO:0097576 | vacuole fusion(GO:0097576) |
| 1.2 | 8.3 | GO:0001842 | neural fold formation(GO:0001842) |
| 1.2 | 9.4 | GO:0003190 | atrioventricular valve formation(GO:0003190) |
| 1.2 | 8.2 | GO:0017196 | N-terminal peptidyl-methionine acetylation(GO:0017196) |
| 1.2 | 4.7 | GO:0035936 | androgen secretion(GO:0035935) testosterone secretion(GO:0035936) regulation of androgen secretion(GO:2000834) positive regulation of androgen secretion(GO:2000836) regulation of testosterone secretion(GO:2000843) positive regulation of testosterone secretion(GO:2000845) |
| 1.2 | 9.4 | GO:0042118 | endothelial cell activation(GO:0042118) |
| 1.2 | 7.0 | GO:0034551 | respiratory chain complex III assembly(GO:0017062) mitochondrial respiratory chain complex III assembly(GO:0034551) |
| 1.2 | 4.6 | GO:0007161 | calcium-independent cell-matrix adhesion(GO:0007161) |
| 1.1 | 15.9 | GO:0035970 | peptidyl-threonine dephosphorylation(GO:0035970) |
| 1.1 | 14.8 | GO:0010991 | negative regulation of SMAD protein complex assembly(GO:0010991) |
| 1.1 | 6.8 | GO:0097428 | protein maturation by iron-sulfur cluster transfer(GO:0097428) |
| 1.1 | 71.3 | GO:0006968 | cellular defense response(GO:0006968) |
| 1.1 | 5.5 | GO:0042226 | interleukin-6 biosynthetic process(GO:0042226) |
| 1.1 | 5.5 | GO:0015961 | diadenosine polyphosphate catabolic process(GO:0015961) diphosphoinositol polyphosphate metabolic process(GO:0071543) diadenosine pentaphosphate metabolic process(GO:1901906) diadenosine pentaphosphate catabolic process(GO:1901907) diadenosine hexaphosphate metabolic process(GO:1901908) diadenosine hexaphosphate catabolic process(GO:1901909) adenosine 5'-(hexahydrogen pentaphosphate) metabolic process(GO:1901910) adenosine 5'-(hexahydrogen pentaphosphate) catabolic process(GO:1901911) |
| 1.1 | 28.5 | GO:0097352 | autophagosome maturation(GO:0097352) |
| 1.1 | 8.7 | GO:0043031 | negative regulation of macrophage activation(GO:0043031) |
| 1.1 | 3.3 | GO:0003273 | cell migration involved in endocardial cushion formation(GO:0003273) |
| 1.1 | 3.2 | GO:1901525 | negative regulation of macromitophagy(GO:1901525) |
| 1.1 | 1.1 | GO:0060474 | positive regulation of sperm motility involved in capacitation(GO:0060474) |
| 1.1 | 9.5 | GO:0060670 | branching involved in labyrinthine layer morphogenesis(GO:0060670) |
| 1.0 | 10.5 | GO:0070129 | regulation of mitochondrial translation(GO:0070129) |
| 1.0 | 12.5 | GO:1900028 | negative regulation of ruffle assembly(GO:1900028) |
| 1.0 | 16.7 | GO:0038092 | nodal signaling pathway(GO:0038092) |
| 1.0 | 6.2 | GO:0097338 | response to clozapine(GO:0097338) |
| 1.0 | 3.1 | GO:1902303 | negative regulation of potassium ion export(GO:1902303) |
| 1.0 | 9.3 | GO:0010359 | regulation of anion channel activity(GO:0010359) |
| 1.0 | 2.0 | GO:0070213 | protein auto-ADP-ribosylation(GO:0070213) |
| 1.0 | 19.4 | GO:0043046 | DNA methylation involved in gamete generation(GO:0043046) |
| 1.0 | 12.2 | GO:0015939 | pantothenate metabolic process(GO:0015939) |
| 1.0 | 1.0 | GO:0050955 | thermoception(GO:0050955) |
| 1.0 | 36.5 | GO:0046627 | negative regulation of insulin receptor signaling pathway(GO:0046627) |
| 1.0 | 3.0 | GO:1904491 | protein localization to ciliary transition zone(GO:1904491) |
| 1.0 | 11.1 | GO:0006030 | chitin metabolic process(GO:0006030) chitin catabolic process(GO:0006032) |
| 1.0 | 6.1 | GO:0060684 | epithelial-mesenchymal cell signaling(GO:0060684) |
| 1.0 | 1.0 | GO:0006408 | snRNA export from nucleus(GO:0006408) |
| 1.0 | 3.0 | GO:0050653 | chondroitin sulfate proteoglycan biosynthetic process, polysaccharide chain biosynthetic process(GO:0050653) |
| 1.0 | 8.0 | GO:0045779 | negative regulation of bone resorption(GO:0045779) |
| 1.0 | 7.0 | GO:0046599 | regulation of centriole replication(GO:0046599) |
| 1.0 | 17.9 | GO:0006054 | N-acetylneuraminate metabolic process(GO:0006054) |
| 1.0 | 17.9 | GO:0042036 | negative regulation of cytokine biosynthetic process(GO:0042036) |
| 1.0 | 7.9 | GO:0050857 | positive regulation of antigen receptor-mediated signaling pathway(GO:0050857) |
| 1.0 | 11.8 | GO:0002726 | positive regulation of T cell cytokine production(GO:0002726) |
| 1.0 | 2.9 | GO:0097032 | respiratory chain complex II assembly(GO:0034552) mitochondrial respiratory chain complex II assembly(GO:0034553) mitochondrial respiratory chain complex II biogenesis(GO:0097032) |
| 1.0 | 2.9 | GO:0043654 | recognition of apoptotic cell(GO:0043654) |
| 1.0 | 1.9 | GO:0061357 | positive regulation of Wnt protein secretion(GO:0061357) |
| 1.0 | 8.7 | GO:0032482 | Rab protein signal transduction(GO:0032482) |
| 1.0 | 3.8 | GO:0000023 | maltose metabolic process(GO:0000023) |
| 1.0 | 1.0 | GO:0060769 | positive regulation of epithelial cell proliferation involved in prostate gland development(GO:0060769) |
| 1.0 | 4.8 | GO:0016558 | protein import into peroxisome matrix(GO:0016558) |
| 1.0 | 1.0 | GO:0060019 | radial glial cell differentiation(GO:0060019) |
| 1.0 | 2.9 | GO:0035509 | negative regulation of myosin-light-chain-phosphatase activity(GO:0035509) negative regulation of bicellular tight junction assembly(GO:1903347) |
| 0.9 | 4.7 | GO:0010816 | substance P catabolic process(GO:0010814) calcitonin catabolic process(GO:0010816) endothelin maturation(GO:0034959) |
| 0.9 | 8.5 | GO:0034983 | peptidyl-lysine deacetylation(GO:0034983) |
| 0.9 | 8.5 | GO:0006390 | transcription from mitochondrial promoter(GO:0006390) |
| 0.9 | 2.8 | GO:0071503 | response to heparin(GO:0071503) cellular response to heparin(GO:0071504) |
| 0.9 | 4.7 | GO:1904293 | negative regulation of ERAD pathway(GO:1904293) |
| 0.9 | 13.1 | GO:0006516 | glycoprotein catabolic process(GO:0006516) |
| 0.9 | 2.8 | GO:0002309 | T cell proliferation involved in immune response(GO:0002309) |
| 0.9 | 3.7 | GO:2000152 | regulation of ubiquitin-specific protease activity(GO:2000152) positive regulation of ubiquitin-specific protease activity(GO:2000158) |
| 0.9 | 4.6 | GO:0032510 | endosome to lysosome transport via multivesicular body sorting pathway(GO:0032510) |
| 0.9 | 4.6 | GO:0032025 | response to cobalt ion(GO:0032025) |
| 0.9 | 12.0 | GO:0048298 | positive regulation of isotype switching to IgA isotypes(GO:0048298) |
| 0.9 | 3.7 | GO:0010193 | response to ozone(GO:0010193) |
| 0.9 | 8.2 | GO:0015919 | peroxisomal membrane transport(GO:0015919) |
| 0.9 | 7.3 | GO:0070995 | NADPH oxidation(GO:0070995) |
| 0.9 | 4.5 | GO:0006957 | complement activation, alternative pathway(GO:0006957) |
| 0.9 | 0.9 | GO:0060005 | vestibular reflex(GO:0060005) |
| 0.9 | 6.3 | GO:0098881 | exocytic insertion of neurotransmitter receptor to plasma membrane(GO:0098881) exocytic insertion of neurotransmitter receptor to postsynaptic membrane(GO:0098967) |
| 0.9 | 4.5 | GO:0015742 | alpha-ketoglutarate transport(GO:0015742) |
| 0.9 | 5.4 | GO:0061737 | leukotriene signaling pathway(GO:0061737) |
| 0.9 | 2.7 | GO:0048213 | Golgi vesicle prefusion complex stabilization(GO:0048213) |
| 0.9 | 24.1 | GO:0000188 | inactivation of MAPK activity(GO:0000188) |
| 0.9 | 5.3 | GO:0003402 | planar cell polarity pathway involved in axis elongation(GO:0003402) |
| 0.9 | 2.7 | GO:0032909 | transforming growth factor beta2 production(GO:0032906) regulation of transforming growth factor beta2 production(GO:0032909) |
| 0.9 | 3.5 | GO:0043335 | protein unfolding(GO:0043335) |
| 0.9 | 16.7 | GO:0050930 | induction of positive chemotaxis(GO:0050930) |
| 0.9 | 28.9 | GO:0070207 | protein homotrimerization(GO:0070207) |
| 0.9 | 3.5 | GO:0008063 | Toll signaling pathway(GO:0008063) |
| 0.9 | 8.7 | GO:0051601 | exocyst localization(GO:0051601) |
| 0.9 | 7.8 | GO:0002407 | dendritic cell chemotaxis(GO:0002407) |
| 0.9 | 2.6 | GO:0038156 | interleukin-5-mediated signaling pathway(GO:0038043) interleukin-3-mediated signaling pathway(GO:0038156) |
| 0.9 | 23.3 | GO:0043217 | myelin maintenance(GO:0043217) |
| 0.9 | 13.7 | GO:0018026 | peptidyl-lysine monomethylation(GO:0018026) |
| 0.9 | 4.3 | GO:0048619 | embryonic genitalia morphogenesis(GO:0030538) embryonic hindgut morphogenesis(GO:0048619) |
| 0.9 | 2.6 | GO:0000963 | mitochondrial RNA processing(GO:0000963) |
| 0.8 | 2.5 | GO:0038163 | thrombopoietin-mediated signaling pathway(GO:0038163) |
| 0.8 | 6.7 | GO:0048742 | regulation of skeletal muscle fiber development(GO:0048742) |
| 0.8 | 10.1 | GO:1901898 | negative regulation of relaxation of cardiac muscle(GO:1901898) |
| 0.8 | 5.8 | GO:0070236 | regulation of activation-induced cell death of T cells(GO:0070235) negative regulation of activation-induced cell death of T cells(GO:0070236) |
| 0.8 | 7.5 | GO:0071421 | manganese ion transmembrane transport(GO:0071421) |
| 0.8 | 4.1 | GO:0006432 | phenylalanyl-tRNA aminoacylation(GO:0006432) |
| 0.8 | 3.3 | GO:0035261 | external genitalia morphogenesis(GO:0035261) |
| 0.8 | 5.0 | GO:0006287 | base-excision repair, gap-filling(GO:0006287) |
| 0.8 | 5.8 | GO:0060155 | platelet dense granule organization(GO:0060155) |
| 0.8 | 3.3 | GO:0010966 | regulation of phosphate transport(GO:0010966) |
| 0.8 | 2.5 | GO:0061343 | cell adhesion involved in heart morphogenesis(GO:0061343) |
| 0.8 | 8.2 | GO:0050869 | negative regulation of B cell activation(GO:0050869) |
| 0.8 | 3.3 | GO:0007296 | vitellogenesis(GO:0007296) |
| 0.8 | 3.3 | GO:0070309 | lens fiber cell morphogenesis(GO:0070309) |
| 0.8 | 4.1 | GO:0002693 | positive regulation of cellular extravasation(GO:0002693) |
| 0.8 | 10.6 | GO:0045603 | positive regulation of endothelial cell differentiation(GO:0045603) |
| 0.8 | 3.2 | GO:1902261 | positive regulation of delayed rectifier potassium channel activity(GO:1902261) |
| 0.8 | 18.5 | GO:0030488 | tRNA methylation(GO:0030488) |
| 0.8 | 8.0 | GO:0060287 | epithelial cilium movement involved in determination of left/right asymmetry(GO:0060287) |
| 0.8 | 15.9 | GO:0006895 | Golgi to endosome transport(GO:0006895) |
| 0.8 | 11.1 | GO:0003373 | dynamin polymerization involved in membrane fission(GO:0003373) dynamin polymerization involved in mitochondrial fission(GO:0003374) |
| 0.8 | 3.2 | GO:0019074 | viral genome packaging(GO:0019072) viral RNA genome packaging(GO:0019074) |
| 0.8 | 3.2 | GO:0051934 | dopamine uptake involved in synaptic transmission(GO:0051583) catecholamine uptake involved in synaptic transmission(GO:0051934) catecholamine uptake(GO:0090493) dopamine uptake(GO:0090494) |
| 0.8 | 19.8 | GO:0009435 | NAD biosynthetic process(GO:0009435) |
| 0.8 | 3.2 | GO:0014827 | intestine smooth muscle contraction(GO:0014827) |
| 0.8 | 1.6 | GO:1902285 | sympathetic neuron projection extension(GO:0097490) sympathetic neuron projection guidance(GO:0097491) semaphorin-plexin signaling pathway involved in neuron projection guidance(GO:1902285) |
| 0.8 | 8.6 | GO:0072126 | positive regulation of glomerular mesangial cell proliferation(GO:0072126) |
| 0.8 | 41.6 | GO:0034260 | negative regulation of GTPase activity(GO:0034260) |
| 0.8 | 1.6 | GO:0050968 | detection of chemical stimulus involved in sensory perception of pain(GO:0050968) |
| 0.8 | 8.5 | GO:1901725 | regulation of histone deacetylase activity(GO:1901725) |
| 0.8 | 3.1 | GO:1902231 | positive regulation of intrinsic apoptotic signaling pathway in response to DNA damage(GO:1902231) |
| 0.8 | 3.9 | GO:0000707 | meiotic DNA recombinase assembly(GO:0000707) |
| 0.8 | 5.4 | GO:1902730 | regulation of heparan sulfate proteoglycan biosynthetic process(GO:0010908) positive regulation of heparan sulfate proteoglycan biosynthetic process(GO:0010909) canonical Wnt signaling pathway involved in positive regulation of epithelial to mesenchymal transition(GO:0044334) positive regulation of proteoglycan biosynthetic process(GO:1902730) |
| 0.8 | 3.1 | GO:0000712 | resolution of meiotic recombination intermediates(GO:0000712) |
| 0.8 | 8.4 | GO:0030207 | chondroitin sulfate catabolic process(GO:0030207) |
| 0.8 | 1.5 | GO:0051464 | positive regulation of cortisol secretion(GO:0051464) |
| 0.8 | 5.3 | GO:0006655 | phosphatidylglycerol biosynthetic process(GO:0006655) |
| 0.8 | 4.5 | GO:0070255 | regulation of mucus secretion(GO:0070255) |
| 0.7 | 15.7 | GO:0006853 | carnitine shuttle(GO:0006853) |
| 0.7 | 2.2 | GO:1902474 | positive regulation of protein localization to synapse(GO:1902474) |
| 0.7 | 14.1 | GO:0043508 | negative regulation of JUN kinase activity(GO:0043508) |
| 0.7 | 7.4 | GO:0010867 | positive regulation of triglyceride biosynthetic process(GO:0010867) |
| 0.7 | 11.8 | GO:0034643 | establishment of mitochondrion localization, microtubule-mediated(GO:0034643) mitochondrion transport along microtubule(GO:0047497) |
| 0.7 | 9.6 | GO:0001973 | adenosine receptor signaling pathway(GO:0001973) |
| 0.7 | 45.6 | GO:0032945 | negative regulation of mononuclear cell proliferation(GO:0032945) negative regulation of lymphocyte proliferation(GO:0050672) |
| 0.7 | 2.1 | GO:0045013 | carbon catabolite repression of transcription(GO:0045013) negative regulation of transcription by glucose(GO:0045014) |
| 0.7 | 5.6 | GO:0048535 | lymph node development(GO:0048535) |
| 0.7 | 4.9 | GO:0042791 | 5S class rRNA transcription from RNA polymerase III type 1 promoter(GO:0042791) tRNA transcription from RNA polymerase III promoter(GO:0042797) |
| 0.7 | 18.2 | GO:0002260 | lymphocyte homeostasis(GO:0002260) |
| 0.7 | 0.7 | GO:0021785 | branchiomotor neuron axon guidance(GO:0021785) |
| 0.7 | 7.7 | GO:1902018 | negative regulation of cilium assembly(GO:1902018) |
| 0.7 | 8.3 | GO:1990440 | positive regulation of transcription from RNA polymerase II promoter in response to endoplasmic reticulum stress(GO:1990440) |
| 0.7 | 6.2 | GO:0016226 | iron-sulfur cluster assembly(GO:0016226) metallo-sulfur cluster assembly(GO:0031163) |
| 0.7 | 6.9 | GO:0010663 | positive regulation of striated muscle cell apoptotic process(GO:0010663) positive regulation of cardiac muscle cell apoptotic process(GO:0010666) |
| 0.7 | 6.2 | GO:0009950 | dorsal/ventral axis specification(GO:0009950) |
| 0.7 | 2.1 | GO:0097029 | mature conventional dendritic cell differentiation(GO:0097029) |
| 0.7 | 2.7 | GO:0071550 | death-inducing signaling complex assembly(GO:0071550) |
| 0.7 | 1.4 | GO:0090045 | positive regulation of deacetylase activity(GO:0090045) |
| 0.7 | 4.8 | GO:0006477 | protein sulfation(GO:0006477) |
| 0.7 | 6.8 | GO:0097688 | AMPA glutamate receptor clustering(GO:0097113) glutamate receptor clustering(GO:0097688) |
| 0.7 | 6.8 | GO:0015871 | choline transport(GO:0015871) |
| 0.7 | 4.7 | GO:0006880 | intracellular sequestering of iron ion(GO:0006880) sequestering of iron ion(GO:0097577) |
| 0.7 | 3.4 | GO:0044351 | macropinocytosis(GO:0044351) |
| 0.7 | 2.7 | GO:0032972 | regulation of muscle filament sliding speed(GO:0032972) |
| 0.7 | 0.7 | GO:0001927 | exocyst assembly(GO:0001927) |
| 0.7 | 15.4 | GO:0019731 | antibacterial humoral response(GO:0019731) |
| 0.7 | 2.6 | GO:1900827 | maintenance of protein location in membrane(GO:0072658) maintenance of protein location in plasma membrane(GO:0072660) positive regulation of membrane depolarization during cardiac muscle cell action potential(GO:1900827) |
| 0.7 | 3.3 | GO:0040015 | negative regulation of multicellular organism growth(GO:0040015) |
| 0.7 | 7.2 | GO:0051014 | actin filament severing(GO:0051014) |
| 0.7 | 1.3 | GO:0070842 | aggresome assembly(GO:0070842) |
| 0.7 | 9.8 | GO:0071447 | cellular response to hydroperoxide(GO:0071447) |
| 0.7 | 3.9 | GO:0001550 | ovarian cumulus expansion(GO:0001550) fused antrum stage(GO:0048165) |
| 0.6 | 17.5 | GO:0051646 | mitochondrion localization(GO:0051646) |
| 0.6 | 1.9 | GO:0008614 | pyridoxine metabolic process(GO:0008614) pyridoxine biosynthetic process(GO:0008615) vitamin B6 biosynthetic process(GO:0042819) pyridoxal phosphate metabolic process(GO:0042822) pyridoxal phosphate biosynthetic process(GO:0042823) |
| 0.6 | 9.6 | GO:1904714 | regulation of chaperone-mediated autophagy(GO:1904714) |
| 0.6 | 4.5 | GO:0031998 | regulation of fatty acid beta-oxidation(GO:0031998) |
| 0.6 | 1.9 | GO:0097498 | endothelial tube lumen extension(GO:0097498) |
| 0.6 | 5.8 | GO:0030388 | fructose 1,6-bisphosphate metabolic process(GO:0030388) |
| 0.6 | 3.2 | GO:0090385 | phagosome-lysosome fusion(GO:0090385) |
| 0.6 | 3.2 | GO:0098814 | spontaneous neurotransmitter secretion(GO:0061669) spontaneous synaptic transmission(GO:0098814) |
| 0.6 | 1.9 | GO:1903028 | positive regulation of opsonization(GO:1903028) |
| 0.6 | 1.9 | GO:0071529 | cementum mineralization(GO:0071529) |
| 0.6 | 2.5 | GO:0007183 | SMAD protein complex assembly(GO:0007183) |
| 0.6 | 3.2 | GO:0060666 | dichotomous subdivision of terminal units involved in salivary gland branching(GO:0060666) |
| 0.6 | 2.5 | GO:0035610 | protein side chain deglutamylation(GO:0035610) |
| 0.6 | 16.4 | GO:0050651 | dermatan sulfate proteoglycan biosynthetic process(GO:0050651) |
| 0.6 | 15.8 | GO:0034776 | response to histamine(GO:0034776) cellular response to histamine(GO:0071420) |
| 0.6 | 5.6 | GO:1900122 | positive regulation of receptor binding(GO:1900122) |
| 0.6 | 1.9 | GO:0042780 | tRNA 3'-end processing(GO:0042780) |
| 0.6 | 9.3 | GO:0019934 | cGMP-mediated signaling(GO:0019934) |
| 0.6 | 3.1 | GO:0021891 | olfactory bulb interneuron development(GO:0021891) |
| 0.6 | 1.2 | GO:0001555 | oocyte growth(GO:0001555) |
| 0.6 | 11.0 | GO:0033539 | fatty acid beta-oxidation using acyl-CoA dehydrogenase(GO:0033539) |
| 0.6 | 28.0 | GO:0006953 | acute-phase response(GO:0006953) |
| 0.6 | 0.6 | GO:0002730 | regulation of dendritic cell cytokine production(GO:0002730) |
| 0.6 | 12.7 | GO:2000369 | regulation of clathrin-mediated endocytosis(GO:2000369) |
| 0.6 | 3.6 | GO:1990253 | cellular response to leucine starvation(GO:1990253) |
| 0.6 | 10.2 | GO:0015671 | oxygen transport(GO:0015671) |
| 0.6 | 3.6 | GO:0043435 | response to corticotropin-releasing hormone(GO:0043435) cellular response to corticotropin-releasing hormone stimulus(GO:0071376) |
| 0.6 | 1.2 | GO:0043950 | positive regulation of cAMP-mediated signaling(GO:0043950) |
| 0.6 | 22.1 | GO:0018149 | peptide cross-linking(GO:0018149) |
| 0.6 | 8.9 | GO:0070070 | proton-transporting V-type ATPase complex assembly(GO:0070070) vacuolar proton-transporting V-type ATPase complex assembly(GO:0070072) |
| 0.6 | 1.2 | GO:0060352 | cell adhesion molecule production(GO:0060352) |
| 0.6 | 0.6 | GO:0051673 | membrane disruption in other organism(GO:0051673) |
| 0.6 | 77.1 | GO:0002455 | humoral immune response mediated by circulating immunoglobulin(GO:0002455) |
| 0.6 | 3.5 | GO:0042487 | regulation of odontogenesis of dentin-containing tooth(GO:0042487) |
| 0.6 | 9.9 | GO:0010447 | response to acidic pH(GO:0010447) |
| 0.6 | 4.0 | GO:0010968 | regulation of microtubule nucleation(GO:0010968) |
| 0.6 | 2.9 | GO:0002138 | retinoic acid biosynthetic process(GO:0002138) |
| 0.6 | 15.5 | GO:0042572 | retinol metabolic process(GO:0042572) |
| 0.6 | 0.6 | GO:0046015 | regulation of transcription by glucose(GO:0046015) |
| 0.6 | 8.5 | GO:2001224 | positive regulation of neuron migration(GO:2001224) |
| 0.6 | 9.5 | GO:0010826 | negative regulation of centrosome duplication(GO:0010826) |
| 0.6 | 3.9 | GO:0032534 | regulation of microvillus assembly(GO:0032534) |
| 0.6 | 7.2 | GO:1902083 | negative regulation of peptidyl-cysteine S-nitrosylation(GO:1902083) |
| 0.6 | 4.4 | GO:0044341 | sodium-dependent phosphate transport(GO:0044341) |
| 0.6 | 3.9 | GO:0071318 | cellular response to ATP(GO:0071318) |
| 0.6 | 1.1 | GO:0071499 | cellular response to laminar fluid shear stress(GO:0071499) |
| 0.5 | 3.2 | GO:0035063 | nuclear speck organization(GO:0035063) |
| 0.5 | 16.2 | GO:0006693 | prostanoid metabolic process(GO:0006692) prostaglandin metabolic process(GO:0006693) |
| 0.5 | 4.8 | GO:0042905 | 9-cis-retinoic acid biosynthetic process(GO:0042904) 9-cis-retinoic acid metabolic process(GO:0042905) |
| 0.5 | 1.1 | GO:0038086 | VEGF-activated platelet-derived growth factor receptor signaling pathway(GO:0038086) positive regulation of cell proliferation by VEGF-activated platelet derived growth factor receptor signaling pathway(GO:0038091) |
| 0.5 | 5.8 | GO:0006108 | malate metabolic process(GO:0006108) |
| 0.5 | 4.8 | GO:0006702 | androgen biosynthetic process(GO:0006702) |
| 0.5 | 17.4 | GO:0043984 | histone H4-K16 acetylation(GO:0043984) |
| 0.5 | 1.6 | GO:0060974 | neural crest cell migration involved in heart formation(GO:0003147) cell migration involved in heart formation(GO:0060974) anterior neural tube closure(GO:0061713) |
| 0.5 | 2.6 | GO:0014050 | negative regulation of glutamate secretion(GO:0014050) |
| 0.5 | 3.2 | GO:0042554 | superoxide anion generation(GO:0042554) |
| 0.5 | 2.1 | GO:0030035 | microspike assembly(GO:0030035) |
| 0.5 | 4.7 | GO:0051045 | negative regulation of membrane protein ectodomain proteolysis(GO:0051045) |
| 0.5 | 11.0 | GO:0032729 | positive regulation of interferon-gamma production(GO:0032729) |
| 0.5 | 6.3 | GO:0060716 | labyrinthine layer blood vessel development(GO:0060716) |
| 0.5 | 6.2 | GO:1900745 | positive regulation of p38MAPK cascade(GO:1900745) |
| 0.5 | 2.6 | GO:0071285 | cellular response to lithium ion(GO:0071285) |
| 0.5 | 2.6 | GO:0032703 | negative regulation of interleukin-2 production(GO:0032703) |
| 0.5 | 2.1 | GO:0045163 | clustering of voltage-gated potassium channels(GO:0045163) |
| 0.5 | 0.5 | GO:0019918 | peptidyl-arginine methylation, to symmetrical-dimethyl arginine(GO:0019918) |
| 0.5 | 2.0 | GO:2000297 | negative regulation of synapse maturation(GO:2000297) |
| 0.5 | 6.6 | GO:0010668 | ectodermal cell differentiation(GO:0010668) |
| 0.5 | 4.6 | GO:2000124 | regulation of endocannabinoid signaling pathway(GO:2000124) |
| 0.5 | 4.1 | GO:0007398 | ectoderm development(GO:0007398) |
| 0.5 | 9.1 | GO:0048820 | hair follicle maturation(GO:0048820) |
| 0.5 | 3.0 | GO:0006196 | AMP catabolic process(GO:0006196) |
| 0.5 | 2.5 | GO:0035247 | peptidyl-arginine methylation, to asymmetrical-dimethyl arginine(GO:0019919) peptidyl-arginine omega-N-methylation(GO:0035247) |
| 0.5 | 0.5 | GO:0007412 | axon target recognition(GO:0007412) |
| 0.5 | 2.0 | GO:0021798 | forebrain dorsal/ventral pattern formation(GO:0021798) |
| 0.5 | 4.5 | GO:0043951 | negative regulation of cAMP-mediated signaling(GO:0043951) |
| 0.5 | 8.9 | GO:0042116 | macrophage activation(GO:0042116) |
| 0.5 | 3.0 | GO:0030157 | pancreatic juice secretion(GO:0030157) |
| 0.5 | 1.0 | GO:0033594 | response to hydroxyisoflavone(GO:0033594) |
| 0.5 | 4.4 | GO:0060363 | cranial suture morphogenesis(GO:0060363) |
| 0.5 | 2.9 | GO:0032695 | negative regulation of interleukin-12 production(GO:0032695) |
| 0.5 | 3.9 | GO:0007288 | sperm axoneme assembly(GO:0007288) |
| 0.5 | 4.4 | GO:2000582 | regulation of ATP-dependent microtubule motor activity, plus-end-directed(GO:2000580) positive regulation of ATP-dependent microtubule motor activity, plus-end-directed(GO:2000582) |
| 0.5 | 2.4 | GO:0071864 | regulation of cell proliferation in bone marrow(GO:0071863) positive regulation of cell proliferation in bone marrow(GO:0071864) |
| 0.5 | 1.0 | GO:0071280 | cellular response to copper ion(GO:0071280) |
| 0.5 | 11.1 | GO:0051457 | maintenance of protein location in nucleus(GO:0051457) |
| 0.5 | 5.3 | GO:0035878 | nail development(GO:0035878) |
| 0.5 | 1.9 | GO:0015811 | L-cystine transport(GO:0015811) |
| 0.5 | 13.8 | GO:0000470 | maturation of LSU-rRNA(GO:0000470) |
| 0.5 | 3.3 | GO:0045007 | depurination(GO:0045007) |
| 0.5 | 1.9 | GO:0046125 | thymidine metabolic process(GO:0046104) pyrimidine deoxyribonucleoside metabolic process(GO:0046125) |
| 0.5 | 0.5 | GO:0051481 | negative regulation of cytosolic calcium ion concentration(GO:0051481) |
| 0.5 | 3.8 | GO:0014877 | response to muscle inactivity involved in regulation of muscle adaptation(GO:0014877) response to denervation involved in regulation of muscle adaptation(GO:0014894) |
| 0.5 | 1.4 | GO:0039022 | pronephric nephron morphogenesis(GO:0039007) pronephric nephron tubule morphogenesis(GO:0039008) pronephric duct development(GO:0039022) pronephric duct morphogenesis(GO:0039023) Kupffer's vesicle development(GO:0070121) |
| 0.5 | 9.0 | GO:0007158 | neuron cell-cell adhesion(GO:0007158) |
| 0.5 | 6.1 | GO:0006265 | DNA topological change(GO:0006265) |
| 0.5 | 2.4 | GO:0060154 | cellular process regulating host cell cycle in response to virus(GO:0060154) |
| 0.5 | 2.3 | GO:0045986 | negative regulation of smooth muscle contraction(GO:0045986) |
| 0.5 | 5.2 | GO:0070445 | oligodendrocyte progenitor proliferation(GO:0070444) regulation of oligodendrocyte progenitor proliferation(GO:0070445) |
| 0.5 | 5.6 | GO:0048873 | homeostasis of number of cells within a tissue(GO:0048873) |
| 0.5 | 6.1 | GO:0007258 | JUN phosphorylation(GO:0007258) |
| 0.5 | 11.7 | GO:0045648 | positive regulation of erythrocyte differentiation(GO:0045648) |
| 0.5 | 0.9 | GO:1990418 | response to insulin-like growth factor stimulus(GO:1990418) |
| 0.5 | 5.6 | GO:0016576 | histone dephosphorylation(GO:0016576) |
| 0.5 | 1.9 | GO:0032900 | viral protein processing(GO:0019082) negative regulation of neurotrophin production(GO:0032900) regulation of nerve growth factor production(GO:0032903) negative regulation of nerve growth factor production(GO:0032904) dibasic protein processing(GO:0090472) |
| 0.5 | 10.2 | GO:0090200 | positive regulation of release of cytochrome c from mitochondria(GO:0090200) |
| 0.5 | 7.3 | GO:0008340 | determination of adult lifespan(GO:0008340) |
| 0.5 | 4.1 | GO:0032688 | negative regulation of interferon-beta production(GO:0032688) |
| 0.5 | 7.3 | GO:0060325 | face morphogenesis(GO:0060325) |
| 0.5 | 12.2 | GO:0032011 | ARF protein signal transduction(GO:0032011) |
| 0.5 | 2.3 | GO:0034392 | negative regulation of smooth muscle cell apoptotic process(GO:0034392) |
| 0.4 | 1.3 | GO:1990834 | response to odorant(GO:1990834) |
| 0.4 | 1.3 | GO:0071934 | thiamine transport(GO:0015888) thiamine transmembrane transport(GO:0071934) |
| 0.4 | 3.1 | GO:0006929 | substrate-dependent cell migration(GO:0006929) |
| 0.4 | 16.0 | GO:0033173 | calcineurin-NFAT signaling cascade(GO:0033173) |
| 0.4 | 8.0 | GO:0009812 | flavonoid metabolic process(GO:0009812) |
| 0.4 | 1.3 | GO:0000019 | regulation of mitotic recombination(GO:0000019) |
| 0.4 | 1.3 | GO:0015860 | purine nucleoside transmembrane transport(GO:0015860) |
| 0.4 | 12.3 | GO:0048247 | lymphocyte chemotaxis(GO:0048247) |
| 0.4 | 10.5 | GO:0007616 | long-term memory(GO:0007616) |
| 0.4 | 2.2 | GO:0097094 | craniofacial suture morphogenesis(GO:0097094) |
| 0.4 | 10.0 | GO:2000249 | regulation of actin cytoskeleton reorganization(GO:2000249) |
| 0.4 | 24.7 | GO:0050771 | negative regulation of axonogenesis(GO:0050771) |
| 0.4 | 0.9 | GO:0032306 | regulation of prostaglandin secretion(GO:0032306) positive regulation of prostaglandin secretion(GO:0032308) |
| 0.4 | 12.1 | GO:0006706 | steroid catabolic process(GO:0006706) |
| 0.4 | 3.0 | GO:0061469 | regulation of type B pancreatic cell proliferation(GO:0061469) |
| 0.4 | 6.0 | GO:0099514 | anterograde synaptic vesicle transport(GO:0048490) synaptic vesicle cytoskeletal transport(GO:0099514) synaptic vesicle transport along microtubule(GO:0099517) |
| 0.4 | 2.6 | GO:1904720 | regulation of mRNA cleavage(GO:0031437) negative regulation of mRNA cleavage(GO:0031438) negative regulation of immunoglobulin secretion(GO:0051025) regulation of mRNA endonucleolytic cleavage involved in unfolded protein response(GO:1904720) negative regulation of mRNA endonucleolytic cleavage involved in unfolded protein response(GO:1904721) |
| 0.4 | 7.7 | GO:0021819 | layer formation in cerebral cortex(GO:0021819) |
| 0.4 | 3.4 | GO:2001053 | regulation of mesenchymal cell apoptotic process(GO:2001053) |
| 0.4 | 0.9 | GO:1900220 | semaphorin-plexin signaling pathway involved in bone trabecula morphogenesis(GO:1900220) |
| 0.4 | 10.7 | GO:0048854 | brain morphogenesis(GO:0048854) |
| 0.4 | 6.8 | GO:0030220 | platelet formation(GO:0030220) |
| 0.4 | 4.2 | GO:0042789 | mRNA transcription from RNA polymerase II promoter(GO:0042789) |
| 0.4 | 0.8 | GO:0033122 | negative regulation of cyclic nucleotide catabolic process(GO:0030806) negative regulation of cAMP catabolic process(GO:0030821) negative regulation of purine nucleotide catabolic process(GO:0033122) |
| 0.4 | 12.5 | GO:0007257 | activation of JUN kinase activity(GO:0007257) |
| 0.4 | 0.4 | GO:0000393 | spliceosomal conformational changes to generate catalytic conformation(GO:0000393) |
| 0.4 | 3.3 | GO:0071361 | cellular response to ethanol(GO:0071361) |
| 0.4 | 15.3 | GO:0009214 | cyclic nucleotide catabolic process(GO:0009214) |
| 0.4 | 3.7 | GO:0060137 | maternal process involved in parturition(GO:0060137) |
| 0.4 | 1.6 | GO:0001867 | complement activation, lectin pathway(GO:0001867) |
| 0.4 | 2.4 | GO:0060037 | pharyngeal system development(GO:0060037) |
| 0.4 | 17.5 | GO:0070301 | cellular response to hydrogen peroxide(GO:0070301) |
| 0.4 | 4.0 | GO:0035330 | regulation of hippo signaling(GO:0035330) |
| 0.4 | 1.6 | GO:0006651 | diacylglycerol biosynthetic process(GO:0006651) |
| 0.4 | 5.5 | GO:0002286 | T cell activation involved in immune response(GO:0002286) |
| 0.4 | 14.2 | GO:0006505 | GPI anchor metabolic process(GO:0006505) GPI anchor biosynthetic process(GO:0006506) |
| 0.4 | 3.2 | GO:0045008 | depyrimidination(GO:0045008) |
| 0.4 | 5.5 | GO:0046033 | AMP metabolic process(GO:0046033) |
| 0.4 | 0.8 | GO:0072539 | T-helper 17 cell differentiation(GO:0072539) |
| 0.4 | 1.6 | GO:0033141 | positive regulation of peptidyl-serine phosphorylation of STAT protein(GO:0033141) |
| 0.4 | 2.7 | GO:0001865 | NK T cell differentiation(GO:0001865) |
| 0.4 | 6.2 | GO:0019835 | cytolysis(GO:0019835) |
| 0.4 | 4.3 | GO:0098787 | mRNA cleavage involved in mRNA processing(GO:0098787) pre-mRNA cleavage required for polyadenylation(GO:0098789) |
| 0.4 | 9.3 | GO:0010996 | response to auditory stimulus(GO:0010996) |
| 0.4 | 3.1 | GO:0017183 | peptidyl-diphthamide metabolic process(GO:0017182) peptidyl-diphthamide biosynthetic process from peptidyl-histidine(GO:0017183) |
| 0.4 | 6.1 | GO:0071850 | mitotic cell cycle arrest(GO:0071850) |
| 0.4 | 27.6 | GO:0010923 | negative regulation of phosphatase activity(GO:0010923) |
| 0.4 | 1.2 | GO:0039534 | negative regulation of MDA-5 signaling pathway(GO:0039534) |
| 0.4 | 11.4 | GO:0007194 | negative regulation of adenylate cyclase activity(GO:0007194) |
| 0.4 | 2.3 | GO:1990845 | adaptive thermogenesis(GO:1990845) |
| 0.4 | 0.4 | GO:0045065 | cytotoxic T cell differentiation(GO:0045065) |
| 0.4 | 2.6 | GO:0007042 | lysosomal lumen acidification(GO:0007042) |
| 0.4 | 2.2 | GO:1904879 | positive regulation of calcium ion transmembrane transport via high voltage-gated calcium channel(GO:1904879) |
| 0.4 | 4.0 | GO:0070932 | histone H3 deacetylation(GO:0070932) |
| 0.4 | 0.7 | GO:0009822 | alkaloid catabolic process(GO:0009822) |
| 0.4 | 4.6 | GO:0050812 | regulation of acyl-CoA biosynthetic process(GO:0050812) |
| 0.4 | 8.6 | GO:0090004 | positive regulation of establishment of protein localization to plasma membrane(GO:0090004) |
| 0.4 | 1.8 | GO:0030949 | positive regulation of vascular endothelial growth factor receptor signaling pathway(GO:0030949) |
| 0.4 | 2.1 | GO:0098795 | mRNA cleavage involved in gene silencing by miRNA(GO:0035279) mRNA cleavage involved in gene silencing by siRNA(GO:0090625) mRNA cleavage involved in gene silencing(GO:0098795) |
| 0.3 | 11.9 | GO:0008038 | neuron recognition(GO:0008038) |
| 0.3 | 8.7 | GO:0070098 | chemokine-mediated signaling pathway(GO:0070098) |
| 0.3 | 1.7 | GO:0010669 | epithelial structure maintenance(GO:0010669) |
| 0.3 | 3.8 | GO:0044829 | positive regulation by host of viral genome replication(GO:0044829) |
| 0.3 | 3.7 | GO:0048251 | elastic fiber assembly(GO:0048251) |
| 0.3 | 3.4 | GO:0031848 | protection from non-homologous end joining at telomere(GO:0031848) |
| 0.3 | 3.0 | GO:0034142 | toll-like receptor 4 signaling pathway(GO:0034142) |
| 0.3 | 5.7 | GO:0080111 | DNA demethylation(GO:0080111) |
| 0.3 | 1.3 | GO:0071625 | vocalization behavior(GO:0071625) |
| 0.3 | 10.6 | GO:0050848 | regulation of calcium-mediated signaling(GO:0050848) |
| 0.3 | 3.0 | GO:0009642 | response to light intensity(GO:0009642) |
| 0.3 | 2.6 | GO:0060484 | lung-associated mesenchyme development(GO:0060484) |
| 0.3 | 3.9 | GO:0050908 | detection of light stimulus involved in visual perception(GO:0050908) detection of light stimulus involved in sensory perception(GO:0050962) |
| 0.3 | 0.3 | GO:0038145 | macrophage colony-stimulating factor signaling pathway(GO:0038145) |
| 0.3 | 0.7 | GO:0042501 | serine phosphorylation of STAT protein(GO:0042501) |
| 0.3 | 22.7 | GO:0030574 | collagen catabolic process(GO:0030574) |
| 0.3 | 1.6 | GO:0050868 | negative regulation of T cell activation(GO:0050868) |
| 0.3 | 1.3 | GO:0034380 | high-density lipoprotein particle assembly(GO:0034380) |
| 0.3 | 2.9 | GO:0099500 | synaptic vesicle fusion to presynaptic active zone membrane(GO:0031629) vesicle fusion to plasma membrane(GO:0099500) |
| 0.3 | 2.9 | GO:0050774 | negative regulation of dendrite morphogenesis(GO:0050774) |
| 0.3 | 7.4 | GO:0001580 | detection of chemical stimulus involved in sensory perception of bitter taste(GO:0001580) |
| 0.3 | 3.5 | GO:0042737 | drug catabolic process(GO:0042737) |
| 0.3 | 7.6 | GO:0035176 | social behavior(GO:0035176) intraspecies interaction between organisms(GO:0051703) |
| 0.3 | 0.6 | GO:0071671 | regulation of smooth muscle cell chemotaxis(GO:0071671) |
| 0.3 | 0.6 | GO:0001840 | neural plate development(GO:0001840) |
| 0.3 | 4.1 | GO:0061436 | establishment of skin barrier(GO:0061436) |
| 0.3 | 3.8 | GO:0035025 | positive regulation of Rho protein signal transduction(GO:0035025) |
| 0.3 | 8.4 | GO:0006699 | bile acid biosynthetic process(GO:0006699) |
| 0.3 | 0.9 | GO:1902430 | negative regulation of beta-amyloid formation(GO:1902430) |
| 0.3 | 2.8 | GO:2000781 | positive regulation of double-strand break repair(GO:2000781) |
| 0.3 | 0.9 | GO:0061591 | calcium activated phospholipid scrambling(GO:0061588) calcium activated phosphatidylcholine scrambling(GO:0061590) calcium activated galactosylceramide scrambling(GO:0061591) |
| 0.3 | 4.3 | GO:2000505 | regulation of energy homeostasis(GO:2000505) |
| 0.3 | 1.5 | GO:0010832 | negative regulation of myotube differentiation(GO:0010832) |
| 0.3 | 4.9 | GO:0070498 | interleukin-1-mediated signaling pathway(GO:0070498) |
| 0.3 | 0.3 | GO:0048537 | mucosal-associated lymphoid tissue development(GO:0048537) Peyer's patch development(GO:0048541) Peyer's patch morphogenesis(GO:0061146) |
| 0.3 | 1.2 | GO:0048630 | skeletal muscle tissue growth(GO:0048630) |
| 0.3 | 2.1 | GO:0042756 | drinking behavior(GO:0042756) |
| 0.3 | 1.5 | GO:0021957 | corticospinal tract morphogenesis(GO:0021957) |
| 0.3 | 2.9 | GO:0071526 | semaphorin-plexin signaling pathway(GO:0071526) |
| 0.3 | 0.6 | GO:0002578 | negative regulation of antigen processing and presentation(GO:0002578) |
| 0.3 | 6.2 | GO:0035082 | axoneme assembly(GO:0035082) |
| 0.3 | 14.5 | GO:0051965 | positive regulation of synapse assembly(GO:0051965) |
| 0.3 | 5.8 | GO:0007157 | heterophilic cell-cell adhesion via plasma membrane cell adhesion molecules(GO:0007157) |
| 0.3 | 4.1 | GO:0046339 | diacylglycerol metabolic process(GO:0046339) |
| 0.3 | 2.0 | GO:0051775 | response to redox state(GO:0051775) |
| 0.3 | 8.5 | GO:0071260 | cellular response to mechanical stimulus(GO:0071260) |
| 0.3 | 1.7 | GO:2000096 | positive regulation of Wnt signaling pathway, planar cell polarity pathway(GO:2000096) |
| 0.3 | 1.7 | GO:0033314 | mitotic DNA replication checkpoint(GO:0033314) |
| 0.3 | 1.7 | GO:0060075 | regulation of resting membrane potential(GO:0060075) |
| 0.3 | 1.4 | GO:0015842 | aminergic neurotransmitter loading into synaptic vesicle(GO:0015842) |
| 0.3 | 2.2 | GO:0006685 | sphingomyelin catabolic process(GO:0006685) |
| 0.3 | 4.1 | GO:0014047 | glutamate secretion(GO:0014047) |
| 0.3 | 8.3 | GO:0070306 | lens fiber cell differentiation(GO:0070306) |
| 0.3 | 2.7 | GO:0016264 | gap junction assembly(GO:0016264) |
| 0.3 | 68.2 | GO:0051056 | regulation of small GTPase mediated signal transduction(GO:0051056) |
| 0.3 | 5.2 | GO:0007223 | Wnt signaling pathway, calcium modulating pathway(GO:0007223) |
| 0.3 | 2.2 | GO:0043507 | positive regulation of JUN kinase activity(GO:0043507) |
| 0.3 | 0.8 | GO:0018101 | protein citrullination(GO:0018101) histone citrullination(GO:0036414) |
| 0.3 | 22.2 | GO:0060337 | type I interferon signaling pathway(GO:0060337) cellular response to type I interferon(GO:0071357) |
| 0.3 | 1.1 | GO:0072530 | purine-containing compound transmembrane transport(GO:0072530) |
| 0.3 | 4.4 | GO:0031167 | rRNA methylation(GO:0031167) |
| 0.3 | 1.3 | GO:0070162 | adiponectin secretion(GO:0070162) regulation of adiponectin secretion(GO:0070163) negative regulation of adiponectin secretion(GO:0070164) |
| 0.3 | 3.4 | GO:0035411 | catenin import into nucleus(GO:0035411) |
| 0.3 | 1.0 | GO:0009138 | pyrimidine nucleoside diphosphate metabolic process(GO:0009138) |
| 0.3 | 3.8 | GO:0006004 | fucose metabolic process(GO:0006004) |
| 0.3 | 0.8 | GO:1904017 | cellular response to Thyroglobulin triiodothyronine(GO:1904017) |
| 0.3 | 1.8 | GO:0045721 | negative regulation of gluconeogenesis(GO:0045721) |
| 0.2 | 1.5 | GO:0006565 | L-serine catabolic process(GO:0006565) |
| 0.2 | 1.0 | GO:2000833 | positive regulation of steroid hormone secretion(GO:2000833) positive regulation of corticosteroid hormone secretion(GO:2000848) |
| 0.2 | 1.2 | GO:0000491 | small nucleolar ribonucleoprotein complex assembly(GO:0000491) |
| 0.2 | 3.1 | GO:0032098 | regulation of appetite(GO:0032098) |
| 0.2 | 1.7 | GO:0002052 | positive regulation of neuroblast proliferation(GO:0002052) |
| 0.2 | 1.2 | GO:0086043 | bundle of His cell to Purkinje myocyte signaling(GO:0086028) bundle of His cell action potential(GO:0086043) |
| 0.2 | 1.4 | GO:0042539 | hypotonic salinity response(GO:0042539) cellular hypotonic salinity response(GO:0071477) |
| 0.2 | 1.4 | GO:1903898 | negative regulation of PERK-mediated unfolded protein response(GO:1903898) |
| 0.2 | 3.6 | GO:0051382 | kinetochore assembly(GO:0051382) |
| 0.2 | 2.3 | GO:0042104 | positive regulation of activated T cell proliferation(GO:0042104) |
| 0.2 | 0.9 | GO:0048861 | leukemia inhibitory factor signaling pathway(GO:0048861) |
| 0.2 | 0.7 | GO:0019075 | virus maturation(GO:0019075) |
| 0.2 | 2.9 | GO:2000622 | regulation of nuclear-transcribed mRNA catabolic process, nonsense-mediated decay(GO:2000622) negative regulation of nuclear-transcribed mRNA catabolic process, nonsense-mediated decay(GO:2000623) |
| 0.2 | 5.0 | GO:0035249 | synaptic transmission, glutamatergic(GO:0035249) |
| 0.2 | 1.3 | GO:2000189 | positive regulation of cholesterol homeostasis(GO:2000189) |
| 0.2 | 2.3 | GO:0036148 | phosphatidylglycerol acyl-chain remodeling(GO:0036148) |
| 0.2 | 2.9 | GO:0045494 | photoreceptor cell maintenance(GO:0045494) |
| 0.2 | 2.1 | GO:0006657 | CDP-choline pathway(GO:0006657) |
| 0.2 | 1.4 | GO:0006537 | glutamate biosynthetic process(GO:0006537) |
| 0.2 | 1.2 | GO:0046618 | drug export(GO:0046618) |
| 0.2 | 2.4 | GO:0046449 | creatinine metabolic process(GO:0046449) |
| 0.2 | 5.7 | GO:0006400 | tRNA modification(GO:0006400) |
| 0.2 | 1.0 | GO:0038169 | somatostatin receptor signaling pathway(GO:0038169) somatostatin signaling pathway(GO:0038170) |
| 0.2 | 5.8 | GO:0009083 | branched-chain amino acid metabolic process(GO:0009081) branched-chain amino acid catabolic process(GO:0009083) |
| 0.2 | 7.7 | GO:0001523 | retinoid metabolic process(GO:0001523) |
| 0.2 | 5.4 | GO:0071377 | cellular response to glucagon stimulus(GO:0071377) |
| 0.2 | 2.5 | GO:0044364 | killing of cells of other organism(GO:0031640) disruption of cells of other organism(GO:0044364) |
| 0.2 | 0.7 | GO:0060252 | positive regulation of glial cell proliferation(GO:0060252) |
| 0.2 | 0.5 | GO:0009051 | pentose-phosphate shunt, oxidative branch(GO:0009051) |
| 0.2 | 8.8 | GO:0050870 | positive regulation of T cell activation(GO:0050870) |
| 0.2 | 0.5 | GO:0002467 | germinal center formation(GO:0002467) |
| 0.2 | 1.9 | GO:0034219 | carbohydrate transmembrane transport(GO:0034219) |
| 0.2 | 2.1 | GO:0040019 | positive regulation of embryonic development(GO:0040019) |
| 0.2 | 3.4 | GO:0048009 | insulin-like growth factor receptor signaling pathway(GO:0048009) |
| 0.2 | 2.0 | GO:0042753 | positive regulation of circadian rhythm(GO:0042753) |
| 0.2 | 1.8 | GO:0000244 | spliceosomal tri-snRNP complex assembly(GO:0000244) |
| 0.2 | 4.5 | GO:0038083 | peptidyl-tyrosine autophosphorylation(GO:0038083) |
| 0.2 | 2.0 | GO:0048147 | negative regulation of fibroblast proliferation(GO:0048147) |
| 0.2 | 5.3 | GO:0048791 | calcium ion-regulated exocytosis of neurotransmitter(GO:0048791) |
| 0.2 | 2.0 | GO:0006590 | thyroid hormone generation(GO:0006590) |
| 0.2 | 1.2 | GO:0039702 | viral budding via host ESCRT complex(GO:0039702) |
| 0.2 | 8.4 | GO:0030010 | establishment of cell polarity(GO:0030010) |
| 0.2 | 0.9 | GO:0006398 | mRNA 3'-end processing by stem-loop binding and cleavage(GO:0006398) |
| 0.2 | 7.0 | GO:0006730 | one-carbon metabolic process(GO:0006730) |
| 0.2 | 2.4 | GO:0006622 | protein targeting to lysosome(GO:0006622) |
| 0.1 | 5.1 | GO:0046835 | carbohydrate phosphorylation(GO:0046835) |
| 0.1 | 0.9 | GO:0036342 | post-anal tail morphogenesis(GO:0036342) |
| 0.1 | 1.0 | GO:0042985 | negative regulation of amyloid precursor protein biosynthetic process(GO:0042985) |
| 0.1 | 1.1 | GO:0044804 | nucleophagy(GO:0044804) |
| 0.1 | 1.7 | GO:0070670 | response to interleukin-4(GO:0070670) cellular response to interleukin-4(GO:0071353) |
| 0.1 | 0.8 | GO:0007168 | receptor guanylyl cyclase signaling pathway(GO:0007168) |
| 0.1 | 1.1 | GO:0006600 | creatine metabolic process(GO:0006600) |
| 0.1 | 7.6 | GO:0003333 | amino acid transmembrane transport(GO:0003333) |
| 0.1 | 0.8 | GO:0035616 | histone H2B conserved C-terminal lysine deubiquitination(GO:0035616) |
| 0.1 | 3.9 | GO:0046928 | regulation of neurotransmitter secretion(GO:0046928) |
| 0.1 | 1.2 | GO:0090161 | Golgi ribbon formation(GO:0090161) |
| 0.1 | 3.1 | GO:2000181 | negative regulation of angiogenesis(GO:0016525) negative regulation of blood vessel morphogenesis(GO:2000181) |
| 0.1 | 0.9 | GO:0006116 | NADH oxidation(GO:0006116) |
| 0.1 | 18.8 | GO:0002250 | adaptive immune response(GO:0002250) |
| 0.1 | 0.2 | GO:0033564 | anterior/posterior axon guidance(GO:0033564) |
| 0.1 | 2.3 | GO:0007520 | myoblast fusion(GO:0007520) |
| 0.1 | 2.7 | GO:0035115 | embryonic forelimb morphogenesis(GO:0035115) |
| 0.1 | 1.3 | GO:0034447 | very-low-density lipoprotein particle clearance(GO:0034447) |
| 0.1 | 0.7 | GO:0007625 | grooming behavior(GO:0007625) |
| 0.1 | 0.6 | GO:0050966 | detection of mechanical stimulus involved in sensory perception of pain(GO:0050966) |
| 0.1 | 2.6 | GO:0097503 | sialylation(GO:0097503) |
| 0.1 | 1.8 | GO:0032732 | positive regulation of interleukin-1 beta production(GO:0032731) positive regulation of interleukin-1 production(GO:0032732) |
| 0.1 | 0.6 | GO:0034770 | histone H4-K20 methylation(GO:0034770) |
| 0.1 | 2.8 | GO:0016486 | peptide hormone processing(GO:0016486) |
| 0.1 | 2.1 | GO:0031648 | protein destabilization(GO:0031648) |
| 0.1 | 0.8 | GO:0048265 | response to pain(GO:0048265) |
| 0.1 | 0.9 | GO:0042953 | lipoprotein transport(GO:0042953) lipoprotein localization(GO:0044872) |
| 0.1 | 0.3 | GO:0072396 | response to cell cycle checkpoint signaling(GO:0072396) response to DNA integrity checkpoint signaling(GO:0072402) response to DNA damage checkpoint signaling(GO:0072423) |
| 0.1 | 1.0 | GO:0060397 | JAK-STAT cascade involved in growth hormone signaling pathway(GO:0060397) |
| 0.1 | 0.4 | GO:0008218 | bioluminescence(GO:0008218) |
| 0.1 | 2.0 | GO:0021952 | central nervous system projection neuron axonogenesis(GO:0021952) |
| 0.1 | 0.9 | GO:0001573 | ganglioside metabolic process(GO:0001573) |
| 0.1 | 0.5 | GO:0016191 | synaptic vesicle uncoating(GO:0016191) vesicle uncoating(GO:0072319) |
| 0.1 | 1.4 | GO:0006704 | glucocorticoid biosynthetic process(GO:0006704) |
| 0.1 | 2.3 | GO:0006783 | heme biosynthetic process(GO:0006783) |
| 0.1 | 2.4 | GO:1904837 | beta-catenin-TCF complex assembly(GO:1904837) |
| 0.1 | 0.3 | GO:0050974 | detection of mechanical stimulus involved in sensory perception of sound(GO:0050910) detection of mechanical stimulus involved in sensory perception(GO:0050974) |
| 0.1 | 2.4 | GO:0086010 | membrane depolarization during action potential(GO:0086010) |
| 0.1 | 3.6 | GO:0043966 | histone H3 acetylation(GO:0043966) |
| 0.1 | 0.9 | GO:0001696 | gastric acid secretion(GO:0001696) |
| 0.1 | 1.5 | GO:0016079 | synaptic vesicle exocytosis(GO:0016079) |
| 0.1 | 7.9 | GO:0050911 | detection of chemical stimulus involved in sensory perception of smell(GO:0050911) |
| 0.1 | 5.4 | GO:0007224 | smoothened signaling pathway(GO:0007224) |
| 0.1 | 0.9 | GO:0036296 | response to increased oxygen levels(GO:0036296) |
| 0.1 | 0.4 | GO:0009756 | carbohydrate mediated signaling(GO:0009756) |
| 0.1 | 1.6 | GO:0007595 | lactation(GO:0007595) |
| 0.1 | 0.2 | GO:0043570 | maintenance of DNA repeat elements(GO:0043570) |
| 0.1 | 1.4 | GO:0007340 | acrosome reaction(GO:0007340) |
| 0.1 | 0.8 | GO:0006465 | signal peptide processing(GO:0006465) |
| 0.1 | 0.1 | GO:1903242 | regulation of cardiac muscle adaptation(GO:0010612) regulation of cardiac muscle hypertrophy in response to stress(GO:1903242) |
| 0.1 | 1.0 | GO:0042136 | neurotransmitter biosynthetic process(GO:0042136) |
| 0.1 | 1.0 | GO:0030277 | maintenance of gastrointestinal epithelium(GO:0030277) |
| 0.1 | 0.3 | GO:0031643 | positive regulation of myelination(GO:0031643) |
| 0.1 | 0.5 | GO:0045475 | locomotor rhythm(GO:0045475) |
| 0.1 | 2.7 | GO:1903779 | regulation of cardiac conduction(GO:1903779) |
| 0.1 | 4.1 | GO:0090630 | activation of GTPase activity(GO:0090630) |
| 0.1 | 1.6 | GO:0043252 | sodium-independent organic anion transport(GO:0043252) |
| 0.1 | 0.4 | GO:0030206 | chondroitin sulfate biosynthetic process(GO:0030206) |
| 0.1 | 0.1 | GO:0006740 | NADPH regeneration(GO:0006740) |
| 0.1 | 2.7 | GO:0007586 | digestion(GO:0007586) |
| 0.0 | 0.1 | GO:0019605 | benzoate metabolic process(GO:0018874) butyrate metabolic process(GO:0019605) |
| 0.0 | 0.2 | GO:0010842 | retina layer formation(GO:0010842) |
| 0.0 | 0.9 | GO:0016338 | calcium-independent cell-cell adhesion via plasma membrane cell-adhesion molecules(GO:0016338) |
| 0.0 | 1.3 | GO:0007368 | determination of left/right symmetry(GO:0007368) |
| 0.0 | 0.2 | GO:0033489 | cholesterol biosynthetic process via desmosterol(GO:0033489) cholesterol biosynthetic process via lathosterol(GO:0033490) |
| 0.0 | 0.2 | GO:0008206 | bile acid metabolic process(GO:0008206) |
| 0.0 | 1.0 | GO:0010107 | potassium ion import(GO:0010107) |
| 0.0 | 0.7 | GO:0018279 | protein N-linked glycosylation via asparagine(GO:0018279) |
| 0.0 | 0.2 | GO:0021521 | ventral spinal cord interneuron specification(GO:0021521) cell fate specification involved in pattern specification(GO:0060573) |
| 0.0 | 0.2 | GO:0006700 | C21-steroid hormone biosynthetic process(GO:0006700) |
| 0.0 | 1.0 | GO:0033119 | negative regulation of RNA splicing(GO:0033119) |
| 0.0 | 0.4 | GO:0032411 | positive regulation of transporter activity(GO:0032411) |
| 0.0 | 0.6 | GO:0006942 | regulation of striated muscle contraction(GO:0006942) |
| 0.0 | 0.5 | GO:0032728 | positive regulation of interferon-beta production(GO:0032728) |
| 0.0 | 0.3 | GO:1901838 | positive regulation of transcription of nuclear large rRNA transcript from RNA polymerase I promoter(GO:1901838) |
| 0.0 | 0.4 | GO:0019369 | arachidonic acid metabolic process(GO:0019369) |
| 0.0 | 0.3 | GO:0046710 | GDP metabolic process(GO:0046710) |
| 0.0 | 0.3 | GO:0035235 | ionotropic glutamate receptor signaling pathway(GO:0035235) |
| 0.0 | 0.1 | GO:0046951 | ketone body biosynthetic process(GO:0046951) |
| 0.0 | 0.5 | GO:0043171 | peptide catabolic process(GO:0043171) |
| 0.0 | 0.1 | GO:0060612 | adipose tissue development(GO:0060612) |
| 0.0 | 0.3 | GO:0001945 | lymph vessel development(GO:0001945) |
| 0.0 | 0.4 | GO:0002088 | lens development in camera-type eye(GO:0002088) |
| 0.0 | 0.0 | GO:0010159 | specification of organ position(GO:0010159) |
| 0.0 | 0.5 | GO:0006501 | C-terminal protein lipidation(GO:0006501) |
Gene overrepresentation in cellular component category:
| Log-likelihood per target | Total log-likelihood | Term | Description |
|---|---|---|---|
| 22.6 | 67.7 | GO:0061673 | cortical microtubule(GO:0055028) mitotic spindle astral microtubule(GO:0061673) |
| 16.9 | 101.5 | GO:0034687 | integrin alphaL-beta2 complex(GO:0034687) |
| 10.2 | 61.0 | GO:0070545 | PeBoW complex(GO:0070545) |
| 8.1 | 24.2 | GO:0044609 | DBIRD complex(GO:0044609) |
| 6.8 | 67.8 | GO:0044194 | cytolytic granule(GO:0044194) |
| 6.2 | 24.8 | GO:1990578 | perinuclear endoplasmic reticulum membrane(GO:1990578) |
| 5.9 | 29.7 | GO:0070847 | core mediator complex(GO:0070847) |
| 5.9 | 47.0 | GO:0032010 | phagolysosome(GO:0032010) |
| 5.8 | 11.6 | GO:0042101 | T cell receptor complex(GO:0042101) |
| 4.9 | 24.4 | GO:0071012 | catalytic step 1 spliceosome(GO:0071012) |
| 4.8 | 106.7 | GO:0031254 | uropod(GO:0001931) cell trailing edge(GO:0031254) |
| 4.8 | 14.3 | GO:0090571 | RNA polymerase II transcription repressor complex(GO:0090571) |
| 4.7 | 18.6 | GO:0034365 | discoidal high-density lipoprotein particle(GO:0034365) |
| 4.4 | 21.9 | GO:0043527 | tRNA methyltransferase complex(GO:0043527) |
| 4.0 | 12.0 | GO:0097013 | phagocytic vesicle lumen(GO:0097013) |
| 3.8 | 15.2 | GO:0000801 | central element(GO:0000801) |
| 3.8 | 15.0 | GO:0008275 | gamma-tubulin small complex(GO:0008275) |
| 3.7 | 22.4 | GO:1990316 | ATG1/ULK1 kinase complex(GO:1990316) |
| 3.7 | 40.5 | GO:0042105 | alpha-beta T cell receptor complex(GO:0042105) |
| 3.7 | 14.7 | GO:0034669 | integrin alpha4-beta7 complex(GO:0034669) |
| 3.5 | 28.1 | GO:1903440 | calcitonin family receptor complex(GO:1903439) amylin receptor complex(GO:1903440) |
| 3.3 | 9.9 | GO:0032426 | stereocilium tip(GO:0032426) |
| 3.0 | 3.0 | GO:0034681 | integrin alpha11-beta1 complex(GO:0034681) |
| 2.9 | 8.7 | GO:0031085 | BLOC-3 complex(GO:0031085) |
| 2.7 | 8.2 | GO:0030121 | AP-1 adaptor complex(GO:0030121) |
| 2.7 | 19.0 | GO:1990130 | Iml1 complex(GO:1990130) |
| 2.7 | 35.2 | GO:0033093 | Weibel-Palade body(GO:0033093) |
| 2.7 | 21.4 | GO:0072487 | MSL complex(GO:0072487) |
| 2.6 | 15.8 | GO:0033269 | internode region of axon(GO:0033269) |
| 2.6 | 12.9 | GO:0019815 | B cell receptor complex(GO:0019815) |
| 2.5 | 12.5 | GO:0005797 | Golgi medial cisterna(GO:0005797) |
| 2.5 | 20.0 | GO:0033647 | host intracellular organelle(GO:0033647) host intracellular membrane-bounded organelle(GO:0033648) |
| 2.4 | 12.1 | GO:0072558 | NLRP1 inflammasome complex(GO:0072558) |
| 2.4 | 30.9 | GO:0005744 | mitochondrial inner membrane presequence translocase complex(GO:0005744) |
| 2.4 | 16.5 | GO:0036021 | endolysosome lumen(GO:0036021) |
| 2.3 | 9.3 | GO:0071942 | XPC complex(GO:0071942) |
| 2.3 | 6.9 | GO:0042629 | mast cell granule(GO:0042629) |
| 2.2 | 15.5 | GO:0042406 | extrinsic component of endoplasmic reticulum membrane(GO:0042406) |
| 2.2 | 15.2 | GO:1990745 | EARP complex(GO:1990745) |
| 2.2 | 17.2 | GO:0070187 | telosome(GO:0070187) |
| 2.1 | 18.6 | GO:0097427 | microtubule bundle(GO:0097427) |
| 2.0 | 10.0 | GO:0032807 | DNA ligase IV complex(GO:0032807) |
| 2.0 | 19.8 | GO:0097443 | sorting endosome(GO:0097443) |
| 1.9 | 5.8 | GO:0035189 | Rb-E2F complex(GO:0035189) |
| 1.9 | 5.7 | GO:0016222 | procollagen-proline 4-dioxygenase complex(GO:0016222) |
| 1.9 | 3.8 | GO:0098837 | postsynaptic recycling endosome(GO:0098837) |
| 1.9 | 7.5 | GO:0005602 | complement component C1 complex(GO:0005602) |
| 1.9 | 15.0 | GO:0000322 | storage vacuole(GO:0000322) |
| 1.9 | 9.4 | GO:0072534 | perineuronal net(GO:0072534) |
| 1.9 | 7.4 | GO:0071595 | Nem1-Spo7 phosphatase complex(GO:0071595) |
| 1.8 | 7.1 | GO:0000818 | nuclear MIS12/MIND complex(GO:0000818) |
| 1.8 | 5.3 | GO:0072563 | endothelial microparticle(GO:0072563) |
| 1.7 | 7.0 | GO:0070032 | synaptobrevin 2-SNAP-25-syntaxin-1a-complexin I complex(GO:0070032) |
| 1.7 | 10.3 | GO:0033553 | rDNA heterochromatin(GO:0033553) |
| 1.7 | 23.3 | GO:0032580 | Golgi cisterna membrane(GO:0032580) |
| 1.6 | 4.8 | GO:0005944 | phosphatidylinositol 3-kinase complex, class IB(GO:0005944) |
| 1.6 | 34.9 | GO:0031265 | CD95 death-inducing signaling complex(GO:0031265) |
| 1.6 | 14.1 | GO:0098554 | cytoplasmic side of endoplasmic reticulum membrane(GO:0098554) |
| 1.5 | 21.7 | GO:0048188 | Set1C/COMPASS complex(GO:0048188) |
| 1.5 | 6.1 | GO:0032937 | SREBP-SCAP-Insig complex(GO:0032937) |
| 1.5 | 10.4 | GO:0032009 | early phagosome(GO:0032009) |
| 1.5 | 7.4 | GO:0005896 | interleukin-6 receptor complex(GO:0005896) |
| 1.5 | 5.9 | GO:0033596 | TSC1-TSC2 complex(GO:0033596) |
| 1.5 | 11.7 | GO:0035976 | AP1 complex(GO:0035976) |
| 1.5 | 4.4 | GO:0034657 | GID complex(GO:0034657) |
| 1.5 | 7.3 | GO:1990031 | pinceau fiber(GO:1990031) |
| 1.5 | 40.9 | GO:0031231 | integral component of peroxisomal membrane(GO:0005779) intrinsic component of peroxisomal membrane(GO:0031231) |
| 1.5 | 2.9 | GO:0098592 | cytoplasmic side of apical plasma membrane(GO:0098592) |
| 1.5 | 16.0 | GO:0032039 | integrator complex(GO:0032039) |
| 1.4 | 23.2 | GO:0045277 | respiratory chain complex IV(GO:0045277) |
| 1.4 | 8.7 | GO:0031232 | extrinsic component of external side of plasma membrane(GO:0031232) |
| 1.4 | 8.4 | GO:0034673 | inhibin-betaglycan-ActRII complex(GO:0034673) |
| 1.4 | 7.0 | GO:0005947 | mitochondrial alpha-ketoglutarate dehydrogenase complex(GO:0005947) |
| 1.4 | 4.1 | GO:0009328 | phenylalanine-tRNA ligase complex(GO:0009328) |
| 1.4 | 15.0 | GO:0035749 | myelin sheath adaxonal region(GO:0035749) |
| 1.3 | 16.1 | GO:0005577 | fibrinogen complex(GO:0005577) |
| 1.3 | 8.0 | GO:0020016 | ciliary pocket(GO:0020016) ciliary pocket membrane(GO:0020018) |
| 1.3 | 4.0 | GO:0043293 | apoptosome(GO:0043293) |
| 1.3 | 28.9 | GO:0031095 | platelet dense tubular network membrane(GO:0031095) |
| 1.3 | 12.7 | GO:0030126 | COPI vesicle coat(GO:0030126) |
| 1.3 | 6.3 | GO:1990589 | ATF4-CREB1 transcription factor complex(GO:1990589) |
| 1.2 | 4.7 | GO:0008043 | intracellular ferritin complex(GO:0008043) ferritin complex(GO:0070288) |
| 1.2 | 3.5 | GO:0005760 | gamma DNA polymerase complex(GO:0005760) |
| 1.2 | 8.1 | GO:1990452 | Parkin-FBXW7-Cul1 ubiquitin ligase complex(GO:1990452) |
| 1.1 | 6.8 | GO:0097197 | tetraspanin-enriched microdomain(GO:0097197) |
| 1.1 | 24.9 | GO:0034045 | pre-autophagosomal structure membrane(GO:0034045) |
| 1.1 | 3.3 | GO:0032116 | SMC loading complex(GO:0032116) |
| 1.1 | 17.1 | GO:0033270 | paranode region of axon(GO:0033270) |
| 1.1 | 100.2 | GO:0101003 | ficolin-1-rich granule membrane(GO:0101003) |
| 1.1 | 6.4 | GO:0072559 | NLRP3 inflammasome complex(GO:0072559) |
| 1.1 | 2.1 | GO:0034686 | integrin alphav-beta8 complex(GO:0034686) |
| 1.1 | 3.2 | GO:0055087 | Ski complex(GO:0055087) |
| 1.0 | 8.4 | GO:0097425 | smooth endoplasmic reticulum membrane(GO:0030868) smooth endoplasmic reticulum part(GO:0097425) |
| 1.0 | 5.1 | GO:1902937 | inward rectifier potassium channel complex(GO:1902937) |
| 1.0 | 9.1 | GO:0043020 | NADPH oxidase complex(GO:0043020) |
| 1.0 | 5.0 | GO:0071008 | U2-type post-mRNA release spliceosomal complex(GO:0071008) |
| 1.0 | 18.8 | GO:0042613 | MHC class II protein complex(GO:0042613) |
| 1.0 | 4.9 | GO:0089701 | U2AF(GO:0089701) |
| 1.0 | 8.9 | GO:0046696 | lipopolysaccharide receptor complex(GO:0046696) |
| 1.0 | 10.8 | GO:0005883 | neurofilament(GO:0005883) |
| 1.0 | 11.6 | GO:0046658 | anchored component of plasma membrane(GO:0046658) |
| 1.0 | 4.8 | GO:0005955 | calcineurin complex(GO:0005955) |
| 1.0 | 4.8 | GO:0000138 | Golgi trans cisterna(GO:0000138) |
| 0.9 | 2.8 | GO:0072379 | BAT3 complex(GO:0071818) ER membrane insertion complex(GO:0072379) |
| 0.9 | 14.9 | GO:0005890 | sodium:potassium-exchanging ATPase complex(GO:0005890) |
| 0.9 | 17.6 | GO:0036038 | MKS complex(GO:0036038) |
| 0.9 | 12.8 | GO:0030123 | AP-3 adaptor complex(GO:0030123) |
| 0.9 | 5.4 | GO:0005967 | mitochondrial pyruvate dehydrogenase complex(GO:0005967) |
| 0.9 | 3.6 | GO:0045298 | tubulin complex(GO:0045298) |
| 0.9 | 3.6 | GO:0031838 | haptoglobin-hemoglobin complex(GO:0031838) |
| 0.9 | 8.9 | GO:0043190 | ATP-binding cassette (ABC) transporter complex(GO:0043190) |
| 0.9 | 5.3 | GO:1990769 | proximal neuron projection(GO:1990769) |
| 0.9 | 2.6 | GO:0031933 | telomeric heterochromatin(GO:0031933) |
| 0.9 | 11.1 | GO:0005589 | collagen type VI trimer(GO:0005589) collagen beaded filament(GO:0098647) |
| 0.8 | 17.7 | GO:0005639 | integral component of nuclear inner membrane(GO:0005639) intrinsic component of nuclear inner membrane(GO:0031229) nuclear membrane part(GO:0044453) |
| 0.8 | 28.6 | GO:0044298 | neuronal cell body membrane(GO:0032809) cell body membrane(GO:0044298) |
| 0.8 | 2.5 | GO:0098536 | deuterosome(GO:0098536) |
| 0.8 | 12.9 | GO:0030914 | STAGA complex(GO:0030914) |
| 0.8 | 3.9 | GO:0000407 | pre-autophagosomal structure(GO:0000407) |
| 0.8 | 6.3 | GO:0070776 | H3 histone acetyltransferase complex(GO:0070775) MOZ/MORF histone acetyltransferase complex(GO:0070776) |
| 0.8 | 11.7 | GO:0031083 | BLOC-1 complex(GO:0031083) |
| 0.8 | 6.9 | GO:0005672 | transcription factor TFIIA complex(GO:0005672) |
| 0.8 | 14.5 | GO:0000242 | pericentriolar material(GO:0000242) |
| 0.8 | 9.9 | GO:0031092 | platelet alpha granule membrane(GO:0031092) |
| 0.8 | 3.0 | GO:0005850 | eukaryotic translation initiation factor 2 complex(GO:0005850) |
| 0.7 | 9.7 | GO:0000815 | ESCRT III complex(GO:0000815) |
| 0.7 | 8.9 | GO:0005858 | axonemal dynein complex(GO:0005858) |
| 0.7 | 2.9 | GO:1990879 | CST complex(GO:1990879) |
| 0.7 | 2.2 | GO:0005745 | m-AAA complex(GO:0005745) |
| 0.7 | 3.6 | GO:0034448 | EGO complex(GO:0034448) Gtr1-Gtr2 GTPase complex(GO:1990131) |
| 0.7 | 4.3 | GO:0097129 | cyclin D2-CDK4 complex(GO:0097129) |
| 0.7 | 9.3 | GO:0036056 | filtration diaphragm(GO:0036056) slit diaphragm(GO:0036057) |
| 0.7 | 52.8 | GO:1904724 | tertiary granule lumen(GO:1904724) |
| 0.7 | 3.6 | GO:0000120 | RNA polymerase I transcription factor complex(GO:0000120) |
| 0.7 | 4.9 | GO:0000127 | transcription factor TFIIIC complex(GO:0000127) |
| 0.7 | 2.1 | GO:0098827 | endoplasmic reticulum tubular network(GO:0071782) endoplasmic reticulum subcompartment(GO:0098827) |
| 0.7 | 2.7 | GO:0035032 | phosphatidylinositol 3-kinase complex, class III(GO:0035032) |
| 0.7 | 3.4 | GO:0001940 | male pronucleus(GO:0001940) |
| 0.7 | 10.1 | GO:0097433 | dense body(GO:0097433) |
| 0.7 | 7.4 | GO:0098651 | basement membrane collagen trimer(GO:0098651) |
| 0.7 | 7.9 | GO:0008385 | IkappaB kinase complex(GO:0008385) |
| 0.7 | 4.0 | GO:0005927 | muscle tendon junction(GO:0005927) |
| 0.6 | 2.6 | GO:0032777 | Piccolo NuA4 histone acetyltransferase complex(GO:0032777) |
| 0.6 | 3.9 | GO:0033063 | DNA recombinase mediator complex(GO:0033061) Rad51B-Rad51C-Rad51D-XRCC2 complex(GO:0033063) |
| 0.6 | 1.9 | GO:0071014 | post-mRNA release spliceosomal complex(GO:0071014) |
| 0.6 | 3.2 | GO:0044326 | dendritic spine neck(GO:0044326) |
| 0.6 | 6.9 | GO:0060171 | stereocilium membrane(GO:0060171) |
| 0.6 | 2.5 | GO:1990876 | cytoplasmic side of nuclear pore(GO:1990876) |
| 0.6 | 9.3 | GO:0008074 | guanylate cyclase complex, soluble(GO:0008074) |
| 0.6 | 61.3 | GO:0030136 | clathrin-coated vesicle(GO:0030136) |
| 0.6 | 22.7 | GO:0035580 | specific granule lumen(GO:0035580) |
| 0.6 | 1.8 | GO:0071062 | alphav-beta3 integrin-vitronectin complex(GO:0071062) |
| 0.6 | 3.6 | GO:0000220 | vacuolar proton-transporting V-type ATPase, V0 domain(GO:0000220) |
| 0.6 | 34.4 | GO:0005801 | cis-Golgi network(GO:0005801) |
| 0.6 | 1.2 | GO:0071439 | clathrin complex(GO:0071439) |
| 0.6 | 4.6 | GO:0044322 | endoplasmic reticulum quality control compartment(GO:0044322) |
| 0.6 | 4.5 | GO:0019897 | extrinsic component of plasma membrane(GO:0019897) |
| 0.6 | 3.4 | GO:0030131 | clathrin adaptor complex(GO:0030131) |
| 0.6 | 31.7 | GO:0070821 | tertiary granule membrane(GO:0070821) |
| 0.6 | 2.8 | GO:0030119 | AP-type membrane coat adaptor complex(GO:0030119) |
| 0.5 | 3.3 | GO:0032584 | growth cone membrane(GO:0032584) |
| 0.5 | 12.5 | GO:0043235 | receptor complex(GO:0043235) |
| 0.5 | 13.4 | GO:0031307 | integral component of mitochondrial outer membrane(GO:0031307) |
| 0.5 | 1.6 | GO:0044218 | other organism cell membrane(GO:0044218) other organism membrane(GO:0044279) other organism cytoplasm(GO:0097679) |
| 0.5 | 7.4 | GO:0032591 | dendritic spine membrane(GO:0032591) |
| 0.5 | 17.8 | GO:0005640 | nuclear outer membrane(GO:0005640) |
| 0.5 | 4.7 | GO:0042583 | chromaffin granule(GO:0042583) |
| 0.5 | 2.1 | GO:0017119 | Golgi transport complex(GO:0017119) |
| 0.5 | 1.0 | GO:0097636 | intrinsic component of autophagosome membrane(GO:0097636) integral component of autophagosome membrane(GO:0097637) |
| 0.5 | 2.0 | GO:0031264 | death-inducing signaling complex(GO:0031264) |
| 0.5 | 4.1 | GO:0098559 | cytoplasmic side of early endosome membrane(GO:0098559) |
| 0.5 | 3.0 | GO:0097539 | ciliary transition fiber(GO:0097539) |
| 0.5 | 4.0 | GO:0035577 | azurophil granule membrane(GO:0035577) |
| 0.5 | 7.9 | GO:0035631 | CD40 receptor complex(GO:0035631) |
| 0.5 | 3.5 | GO:0030897 | HOPS complex(GO:0030897) |
| 0.5 | 3.4 | GO:0030905 | retromer, tubulation complex(GO:0030905) |
| 0.5 | 6.8 | GO:0098839 | postsynaptic density membrane(GO:0098839) |
| 0.5 | 55.8 | GO:0005796 | Golgi lumen(GO:0005796) |
| 0.5 | 5.8 | GO:1990712 | HFE-transferrin receptor complex(GO:1990712) |
| 0.5 | 1.9 | GO:0065010 | extracellular membrane-bounded organelle(GO:0065010) |
| 0.5 | 7.6 | GO:0042599 | lamellar body(GO:0042599) |
| 0.5 | 5.2 | GO:0044613 | nuclear pore central transport channel(GO:0044613) |
| 0.5 | 3.7 | GO:0071953 | elastic fiber(GO:0071953) |
| 0.5 | 4.2 | GO:0043220 | Schmidt-Lanterman incisure(GO:0043220) |
| 0.5 | 7.8 | GO:1990907 | beta-catenin-TCF complex(GO:1990907) |
| 0.5 | 1.4 | GO:0005953 | CAAX-protein geranylgeranyltransferase complex(GO:0005953) |
| 0.5 | 4.5 | GO:0031045 | dense core granule(GO:0031045) |
| 0.4 | 2.7 | GO:1990584 | cardiac Troponin complex(GO:1990584) |
| 0.4 | 4.9 | GO:0097136 | Bcl-2 family protein complex(GO:0097136) |
| 0.4 | 3.1 | GO:0002116 | semaphorin receptor complex(GO:0002116) |
| 0.4 | 4.4 | GO:0070938 | contractile ring(GO:0070938) |
| 0.4 | 3.0 | GO:0016342 | catenin complex(GO:0016342) |
| 0.4 | 3.0 | GO:0097165 | nuclear stress granule(GO:0097165) |
| 0.4 | 18.2 | GO:0032588 | trans-Golgi network membrane(GO:0032588) |
| 0.4 | 4.9 | GO:0005952 | cAMP-dependent protein kinase complex(GO:0005952) |
| 0.4 | 4.1 | GO:0032045 | guanyl-nucleotide exchange factor complex(GO:0032045) |
| 0.4 | 2.0 | GO:0031313 | extrinsic component of endosome membrane(GO:0031313) |
| 0.4 | 98.5 | GO:0009897 | external side of plasma membrane(GO:0009897) |
| 0.4 | 35.3 | GO:0030315 | T-tubule(GO:0030315) |
| 0.4 | 20.9 | GO:0019814 | immunoglobulin complex(GO:0019814) immunoglobulin complex, circulating(GO:0042571) |
| 0.4 | 2.0 | GO:0030314 | junctional membrane complex(GO:0030314) |
| 0.4 | 13.8 | GO:0080008 | Cul4-RING E3 ubiquitin ligase complex(GO:0080008) |
| 0.4 | 1.5 | GO:0044754 | autolysosome(GO:0044754) |
| 0.4 | 54.6 | GO:0043204 | perikaryon(GO:0043204) |
| 0.4 | 5.7 | GO:0008305 | integrin complex(GO:0008305) |
| 0.4 | 95.2 | GO:0030139 | endocytic vesicle(GO:0030139) |
| 0.4 | 5.3 | GO:0005642 | annulate lamellae(GO:0005642) |
| 0.4 | 3.4 | GO:0000813 | ESCRT I complex(GO:0000813) |
| 0.4 | 2.3 | GO:0035867 | alphav-beta3 integrin-IGF-1-IGF1R complex(GO:0035867) |
| 0.4 | 3.0 | GO:0097442 | CA3 pyramidal cell dendrite(GO:0097442) |
| 0.4 | 2.2 | GO:0097451 | glial limiting end-foot(GO:0097451) |
| 0.4 | 8.7 | GO:0000421 | autophagosome membrane(GO:0000421) |
| 0.4 | 1.1 | GO:0070195 | growth hormone receptor complex(GO:0070195) |
| 0.4 | 3.2 | GO:0001520 | outer dense fiber(GO:0001520) |
| 0.4 | 16.9 | GO:0031907 | peroxisomal matrix(GO:0005782) microbody lumen(GO:0031907) |
| 0.3 | 2.7 | GO:0001891 | phagocytic cup(GO:0001891) |
| 0.3 | 1.3 | GO:0097513 | myosin II filament(GO:0097513) |
| 0.3 | 52.9 | GO:0030427 | site of polarized growth(GO:0030427) |
| 0.3 | 5.8 | GO:0005922 | connexon complex(GO:0005922) |
| 0.3 | 23.9 | GO:0031091 | platelet alpha granule(GO:0031091) |
| 0.3 | 5.0 | GO:0031904 | endosome lumen(GO:0031904) |
| 0.3 | 1.3 | GO:0030895 | apolipoprotein B mRNA editing enzyme complex(GO:0030895) |
| 0.3 | 5.3 | GO:0034362 | low-density lipoprotein particle(GO:0034362) |
| 0.3 | 16.1 | GO:0005902 | microvillus(GO:0005902) |
| 0.3 | 6.8 | GO:0033017 | sarcoplasmic reticulum membrane(GO:0033017) |
| 0.3 | 0.9 | GO:0005899 | insulin receptor complex(GO:0005899) |
| 0.3 | 1.4 | GO:0070761 | pre-snoRNP complex(GO:0070761) |
| 0.3 | 2.5 | GO:0097452 | GAIT complex(GO:0097452) |
| 0.3 | 1.4 | GO:0072687 | meiotic spindle(GO:0072687) |
| 0.3 | 20.5 | GO:0043202 | lysosomal lumen(GO:0043202) |
| 0.3 | 18.3 | GO:0005923 | bicellular tight junction(GO:0005923) |
| 0.3 | 10.1 | GO:0005891 | voltage-gated calcium channel complex(GO:0005891) |
| 0.3 | 10.5 | GO:0001533 | cornified envelope(GO:0001533) |
| 0.3 | 26.6 | GO:0005814 | centriole(GO:0005814) |
| 0.3 | 3.0 | GO:0035869 | ciliary transition zone(GO:0035869) |
| 0.3 | 1.5 | GO:0070554 | synaptobrevin 2-SNAP-25-syntaxin-1a-complexin II complex(GO:0070033) synaptobrevin 2-SNAP-25-syntaxin-3-complexin complex(GO:0070554) |
| 0.2 | 1.0 | GO:0031467 | Cul7-RING ubiquitin ligase complex(GO:0031467) |
| 0.2 | 5.2 | GO:0055038 | recycling endosome membrane(GO:0055038) |
| 0.2 | 5.1 | GO:0030286 | dynein complex(GO:0030286) |
| 0.2 | 3.4 | GO:0014731 | spectrin-associated cytoskeleton(GO:0014731) |
| 0.2 | 2.1 | GO:0035068 | micro-ribonucleoprotein complex(GO:0035068) |
| 0.2 | 1.6 | GO:0005579 | membrane attack complex(GO:0005579) |
| 0.2 | 22.5 | GO:0031225 | anchored component of membrane(GO:0031225) |
| 0.2 | 992.1 | GO:0016021 | integral component of membrane(GO:0016021) |
| 0.2 | 2.1 | GO:0042587 | glycogen granule(GO:0042587) |
| 0.2 | 4.3 | GO:0005719 | nuclear euchromatin(GO:0005719) |
| 0.2 | 10.4 | GO:0005811 | lipid particle(GO:0005811) |
| 0.2 | 5.4 | GO:0071565 | nBAF complex(GO:0071565) |
| 0.2 | 0.8 | GO:0000438 | core TFIIH complex portion of holo TFIIH complex(GO:0000438) |
| 0.2 | 9.3 | GO:0005581 | collagen trimer(GO:0005581) |
| 0.2 | 0.4 | GO:0031082 | BLOC complex(GO:0031082) |
| 0.2 | 4.1 | GO:0016323 | basolateral plasma membrane(GO:0016323) |
| 0.2 | 2.1 | GO:0005942 | phosphatidylinositol 3-kinase complex(GO:0005942) |
| 0.2 | 3.0 | GO:0016328 | lateral plasma membrane(GO:0016328) |
| 0.2 | 1.1 | GO:0060091 | kinocilium(GO:0060091) |
| 0.2 | 1.2 | GO:0044666 | MLL3/4 complex(GO:0044666) |
| 0.2 | 27.1 | GO:0031234 | extrinsic component of cytoplasmic side of plasma membrane(GO:0031234) |
| 0.2 | 1.2 | GO:0033391 | chromatoid body(GO:0033391) |
| 0.2 | 0.8 | GO:0032444 | activin responsive factor complex(GO:0032444) |
| 0.2 | 1.9 | GO:0043240 | Fanconi anaemia nuclear complex(GO:0043240) |
| 0.2 | 1.6 | GO:0005790 | smooth endoplasmic reticulum(GO:0005790) |
| 0.2 | 2.9 | GO:0031588 | nucleotide-activated protein kinase complex(GO:0031588) |
| 0.2 | 5.4 | GO:0016592 | mediator complex(GO:0016592) |
| 0.2 | 8.6 | GO:0016324 | apical plasma membrane(GO:0016324) |
| 0.2 | 2.0 | GO:0097381 | photoreceptor disc membrane(GO:0097381) |
| 0.1 | 0.7 | GO:0031523 | Myb complex(GO:0031523) |
| 0.1 | 2.3 | GO:0001772 | immunological synapse(GO:0001772) |
| 0.1 | 3.2 | GO:0001750 | photoreceptor outer segment(GO:0001750) |
| 0.1 | 1.5 | GO:0000791 | euchromatin(GO:0000791) |
| 0.1 | 2.0 | GO:0097542 | ciliary tip(GO:0097542) |
| 0.1 | 0.6 | GO:0043291 | RAVE complex(GO:0043291) |
| 0.1 | 3.2 | GO:0048786 | presynaptic active zone(GO:0048786) |
| 0.1 | 0.3 | GO:0031201 | SNARE complex(GO:0031201) |
| 0.1 | 5.7 | GO:0031463 | Cul3-RING ubiquitin ligase complex(GO:0031463) |
| 0.1 | 99.4 | GO:0005615 | extracellular space(GO:0005615) |
| 0.1 | 1.4 | GO:0005861 | troponin complex(GO:0005861) |
| 0.1 | 0.6 | GO:0045120 | pronucleus(GO:0045120) |
| 0.1 | 8.4 | GO:0005578 | proteinaceous extracellular matrix(GO:0005578) |
| 0.1 | 0.3 | GO:0030893 | meiotic cohesin complex(GO:0030893) |
| 0.1 | 4.7 | GO:0031514 | motile cilium(GO:0031514) |
| 0.1 | 1.1 | GO:0005776 | autophagosome(GO:0005776) |
| 0.1 | 0.2 | GO:0005921 | gap junction(GO:0005921) |
| 0.0 | 0.4 | GO:0045180 | basal cortex(GO:0045180) |
| 0.0 | 0.2 | GO:0031466 | Cul5-RING ubiquitin ligase complex(GO:0031466) |
| 0.0 | 0.8 | GO:0035145 | exon-exon junction complex(GO:0035145) |
| 0.0 | 0.6 | GO:0043195 | terminal bouton(GO:0043195) |
| 0.0 | 1.9 | GO:0032587 | ruffle membrane(GO:0032587) |
| 0.0 | 0.3 | GO:0032982 | myosin filament(GO:0032982) |
| 0.0 | 0.0 | GO:0005916 | fascia adherens(GO:0005916) |
Gene overrepresentation in molecular function category:
| Log-likelihood per target | Total log-likelihood | Term | Description |
|---|---|---|---|
| 15.0 | 105.0 | GO:0030369 | ICAM-3 receptor activity(GO:0030369) |
| 12.1 | 109.3 | GO:0016206 | catechol O-methyltransferase activity(GO:0016206) |
| 11.6 | 34.7 | GO:0008330 | protein tyrosine/threonine phosphatase activity(GO:0008330) |
| 10.9 | 32.6 | GO:0035662 | Toll-like receptor 4 binding(GO:0035662) |
| 8.3 | 82.8 | GO:0051011 | microtubule minus-end binding(GO:0051011) |
| 8.0 | 23.9 | GO:0033746 | histone demethylase activity (H3-R2 specific)(GO:0033746) histone demethylase activity (H4-R3 specific)(GO:0033749) |
| 7.7 | 30.9 | GO:0000309 | nicotinamide-nucleotide adenylyltransferase activity(GO:0000309) |
| 7.3 | 29.3 | GO:0030107 | HLA-A specific inhibitory MHC class I receptor activity(GO:0030107) |
| 7.3 | 21.8 | GO:0045322 | unmethylated CpG binding(GO:0045322) |
| 7.0 | 21.1 | GO:0070290 | N-acylphosphatidylethanolamine-specific phospholipase D activity(GO:0070290) |
| 6.8 | 20.3 | GO:0005137 | interleukin-5 receptor binding(GO:0005137) |
| 6.7 | 20.2 | GO:0003917 | DNA topoisomerase type I activity(GO:0003917) |
| 6.1 | 6.1 | GO:0030109 | HLA-B specific inhibitory MHC class I receptor activity(GO:0030109) |
| 6.1 | 42.5 | GO:0008821 | crossover junction endodeoxyribonuclease activity(GO:0008821) |
| 5.9 | 47.0 | GO:0016176 | superoxide-generating NADPH oxidase activator activity(GO:0016176) |
| 5.8 | 28.8 | GO:0042610 | CD8 receptor binding(GO:0042610) |
| 5.7 | 22.7 | GO:0015207 | ATP:ADP antiporter activity(GO:0005471) adenine transmembrane transporter activity(GO:0015207) |
| 5.4 | 21.5 | GO:0016495 | C-X3-C chemokine receptor activity(GO:0016495) |
| 4.9 | 14.7 | GO:0032090 | Pyrin domain binding(GO:0032090) |
| 4.8 | 38.0 | GO:0019763 | immunoglobulin receptor activity(GO:0019763) |
| 4.7 | 28.0 | GO:0070004 | cysteine-type carboxypeptidase activity(GO:0016807) cysteine-type exopeptidase activity(GO:0070004) |
| 4.5 | 36.3 | GO:0015235 | cobalamin transporter activity(GO:0015235) |
| 4.5 | 18.0 | GO:0003827 | alpha-1,3-mannosylglycoprotein 2-beta-N-acetylglucosaminyltransferase activity(GO:0003827) |
| 4.4 | 26.2 | GO:0097199 | cysteine-type endopeptidase activity involved in apoptotic signaling pathway(GO:0097199) |
| 4.3 | 13.0 | GO:0015226 | amino-acid betaine transmembrane transporter activity(GO:0015199) carnitine transmembrane transporter activity(GO:0015226) |
| 4.3 | 21.3 | GO:0004464 | leukotriene-C4 synthase activity(GO:0004464) |
| 4.2 | 12.6 | GO:0030350 | iron-responsive element binding(GO:0030350) |
| 4.1 | 12.4 | GO:0004878 | complement component C5a receptor activity(GO:0004878) |
| 4.1 | 16.4 | GO:0015018 | galactosylgalactosylxylosylprotein 3-beta-glucuronosyltransferase activity(GO:0015018) |
| 4.0 | 16.2 | GO:0016019 | peptidoglycan receptor activity(GO:0016019) |
| 4.0 | 15.9 | GO:0061628 | H3K27me3 modified histone binding(GO:0061628) |
| 3.9 | 11.8 | GO:0098918 | structural constituent of synapse(GO:0098918) structural constituent of postsynaptic actin cytoskeleton(GO:0098973) |
| 3.8 | 15.3 | GO:0004911 | interleukin-2 receptor activity(GO:0004911) interleukin-2 binding(GO:0019976) |
| 3.8 | 22.6 | GO:0004489 | methylenetetrahydrofolate reductase (NAD(P)H) activity(GO:0004489) |
| 3.8 | 15.0 | GO:0016426 | tRNA (adenine) methyltransferase activity(GO:0016426) |
| 3.7 | 18.3 | GO:0004792 | thiosulfate sulfurtransferase activity(GO:0004792) |
| 3.7 | 21.9 | GO:0022897 | peptide:proton symporter activity(GO:0015333) proton-dependent peptide secondary active transmembrane transporter activity(GO:0022897) |
| 3.6 | 3.6 | GO:0042043 | neurexin family protein binding(GO:0042043) |
| 3.5 | 28.1 | GO:0097643 | amylin receptor activity(GO:0097643) |
| 3.5 | 13.9 | GO:0016314 | phosphatidylinositol-3,4,5-trisphosphate 3-phosphatase activity(GO:0016314) |
| 3.4 | 20.6 | GO:0016929 | SUMO-specific protease activity(GO:0016929) |
| 3.4 | 30.6 | GO:0046935 | 1-phosphatidylinositol-3-kinase regulator activity(GO:0046935) |
| 3.3 | 13.2 | GO:0097001 | ceramide binding(GO:0097001) |
| 3.3 | 9.8 | GO:0070735 | protein-glycine ligase activity(GO:0070735) |
| 3.2 | 16.2 | GO:0023024 | MHC class I protein complex binding(GO:0023024) |
| 3.2 | 12.9 | GO:0061769 | ribosylnicotinamide kinase activity(GO:0050262) ribosylnicotinate kinase activity(GO:0061769) |
| 3.2 | 16.1 | GO:0016427 | tRNA (cytosine) methyltransferase activity(GO:0016427) |
| 3.1 | 18.8 | GO:0000179 | rRNA (adenine-N6,N6-)-dimethyltransferase activity(GO:0000179) |
| 3.1 | 28.1 | GO:0010385 | double-stranded methylated DNA binding(GO:0010385) |
| 3.1 | 18.7 | GO:0008420 | CTD phosphatase activity(GO:0008420) |
| 3.1 | 31.0 | GO:0001042 | RNA polymerase I core binding(GO:0001042) |
| 3.1 | 61.1 | GO:0005522 | profilin binding(GO:0005522) |
| 3.1 | 12.2 | GO:0017159 | pantetheine hydrolase activity(GO:0017159) |
| 3.0 | 12.0 | GO:0016793 | dGTPase activity(GO:0008832) triphosphoric monoester hydrolase activity(GO:0016793) guanyl deoxyribonucleotide binding(GO:0032560) dGTP binding(GO:0032567) |
| 3.0 | 17.8 | GO:0003998 | acylphosphatase activity(GO:0003998) |
| 2.9 | 8.8 | GO:0051538 | 3 iron, 4 sulfur cluster binding(GO:0051538) |
| 2.9 | 11.7 | GO:0004773 | steryl-sulfatase activity(GO:0004773) |
| 2.9 | 43.2 | GO:0019957 | C-C chemokine binding(GO:0019957) |
| 2.8 | 8.4 | GO:0070119 | ciliary neurotrophic factor binding(GO:0070119) |
| 2.8 | 13.8 | GO:0003835 | beta-galactoside alpha-2,6-sialyltransferase activity(GO:0003835) |
| 2.8 | 11.0 | GO:0005124 | N-formyl peptide receptor activity(GO:0004982) scavenger receptor binding(GO:0005124) |
| 2.6 | 7.9 | GO:0070039 | rRNA (guanosine-2'-O-)-methyltransferase activity(GO:0070039) |
| 2.6 | 13.0 | GO:0004522 | ribonuclease A activity(GO:0004522) |
| 2.5 | 7.6 | GO:0004051 | arachidonate 5-lipoxygenase activity(GO:0004051) |
| 2.5 | 15.0 | GO:0003796 | lysozyme activity(GO:0003796) |
| 2.5 | 62.2 | GO:0019865 | immunoglobulin binding(GO:0019865) |
| 2.5 | 64.7 | GO:0022829 | wide pore channel activity(GO:0022829) |
| 2.4 | 9.7 | GO:0032810 | sterol response element binding(GO:0032810) |
| 2.4 | 21.9 | GO:0031685 | adenosine receptor binding(GO:0031685) |
| 2.4 | 14.6 | GO:0034191 | apolipoprotein A-I receptor binding(GO:0034191) |
| 2.3 | 2.3 | GO:0004948 | calcitonin receptor activity(GO:0004948) |
| 2.3 | 4.7 | GO:0003680 | AT DNA binding(GO:0003680) |
| 2.3 | 7.0 | GO:0003863 | alpha-ketoacid dehydrogenase activity(GO:0003826) 3-methyl-2-oxobutanoate dehydrogenase (2-methylpropanoyl-transferring) activity(GO:0003863) |
| 2.3 | 32.3 | GO:0005078 | MAP-kinase scaffold activity(GO:0005078) |
| 2.1 | 25.8 | GO:0019911 | structural constituent of myelin sheath(GO:0019911) |
| 2.1 | 8.3 | GO:0030628 | pre-mRNA 3'-splice site binding(GO:0030628) |
| 2.0 | 11.9 | GO:0015252 | hydrogen ion channel activity(GO:0015252) |
| 2.0 | 9.9 | GO:0047374 | methylumbelliferyl-acetate deacetylase activity(GO:0047374) |
| 2.0 | 35.4 | GO:0070513 | death domain binding(GO:0070513) |
| 2.0 | 5.9 | GO:0047631 | ADP-ribose diphosphatase activity(GO:0047631) |
| 2.0 | 17.6 | GO:0031730 | CCR5 chemokine receptor binding(GO:0031730) |
| 1.9 | 5.8 | GO:0033142 | progesterone receptor binding(GO:0033142) |
| 1.9 | 51.9 | GO:0070300 | phosphatidic acid binding(GO:0070300) |
| 1.9 | 13.4 | GO:0000405 | bubble DNA binding(GO:0000405) |
| 1.9 | 21.0 | GO:0070915 | lysophosphatidic acid receptor activity(GO:0070915) |
| 1.9 | 44.5 | GO:0080025 | phosphatidylinositol-3,5-bisphosphate binding(GO:0080025) |
| 1.9 | 7.4 | GO:0033829 | O-fucosylpeptide 3-beta-N-acetylglucosaminyltransferase activity(GO:0033829) |
| 1.9 | 7.4 | GO:0052595 | tryptamine:oxygen oxidoreductase (deaminating) activity(GO:0052593) aminoacetone:oxygen oxidoreductase(deaminating) activity(GO:0052594) aliphatic-amine oxidase activity(GO:0052595) phenethylamine:oxygen oxidoreductase (deaminating) activity(GO:0052596) |
| 1.8 | 25.8 | GO:0008429 | phosphatidylethanolamine binding(GO:0008429) |
| 1.8 | 1.8 | GO:0043141 | ATP-dependent 5'-3' DNA helicase activity(GO:0043141) |
| 1.8 | 5.5 | GO:0008321 | Ral guanyl-nucleotide exchange factor activity(GO:0008321) |
| 1.8 | 52.8 | GO:0005355 | glucose transmembrane transporter activity(GO:0005355) |
| 1.7 | 5.2 | GO:0036487 | nitric-oxide synthase inhibitor activity(GO:0036487) |
| 1.7 | 20.9 | GO:0015174 | basic amino acid transmembrane transporter activity(GO:0015174) |
| 1.7 | 5.2 | GO:0016434 | rRNA (cytosine) methyltransferase activity(GO:0016434) |
| 1.7 | 12.0 | GO:1904288 | BAT3 complex binding(GO:1904288) |
| 1.7 | 13.8 | GO:0005094 | Rho GDP-dissociation inhibitor activity(GO:0005094) |
| 1.7 | 8.6 | GO:0048039 | ubiquinone binding(GO:0048039) |
| 1.7 | 6.8 | GO:0004741 | [pyruvate dehydrogenase (lipoamide)] phosphatase activity(GO:0004741) |
| 1.7 | 6.8 | GO:0015220 | choline transmembrane transporter activity(GO:0015220) |
| 1.7 | 35.6 | GO:0005112 | Notch binding(GO:0005112) |
| 1.7 | 11.8 | GO:0004137 | deoxycytidine kinase activity(GO:0004137) thymidine kinase activity(GO:0004797) |
| 1.7 | 5.0 | GO:0004967 | glucagon receptor activity(GO:0004967) |
| 1.7 | 18.2 | GO:0070181 | small ribosomal subunit rRNA binding(GO:0070181) |
| 1.7 | 9.9 | GO:0060961 | phospholipase D inhibitor activity(GO:0060961) |
| 1.6 | 4.9 | GO:0008859 | exoribonuclease II activity(GO:0008859) |
| 1.6 | 18.1 | GO:0035381 | extracellular ATP-gated cation channel activity(GO:0004931) ATP-gated ion channel activity(GO:0035381) |
| 1.6 | 9.8 | GO:0004699 | calcium-independent protein kinase C activity(GO:0004699) |
| 1.6 | 40.1 | GO:0008329 | signaling pattern recognition receptor activity(GO:0008329) pattern recognition receptor activity(GO:0038187) |
| 1.6 | 30.3 | GO:0031702 | type 1 angiotensin receptor binding(GO:0031702) |
| 1.6 | 7.9 | GO:0001784 | phosphotyrosine binding(GO:0001784) |
| 1.6 | 14.2 | GO:0034235 | GPI anchor binding(GO:0034235) |
| 1.6 | 12.6 | GO:0003910 | DNA ligase (ATP) activity(GO:0003910) |
| 1.6 | 6.2 | GO:0042132 | fructose 1,6-bisphosphate 1-phosphatase activity(GO:0042132) |
| 1.6 | 10.9 | GO:0003810 | protein-glutamine gamma-glutamyltransferase activity(GO:0003810) |
| 1.5 | 4.6 | GO:0016497 | substance K receptor activity(GO:0016497) |
| 1.5 | 18.4 | GO:0015929 | hexosaminidase activity(GO:0015929) |
| 1.5 | 7.6 | GO:0004999 | vasoactive intestinal polypeptide receptor activity(GO:0004999) |
| 1.5 | 12.1 | GO:0098821 | BMP receptor activity(GO:0098821) |
| 1.5 | 48.0 | GO:0019198 | transmembrane receptor protein tyrosine phosphatase activity(GO:0005001) transmembrane receptor protein phosphatase activity(GO:0019198) |
| 1.5 | 3.0 | GO:0038064 | collagen receptor activity(GO:0038064) |
| 1.5 | 4.5 | GO:0015140 | malate transmembrane transporter activity(GO:0015140) |
| 1.5 | 26.6 | GO:0019992 | diacylglycerol binding(GO:0019992) |
| 1.5 | 4.4 | GO:0052816 | medium-chain acyl-CoA hydrolase activity(GO:0052815) long-chain acyl-CoA hydrolase activity(GO:0052816) |
| 1.4 | 4.3 | GO:0004430 | 1-phosphatidylinositol 4-kinase activity(GO:0004430) |
| 1.4 | 7.1 | GO:0008410 | CoA-transferase activity(GO:0008410) |
| 1.4 | 9.8 | GO:0030368 | interleukin-17 receptor activity(GO:0030368) |
| 1.4 | 4.1 | GO:0008294 | calcium- and calmodulin-responsive adenylate cyclase activity(GO:0008294) |
| 1.4 | 31.7 | GO:0051787 | misfolded protein binding(GO:0051787) |
| 1.4 | 19.2 | GO:0001530 | lipopolysaccharide binding(GO:0001530) |
| 1.4 | 4.1 | GO:0015275 | stretch-activated, cation-selective, calcium channel activity(GO:0015275) |
| 1.4 | 8.1 | GO:0051032 | nucleic acid transmembrane transporter activity(GO:0051032) RNA transmembrane transporter activity(GO:0051033) |
| 1.3 | 18.8 | GO:0032395 | MHC class II receptor activity(GO:0032395) |
| 1.3 | 6.6 | GO:0008889 | glycerophosphodiester phosphodiesterase activity(GO:0008889) |
| 1.3 | 9.3 | GO:0004873 | asialoglycoprotein receptor activity(GO:0004873) |
| 1.3 | 9.3 | GO:0030023 | extracellular matrix constituent conferring elasticity(GO:0030023) |
| 1.3 | 6.6 | GO:0033743 | peptide-methionine (R)-S-oxide reductase activity(GO:0033743) |
| 1.3 | 6.6 | GO:0030060 | L-malate dehydrogenase activity(GO:0030060) |
| 1.3 | 3.8 | GO:0004339 | glucan 1,4-alpha-glucosidase activity(GO:0004339) |
| 1.2 | 1.2 | GO:0030305 | heparanase activity(GO:0030305) |
| 1.2 | 5.0 | GO:0034040 | lipid-transporting ATPase activity(GO:0034040) sterol-transporting ATPase activity(GO:0034041) |
| 1.2 | 8.6 | GO:0035325 | Toll-like receptor binding(GO:0035325) |
| 1.2 | 13.5 | GO:0036122 | BMP binding(GO:0036122) |
| 1.2 | 39.2 | GO:0043015 | gamma-tubulin binding(GO:0043015) |
| 1.2 | 3.6 | GO:0004796 | thromboxane-A synthase activity(GO:0004796) 12-hydroxyheptadecatrienoic acid synthase activity(GO:0036134) |
| 1.2 | 16.9 | GO:0051864 | histone demethylase activity (H3-K36 specific)(GO:0051864) |
| 1.2 | 13.2 | GO:0015925 | galactosidase activity(GO:0015925) |
| 1.2 | 4.8 | GO:0004769 | steroid delta-isomerase activity(GO:0004769) |
| 1.2 | 3.5 | GO:0001221 | transcription cofactor binding(GO:0001221) |
| 1.2 | 20.9 | GO:0005161 | platelet-derived growth factor receptor binding(GO:0005161) |
| 1.1 | 18.4 | GO:0043522 | leucine zipper domain binding(GO:0043522) |
| 1.1 | 5.7 | GO:0004656 | procollagen-proline 4-dioxygenase activity(GO:0004656) |
| 1.1 | 6.9 | GO:0015057 | thrombin receptor activity(GO:0015057) |
| 1.1 | 2.3 | GO:0098847 | sequence-specific single stranded DNA binding(GO:0098847) |
| 1.1 | 6.8 | GO:0004740 | pyruvate dehydrogenase (acetyl-transferring) kinase activity(GO:0004740) |
| 1.1 | 28.3 | GO:0102391 | decanoate--CoA ligase activity(GO:0102391) |
| 1.1 | 2.3 | GO:0003923 | GPI-anchor transamidase activity(GO:0003923) |
| 1.1 | 10.0 | GO:0004969 | histamine receptor activity(GO:0004969) |
| 1.1 | 11.1 | GO:0008061 | chitinase activity(GO:0004568) chitin binding(GO:0008061) |
| 1.1 | 5.5 | GO:0046899 | nucleoside triphosphate adenylate kinase activity(GO:0046899) |
| 1.1 | 5.5 | GO:0001164 | RNA polymerase I regulatory region DNA binding(GO:0001013) RNA polymerase I regulatory region sequence-specific DNA binding(GO:0001163) RNA polymerase I CORE element sequence-specific DNA binding(GO:0001164) |
| 1.1 | 5.5 | GO:0034431 | endopolyphosphatase activity(GO:0000298) diphosphoinositol-polyphosphate diphosphatase activity(GO:0008486) bis(5'-adenosyl)-hexaphosphatase activity(GO:0034431) bis(5'-adenosyl)-pentaphosphatase activity(GO:0034432) inositol diphosphate tetrakisphosphate diphosphatase activity(GO:0052840) inositol bisdiphosphate tetrakisphosphate diphosphatase activity(GO:0052841) inositol diphosphate pentakisphosphate diphosphatase activity(GO:0052842) inositol-1-diphosphate-2,3,4,5,6-pentakisphosphate diphosphatase activity(GO:0052843) inositol-3-diphosphate-1,2,4,5,6-pentakisphosphate diphosphatase activity(GO:0052844) inositol-5-diphosphate-1,2,3,4,6-pentakisphosphate diphosphatase activity(GO:0052845) inositol-1,5-bisdiphosphate-2,3,4,6-tetrakisphosphate 1-diphosphatase activity(GO:0052846) inositol-1,5-bisdiphosphate-2,3,4,6-tetrakisphosphate 5-diphosphatase activity(GO:0052847) inositol-3,5-bisdiphosphate-2,3,4,6-tetrakisphosphate 5-diphosphatase activity(GO:0052848) |
| 1.1 | 8.7 | GO:0044323 | retinoic acid-responsive element binding(GO:0044323) |
| 1.1 | 3.2 | GO:0031727 | CCR2 chemokine receptor binding(GO:0031727) |
| 1.1 | 5.4 | GO:0004974 | leukotriene receptor activity(GO:0004974) |
| 1.1 | 10.7 | GO:0031013 | troponin I binding(GO:0031013) |
| 1.1 | 11.7 | GO:0003964 | telomerase activity(GO:0003720) RNA-directed DNA polymerase activity(GO:0003964) |
| 1.1 | 24.4 | GO:0034595 | phosphatidylinositol phosphate 5-phosphatase activity(GO:0034595) |
| 1.1 | 5.3 | GO:0008553 | hydrogen-exporting ATPase activity, phosphorylative mechanism(GO:0008553) |
| 1.1 | 3.2 | GO:0005135 | erythropoietin receptor binding(GO:0005128) interleukin-3 receptor binding(GO:0005135) |
| 1.1 | 6.3 | GO:0017040 | ceramidase activity(GO:0017040) |
| 1.0 | 5.2 | GO:0004427 | inorganic diphosphatase activity(GO:0004427) |
| 1.0 | 14.6 | GO:0045159 | myosin II binding(GO:0045159) |
| 1.0 | 13.1 | GO:0030306 | ADP-ribosylation factor binding(GO:0030306) |
| 1.0 | 4.0 | GO:0045127 | N-acetylglucosamine kinase activity(GO:0045127) |
| 1.0 | 2.9 | GO:0090555 | phosphatidylethanolamine-translocating ATPase activity(GO:0090555) |
| 1.0 | 6.9 | GO:0004514 | nicotinate-nucleotide diphosphorylase (carboxylating) activity(GO:0004514) |
| 1.0 | 13.7 | GO:0004679 | AMP-activated protein kinase activity(GO:0004679) |
| 1.0 | 3.8 | GO:0004449 | isocitrate dehydrogenase (NAD+) activity(GO:0004449) |
| 0.9 | 27.4 | GO:0071949 | FAD binding(GO:0071949) |
| 0.9 | 3.7 | GO:0035800 | deubiquitinase activator activity(GO:0035800) |
| 0.9 | 22.3 | GO:0004435 | phosphatidylinositol phospholipase C activity(GO:0004435) |
| 0.9 | 2.8 | GO:0004157 | dihydropyrimidinase activity(GO:0004157) |
| 0.9 | 22.9 | GO:0005095 | GTPase inhibitor activity(GO:0005095) |
| 0.9 | 4.6 | GO:0047179 | platelet-activating factor acetyltransferase activity(GO:0047179) |
| 0.9 | 11.0 | GO:0005007 | fibroblast growth factor-activated receptor activity(GO:0005007) |
| 0.9 | 3.7 | GO:0001030 | RNA polymerase III type 1 promoter DNA binding(GO:0001030) RNA polymerase III type 2 promoter DNA binding(GO:0001031) 5S rDNA binding(GO:0080084) |
| 0.9 | 9.1 | GO:0016175 | superoxide-generating NADPH oxidase activity(GO:0016175) |
| 0.9 | 15.3 | GO:0015095 | magnesium ion transmembrane transporter activity(GO:0015095) |
| 0.9 | 3.6 | GO:0015056 | corticotrophin-releasing factor receptor activity(GO:0015056) |
| 0.9 | 4.5 | GO:0001594 | trace-amine receptor activity(GO:0001594) |
| 0.9 | 3.6 | GO:0030492 | hemoglobin binding(GO:0030492) |
| 0.9 | 11.6 | GO:0004559 | alpha-mannosidase activity(GO:0004559) |
| 0.9 | 3.5 | GO:0022865 | transmembrane electron transfer carrier(GO:0022865) |
| 0.9 | 4.4 | GO:0015319 | sodium:inorganic phosphate symporter activity(GO:0015319) |
| 0.9 | 6.2 | GO:0050291 | sphingosine N-acyltransferase activity(GO:0050291) |
| 0.9 | 2.6 | GO:0008427 | calcium-dependent protein kinase inhibitor activity(GO:0008427) |
| 0.9 | 36.8 | GO:0030332 | cyclin binding(GO:0030332) |
| 0.9 | 12.1 | GO:0031697 | beta-1 adrenergic receptor binding(GO:0031697) |
| 0.9 | 2.6 | GO:0070538 | oleic acid binding(GO:0070538) |
| 0.9 | 8.7 | GO:0004064 | arylesterase activity(GO:0004064) |
| 0.9 | 6.1 | GO:0001849 | complement component C1q binding(GO:0001849) |
| 0.9 | 1.7 | GO:0035673 | oligopeptide transporter activity(GO:0015198) oligopeptide transmembrane transporter activity(GO:0035673) |
| 0.9 | 2.6 | GO:0004914 | interleukin-3 receptor activity(GO:0004912) interleukin-5 receptor activity(GO:0004914) |
| 0.9 | 11.1 | GO:0008199 | ferric iron binding(GO:0008199) |
| 0.9 | 21.4 | GO:0005388 | calcium-transporting ATPase activity(GO:0005388) |
| 0.8 | 5.1 | GO:0004359 | glutaminase activity(GO:0004359) |
| 0.8 | 2.5 | GO:0035605 | peptidyl-cysteine S-nitrosylase activity(GO:0035605) |
| 0.8 | 195.7 | GO:0005057 | receptor signaling protein activity(GO:0005057) |
| 0.8 | 2.5 | GO:0052798 | beta-galactoside alpha-2,3-sialyltransferase activity(GO:0052798) |
| 0.8 | 3.3 | GO:0032406 | MutLbeta complex binding(GO:0032406) MutSbeta complex binding(GO:0032408) |
| 0.8 | 4.1 | GO:0004826 | phenylalanine-tRNA ligase activity(GO:0004826) |
| 0.8 | 12.3 | GO:0042609 | CD4 receptor binding(GO:0042609) |
| 0.8 | 4.9 | GO:0008853 | exodeoxyribonuclease III activity(GO:0008853) |
| 0.8 | 2.4 | GO:0004320 | oleoyl-[acyl-carrier-protein] hydrolase activity(GO:0004320) myristoyl-[acyl-carrier-protein] hydrolase activity(GO:0016295) palmitoyl-[acyl-carrier-protein] hydrolase activity(GO:0016296) acyl-[acyl-carrier-protein] hydrolase activity(GO:0016297) |
| 0.8 | 25.0 | GO:0048020 | CCR chemokine receptor binding(GO:0048020) |
| 0.8 | 3.2 | GO:0005334 | norepinephrine:sodium symporter activity(GO:0005334) |
| 0.8 | 3.2 | GO:0000702 | oxidized base lesion DNA N-glycosylase activity(GO:0000702) |
| 0.8 | 6.3 | GO:0044547 | DNA topoisomerase binding(GO:0044547) |
| 0.8 | 5.5 | GO:0001517 | N-acetylglucosamine 6-O-sulfotransferase activity(GO:0001517) |
| 0.8 | 3.9 | GO:0004875 | complement receptor activity(GO:0004875) |
| 0.8 | 0.8 | GO:0009378 | four-way junction helicase activity(GO:0009378) |
| 0.8 | 87.5 | GO:0005089 | Rho guanyl-nucleotide exchange factor activity(GO:0005089) |
| 0.8 | 12.4 | GO:0045125 | bioactive lipid receptor activity(GO:0045125) |
| 0.8 | 41.5 | GO:0017112 | Rab guanyl-nucleotide exchange factor activity(GO:0017112) |
| 0.8 | 4.5 | GO:0004563 | beta-N-acetylhexosaminidase activity(GO:0004563) |
| 0.8 | 12.8 | GO:0005092 | GDP-dissociation inhibitor activity(GO:0005092) |
| 0.7 | 26.0 | GO:0043394 | proteoglycan binding(GO:0043394) |
| 0.7 | 2.2 | GO:0004040 | amidase activity(GO:0004040) |
| 0.7 | 3.7 | GO:0005105 | type 1 fibroblast growth factor receptor binding(GO:0005105) |
| 0.7 | 5.8 | GO:0043426 | MRF binding(GO:0043426) |
| 0.7 | 31.8 | GO:0005164 | tumor necrosis factor receptor binding(GO:0005164) |
| 0.7 | 27.1 | GO:0016278 | lysine N-methyltransferase activity(GO:0016278) protein-lysine N-methyltransferase activity(GO:0016279) |
| 0.7 | 8.5 | GO:0005005 | transmembrane-ephrin receptor activity(GO:0005005) |
| 0.7 | 4.9 | GO:0017151 | DEAD/H-box RNA helicase binding(GO:0017151) |
| 0.7 | 3.5 | GO:0003989 | acetyl-CoA carboxylase activity(GO:0003989) |
| 0.7 | 2.1 | GO:0004142 | diacylglycerol cholinephosphotransferase activity(GO:0004142) |
| 0.7 | 3.5 | GO:0005152 | interleukin-1 receptor antagonist activity(GO:0005152) |
| 0.7 | 2.7 | GO:0030169 | low-density lipoprotein particle binding(GO:0030169) |
| 0.7 | 4.1 | GO:0042285 | UDP-xylosyltransferase activity(GO:0035252) xylosyltransferase activity(GO:0042285) |
| 0.7 | 10.9 | GO:0043325 | phosphatidylinositol-3,4-bisphosphate binding(GO:0043325) |
| 0.7 | 3.4 | GO:0047238 | glucuronosyl-N-acetylgalactosaminyl-proteoglycan 4-beta-N-acetylgalactosaminyltransferase activity(GO:0047238) |
| 0.7 | 13.6 | GO:0016805 | dipeptidase activity(GO:0016805) |
| 0.7 | 3.4 | GO:1990460 | leptin receptor binding(GO:1990460) |
| 0.7 | 10.2 | GO:0005344 | oxygen transporter activity(GO:0005344) |
| 0.7 | 40.5 | GO:0004112 | cyclic-nucleotide phosphodiesterase activity(GO:0004112) |
| 0.7 | 18.1 | GO:0031402 | sodium ion binding(GO:0031402) |
| 0.7 | 8.7 | GO:0042800 | histone methyltransferase activity (H3-K4 specific)(GO:0042800) |
| 0.7 | 15.2 | GO:0019789 | SUMO transferase activity(GO:0019789) |
| 0.7 | 10.5 | GO:0017136 | NAD-dependent histone deacetylase activity(GO:0017136) |
| 0.7 | 31.4 | GO:0001103 | RNA polymerase II repressing transcription factor binding(GO:0001103) |
| 0.6 | 3.2 | GO:0004666 | prostaglandin-endoperoxide synthase activity(GO:0004666) |
| 0.6 | 38.9 | GO:0001540 | beta-amyloid binding(GO:0001540) |
| 0.6 | 8.3 | GO:0031821 | G-protein coupled serotonin receptor binding(GO:0031821) |
| 0.6 | 1.3 | GO:0005010 | insulin-like growth factor-activated receptor activity(GO:0005010) |
| 0.6 | 18.4 | GO:0015002 | cytochrome-c oxidase activity(GO:0004129) heme-copper terminal oxidase activity(GO:0015002) oxidoreductase activity, acting on a heme group of donors, oxygen as acceptor(GO:0016676) |
| 0.6 | 3.1 | GO:0004095 | carnitine O-palmitoyltransferase activity(GO:0004095) |
| 0.6 | 4.4 | GO:0000268 | peroxisome targeting sequence binding(GO:0000268) |
| 0.6 | 20.9 | GO:0071889 | 14-3-3 protein binding(GO:0071889) |
| 0.6 | 4.2 | GO:0004499 | N,N-dimethylaniline monooxygenase activity(GO:0004499) |
| 0.6 | 3.6 | GO:0036033 | mediator complex binding(GO:0036033) |
| 0.6 | 1.2 | GO:0032795 | heterotrimeric G-protein binding(GO:0032795) |
| 0.6 | 2.4 | GO:0097100 | supercoiled DNA binding(GO:0097100) |
| 0.6 | 34.3 | GO:0030507 | spectrin binding(GO:0030507) |
| 0.6 | 5.3 | GO:0055131 | C3HC4-type RING finger domain binding(GO:0055131) |
| 0.6 | 6.3 | GO:1990380 | Lys48-specific deubiquitinase activity(GO:1990380) |
| 0.6 | 7.5 | GO:0001730 | 2'-5'-oligoadenylate synthetase activity(GO:0001730) |
| 0.6 | 4.6 | GO:0043995 | histone acetyltransferase activity (H4-K5 specific)(GO:0043995) histone acetyltransferase activity (H4-K8 specific)(GO:0043996) histone acetyltransferase activity (H4-K16 specific)(GO:0046972) |
| 0.6 | 2.3 | GO:0017077 | oxidative phosphorylation uncoupler activity(GO:0017077) |
| 0.6 | 4.5 | GO:0003958 | NADPH-hemoprotein reductase activity(GO:0003958) |
| 0.6 | 3.4 | GO:0005324 | long-chain fatty acid transporter activity(GO:0005324) |
| 0.6 | 6.1 | GO:0032266 | phosphatidylinositol-3-phosphate binding(GO:0032266) |
| 0.6 | 2.8 | GO:0016941 | natriuretic peptide receptor activity(GO:0016941) |
| 0.6 | 6.6 | GO:0050700 | CARD domain binding(GO:0050700) |
| 0.6 | 1.1 | GO:0035374 | chondroitin sulfate binding(GO:0035374) |
| 0.5 | 14.3 | GO:0004806 | triglyceride lipase activity(GO:0004806) |
| 0.5 | 7.7 | GO:0050693 | LBD domain binding(GO:0050693) |
| 0.5 | 58.9 | GO:0005070 | SH3/SH2 adaptor activity(GO:0005070) |
| 0.5 | 9.3 | GO:0017154 | semaphorin receptor activity(GO:0017154) |
| 0.5 | 5.4 | GO:0004691 | cAMP-dependent protein kinase activity(GO:0004691) |
| 0.5 | 4.8 | GO:0035251 | UDP-glucosyltransferase activity(GO:0035251) |
| 0.5 | 12.2 | GO:0004190 | aspartic-type endopeptidase activity(GO:0004190) aspartic-type peptidase activity(GO:0070001) |
| 0.5 | 9.5 | GO:0004535 | poly(A)-specific ribonuclease activity(GO:0004535) |
| 0.5 | 10.0 | GO:0008190 | eukaryotic initiation factor 4E binding(GO:0008190) |
| 0.5 | 5.8 | GO:0004332 | fructose-bisphosphate aldolase activity(GO:0004332) |
| 0.5 | 10.4 | GO:0050321 | tau-protein kinase activity(GO:0050321) |
| 0.5 | 7.2 | GO:0015501 | glutamate:sodium symporter activity(GO:0015501) |
| 0.5 | 1.5 | GO:0061629 | RNA polymerase II sequence-specific DNA binding transcription factor binding(GO:0061629) |
| 0.5 | 1.0 | GO:0004803 | transposase activity(GO:0004803) |
| 0.5 | 21.8 | GO:0004683 | calmodulin-dependent protein kinase activity(GO:0004683) |
| 0.5 | 5.1 | GO:0043024 | ribosomal small subunit binding(GO:0043024) |
| 0.5 | 2.5 | GO:0070740 | tubulin-glutamic acid ligase activity(GO:0070740) |
| 0.5 | 1.5 | GO:0047006 | 17-alpha,20-alpha-dihydroxypregn-4-en-3-one dehydrogenase activity(GO:0047006) |
| 0.5 | 1.5 | GO:0019959 | interleukin-8 binding(GO:0019959) |
| 0.5 | 3.0 | GO:0004046 | aminoacylase activity(GO:0004046) |
| 0.5 | 10.4 | GO:0031005 | filamin binding(GO:0031005) |
| 0.5 | 49.7 | GO:0004867 | serine-type endopeptidase inhibitor activity(GO:0004867) |
| 0.5 | 4.9 | GO:0010181 | FMN binding(GO:0010181) |
| 0.5 | 3.4 | GO:0042799 | histone methyltransferase activity (H4-K20 specific)(GO:0042799) |
| 0.5 | 12.1 | GO:0000993 | RNA polymerase II core binding(GO:0000993) |
| 0.5 | 1.9 | GO:0004146 | dihydrofolate reductase activity(GO:0004146) |
| 0.5 | 2.8 | GO:0008131 | primary amine oxidase activity(GO:0008131) |
| 0.5 | 0.9 | GO:0042954 | lipoprotein transporter activity(GO:0042954) |
| 0.5 | 6.5 | GO:0004089 | carbonate dehydratase activity(GO:0004089) |
| 0.5 | 3.2 | GO:0047184 | 1-acylglycerophosphocholine O-acyltransferase activity(GO:0047184) |
| 0.5 | 7.4 | GO:0070016 | armadillo repeat domain binding(GO:0070016) |
| 0.5 | 0.5 | GO:0003909 | DNA ligase activity(GO:0003909) |
| 0.5 | 1.4 | GO:0003845 | 11-beta-hydroxysteroid dehydrogenase [NAD(P)] activity(GO:0003845) |
| 0.5 | 1.4 | GO:0004662 | CAAX-protein geranylgeranyltransferase activity(GO:0004662) |
| 0.5 | 5.5 | GO:0003996 | acyl-CoA ligase activity(GO:0003996) |
| 0.5 | 3.2 | GO:0008970 | phosphatidylcholine 1-acylhydrolase activity(GO:0008970) |
| 0.4 | 6.7 | GO:0008175 | tRNA methyltransferase activity(GO:0008175) |
| 0.4 | 1.3 | GO:0015403 | thiamine transmembrane transporter activity(GO:0015234) thiamine uptake transmembrane transporter activity(GO:0015403) azole transporter activity(GO:0045118) azole transmembrane transporter activity(GO:1901474) |
| 0.4 | 1.3 | GO:0000014 | single-stranded DNA endodeoxyribonuclease activity(GO:0000014) |
| 0.4 | 8.3 | GO:0005158 | insulin receptor binding(GO:0005158) |
| 0.4 | 11.8 | GO:0035198 | miRNA binding(GO:0035198) |
| 0.4 | 13.6 | GO:0005248 | voltage-gated sodium channel activity(GO:0005248) voltage-gated ion channel activity involved in regulation of postsynaptic membrane potential(GO:1905030) |
| 0.4 | 11.8 | GO:0003746 | translation elongation factor activity(GO:0003746) |
| 0.4 | 2.6 | GO:0060698 | endoribonuclease inhibitor activity(GO:0060698) |
| 0.4 | 12.4 | GO:0015248 | sterol transporter activity(GO:0015248) |
| 0.4 | 4.3 | GO:0001135 | transcription factor activity, RNA polymerase II transcription factor recruiting(GO:0001135) |
| 0.4 | 21.6 | GO:0034987 | immunoglobulin receptor binding(GO:0034987) |
| 0.4 | 3.4 | GO:0004176 | ATP-dependent peptidase activity(GO:0004176) |
| 0.4 | 5.4 | GO:0030215 | semaphorin receptor binding(GO:0030215) |
| 0.4 | 2.1 | GO:0004105 | choline-phosphate cytidylyltransferase activity(GO:0004105) |
| 0.4 | 1.7 | GO:0043515 | kinetochore binding(GO:0043515) |
| 0.4 | 2.1 | GO:0000150 | recombinase activity(GO:0000150) |
| 0.4 | 5.3 | GO:0030228 | lipoprotein particle receptor activity(GO:0030228) |
| 0.4 | 109.0 | GO:0004252 | serine-type endopeptidase activity(GO:0004252) |
| 0.4 | 2.0 | GO:0004694 | eukaryotic translation initiation factor 2alpha kinase activity(GO:0004694) |
| 0.4 | 22.8 | GO:0004197 | cysteine-type endopeptidase activity(GO:0004197) |
| 0.4 | 2.0 | GO:0004910 | interleukin-1, Type II, blocking receptor activity(GO:0004910) |
| 0.4 | 5.2 | GO:0038191 | neuropilin binding(GO:0038191) |
| 0.4 | 1.6 | GO:0051870 | methotrexate binding(GO:0051870) folic acid receptor activity(GO:0061714) |
| 0.4 | 7.1 | GO:0016875 | aminoacyl-tRNA ligase activity(GO:0004812) ligase activity, forming carbon-oxygen bonds(GO:0016875) ligase activity, forming aminoacyl-tRNA and related compounds(GO:0016876) |
| 0.4 | 1.2 | GO:0003829 | beta-1,3-galactosyl-O-glycosyl-glycoprotein beta-1,6-N-acetylglucosaminyltransferase activity(GO:0003829) |
| 0.4 | 1.9 | GO:0017147 | Wnt-protein binding(GO:0017147) |
| 0.4 | 0.4 | GO:0042806 | fucose binding(GO:0042806) |
| 0.4 | 21.4 | GO:0070412 | R-SMAD binding(GO:0070412) |
| 0.4 | 4.6 | GO:0047372 | acylglycerol lipase activity(GO:0047372) |
| 0.4 | 0.8 | GO:0010861 | thyroid hormone receptor activator activity(GO:0010861) thyroid hormone receptor coactivator activity(GO:0030375) |
| 0.4 | 7.2 | GO:0005545 | 1-phosphatidylinositol binding(GO:0005545) |
| 0.4 | 1.9 | GO:0016918 | retinal binding(GO:0016918) |
| 0.4 | 1.5 | GO:0004609 | phosphatidylserine decarboxylase activity(GO:0004609) |
| 0.4 | 4.3 | GO:0008430 | selenium binding(GO:0008430) |
| 0.4 | 2.9 | GO:0035591 | signaling adaptor activity(GO:0035591) |
| 0.4 | 4.3 | GO:0001206 | transcriptional repressor activity, RNA polymerase II distal enhancer sequence-specific binding(GO:0001206) |
| 0.4 | 1.4 | GO:0001588 | dopamine neurotransmitter receptor activity, coupled via Gs(GO:0001588) |
| 0.4 | 1.4 | GO:0060002 | plus-end directed microfilament motor activity(GO:0060002) |
| 0.4 | 2.5 | GO:0039706 | co-receptor binding(GO:0039706) |
| 0.3 | 1.4 | GO:0016639 | oxidoreductase activity, acting on the CH-NH2 group of donors, NAD or NADP as acceptor(GO:0016639) |
| 0.3 | 1.4 | GO:0015222 | serotonin transmembrane transporter activity(GO:0015222) |
| 0.3 | 13.8 | GO:0042162 | telomeric DNA binding(GO:0042162) |
| 0.3 | 1.7 | GO:0030274 | LIM domain binding(GO:0030274) |
| 0.3 | 1.0 | GO:0050613 | delta14-sterol reductase activity(GO:0050613) |
| 0.3 | 2.0 | GO:0004111 | creatine kinase activity(GO:0004111) |
| 0.3 | 19.0 | GO:1990782 | protein tyrosine kinase binding(GO:1990782) |
| 0.3 | 1.0 | GO:0071074 | eukaryotic initiation factor eIF2 binding(GO:0071074) |
| 0.3 | 5.4 | GO:0019841 | retinol binding(GO:0019841) |
| 0.3 | 7.1 | GO:0097200 | cysteine-type endopeptidase activity involved in execution phase of apoptosis(GO:0097200) |
| 0.3 | 6.5 | GO:0001223 | transcription coactivator binding(GO:0001223) |
| 0.3 | 3.9 | GO:0005542 | folic acid binding(GO:0005542) |
| 0.3 | 1.0 | GO:0004711 | ribosomal protein S6 kinase activity(GO:0004711) |
| 0.3 | 2.9 | GO:0046920 | alpha-(1->3)-fucosyltransferase activity(GO:0046920) |
| 0.3 | 4.5 | GO:0042809 | vitamin D receptor binding(GO:0042809) |
| 0.3 | 1.0 | GO:0070644 | vitamin D response element binding(GO:0070644) |
| 0.3 | 15.6 | GO:0005160 | transforming growth factor beta receptor binding(GO:0005160) |
| 0.3 | 3.5 | GO:0001222 | transcription corepressor binding(GO:0001222) |
| 0.3 | 1.9 | GO:0004035 | alkaline phosphatase activity(GO:0004035) |
| 0.3 | 6.9 | GO:0042169 | SH2 domain binding(GO:0042169) |
| 0.3 | 0.6 | GO:0000822 | inositol hexakisphosphate binding(GO:0000822) |
| 0.3 | 2.5 | GO:0004723 | calcium-dependent protein serine/threonine phosphatase activity(GO:0004723) |
| 0.3 | 5.2 | GO:0008569 | ATP-dependent microtubule motor activity, minus-end-directed(GO:0008569) |
| 0.3 | 3.4 | GO:0008020 | G-protein coupled photoreceptor activity(GO:0008020) |
| 0.3 | 4.6 | GO:0005229 | intracellular calcium activated chloride channel activity(GO:0005229) |
| 0.3 | 1.5 | GO:0004966 | galanin receptor activity(GO:0004966) |
| 0.3 | 0.9 | GO:0004613 | phosphoenolpyruvate carboxykinase activity(GO:0004611) phosphoenolpyruvate carboxykinase (GTP) activity(GO:0004613) |
| 0.3 | 9.1 | GO:0005212 | structural constituent of eye lens(GO:0005212) |
| 0.3 | 4.5 | GO:0046875 | ephrin receptor binding(GO:0046875) |
| 0.3 | 10.9 | GO:0005184 | neuropeptide hormone activity(GO:0005184) |
| 0.3 | 0.9 | GO:0008381 | mechanically-gated ion channel activity(GO:0008381) mechanically gated channel activity(GO:0022833) |
| 0.3 | 2.4 | GO:0016413 | O-acetyltransferase activity(GO:0016413) |
| 0.3 | 1.5 | GO:0016841 | ammonia-lyase activity(GO:0016841) |
| 0.3 | 1.2 | GO:0015307 | drug:proton antiporter activity(GO:0015307) |
| 0.3 | 2.1 | GO:0097322 | 7SK snRNA binding(GO:0097322) |
| 0.3 | 12.3 | GO:0004715 | non-membrane spanning protein tyrosine kinase activity(GO:0004715) |
| 0.3 | 1.2 | GO:0070051 | fibrinogen binding(GO:0070051) |
| 0.3 | 2.0 | GO:0048407 | platelet-derived growth factor binding(GO:0048407) |
| 0.3 | 1.2 | GO:0089720 | caspase binding(GO:0089720) |
| 0.3 | 3.2 | GO:0043176 | amine binding(GO:0043176) serotonin binding(GO:0051378) |
| 0.3 | 23.2 | GO:0008080 | N-acetyltransferase activity(GO:0008080) |
| 0.3 | 8.0 | GO:0003887 | DNA-directed DNA polymerase activity(GO:0003887) |
| 0.3 | 4.5 | GO:0043274 | phospholipase binding(GO:0043274) |
| 0.3 | 3.7 | GO:0016868 | intramolecular transferase activity, phosphotransferases(GO:0016868) |
| 0.3 | 2.5 | GO:0046974 | histone methyltransferase activity (H3-K9 specific)(GO:0046974) |
| 0.3 | 3.4 | GO:0045504 | dynein heavy chain binding(GO:0045504) |
| 0.3 | 3.6 | GO:0015250 | water channel activity(GO:0015250) |
| 0.3 | 2.2 | GO:0070679 | inositol 1,4,5 trisphosphate binding(GO:0070679) |
| 0.3 | 25.7 | GO:0008013 | beta-catenin binding(GO:0008013) |
| 0.3 | 8.5 | GO:0043027 | cysteine-type endopeptidase inhibitor activity involved in apoptotic process(GO:0043027) |
| 0.3 | 74.6 | GO:0005096 | GTPase activator activity(GO:0005096) |
| 0.3 | 9.2 | GO:0030296 | protein tyrosine kinase activator activity(GO:0030296) |
| 0.3 | 3.2 | GO:0034450 | ubiquitin-ubiquitin ligase activity(GO:0034450) |
| 0.3 | 0.8 | GO:0008142 | oxysterol binding(GO:0008142) |
| 0.3 | 0.8 | GO:0008281 | sulfonylurea receptor activity(GO:0008281) |
| 0.3 | 1.3 | GO:0045294 | alpha-catenin binding(GO:0045294) |
| 0.3 | 2.1 | GO:0005250 | A-type (transient outward) potassium channel activity(GO:0005250) |
| 0.3 | 1.0 | GO:0005148 | prolactin receptor binding(GO:0005148) |
| 0.3 | 4.6 | GO:0004062 | aryl sulfotransferase activity(GO:0004062) |
| 0.2 | 358.0 | GO:0001071 | nucleic acid binding transcription factor activity(GO:0001071) transcription factor activity, sequence-specific DNA binding(GO:0003700) |
| 0.2 | 3.2 | GO:0004143 | diacylglycerol kinase activity(GO:0004143) |
| 0.2 | 2.2 | GO:0004767 | sphingomyelin phosphodiesterase activity(GO:0004767) |
| 0.2 | 4.4 | GO:0032451 | demethylase activity(GO:0032451) |
| 0.2 | 2.4 | GO:0004383 | guanylate cyclase activity(GO:0004383) |
| 0.2 | 2.2 | GO:0035197 | siRNA binding(GO:0035197) |
| 0.2 | 1.0 | GO:0045569 | TRAIL binding(GO:0045569) |
| 0.2 | 5.8 | GO:0098811 | transcriptional activator activity, RNA polymerase II transcription factor binding(GO:0001190) transcriptional repressor activity, RNA polymerase II activating transcription factor binding(GO:0098811) |
| 0.2 | 10.9 | GO:0005544 | calcium-dependent phospholipid binding(GO:0005544) |
| 0.2 | 4.6 | GO:0070530 | K63-linked polyubiquitin binding(GO:0070530) |
| 0.2 | 0.7 | GO:0042020 | interleukin-23 binding(GO:0042019) interleukin-23 receptor activity(GO:0042020) |
| 0.2 | 1.6 | GO:0016167 | glial cell-derived neurotrophic factor receptor activity(GO:0016167) |
| 0.2 | 6.0 | GO:0005080 | protein kinase C binding(GO:0005080) |
| 0.2 | 5.1 | GO:0017075 | syntaxin-1 binding(GO:0017075) |
| 0.2 | 0.4 | GO:0004530 | deoxyribonuclease I activity(GO:0004530) |
| 0.2 | 0.6 | GO:0022858 | L-alanine transmembrane transporter activity(GO:0015180) alanine transmembrane transporter activity(GO:0022858) |
| 0.2 | 0.6 | GO:0004618 | copper-exporting ATPase activity(GO:0004008) phosphoglycerate kinase activity(GO:0004618) copper-transporting ATPase activity(GO:0043682) |
| 0.2 | 2.1 | GO:0022841 | potassium ion leak channel activity(GO:0022841) |
| 0.2 | 5.1 | GO:0016712 | oxidoreductase activity, acting on paired donors, with incorporation or reduction of molecular oxygen, reduced flavin or flavoprotein as one donor, and incorporation of one atom of oxygen(GO:0016712) |
| 0.2 | 14.5 | GO:0005179 | hormone activity(GO:0005179) |
| 0.2 | 0.9 | GO:0044736 | acid-sensing ion channel activity(GO:0044736) |
| 0.2 | 22.5 | GO:0005178 | integrin binding(GO:0005178) |
| 0.2 | 2.1 | GO:0031995 | insulin-like growth factor II binding(GO:0031995) |
| 0.2 | 2.5 | GO:0004065 | arylsulfatase activity(GO:0004065) |
| 0.2 | 10.7 | GO:0002020 | protease binding(GO:0002020) |
| 0.2 | 0.8 | GO:0004668 | protein-arginine deiminase activity(GO:0004668) |
| 0.2 | 5.8 | GO:0017046 | peptide hormone binding(GO:0017046) |
| 0.2 | 20.7 | GO:0005249 | voltage-gated potassium channel activity(GO:0005249) |
| 0.2 | 2.2 | GO:0086056 | voltage-gated calcium channel activity involved in AV node cell action potential(GO:0086056) |
| 0.2 | 1.0 | GO:0004994 | somatostatin receptor activity(GO:0004994) |
| 0.2 | 4.5 | GO:0016702 | oxidoreductase activity, acting on single donors with incorporation of molecular oxygen(GO:0016701) oxidoreductase activity, acting on single donors with incorporation of molecular oxygen, incorporation of two atoms of oxygen(GO:0016702) |
| 0.2 | 1.9 | GO:0015144 | carbohydrate transmembrane transporter activity(GO:0015144) carbohydrate transporter activity(GO:1901476) |
| 0.2 | 1.3 | GO:1990381 | ubiquitin-specific protease binding(GO:1990381) |
| 0.2 | 0.9 | GO:0016647 | oxidoreductase activity, acting on the CH-NH group of donors, oxygen as acceptor(GO:0016647) |
| 0.2 | 0.9 | GO:0030197 | extracellular matrix constituent, lubricant activity(GO:0030197) |
| 0.2 | 3.6 | GO:0005109 | frizzled binding(GO:0005109) |
| 0.2 | 3.4 | GO:0050998 | nitric-oxide synthase binding(GO:0050998) |
| 0.2 | 0.5 | GO:0004461 | lactose synthase activity(GO:0004461) |
| 0.2 | 3.5 | GO:0070008 | serine-type carboxypeptidase activity(GO:0004185) serine-type exopeptidase activity(GO:0070008) |
| 0.2 | 8.7 | GO:0004714 | transmembrane receptor protein tyrosine kinase activity(GO:0004714) |
| 0.2 | 1.4 | GO:0047498 | calcium-dependent phospholipase A2 activity(GO:0047498) |
| 0.2 | 3.1 | GO:0043621 | protein self-association(GO:0043621) |
| 0.2 | 1.0 | GO:0043548 | phosphatidylinositol 3-kinase binding(GO:0043548) |
| 0.2 | 2.2 | GO:0022851 | GABA-gated chloride ion channel activity(GO:0022851) |
| 0.2 | 1.0 | GO:0045134 | uridine-diphosphatase activity(GO:0045134) |
| 0.2 | 0.8 | GO:0008048 | calcium sensitive guanylate cyclase activator activity(GO:0008048) |
| 0.2 | 5.1 | GO:0001085 | RNA polymerase II transcription factor binding(GO:0001085) |
| 0.2 | 5.7 | GO:0015179 | L-amino acid transmembrane transporter activity(GO:0015179) |
| 0.2 | 110.7 | GO:0004888 | transmembrane signaling receptor activity(GO:0004888) |
| 0.2 | 0.7 | GO:0005384 | manganese ion transmembrane transporter activity(GO:0005384) |
| 0.2 | 1.5 | GO:0046703 | natural killer cell lectin-like receptor binding(GO:0046703) |
| 0.2 | 1.1 | GO:0001165 | RNA polymerase I upstream control element sequence-specific DNA binding(GO:0001165) |
| 0.2 | 1.3 | GO:0004126 | cytidine deaminase activity(GO:0004126) |
| 0.2 | 1.2 | GO:0031957 | very long-chain fatty acid-CoA ligase activity(GO:0031957) |
| 0.1 | 1.7 | GO:0001948 | glycoprotein binding(GO:0001948) |
| 0.1 | 2.7 | GO:0001972 | retinoic acid binding(GO:0001972) |
| 0.1 | 1.0 | GO:0015643 | toxic substance binding(GO:0015643) |
| 0.1 | 13.7 | GO:0044325 | ion channel binding(GO:0044325) |
| 0.1 | 10.3 | GO:0016209 | antioxidant activity(GO:0016209) |
| 0.1 | 3.4 | GO:0042605 | peptide antigen binding(GO:0042605) |
| 0.1 | 0.5 | GO:0017057 | 6-phosphogluconolactonase activity(GO:0017057) |
| 0.1 | 5.4 | GO:0005484 | SNAP receptor activity(GO:0005484) |
| 0.1 | 0.5 | GO:0035243 | protein-arginine omega-N symmetric methyltransferase activity(GO:0035243) |
| 0.1 | 1.4 | GO:0017049 | GTP-Rho binding(GO:0017049) |
| 0.1 | 0.7 | GO:0035612 | AP-2 adaptor complex binding(GO:0035612) |
| 0.1 | 2.7 | GO:0004012 | phospholipid-translocating ATPase activity(GO:0004012) |
| 0.1 | 4.4 | GO:0019201 | nucleotide kinase activity(GO:0019201) |
| 0.1 | 2.0 | GO:0015295 | solute:proton symporter activity(GO:0015295) |
| 0.1 | 2.7 | GO:0070006 | metalloaminopeptidase activity(GO:0070006) |
| 0.1 | 4.4 | GO:0008139 | nuclear localization sequence binding(GO:0008139) |
| 0.1 | 0.6 | GO:0004013 | adenosylhomocysteinase activity(GO:0004013) trialkylsulfonium hydrolase activity(GO:0016802) |
| 0.1 | 0.8 | GO:0031545 | peptidyl-proline 4-dioxygenase activity(GO:0031545) |
| 0.1 | 0.9 | GO:0086080 | protein binding involved in heterotypic cell-cell adhesion(GO:0086080) |
| 0.1 | 1.4 | GO:0022820 | potassium:chloride symporter activity(GO:0015379) potassium ion symporter activity(GO:0022820) |
| 0.1 | 27.1 | GO:0060089 | receptor activity(GO:0004872) molecular transducer activity(GO:0060089) |
| 0.1 | 1.7 | GO:0070182 | DNA polymerase binding(GO:0070182) |
| 0.1 | 0.8 | GO:0016783 | sulfurtransferase activity(GO:0016783) |
| 0.1 | 2.8 | GO:0050840 | extracellular matrix binding(GO:0050840) |
| 0.1 | 3.4 | GO:0016782 | transferase activity, transferring sulfur-containing groups(GO:0016782) |
| 0.1 | 0.5 | GO:0001758 | retinal dehydrogenase activity(GO:0001758) |
| 0.1 | 0.2 | GO:0000248 | C-5 sterol desaturase activity(GO:0000248) sterol desaturase activity(GO:0070704) |
| 0.1 | 0.8 | GO:0031014 | troponin T binding(GO:0031014) |
| 0.1 | 0.6 | GO:0047623 | AMP deaminase activity(GO:0003876) adenosine-phosphate deaminase activity(GO:0047623) |
| 0.1 | 0.3 | GO:0005157 | macrophage colony-stimulating factor receptor binding(GO:0005157) |
| 0.1 | 0.9 | GO:0004181 | metallocarboxypeptidase activity(GO:0004181) |
| 0.1 | 0.3 | GO:0004140 | dephospho-CoA kinase activity(GO:0004140) |
| 0.1 | 2.6 | GO:0048306 | calcium-dependent protein binding(GO:0048306) |
| 0.1 | 1.4 | GO:0051213 | dioxygenase activity(GO:0051213) |
| 0.1 | 3.4 | GO:0005201 | extracellular matrix structural constituent(GO:0005201) |
| 0.0 | 0.4 | GO:0030884 | lipid antigen binding(GO:0030882) endogenous lipid antigen binding(GO:0030883) exogenous lipid antigen binding(GO:0030884) lipopeptide binding(GO:0071723) |
| 0.0 | 0.4 | GO:0008191 | metalloendopeptidase inhibitor activity(GO:0008191) |
| 0.0 | 0.7 | GO:0030898 | actin-dependent ATPase activity(GO:0030898) |
| 0.0 | 1.2 | GO:0015171 | amino acid transmembrane transporter activity(GO:0015171) |
| 0.0 | 0.3 | GO:0035368 | selenocysteine insertion sequence binding(GO:0035368) |
| 0.0 | 0.2 | GO:0043199 | sulfate binding(GO:0043199) |
| 0.0 | 0.1 | GO:0003858 | 3-hydroxybutyrate dehydrogenase activity(GO:0003858) |
| 0.0 | 0.9 | GO:0031683 | G-protein beta/gamma-subunit complex binding(GO:0031683) |
| 0.0 | 0.4 | GO:0017081 | chloride channel regulator activity(GO:0017081) |
| 0.0 | 0.8 | GO:0015347 | sodium-independent organic anion transmembrane transporter activity(GO:0015347) |
| 0.0 | 0.1 | GO:0003873 | 6-phosphofructo-2-kinase activity(GO:0003873) |
| 0.0 | 0.1 | GO:0047288 | monosialoganglioside sialyltransferase activity(GO:0047288) |
Gene overrepresentation in curated gene sets: canonical pathways category:
| Log-likelihood per target | Total log-likelihood | Term | Description |
|---|---|---|---|
| 4.3 | 208.6 | PID INTEGRIN2 PATHWAY | Beta2 integrin cell surface interactions |
| 2.8 | 111.0 | SA CASPASE CASCADE | Apoptosis is mediated by caspases, cysteine proteases arranged in a proteolytic cascade. |
| 2.2 | 53.9 | PID IL5 PATHWAY | IL5-mediated signaling events |
| 2.0 | 190.9 | PID FCER1 PATHWAY | Fc-epsilon receptor I signaling in mast cells |
| 1.9 | 95.1 | PID HIV NEF PATHWAY | HIV-1 Nef: Negative effector of Fas and TNF-alpha |
| 1.7 | 29.6 | PID P38 MK2 PATHWAY | p38 signaling mediated by MAPKAP kinases |
| 1.5 | 1.5 | PID CXCR3 PATHWAY | CXCR3-mediated signaling events |
| 1.5 | 105.3 | PID TCR PATHWAY | TCR signaling in naïve CD4+ T cells |
| 1.4 | 29.6 | PID S1P S1P4 PATHWAY | S1P4 pathway |
| 1.3 | 45.5 | SA MMP CYTOKINE CONNECTION | Cytokines can induce activation of matrix metalloproteinases, which degrade extracellular matrix. |
| 1.2 | 62.9 | PID CASPASE PATHWAY | Caspase cascade in apoptosis |
| 1.2 | 35.6 | ST GA12 PATHWAY | G alpha 12 Pathway |
| 1.1 | 31.0 | PID IL12 STAT4 PATHWAY | IL12 signaling mediated by STAT4 |
| 1.1 | 14.2 | PID INTEGRIN3 PATHWAY | Beta3 integrin cell surface interactions |
| 1.0 | 32.0 | PID IL2 STAT5 PATHWAY | IL2 signaling events mediated by STAT5 |
| 0.9 | 27.2 | PID UPA UPAR PATHWAY | Urokinase-type plasminogen activator (uPA) and uPAR-mediated signaling |
| 0.9 | 27.2 | PID TOLL ENDOGENOUS PATHWAY | Endogenous TLR signaling |
| 0.9 | 74.4 | PID RHOA REG PATHWAY | Regulation of RhoA activity |
| 0.9 | 5.4 | PID GMCSF PATHWAY | GMCSF-mediated signaling events |
| 0.9 | 7.1 | ST INTERFERON GAMMA PATHWAY | Interferon gamma pathway. |
| 0.9 | 46.7 | PID CDC42 REG PATHWAY | Regulation of CDC42 activity |
| 0.8 | 14.7 | ST TUMOR NECROSIS FACTOR PATHWAY | Tumor Necrosis Factor Pathway. |
| 0.8 | 37.7 | PID RXR VDR PATHWAY | RXR and RAR heterodimerization with other nuclear receptor |
| 0.8 | 3.1 | PID TCR RAS PATHWAY | Ras signaling in the CD4+ TCR pathway |
| 0.8 | 16.8 | PID INTEGRIN5 PATHWAY | Beta5 beta6 beta7 and beta8 integrin cell surface interactions |
| 0.8 | 14.5 | PID ERBB1 RECEPTOR PROXIMAL PATHWAY | EGF receptor (ErbB1) signaling pathway |
| 0.7 | 21.9 | SIG CD40PATHWAYMAP | Genes related to CD40 signaling |
| 0.7 | 35.5 | PID IL6 7 PATHWAY | IL6-mediated signaling events |
| 0.7 | 18.4 | PID ALPHA SYNUCLEIN PATHWAY | Alpha-synuclein signaling |
| 0.7 | 2.1 | ST B CELL ANTIGEN RECEPTOR | B Cell Antigen Receptor |
| 0.7 | 12.5 | PID S1P S1P3 PATHWAY | S1P3 pathway |
| 0.7 | 22.0 | PID BCR 5PATHWAY | BCR signaling pathway |
| 0.7 | 15.6 | PID IL8 CXCR1 PATHWAY | IL8- and CXCR1-mediated signaling events |
| 0.7 | 20.9 | PID IFNG PATHWAY | IFN-gamma pathway |
| 0.7 | 3.3 | PID BARD1 PATHWAY | BARD1 signaling events |
| 0.6 | 27.6 | PID CERAMIDE PATHWAY | Ceramide signaling pathway |
| 0.6 | 109.8 | NABA ECM AFFILIATED | Genes encoding proteins affiliated structurally or functionally to extracellular matrix proteins |
| 0.6 | 72.3 | PID MYC REPRESS PATHWAY | Validated targets of C-MYC transcriptional repression |
| 0.6 | 3.6 | PID AVB3 INTEGRIN PATHWAY | Integrins in angiogenesis |
| 0.6 | 26.5 | PID PDGFRB PATHWAY | PDGFR-beta signaling pathway |
| 0.6 | 19.6 | PID MAPK TRK PATHWAY | Trk receptor signaling mediated by the MAPK pathway |
| 0.6 | 32.0 | PID RAC1 PATHWAY | RAC1 signaling pathway |
| 0.6 | 6.7 | PID ER NONGENOMIC PATHWAY | Plasma membrane estrogen receptor signaling |
| 0.5 | 2.2 | PID NFAT 3PATHWAY | Role of Calcineurin-dependent NFAT signaling in lymphocytes |
| 0.5 | 3.2 | PID PI3KCI AKT PATHWAY | Class I PI3K signaling events mediated by Akt |
| 0.5 | 16.4 | ST T CELL SIGNAL TRANSDUCTION | T Cell Signal Transduction |
| 0.5 | 16.0 | PID IL12 2PATHWAY | IL12-mediated signaling events |
| 0.5 | 13.5 | PID WNT CANONICAL PATHWAY | Canonical Wnt signaling pathway |
| 0.5 | 3.9 | ST PHOSPHOINOSITIDE 3 KINASE PATHWAY | PI3K Pathway |
| 0.5 | 6.4 | PID EPHA FWDPATHWAY | EPHA forward signaling |
| 0.5 | 15.9 | PID LYSOPHOSPHOLIPID PATHWAY | LPA receptor mediated events |
| 0.5 | 26.6 | PID HNF3A PATHWAY | FOXA1 transcription factor network |
| 0.4 | 14.0 | PID RHOA PATHWAY | RhoA signaling pathway |
| 0.4 | 10.8 | PID ENDOTHELIN PATHWAY | Endothelins |
| 0.4 | 10.9 | PID FRA PATHWAY | Validated transcriptional targets of AP1 family members Fra1 and Fra2 |
| 0.4 | 17.6 | NABA COLLAGENS | Genes encoding collagen proteins |
| 0.4 | 4.3 | PID THROMBIN PAR1 PATHWAY | PAR1-mediated thrombin signaling events |
| 0.4 | 7.8 | PID INTEGRIN A9B1 PATHWAY | Alpha9 beta1 integrin signaling events |
| 0.3 | 6.5 | PID INSULIN PATHWAY | Insulin Pathway |
| 0.3 | 4.1 | PID P38 MKK3 6PATHWAY | p38 MAPK signaling pathway |
| 0.3 | 20.5 | PID LKB1 PATHWAY | LKB1 signaling events |
| 0.3 | 16.6 | PID NFAT TFPATHWAY | Calcineurin-regulated NFAT-dependent transcription in lymphocytes |
| 0.3 | 11.4 | PID P75 NTR PATHWAY | p75(NTR)-mediated signaling |
| 0.3 | 16.0 | PID MTOR 4PATHWAY | mTOR signaling pathway |
| 0.3 | 16.8 | PID AR TF PATHWAY | Regulation of Androgen receptor activity |
| 0.3 | 4.2 | PID VEGFR1 PATHWAY | VEGFR1 specific signals |
| 0.3 | 1.1 | PID EPO PATHWAY | EPO signaling pathway |
| 0.3 | 5.2 | PID TNF PATHWAY | TNF receptor signaling pathway |
| 0.3 | 1.1 | PID PDGFRA PATHWAY | PDGFR-alpha signaling pathway |
| 0.3 | 54.3 | NABA ECM GLYCOPROTEINS | Genes encoding structural ECM glycoproteins |
| 0.3 | 5.2 | SIG BCR SIGNALING PATHWAY | Members of the BCR signaling pathway |
| 0.2 | 84.8 | NABA SECRETED FACTORS | Genes encoding secreted soluble factors |
| 0.2 | 12.8 | PID TRKR PATHWAY | Neurotrophic factor-mediated Trk receptor signaling |
| 0.2 | 56.2 | NABA ECM REGULATORS | Genes encoding enzymes and their regulators involved in the remodeling of the extracellular matrix |
| 0.2 | 2.5 | PID RET PATHWAY | Signaling events regulated by Ret tyrosine kinase |
| 0.2 | 2.4 | PID TCR CALCIUM PATHWAY | Calcium signaling in the CD4+ TCR pathway |
| 0.2 | 4.1 | PID HEDGEHOG 2PATHWAY | Signaling events mediated by the Hedgehog family |
| 0.2 | 5.5 | PID EPHB FWD PATHWAY | EPHB forward signaling |
| 0.2 | 6.0 | PID HIF2PATHWAY | HIF-2-alpha transcription factor network |
| 0.2 | 2.9 | PID IL2 1PATHWAY | IL2-mediated signaling events |
| 0.2 | 3.2 | PID PTP1B PATHWAY | Signaling events mediated by PTP1B |
| 0.2 | 7.8 | PID BMP PATHWAY | BMP receptor signaling |
| 0.2 | 2.1 | ST G ALPHA I PATHWAY | G alpha i Pathway |
| 0.2 | 6.6 | PID SMAD2 3NUCLEAR PATHWAY | Regulation of nuclear SMAD2/3 signaling |
| 0.2 | 0.9 | SA PTEN PATHWAY | PTEN is a tumor suppressor that dephosphorylates the lipid messenger phosphatidylinositol triphosphate. |
| 0.2 | 2.1 | PID HEDGEHOG GLI PATHWAY | Hedgehog signaling events mediated by Gli proteins |
| 0.1 | 2.3 | ST WNT BETA CATENIN PATHWAY | Wnt/beta-catenin Pathway |
| 0.1 | 0.4 | PID NECTIN PATHWAY | Nectin adhesion pathway |
| 0.1 | 1.3 | PID DNA PK PATHWAY | DNA-PK pathway in nonhomologous end joining |
| 0.1 | 12.2 | PID BETA CATENIN NUC PATHWAY | Regulation of nuclear beta catenin signaling and target gene transcription |
| 0.1 | 1.0 | PID TXA2PATHWAY | Thromboxane A2 receptor signaling |
| 0.1 | 3.8 | PID RHODOPSIN PATHWAY | Visual signal transduction: Rods |
| 0.1 | 2.9 | PID FGF PATHWAY | FGF signaling pathway |
| 0.1 | 1.0 | PID ERBB2 ERBB3 PATHWAY | ErbB2/ErbB3 signaling events |
| 0.0 | 0.3 | PID AMB2 NEUTROPHILS PATHWAY | amb2 Integrin signaling |
| 0.0 | 0.3 | PID REELIN PATHWAY | Reelin signaling pathway |
| 0.0 | 1.3 | PID HNF3B PATHWAY | FOXA2 and FOXA3 transcription factor networks |
| 0.0 | 1.7 | PID CMYB PATHWAY | C-MYB transcription factor network |
| 0.0 | 0.2 | PID MYC PATHWAY | C-MYC pathway |
Gene overrepresentation in curated gene sets: REACTOME pathways category:
| Log-likelihood per target | Total log-likelihood | Term | Description |
|---|---|---|---|
| 5.2 | 68.1 | REACTOME RECRUITMENT OF NUMA TO MITOTIC CENTROSOMES | Genes involved in Recruitment of NuMA to mitotic centrosomes |
| 4.6 | 27.7 | REACTOME BINDING AND ENTRY OF HIV VIRION | Genes involved in Binding and entry of HIV virion |
| 4.4 | 60.9 | REACTOME PLATELET ADHESION TO EXPOSED COLLAGEN | Genes involved in Platelet Adhesion to exposed collagen |
| 3.8 | 15.4 | REACTOME ENDOSOMAL VACUOLAR PATHWAY | Genes involved in Endosomal/Vacuolar pathway |
| 3.7 | 376.9 | REACTOME IMMUNOREGULATORY INTERACTIONS BETWEEN A LYMPHOID AND A NON LYMPHOID CELL | Genes involved in Immunoregulatory interactions between a Lymphoid and a non-Lymphoid cell |
| 3.3 | 49.2 | REACTOME PHOSPHORYLATION OF CD3 AND TCR ZETA CHAINS | Genes involved in Phosphorylation of CD3 and TCR zeta chains |
| 2.2 | 46.6 | REACTOME IL 7 SIGNALING | Genes involved in Interleukin-7 signaling |
| 2.2 | 10.9 | REACTOME PD1 SIGNALING | Genes involved in PD-1 signaling |
| 2.2 | 17.2 | REACTOME PACKAGING OF TELOMERE ENDS | Genes involved in Packaging Of Telomere Ends |
| 1.7 | 3.5 | REACTOME IRAK1 RECRUITS IKK COMPLEX | Genes involved in IRAK1 recruits IKK complex |
| 1.6 | 30.4 | REACTOME NFKB ACTIVATION THROUGH FADD RIP1 PATHWAY MEDIATED BY CASPASE 8 AND10 | Genes involved in NF-kB activation through FADD/RIP-1 pathway mediated by caspase-8 and -10 |
| 1.6 | 40.5 | REACTOME GENERATION OF SECOND MESSENGER MOLECULES | Genes involved in Generation of second messenger molecules |
| 1.5 | 21.2 | REACTOME ACTIVATION OF CHAPERONE GENES BY ATF6 ALPHA | Genes involved in Activation of Chaperone Genes by ATF6-alpha |
| 1.5 | 47.9 | REACTOME ACTIVATED AMPK STIMULATES FATTY ACID OXIDATION IN MUSCLE | Genes involved in Activated AMPK stimulates fatty-acid oxidation in muscle |
| 1.5 | 40.1 | REACTOME PRE NOTCH PROCESSING IN GOLGI | Genes involved in Pre-NOTCH Processing in Golgi |
| 1.4 | 20.2 | REACTOME IL 6 SIGNALING | Genes involved in Interleukin-6 signaling |
| 1.4 | 8.3 | REACTOME G PROTEIN ACTIVATION | Genes involved in G-protein activation |
| 1.3 | 23.6 | REACTOME THE NLRP3 INFLAMMASOME | Genes involved in The NLRP3 inflammasome |
| 1.3 | 10.4 | REACTOME SIGNAL ATTENUATION | Genes involved in Signal attenuation |
| 1.2 | 9.8 | REACTOME THROMBIN SIGNALLING THROUGH PROTEINASE ACTIVATED RECEPTORS PARS | Genes involved in Thrombin signalling through proteinase activated receptors (PARs) |
| 1.2 | 1.2 | REACTOME PROSTACYCLIN SIGNALLING THROUGH PROSTACYCLIN RECEPTOR | Genes involved in Prostacyclin signalling through prostacyclin receptor |
| 1.2 | 5.9 | REACTOME REGULATION OF RHEB GTPASE ACTIVITY BY AMPK | Genes involved in Regulation of Rheb GTPase activity by AMPK |
| 1.1 | 49.4 | REACTOME LATENT INFECTION OF HOMO SAPIENS WITH MYCOBACTERIUM TUBERCULOSIS | Genes involved in Latent infection of Homo sapiens with Mycobacterium tuberculosis |
| 1.1 | 14.2 | REACTOME THE ACTIVATION OF ARYLSULFATASES | Genes involved in The activation of arylsulfatases |
| 1.1 | 15.3 | REACTOME G ALPHA1213 SIGNALLING EVENTS | Genes involved in G alpha (12/13) signalling events |
| 1.0 | 27.7 | REACTOME ACTIVATION OF THE AP1 FAMILY OF TRANSCRIPTION FACTORS | Genes involved in Activation of the AP-1 family of transcription factors |
| 1.0 | 78.4 | REACTOME METABOLISM OF VITAMINS AND COFACTORS | Genes involved in Metabolism of vitamins and cofactors |
| 1.0 | 18.7 | REACTOME REGULATION OF MRNA STABILITY BY PROTEINS THAT BIND AU RICH ELEMENTS | Genes involved in Regulation of mRNA Stability by Proteins that Bind AU-rich Elements |
| 1.0 | 1.0 | REACTOME SIGNAL AMPLIFICATION | Genes involved in Signal amplification |
| 1.0 | 33.4 | REACTOME GPVI MEDIATED ACTIVATION CASCADE | Genes involved in GPVI-mediated activation cascade |
| 0.9 | 7.6 | REACTOME GRB2 SOS PROVIDES LINKAGE TO MAPK SIGNALING FOR INTERGRINS | Genes involved in GRB2:SOS provides linkage to MAPK signaling for Intergrins |
| 0.9 | 5.5 | REACTOME FORMATION OF THE HIV1 EARLY ELONGATION COMPLEX | Genes involved in Formation of the HIV-1 Early Elongation Complex |
| 0.9 | 36.4 | REACTOME AMYLOIDS | Genes involved in Amyloids |
| 0.9 | 2.7 | REACTOME MRNA CAPPING | Genes involved in mRNA Capping |
| 0.9 | 11.8 | REACTOME SIGNALING BY EGFR IN CANCER | Genes involved in Signaling by EGFR in Cancer |
| 0.9 | 9.8 | REACTOME G ALPHA Z SIGNALLING EVENTS | Genes involved in G alpha (z) signalling events |
| 0.9 | 80.2 | REACTOME INTERFERON ALPHA BETA SIGNALING | Genes involved in Interferon alpha/beta signaling |
| 0.9 | 13.6 | REACTOME REVERSIBLE HYDRATION OF CARBON DIOXIDE | Genes involved in Reversible Hydration of Carbon Dioxide |
| 0.8 | 37.6 | REACTOME BASIGIN INTERACTIONS | Genes involved in Basigin interactions |
| 0.8 | 145.5 | REACTOME SIGNALING BY RHO GTPASES | Genes involved in Signaling by Rho GTPases |
| 0.8 | 52.0 | REACTOME CHEMOKINE RECEPTORS BIND CHEMOKINES | Genes involved in Chemokine receptors bind chemokines |
| 0.8 | 5.8 | REACTOME IKK COMPLEX RECRUITMENT MEDIATED BY RIP1 | Genes involved in IKK complex recruitment mediated by RIP1 |
| 0.8 | 5.7 | REACTOME CS DS DEGRADATION | Genes involved in CS/DS degradation |
| 0.8 | 13.7 | REACTOME REGULATION OF PYRUVATE DEHYDROGENASE PDH COMPLEX | Genes involved in Regulation of pyruvate dehydrogenase (PDH) complex |
| 0.8 | 7.2 | REACTOME TRAFFICKING AND PROCESSING OF ENDOSOMAL TLR | Genes involved in Trafficking and processing of endosomal TLR |
| 0.8 | 30.5 | REACTOME RAP1 SIGNALLING | Genes involved in Rap1 signalling |
| 0.8 | 16.9 | REACTOME ABCA TRANSPORTERS IN LIPID HOMEOSTASIS | Genes involved in ABCA transporters in lipid homeostasis |
| 0.7 | 16.4 | REACTOME TERMINATION OF O GLYCAN BIOSYNTHESIS | Genes involved in Termination of O-glycan biosynthesis |
| 0.7 | 6.5 | REACTOME COMMON PATHWAY | Genes involved in Common Pathway |
| 0.7 | 5.0 | REACTOME SIGNALING BY ERBB2 | Genes involved in Signaling by ERBB2 |
| 0.7 | 3.6 | REACTOME TRAF6 MEDIATED IRF7 ACTIVATION IN TLR7 8 OR 9 SIGNALING | Genes involved in TRAF6 mediated IRF7 activation in TLR7/8 or 9 signaling |
| 0.7 | 9.3 | REACTOME DCC MEDIATED ATTRACTIVE SIGNALING | Genes involved in DCC mediated attractive signaling |
| 0.7 | 14.2 | REACTOME ADENYLATE CYCLASE INHIBITORY PATHWAY | Genes involved in Adenylate cyclase inhibitory pathway |
| 0.7 | 16.4 | REACTOME GROWTH HORMONE RECEPTOR SIGNALING | Genes involved in Growth hormone receptor signaling |
| 0.6 | 13.1 | REACTOME OTHER SEMAPHORIN INTERACTIONS | Genes involved in Other semaphorin interactions |
| 0.6 | 24.9 | REACTOME A TETRASACCHARIDE LINKER SEQUENCE IS REQUIRED FOR GAG SYNTHESIS | Genes involved in A tetrasaccharide linker sequence is required for GAG synthesis |
| 0.6 | 9.8 | REACTOME MITOCHONDRIAL TRNA AMINOACYLATION | Genes involved in Mitochondrial tRNA aminoacylation |
| 0.6 | 1.8 | REACTOME CROSS PRESENTATION OF SOLUBLE EXOGENOUS ANTIGENS ENDOSOMES | Genes involved in Cross-presentation of soluble exogenous antigens (endosomes) |
| 0.6 | 14.5 | REACTOME IL RECEPTOR SHC SIGNALING | Genes involved in Interleukin receptor SHC signaling |
| 0.6 | 12.5 | REACTOME GLUCAGON TYPE LIGAND RECEPTORS | Genes involved in Glucagon-type ligand receptors |
| 0.6 | 7.1 | REACTOME REGULATION OF THE FANCONI ANEMIA PATHWAY | Genes involved in Regulation of the Fanconi anemia pathway |
| 0.6 | 4.1 | REACTOME ERKS ARE INACTIVATED | Genes involved in ERKs are inactivated |
| 0.6 | 4.1 | REACTOME SIGNALING BY THE B CELL RECEPTOR BCR | Genes involved in Signaling by the B Cell Receptor (BCR) |
| 0.6 | 14.7 | REACTOME PTM GAMMA CARBOXYLATION HYPUSINE FORMATION AND ARYLSULFATASE ACTIVATION | Genes involved in PTM: gamma carboxylation, hypusine formation and arylsulfatase activation |
| 0.6 | 6.2 | REACTOME AKT PHOSPHORYLATES TARGETS IN THE CYTOSOL | Genes involved in AKT phosphorylates targets in the cytosol |
| 0.6 | 12.9 | REACTOME PLATELET SENSITIZATION BY LDL | Genes involved in Platelet sensitization by LDL |
| 0.6 | 1.1 | REACTOME IL 3 5 AND GM CSF SIGNALING | Genes involved in Interleukin-3, 5 and GM-CSF signaling |
| 0.6 | 35.1 | REACTOME AMINO ACID AND OLIGOPEPTIDE SLC TRANSPORTERS | Genes involved in Amino acid and oligopeptide SLC transporters |
| 0.6 | 6.7 | REACTOME REGULATION OF INSULIN SECRETION BY ACETYLCHOLINE | Genes involved in Regulation of Insulin Secretion by Acetylcholine |
| 0.6 | 13.3 | REACTOME FGFR2C LIGAND BINDING AND ACTIVATION | Genes involved in FGFR2c ligand binding and activation |
| 0.5 | 13.8 | REACTOME SIGNAL REGULATORY PROTEIN SIRP FAMILY INTERACTIONS | Genes involved in Signal regulatory protein (SIRP) family interactions |
| 0.5 | 4.8 | REACTOME ANDROGEN BIOSYNTHESIS | Genes involved in Androgen biosynthesis |
| 0.5 | 13.2 | REACTOME DOWNREGULATION OF ERBB2 ERBB3 SIGNALING | Genes involved in Downregulation of ERBB2:ERBB3 signaling |
| 0.5 | 7.8 | REACTOME TIE2 SIGNALING | Genes involved in Tie2 Signaling |
| 0.5 | 2.5 | REACTOME PLATELET AGGREGATION PLUG FORMATION | Genes involved in Platelet Aggregation (Plug Formation) |
| 0.5 | 9.1 | REACTOME CASPASE MEDIATED CLEAVAGE OF CYTOSKELETAL PROTEINS | Genes involved in Caspase-mediated cleavage of cytoskeletal proteins |
| 0.5 | 11.4 | REACTOME EXTRINSIC PATHWAY FOR APOPTOSIS | Genes involved in Extrinsic Pathway for Apoptosis |
| 0.5 | 11.8 | REACTOME INSULIN SYNTHESIS AND PROCESSING | Genes involved in Insulin Synthesis and Processing |
| 0.5 | 5.4 | REACTOME EICOSANOID LIGAND BINDING RECEPTORS | Genes involved in Eicosanoid ligand-binding receptors |
| 0.5 | 53.0 | REACTOME G ALPHA S SIGNALLING EVENTS | Genes involved in G alpha (s) signalling events |
| 0.5 | 17.4 | REACTOME RNA POL II TRANSCRIPTION PRE INITIATION AND PROMOTER OPENING | Genes involved in RNA Polymerase II Transcription Pre-Initiation And Promoter Opening |
| 0.5 | 18.4 | REACTOME TIGHT JUNCTION INTERACTIONS | Genes involved in Tight junction interactions |
| 0.5 | 87.4 | REACTOME G ALPHA I SIGNALLING EVENTS | Genes involved in G alpha (i) signalling events |
| 0.5 | 6.8 | REACTOME TCR SIGNALING | Genes involved in TCR signaling |
| 0.4 | 4.9 | REACTOME CD28 DEPENDENT PI3K AKT SIGNALING | Genes involved in CD28 dependent PI3K/Akt signaling |
| 0.4 | 2.2 | REACTOME ELEVATION OF CYTOSOLIC CA2 LEVELS | Genes involved in Elevation of cytosolic Ca2+ levels |
| 0.4 | 190.1 | REACTOME GENERIC TRANSCRIPTION PATHWAY | Genes involved in Generic Transcription Pathway |
| 0.4 | 17.4 | REACTOME INTERACTION BETWEEN L1 AND ANKYRINS | Genes involved in Interaction between L1 and Ankyrins |
| 0.4 | 4.6 | REACTOME CREATION OF C4 AND C2 ACTIVATORS | Genes involved in Creation of C4 and C2 activators |
| 0.4 | 11.3 | REACTOME AMINE COMPOUND SLC TRANSPORTERS | Genes involved in Amine compound SLC transporters |
| 0.4 | 4.9 | REACTOME P2Y RECEPTORS | Genes involved in P2Y receptors |
| 0.4 | 9.8 | REACTOME GAB1 SIGNALOSOME | Genes involved in GAB1 signalosome |
| 0.4 | 16.2 | REACTOME INTRINSIC PATHWAY FOR APOPTOSIS | Genes involved in Intrinsic Pathway for Apoptosis |
| 0.4 | 8.4 | REACTOME SIGNALING BY NODAL | Genes involved in Signaling by NODAL |
| 0.4 | 8.7 | REACTOME CGMP EFFECTS | Genes involved in cGMP effects |
| 0.4 | 2.0 | REACTOME DESTABILIZATION OF MRNA BY BRF1 | Genes involved in Destabilization of mRNA by Butyrate Response Factor 1 (BRF1) |
| 0.4 | 2.7 | REACTOME MEMBRANE BINDING AND TARGETTING OF GAG PROTEINS | Genes involved in Membrane binding and targetting of GAG proteins |
| 0.4 | 2.7 | REACTOME TRYPTOPHAN CATABOLISM | Genes involved in Tryptophan catabolism |
| 0.4 | 24.6 | REACTOME MYD88 MAL CASCADE INITIATED ON PLASMA MEMBRANE | Genes involved in MyD88:Mal cascade initiated on plasma membrane |
| 0.4 | 1.5 | REACTOME CONVERSION FROM APC C CDC20 TO APC C CDH1 IN LATE ANAPHASE | Genes involved in Conversion from APC/C:Cdc20 to APC/C:Cdh1 in late anaphase |
| 0.4 | 5.7 | REACTOME CHYLOMICRON MEDIATED LIPID TRANSPORT | Genes involved in Chylomicron-mediated lipid transport |
| 0.3 | 9.5 | REACTOME SIGNALING BY PDGF | Genes involved in Signaling by PDGF |
| 0.3 | 2.0 | REACTOME CIRCADIAN REPRESSION OF EXPRESSION BY REV ERBA | Genes involved in Circadian Repression of Expression by REV-ERBA |
| 0.3 | 3.3 | REACTOME TRAF6 MEDIATED IRF7 ACTIVATION | Genes involved in TRAF6 mediated IRF7 activation |
| 0.3 | 6.5 | REACTOME BASE FREE SUGAR PHOSPHATE REMOVAL VIA THE SINGLE NUCLEOTIDE REPLACEMENT PATHWAY | Genes involved in Base-free sugar-phosphate removal via the single-nucleotide replacement pathway |
| 0.3 | 5.8 | REACTOME GAP JUNCTION ASSEMBLY | Genes involved in Gap junction assembly |
| 0.3 | 3.8 | REACTOME DIGESTION OF DIETARY CARBOHYDRATE | Genes involved in Digestion of dietary carbohydrate |
| 0.3 | 16.6 | REACTOME VOLTAGE GATED POTASSIUM CHANNELS | Genes involved in Voltage gated Potassium channels |
| 0.3 | 2.1 | REACTOME TANDEM PORE DOMAIN POTASSIUM CHANNELS | Genes involved in Tandem pore domain potassium channels |
| 0.3 | 21.1 | REACTOME PPARA ACTIVATES GENE EXPRESSION | Genes involved in PPARA Activates Gene Expression |
| 0.3 | 6.0 | REACTOME IL1 SIGNALING | Genes involved in Interleukin-1 signaling |
| 0.3 | 2.0 | REACTOME G1 S SPECIFIC TRANSCRIPTION | Genes involved in G1/S-Specific Transcription |
| 0.3 | 2.2 | REACTOME INHIBITION OF INSULIN SECRETION BY ADRENALINE NORADRENALINE | Genes involved in Inhibition of Insulin Secretion by Adrenaline/Noradrenaline |
| 0.3 | 22.0 | REACTOME CLASS A1 RHODOPSIN LIKE RECEPTORS | Genes involved in Class A/1 (Rhodopsin-like receptors) |
| 0.3 | 1.1 | REACTOME BETA DEFENSINS | Genes involved in Beta defensins |
| 0.3 | 3.4 | REACTOME CHONDROITIN SULFATE BIOSYNTHESIS | Genes involved in Chondroitin sulfate biosynthesis |
| 0.3 | 16.7 | REACTOME COLLAGEN FORMATION | Genes involved in Collagen formation |
| 0.3 | 11.9 | REACTOME NOTCH1 INTRACELLULAR DOMAIN REGULATES TRANSCRIPTION | Genes involved in NOTCH1 Intracellular Domain Regulates Transcription |
| 0.2 | 3.7 | REACTOME PURINE CATABOLISM | Genes involved in Purine catabolism |
| 0.2 | 24.2 | REACTOME GLYCEROPHOSPHOLIPID BIOSYNTHESIS | Genes involved in Glycerophospholipid biosynthesis |
| 0.2 | 17.0 | REACTOME REGULATION OF INSULIN SECRETION | Genes involved in Regulation of Insulin Secretion |
| 0.2 | 8.0 | REACTOME EXTRACELLULAR MATRIX ORGANIZATION | Genes involved in Extracellular matrix organization |
| 0.2 | 0.5 | REACTOME RESOLUTION OF AP SITES VIA THE SINGLE NUCLEOTIDE REPLACEMENT PATHWAY | Genes involved in Resolution of AP sites via the single-nucleotide replacement pathway |
| 0.2 | 7.1 | REACTOME UNBLOCKING OF NMDA RECEPTOR GLUTAMATE BINDING AND ACTIVATION | Genes involved in Unblocking of NMDA receptor, glutamate binding and activation |
| 0.2 | 2.1 | REACTOME ROLE OF DCC IN REGULATING APOPTOSIS | Genes involved in Role of DCC in regulating apoptosis |
| 0.2 | 4.6 | REACTOME CYTOSOLIC SULFONATION OF SMALL MOLECULES | Genes involved in Cytosolic sulfonation of small molecules |
| 0.2 | 5.8 | REACTOME BRANCHED CHAIN AMINO ACID CATABOLISM | Genes involved in Branched-chain amino acid catabolism |
| 0.2 | 4.5 | REACTOME PROTEOLYTIC CLEAVAGE OF SNARE COMPLEX PROTEINS | Genes involved in Proteolytic cleavage of SNARE complex proteins |
| 0.2 | 3.2 | REACTOME KERATAN SULFATE BIOSYNTHESIS | Genes involved in Keratan sulfate biosynthesis |
| 0.2 | 3.9 | REACTOME STEROID HORMONES | Genes involved in Steroid hormones |
| 0.2 | 1.4 | REACTOME DEFENSINS | Genes involved in Defensins |
| 0.2 | 1.2 | REACTOME HS GAG DEGRADATION | Genes involved in HS-GAG degradation |
| 0.2 | 1.2 | REACTOME COPI MEDIATED TRANSPORT | Genes involved in COPI Mediated Transport |
| 0.2 | 4.6 | REACTOME CITRIC ACID CYCLE TCA CYCLE | Genes involved in Citric acid cycle (TCA cycle) |
| 0.2 | 4.1 | REACTOME N GLYCAN ANTENNAE ELONGATION IN THE MEDIAL TRANS GOLGI | Genes involved in N-glycan antennae elongation in the medial/trans-Golgi |
| 0.2 | 3.6 | REACTOME PRESYNAPTIC NICOTINIC ACETYLCHOLINE RECEPTORS | Genes involved in Presynaptic nicotinic acetylcholine receptors |
| 0.2 | 0.9 | REACTOME HIGHLY CALCIUM PERMEABLE POSTSYNAPTIC NICOTINIC ACETYLCHOLINE RECEPTORS | Genes involved in Highly calcium permeable postsynaptic nicotinic acetylcholine receptors |
| 0.1 | 3.6 | REACTOME TRANSPORT TO THE GOLGI AND SUBSEQUENT MODIFICATION | Genes involved in Transport to the Golgi and subsequent modification |
| 0.1 | 2.8 | REACTOME DOUBLE STRAND BREAK REPAIR | Genes involved in Double-Strand Break Repair |
| 0.1 | 1.9 | REACTOME SIGNALING BY FGFR1 FUSION MUTANTS | Genes involved in Signaling by FGFR1 fusion mutants |
| 0.1 | 4.1 | REACTOME DOWNREGULATION OF TGF BETA RECEPTOR SIGNALING | Genes involved in Downregulation of TGF-beta receptor signaling |
| 0.1 | 2.3 | REACTOME ANTIGEN ACTIVATES B CELL RECEPTOR LEADING TO GENERATION OF SECOND MESSENGERS | Genes involved in Antigen Activates B Cell Receptor Leading to Generation of Second Messengers |
| 0.1 | 2.2 | REACTOME FACILITATIVE NA INDEPENDENT GLUCOSE TRANSPORTERS | Genes involved in Facilitative Na+-independent glucose transporters |
| 0.1 | 8.7 | REACTOME PHASE1 FUNCTIONALIZATION OF COMPOUNDS | Genes involved in Phase 1 - Functionalization of compounds |
| 0.1 | 2.0 | REACTOME AMINE DERIVED HORMONES | Genes involved in Amine-derived hormones |
| 0.1 | 2.1 | REACTOME REGULATION OF INSULIN LIKE GROWTH FACTOR IGF ACTIVITY BY INSULIN LIKE GROWTH FACTOR BINDING PROTEINS IGFBPS | Genes involved in Regulation of Insulin-like Growth Factor (IGF) Activity by Insulin-like Growth Factor Binding Proteins (IGFBPs) |
| 0.1 | 8.0 | REACTOME OLFACTORY SIGNALING PATHWAY | Genes involved in Olfactory Signaling Pathway |
| 0.1 | 1.4 | REACTOME INTEGRATION OF ENERGY METABOLISM | Genes involved in Integration of energy metabolism |
| 0.1 | 0.8 | REACTOME HORMONE SENSITIVE LIPASE HSL MEDIATED TRIACYLGLYCEROL HYDROLYSIS | Genes involved in Hormone-sensitive lipase (HSL)-mediated triacylglycerol hydrolysis |
| 0.1 | 2.6 | REACTOME SYNTHESIS OF PIPS AT THE PLASMA MEMBRANE | Genes involved in Synthesis of PIPs at the plasma membrane |
| 0.1 | 5.3 | REACTOME TRANSPORT OF INORGANIC CATIONS ANIONS AND AMINO ACIDS OLIGOPEPTIDES | Genes involved in Transport of inorganic cations/anions and amino acids/oligopeptides |
| 0.1 | 1.2 | REACTOME ORGANIC CATION ANION ZWITTERION TRANSPORT | Genes involved in Organic cation/anion/zwitterion transport |
| 0.1 | 1.2 | REACTOME ABC FAMILY PROTEINS MEDIATED TRANSPORT | Genes involved in ABC-family proteins mediated transport |
| 0.1 | 0.4 | REACTOME RNA POL I PROMOTER OPENING | Genes involved in RNA Polymerase I Promoter Opening |
| 0.1 | 0.8 | REACTOME OXYGEN DEPENDENT PROLINE HYDROXYLATION OF HYPOXIA INDUCIBLE FACTOR ALPHA | Genes involved in Oxygen-dependent Proline Hydroxylation of Hypoxia-inducible Factor Alpha |
| 0.1 | 0.5 | REACTOME POST TRANSLATIONAL MODIFICATION SYNTHESIS OF GPI ANCHORED PROTEINS | Genes involved in Post-translational modification: synthesis of GPI-anchored proteins |
| 0.1 | 1.0 | REACTOME INHIBITION OF VOLTAGE GATED CA2 CHANNELS VIA GBETA GAMMA SUBUNITS | Genes involved in Inhibition of voltage gated Ca2+ channels via Gbeta/gamma subunits |
| 0.0 | 0.5 | REACTOME VEGF LIGAND RECEPTOR INTERACTIONS | Genes involved in VEGF ligand-receptor interactions |
| 0.0 | 1.6 | REACTOME NCAM1 INTERACTIONS | Genes involved in NCAM1 interactions |
| 0.0 | 0.9 | REACTOME CRMPS IN SEMA3A SIGNALING | Genes involved in CRMPs in Sema3A signaling |
| 0.0 | 0.8 | REACTOME SYNTHESIS OF GLYCOSYLPHOSPHATIDYLINOSITOL GPI | Genes involved in Synthesis of glycosylphosphatidylinositol (GPI) |
| 0.0 | 0.5 | REACTOME SIGNALING BY BMP | Genes involved in Signaling by BMP |
| 0.0 | 0.7 | REACTOME AMINO ACID SYNTHESIS AND INTERCONVERSION TRANSAMINATION | Genes involved in Amino acid synthesis and interconversion (transamination) |
| 0.0 | 0.2 | REACTOME INTRINSIC PATHWAY | Genes involved in Intrinsic Pathway |
| 0.0 | 0.5 | REACTOME COMPLEMENT CASCADE | Genes involved in Complement cascade |
| 0.0 | 0.2 | REACTOME RECYCLING OF BILE ACIDS AND SALTS | Genes involved in Recycling of bile acids and salts |
| 0.0 | 0.4 | REACTOME SPHINGOLIPID DE NOVO BIOSYNTHESIS | Genes involved in Sphingolipid de novo biosynthesis |