Project
GNF SymAtlas + NCI-60 cancer cell lines, human (Su, 2004; Ross, 2000)
Navigation
Downloads
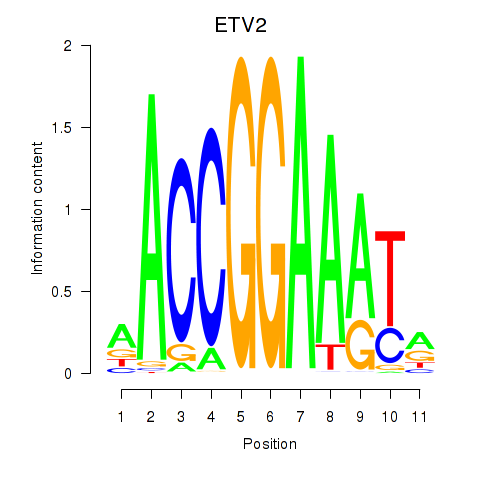
Results for ETV2
Z-value: 1.07
Motif logo
Transcription factors associated with ETV2
| Gene Symbol | Gene ID | Gene Info |
|---|---|---|
|
ETV2
|
ENSG00000105672.14 | ETV2 |
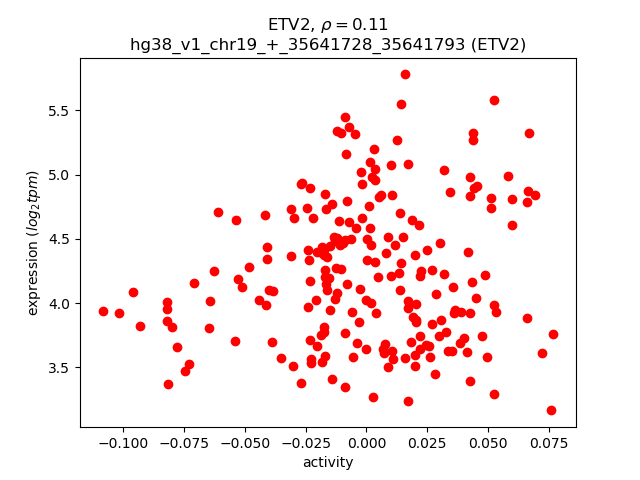
Activity-expression correlation:
| Gene | Promoter | Pearson corr. coef. | P-value | Plot |
|---|---|---|---|---|
| ETV2 | hg38_v1_chr19_+_35641728_35641793 | 0.11 | 9.5e-02 | Click! |
Activity profile of ETV2 motif
Sorted Z-values of ETV2 motif
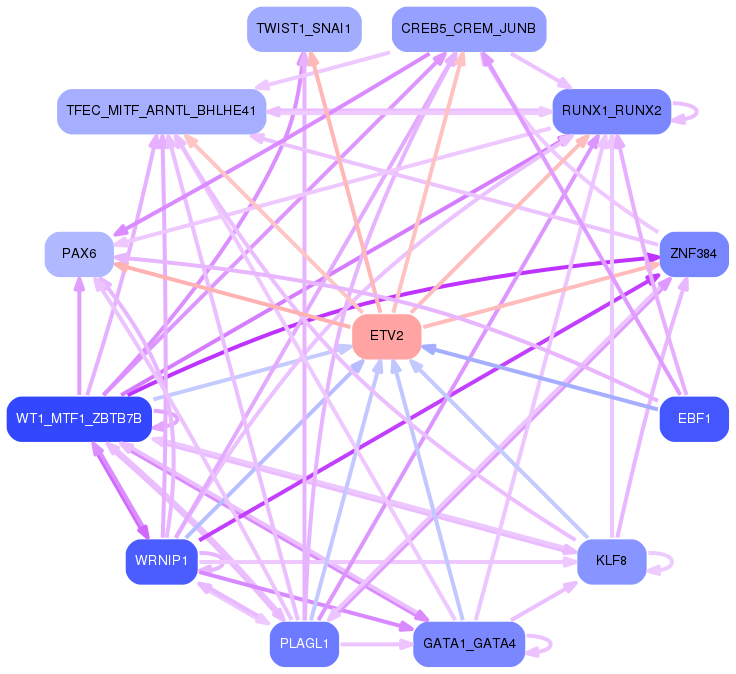
Network of associatons between targets according to the STRING database.

First level regulatory network of ETV2
Gene Ontology Analysis
Gene overrepresentation in biological process category:
| Log-likelihood per target | Total log-likelihood | Term | Description |
|---|---|---|---|
| 4.3 | 13.0 | GO:2000097 | chronological cell aging(GO:0001300) regulation of smooth muscle cell-matrix adhesion(GO:2000097) |
| 3.5 | 17.4 | GO:0071051 | polyadenylation-dependent snoRNA 3'-end processing(GO:0071051) |
| 2.9 | 8.7 | GO:0002184 | cytoplasmic translational termination(GO:0002184) |
| 2.6 | 10.2 | GO:0044837 | assembly of actomyosin apparatus involved in cytokinesis(GO:0000912) actomyosin contractile ring assembly(GO:0000915) actomyosin contractile ring organization(GO:0044837) |
| 2.3 | 7.0 | GO:0007057 | spindle assembly involved in female meiosis I(GO:0007057) |
| 2.2 | 13.4 | GO:1901164 | negative regulation of trophoblast cell migration(GO:1901164) |
| 2.2 | 6.5 | GO:0044565 | dendritic cell proliferation(GO:0044565) |
| 2.1 | 8.5 | GO:1902463 | protein localization to cell leading edge(GO:1902463) |
| 2.1 | 8.5 | GO:1902528 | regulation of protein linear polyubiquitination(GO:1902528) positive regulation of protein linear polyubiquitination(GO:1902530) |
| 1.8 | 7.3 | GO:0090202 | transcriptional activation by promoter-enhancer looping(GO:0071733) gene looping(GO:0090202) dsDNA loop formation(GO:0090579) |
| 1.8 | 5.4 | GO:0000350 | generation of catalytic spliceosome for second transesterification step(GO:0000350) |
| 1.8 | 5.4 | GO:0071816 | tail-anchored membrane protein insertion into ER membrane(GO:0071816) |
| 1.8 | 8.9 | GO:0097461 | ferric iron import into cell(GO:0097461) ferric iron import across plasma membrane(GO:0098706) |
| 1.8 | 5.3 | GO:2000793 | negative regulation of oxidative phosphorylation uncoupler activity(GO:2000276) cell proliferation involved in heart valve development(GO:2000793) |
| 1.7 | 7.0 | GO:0032641 | mature B cell apoptotic process(GO:0002901) regulation of mature B cell apoptotic process(GO:0002905) negative regulation of mature B cell apoptotic process(GO:0002906) lymphotoxin A production(GO:0032641) positive regulation of mast cell cytokine production(GO:0032765) lymphotoxin A biosynthetic process(GO:0042109) |
| 1.7 | 8.5 | GO:0099590 | neurotransmitter receptor internalization(GO:0099590) |
| 1.6 | 4.9 | GO:0044878 | mitotic cytokinesis checkpoint(GO:0044878) |
| 1.6 | 4.9 | GO:2000661 | positive regulation of interleukin-1-mediated signaling pathway(GO:2000661) |
| 1.6 | 4.8 | GO:0001188 | RNA polymerase I transcriptional preinitiation complex assembly(GO:0001188) RNA polymerase I transcriptional preinitiation complex assembly at the promoter for the nuclear large rRNA transcript(GO:0001189) |
| 1.6 | 12.8 | GO:0051414 | response to cortisol(GO:0051414) |
| 1.5 | 13.4 | GO:0046654 | tetrahydrofolate biosynthetic process(GO:0046654) |
| 1.4 | 27.3 | GO:0019614 | catechol-containing compound catabolic process(GO:0019614) catecholamine catabolic process(GO:0042424) |
| 1.3 | 4.0 | GO:0090341 | negative regulation of secretion of lysosomal enzymes(GO:0090341) |
| 1.3 | 4.0 | GO:0071140 | resolution of recombination intermediates(GO:0071139) resolution of mitotic recombination intermediates(GO:0071140) |
| 1.3 | 3.9 | GO:0044830 | modulation by host of viral RNA genome replication(GO:0044830) positive regulation of intracellular transport of viral material(GO:1901254) |
| 1.3 | 3.8 | GO:1900226 | negative regulation of NLRP3 inflammasome complex assembly(GO:1900226) |
| 1.2 | 2.5 | GO:0006404 | RNA import into nucleus(GO:0006404) |
| 1.2 | 3.6 | GO:0097498 | endothelial tube lumen extension(GO:0097498) |
| 1.1 | 5.6 | GO:0019276 | UDP-N-acetylgalactosamine metabolic process(GO:0019276) |
| 1.1 | 5.6 | GO:1902766 | skeletal muscle satellite cell migration(GO:1902766) |
| 1.1 | 5.3 | GO:0006729 | tetrahydrobiopterin biosynthetic process(GO:0006729) tetrahydrobiopterin metabolic process(GO:0046146) |
| 1.0 | 3.1 | GO:0006267 | pre-replicative complex assembly involved in nuclear cell cycle DNA replication(GO:0006267) pre-replicative complex assembly(GO:0036388) pre-replicative complex assembly involved in cell cycle DNA replication(GO:1902299) |
| 1.0 | 7.1 | GO:0070294 | renal sodium ion absorption(GO:0070294) |
| 1.0 | 3.0 | GO:1904933 | cardiac right atrium morphogenesis(GO:0003213) mediolateral intercalation(GO:0060031) lateral sprouting involved in mammary gland duct morphogenesis(GO:0060599) planar cell polarity pathway involved in gastrula mediolateral intercalation(GO:0060775) regulation of cell proliferation in midbrain(GO:1904933) |
| 1.0 | 13.8 | GO:0006930 | substrate-dependent cell migration, cell extension(GO:0006930) |
| 1.0 | 4.9 | GO:2000645 | negative regulation of receptor catabolic process(GO:2000645) |
| 0.9 | 2.8 | GO:0035048 | splicing factor protein import into nucleus(GO:0035048) |
| 0.9 | 3.7 | GO:0034444 | negative regulation of lipoprotein oxidation(GO:0034443) regulation of plasma lipoprotein particle oxidation(GO:0034444) negative regulation of plasma lipoprotein particle oxidation(GO:0034445) |
| 0.9 | 12.1 | GO:0032927 | positive regulation of activin receptor signaling pathway(GO:0032927) |
| 0.9 | 5.3 | GO:0052805 | histamine metabolic process(GO:0001692) histidine catabolic process(GO:0006548) imidazole-containing compound catabolic process(GO:0052805) |
| 0.9 | 2.6 | GO:2000298 | regulation of Rho-dependent protein serine/threonine kinase activity(GO:2000298) |
| 0.9 | 6.9 | GO:0007144 | female meiosis I(GO:0007144) |
| 0.9 | 2.6 | GO:0097156 | fasciculation of motor neuron axon(GO:0097156) |
| 0.9 | 4.3 | GO:0044375 | regulation of peroxisome size(GO:0044375) |
| 0.9 | 3.4 | GO:1903371 | regulation of endoplasmic reticulum tubular network organization(GO:1903371) |
| 0.8 | 0.8 | GO:0043328 | protein targeting to vacuole involved in ubiquitin-dependent protein catabolic process via the multivesicular body sorting pathway(GO:0043328) |
| 0.8 | 2.5 | GO:0090521 | regulation of embryonic cell shape(GO:0016476) glomerular visceral epithelial cell migration(GO:0090521) |
| 0.8 | 2.4 | GO:1903567 | negative regulation of protein localization to cilium(GO:1903565) regulation of protein localization to ciliary membrane(GO:1903567) negative regulation of protein localization to ciliary membrane(GO:1903568) |
| 0.8 | 2.4 | GO:2000525 | regulation of T cell costimulation(GO:2000523) positive regulation of T cell costimulation(GO:2000525) |
| 0.8 | 5.6 | GO:0060770 | negative regulation of epithelial cell proliferation involved in prostate gland development(GO:0060770) |
| 0.8 | 6.4 | GO:2000825 | positive regulation of androgen receptor activity(GO:2000825) |
| 0.8 | 2.3 | GO:0036071 | N-glycan fucosylation(GO:0036071) |
| 0.8 | 2.3 | GO:0010847 | regulation of chromatin assembly(GO:0010847) |
| 0.7 | 1.5 | GO:0019249 | lactate biosynthetic process(GO:0019249) |
| 0.7 | 9.5 | GO:1901223 | negative regulation of NIK/NF-kappaB signaling(GO:1901223) |
| 0.7 | 2.2 | GO:0036265 | RNA (guanine-N7)-methylation(GO:0036265) rRNA (guanine-N7)-methylation(GO:0070476) |
| 0.7 | 6.5 | GO:0007135 | meiosis II(GO:0007135) |
| 0.7 | 3.6 | GO:0060296 | negative regulation of appetite by leptin-mediated signaling pathway(GO:0038108) regulation of cilium movement involved in cell motility(GO:0060295) regulation of cilium beat frequency involved in ciliary motility(GO:0060296) regulation of cilium-dependent cell motility(GO:1902019) |
| 0.7 | 2.1 | GO:1901253 | regulation of intracellular transport of viral material(GO:1901252) negative regulation of intracellular transport of viral material(GO:1901253) |
| 0.7 | 7.6 | GO:0010739 | positive regulation of protein kinase A signaling(GO:0010739) |
| 0.7 | 3.4 | GO:1904579 | response to thapsigargin(GO:1904578) cellular response to thapsigargin(GO:1904579) |
| 0.7 | 2.7 | GO:0038098 | sequestering of BMP from receptor via BMP binding(GO:0038098) |
| 0.7 | 2.6 | GO:0015910 | peroxisomal long-chain fatty acid import(GO:0015910) |
| 0.6 | 48.3 | GO:0070125 | mitochondrial translational elongation(GO:0070125) |
| 0.6 | 1.9 | GO:1901860 | positive regulation of mitochondrial DNA metabolic process(GO:1901860) |
| 0.6 | 1.9 | GO:0060903 | positive regulation of meiosis I(GO:0060903) |
| 0.6 | 3.0 | GO:2000860 | positive regulation of mineralocorticoid secretion(GO:2000857) positive regulation of aldosterone secretion(GO:2000860) |
| 0.6 | 11.4 | GO:0006228 | UTP biosynthetic process(GO:0006228) |
| 0.6 | 5.9 | GO:0048386 | positive regulation of retinoic acid receptor signaling pathway(GO:0048386) |
| 0.6 | 3.0 | GO:2000870 | oocyte growth(GO:0001555) regulation of progesterone secretion(GO:2000870) |
| 0.6 | 7.5 | GO:0033617 | mitochondrial respiratory chain complex IV assembly(GO:0033617) |
| 0.6 | 13.9 | GO:0032802 | low-density lipoprotein particle receptor catabolic process(GO:0032802) |
| 0.6 | 2.3 | GO:0021539 | subthalamus development(GO:0021539) |
| 0.6 | 2.3 | GO:0006617 | SRP-dependent cotranslational protein targeting to membrane, signal sequence recognition(GO:0006617) |
| 0.6 | 3.4 | GO:0032468 | Golgi calcium ion homeostasis(GO:0032468) |
| 0.6 | 2.3 | GO:0090301 | fibroblast growth factor receptor signaling pathway involved in neural plate anterior/posterior pattern formation(GO:0060825) regulation of neural crest formation(GO:0090299) negative regulation of neural crest formation(GO:0090301) regulation of fibroblast growth factor receptor signaling pathway involved in neural plate anterior/posterior pattern formation(GO:2000313) negative regulation of fibroblast growth factor receptor signaling pathway involved in neural plate anterior/posterior pattern formation(GO:2000314) |
| 0.6 | 4.5 | GO:0007256 | activation of JNKK activity(GO:0007256) |
| 0.6 | 19.8 | GO:0051131 | chaperone-mediated protein complex assembly(GO:0051131) |
| 0.6 | 1.7 | GO:0021897 | forebrain astrocyte differentiation(GO:0021896) forebrain astrocyte development(GO:0021897) |
| 0.6 | 1.7 | GO:0006421 | asparaginyl-tRNA aminoacylation(GO:0006421) |
| 0.6 | 2.2 | GO:0006269 | DNA replication, synthesis of RNA primer(GO:0006269) |
| 0.5 | 5.4 | GO:0060717 | chorion development(GO:0060717) |
| 0.5 | 2.1 | GO:0070940 | dephosphorylation of RNA polymerase II C-terminal domain(GO:0070940) |
| 0.5 | 1.6 | GO:0044376 | RNA polymerase II complex import to nucleus(GO:0044376) RNA polymerase III complex localization to nucleus(GO:1990022) |
| 0.5 | 4.8 | GO:0030951 | establishment or maintenance of microtubule cytoskeleton polarity(GO:0030951) |
| 0.5 | 1.6 | GO:0044179 | hemolysis by symbiont of host erythrocytes(GO:0019836) hemolysis in other organism(GO:0044179) hemolysis in other organism involved in symbiotic interaction(GO:0052331) |
| 0.5 | 4.1 | GO:1904885 | beta-catenin destruction complex assembly(GO:1904885) |
| 0.5 | 3.6 | GO:0038172 | interleukin-33-mediated signaling pathway(GO:0038172) |
| 0.5 | 4.6 | GO:0097500 | receptor localization to nonmotile primary cilium(GO:0097500) |
| 0.5 | 8.5 | GO:0030854 | positive regulation of granulocyte differentiation(GO:0030854) |
| 0.5 | 3.0 | GO:0033504 | floor plate development(GO:0033504) |
| 0.5 | 2.0 | GO:0016559 | peroxisome fission(GO:0016559) |
| 0.5 | 6.8 | GO:0071285 | cellular response to lithium ion(GO:0071285) |
| 0.5 | 1.5 | GO:0072434 | signal transduction involved in G2 DNA damage checkpoint(GO:0072425) signal transduction involved in mitotic G2 DNA damage checkpoint(GO:0072434) |
| 0.5 | 2.4 | GO:0006041 | glucosamine metabolic process(GO:0006041) |
| 0.5 | 1.9 | GO:0034628 | nicotinamide nucleotide biosynthetic process from aspartate(GO:0019355) 'de novo' NAD biosynthetic process(GO:0034627) 'de novo' NAD biosynthetic process from aspartate(GO:0034628) |
| 0.5 | 3.8 | GO:0032790 | ribosome disassembly(GO:0032790) |
| 0.5 | 2.4 | GO:0060800 | regulation of cell differentiation involved in embryonic placenta development(GO:0060800) |
| 0.5 | 7.6 | GO:0034244 | negative regulation of transcription elongation from RNA polymerase II promoter(GO:0034244) |
| 0.5 | 4.3 | GO:0061484 | hematopoietic stem cell homeostasis(GO:0061484) |
| 0.5 | 5.7 | GO:0045835 | negative regulation of meiotic nuclear division(GO:0045835) |
| 0.5 | 2.7 | GO:1901098 | positive regulation of autophagosome maturation(GO:1901098) |
| 0.5 | 2.3 | GO:0097039 | protein linear polyubiquitination(GO:0097039) |
| 0.5 | 1.4 | GO:1990168 | protein K33-linked deubiquitination(GO:1990168) |
| 0.5 | 5.0 | GO:0019388 | galactose catabolic process(GO:0019388) |
| 0.4 | 1.3 | GO:0090070 | positive regulation of ribosome biogenesis(GO:0090070) positive regulation of rRNA processing(GO:2000234) |
| 0.4 | 9.8 | GO:0070816 | phosphorylation of RNA polymerase II C-terminal domain(GO:0070816) |
| 0.4 | 1.8 | GO:0035627 | ceramide transport(GO:0035627) |
| 0.4 | 3.5 | GO:0061669 | spontaneous neurotransmitter secretion(GO:0061669) spontaneous synaptic transmission(GO:0098814) |
| 0.4 | 3.9 | GO:0034723 | DNA replication-dependent nucleosome assembly(GO:0006335) DNA replication-dependent nucleosome organization(GO:0034723) |
| 0.4 | 2.2 | GO:0016998 | cell wall macromolecule catabolic process(GO:0016998) |
| 0.4 | 3.0 | GO:0035879 | plasma membrane lactate transport(GO:0035879) |
| 0.4 | 3.0 | GO:0032218 | riboflavin transport(GO:0032218) |
| 0.4 | 1.7 | GO:1990502 | dense core granule maturation(GO:1990502) |
| 0.4 | 1.2 | GO:0070086 | ubiquitin-dependent endocytosis(GO:0070086) regulation of ubiquitin-dependent endocytosis(GO:2000395) positive regulation of ubiquitin-dependent endocytosis(GO:2000397) |
| 0.4 | 1.2 | GO:0042270 | protection from natural killer cell mediated cytotoxicity(GO:0042270) |
| 0.4 | 1.2 | GO:0000414 | regulation of histone H3-K36 methylation(GO:0000414) |
| 0.4 | 2.4 | GO:0006398 | mRNA 3'-end processing by stem-loop binding and cleavage(GO:0006398) |
| 0.4 | 7.6 | GO:1902083 | negative regulation of peptidyl-cysteine S-nitrosylation(GO:1902083) |
| 0.4 | 0.4 | GO:0018307 | enzyme active site formation(GO:0018307) |
| 0.4 | 6.6 | GO:0003322 | pancreatic A cell development(GO:0003322) |
| 0.4 | 3.5 | GO:0006011 | UDP-glucose metabolic process(GO:0006011) |
| 0.4 | 2.3 | GO:0031438 | regulation of mRNA cleavage(GO:0031437) negative regulation of mRNA cleavage(GO:0031438) regulation of mRNA endonucleolytic cleavage involved in unfolded protein response(GO:1904720) negative regulation of mRNA endonucleolytic cleavage involved in unfolded protein response(GO:1904721) |
| 0.4 | 3.8 | GO:0002934 | desmosome organization(GO:0002934) |
| 0.4 | 3.0 | GO:2000210 | positive regulation of anoikis(GO:2000210) |
| 0.4 | 3.0 | GO:0007288 | sperm axoneme assembly(GO:0007288) |
| 0.4 | 8.6 | GO:0007250 | activation of NF-kappaB-inducing kinase activity(GO:0007250) |
| 0.4 | 2.2 | GO:0009212 | dTTP biosynthetic process(GO:0006235) pyrimidine deoxyribonucleoside triphosphate biosynthetic process(GO:0009212) |
| 0.4 | 33.4 | GO:0048208 | vesicle targeting, rough ER to cis-Golgi(GO:0048207) COPII vesicle coating(GO:0048208) |
| 0.4 | 1.8 | GO:0019348 | dolichol metabolic process(GO:0019348) |
| 0.4 | 1.1 | GO:0072709 | cellular response to sorbitol(GO:0072709) |
| 0.4 | 4.3 | GO:0008090 | retrograde axonal transport(GO:0008090) |
| 0.4 | 1.4 | GO:0033152 | immunoglobulin V(D)J recombination(GO:0033152) |
| 0.4 | 3.5 | GO:0032933 | SREBP signaling pathway(GO:0032933) cellular response to sterol depletion(GO:0071501) |
| 0.3 | 2.8 | GO:0019732 | antifungal humoral response(GO:0019732) |
| 0.3 | 3.8 | GO:0060628 | regulation of ER to Golgi vesicle-mediated transport(GO:0060628) |
| 0.3 | 12.7 | GO:0007339 | binding of sperm to zona pellucida(GO:0007339) |
| 0.3 | 4.7 | GO:0000338 | protein deneddylation(GO:0000338) |
| 0.3 | 4.0 | GO:0051665 | membrane raft localization(GO:0051665) |
| 0.3 | 11.2 | GO:0031055 | chromatin remodeling at centromere(GO:0031055) CENP-A containing nucleosome assembly(GO:0034080) CENP-A containing chromatin organization(GO:0061641) |
| 0.3 | 0.3 | GO:0021678 | fourth ventricle development(GO:0021592) third ventricle development(GO:0021678) |
| 0.3 | 5.6 | GO:0030497 | fatty acid elongation(GO:0030497) very long-chain fatty acid biosynthetic process(GO:0042761) |
| 0.3 | 2.9 | GO:0098535 | de novo centriole assembly(GO:0098535) |
| 0.3 | 3.9 | GO:0090435 | protein localization to nuclear envelope(GO:0090435) |
| 0.3 | 2.2 | GO:0051013 | microtubule severing(GO:0051013) |
| 0.3 | 3.5 | GO:0048743 | positive regulation of skeletal muscle fiber development(GO:0048743) |
| 0.3 | 1.0 | GO:0021764 | amygdala development(GO:0021764) |
| 0.3 | 1.9 | GO:0000727 | double-strand break repair via break-induced replication(GO:0000727) |
| 0.3 | 1.0 | GO:2000197 | regulation of mRNA export from nucleus(GO:0010793) regulation of ribonucleoprotein complex localization(GO:2000197) |
| 0.3 | 5.0 | GO:0038003 | opioid receptor signaling pathway(GO:0038003) |
| 0.3 | 6.2 | GO:0045899 | positive regulation of RNA polymerase II transcriptional preinitiation complex assembly(GO:0045899) |
| 0.3 | 0.9 | GO:0000454 | snoRNA guided rRNA pseudouridine synthesis(GO:0000454) |
| 0.3 | 8.7 | GO:1904659 | hexose transmembrane transport(GO:0035428) glucose transmembrane transport(GO:1904659) |
| 0.3 | 0.9 | GO:0098905 | regulation of bundle of His cell action potential(GO:0098905) |
| 0.3 | 4.4 | GO:0070389 | chaperone cofactor-dependent protein refolding(GO:0070389) |
| 0.3 | 3.8 | GO:0035878 | nail development(GO:0035878) |
| 0.3 | 3.8 | GO:0022417 | protein maturation by protein folding(GO:0022417) |
| 0.3 | 1.1 | GO:0072683 | T cell extravasation(GO:0072683) |
| 0.3 | 3.7 | GO:0010668 | ectodermal cell differentiation(GO:0010668) |
| 0.3 | 4.8 | GO:0031293 | membrane protein intracellular domain proteolysis(GO:0031293) |
| 0.3 | 2.0 | GO:0042483 | negative regulation of odontogenesis(GO:0042483) |
| 0.3 | 4.7 | GO:0017004 | cytochrome complex assembly(GO:0017004) |
| 0.3 | 1.7 | GO:0021891 | olfactory bulb interneuron development(GO:0021891) |
| 0.3 | 1.9 | GO:0033183 | negative regulation of histone ubiquitination(GO:0033183) histone H2A K63-linked ubiquitination(GO:0070535) negative regulation of protein K63-linked ubiquitination(GO:1900045) regulation of histone H2A K63-linked ubiquitination(GO:1901314) negative regulation of histone H2A K63-linked ubiquitination(GO:1901315) negative regulation of protein polyubiquitination(GO:1902915) |
| 0.3 | 1.1 | GO:0033590 | response to cobalamin(GO:0033590) |
| 0.3 | 7.9 | GO:0071800 | podosome assembly(GO:0071800) |
| 0.3 | 1.1 | GO:1904154 | positive regulation of retrograde protein transport, ER to cytosol(GO:1904154) |
| 0.3 | 2.4 | GO:0006983 | ER overload response(GO:0006983) |
| 0.3 | 1.3 | GO:0048936 | peripheral nervous system neuron axonogenesis(GO:0048936) |
| 0.3 | 4.6 | GO:0010992 | ubiquitin homeostasis(GO:0010992) |
| 0.3 | 0.5 | GO:0032792 | negative regulation of CREB transcription factor activity(GO:0032792) positive regulation of immature T cell proliferation(GO:0033091) |
| 0.3 | 7.2 | GO:0090190 | positive regulation of branching involved in ureteric bud morphogenesis(GO:0090190) |
| 0.3 | 1.6 | GO:0061737 | leukotriene signaling pathway(GO:0061737) |
| 0.3 | 2.8 | GO:0051256 | mitotic spindle midzone assembly(GO:0051256) |
| 0.3 | 0.8 | GO:1900127 | regulation of hyaluronan biosynthetic process(GO:1900125) positive regulation of hyaluronan biosynthetic process(GO:1900127) |
| 0.3 | 3.6 | GO:0036159 | inner dynein arm assembly(GO:0036159) |
| 0.3 | 4.1 | GO:0000479 | endonucleolytic cleavage of tricistronic rRNA transcript (SSU-rRNA, 5.8S rRNA, LSU-rRNA)(GO:0000479) |
| 0.3 | 4.8 | GO:0034315 | regulation of Arp2/3 complex-mediated actin nucleation(GO:0034315) |
| 0.2 | 1.5 | GO:0031272 | pseudopodium assembly(GO:0031269) regulation of pseudopodium assembly(GO:0031272) positive regulation of pseudopodium assembly(GO:0031274) |
| 0.2 | 2.7 | GO:0035360 | positive regulation of peroxisome proliferator activated receptor signaling pathway(GO:0035360) |
| 0.2 | 1.0 | GO:0030806 | negative regulation of cyclic nucleotide catabolic process(GO:0030806) negative regulation of cAMP catabolic process(GO:0030821) |
| 0.2 | 4.8 | GO:2000675 | negative regulation of type B pancreatic cell apoptotic process(GO:2000675) |
| 0.2 | 1.0 | GO:0006408 | snRNA export from nucleus(GO:0006408) |
| 0.2 | 2.4 | GO:0032264 | IMP salvage(GO:0032264) |
| 0.2 | 1.6 | GO:0046061 | dATP catabolic process(GO:0046061) |
| 0.2 | 1.4 | GO:0010032 | meiotic chromosome condensation(GO:0010032) |
| 0.2 | 0.9 | GO:1903070 | negative regulation of ER-associated ubiquitin-dependent protein catabolic process(GO:1903070) |
| 0.2 | 2.0 | GO:0033088 | regulation of immature T cell proliferation in thymus(GO:0033084) negative regulation of immature T cell proliferation in thymus(GO:0033088) |
| 0.2 | 0.7 | GO:0000389 | mRNA 3'-splice site recognition(GO:0000389) |
| 0.2 | 18.6 | GO:0030574 | collagen catabolic process(GO:0030574) |
| 0.2 | 2.6 | GO:0071027 | nuclear RNA surveillance(GO:0071027) nuclear mRNA surveillance(GO:0071028) |
| 0.2 | 5.8 | GO:0045737 | positive regulation of cyclin-dependent protein serine/threonine kinase activity(GO:0045737) |
| 0.2 | 0.6 | GO:0050717 | positive regulation of interleukin-1 alpha secretion(GO:0050717) |
| 0.2 | 4.8 | GO:0031167 | rRNA methylation(GO:0031167) |
| 0.2 | 3.1 | GO:0071985 | multivesicular body sorting pathway(GO:0071985) |
| 0.2 | 1.4 | GO:0036438 | maintenance of lens transparency(GO:0036438) |
| 0.2 | 1.2 | GO:0061743 | motor learning(GO:0061743) |
| 0.2 | 1.6 | GO:0048630 | skeletal muscle tissue growth(GO:0048630) |
| 0.2 | 3.4 | GO:0009312 | oligosaccharide biosynthetic process(GO:0009312) |
| 0.2 | 2.5 | GO:0051044 | positive regulation of membrane protein ectodomain proteolysis(GO:0051044) |
| 0.2 | 3.8 | GO:0030488 | tRNA methylation(GO:0030488) |
| 0.2 | 2.3 | GO:0016191 | synaptic vesicle uncoating(GO:0016191) |
| 0.2 | 1.5 | GO:0098789 | pre-mRNA cleavage required for polyadenylation(GO:0098789) |
| 0.2 | 1.7 | GO:0007598 | blood coagulation, extrinsic pathway(GO:0007598) |
| 0.2 | 5.0 | GO:0006829 | zinc II ion transport(GO:0006829) |
| 0.2 | 1.6 | GO:0007549 | dosage compensation(GO:0007549) dosage compensation by inactivation of X chromosome(GO:0009048) |
| 0.2 | 1.1 | GO:1903936 | response to sodium arsenite(GO:1903935) cellular response to sodium arsenite(GO:1903936) |
| 0.2 | 1.4 | GO:0006384 | transcription initiation from RNA polymerase III promoter(GO:0006384) |
| 0.2 | 0.4 | GO:0045039 | protein import into mitochondrial inner membrane(GO:0045039) establishment of protein localization to mitochondrial membrane(GO:0090151) |
| 0.2 | 0.7 | GO:0034773 | histone H4-K20 trimethylation(GO:0034773) |
| 0.2 | 6.1 | GO:0006706 | steroid catabolic process(GO:0006706) |
| 0.2 | 0.9 | GO:0035881 | amacrine cell differentiation(GO:0035881) |
| 0.2 | 2.4 | GO:0006610 | ribosomal protein import into nucleus(GO:0006610) |
| 0.2 | 6.0 | GO:0043567 | regulation of insulin-like growth factor receptor signaling pathway(GO:0043567) |
| 0.2 | 2.0 | GO:0060842 | arterial endothelial cell differentiation(GO:0060842) |
| 0.2 | 0.5 | GO:0032707 | negative regulation of interleukin-23 production(GO:0032707) |
| 0.2 | 0.5 | GO:0033512 | L-lysine catabolic process to acetyl-CoA via saccharopine(GO:0033512) |
| 0.2 | 0.8 | GO:1901668 | regulation of superoxide dismutase activity(GO:1901668) |
| 0.2 | 3.1 | GO:0043485 | endosome to melanosome transport(GO:0035646) endosome to pigment granule transport(GO:0043485) pigment granule maturation(GO:0048757) |
| 0.2 | 1.9 | GO:0008334 | histone mRNA metabolic process(GO:0008334) |
| 0.2 | 2.0 | GO:0034975 | protein folding in endoplasmic reticulum(GO:0034975) |
| 0.2 | 6.8 | GO:0008214 | protein demethylation(GO:0006482) protein dealkylation(GO:0008214) |
| 0.1 | 0.4 | GO:0038155 | interleukin-23-mediated signaling pathway(GO:0038155) |
| 0.1 | 4.1 | GO:0006418 | tRNA aminoacylation for protein translation(GO:0006418) |
| 0.1 | 1.6 | GO:0006657 | CDP-choline pathway(GO:0006657) |
| 0.1 | 2.5 | GO:0019511 | peptidyl-proline hydroxylation(GO:0019511) |
| 0.1 | 6.3 | GO:0022030 | cerebral cortex radial glia guided migration(GO:0021801) telencephalon glial cell migration(GO:0022030) |
| 0.1 | 3.1 | GO:2000144 | positive regulation of DNA-templated transcription, initiation(GO:2000144) |
| 0.1 | 1.0 | GO:0009597 | detection of virus(GO:0009597) |
| 0.1 | 0.1 | GO:1904204 | regulation of skeletal muscle hypertrophy(GO:1904204) |
| 0.1 | 0.8 | GO:0045040 | protein import into mitochondrial outer membrane(GO:0045040) |
| 0.1 | 2.0 | GO:0035082 | axoneme assembly(GO:0035082) |
| 0.1 | 5.4 | GO:0008038 | neuron recognition(GO:0008038) |
| 0.1 | 3.3 | GO:0010800 | positive regulation of peptidyl-threonine phosphorylation(GO:0010800) |
| 0.1 | 3.4 | GO:0021795 | cerebral cortex cell migration(GO:0021795) |
| 0.1 | 10.5 | GO:0031146 | SCF-dependent proteasomal ubiquitin-dependent protein catabolic process(GO:0031146) |
| 0.1 | 0.6 | GO:0090042 | tubulin deacetylation(GO:0090042) |
| 0.1 | 0.5 | GO:2000317 | negative regulation of T-helper 17 type immune response(GO:2000317) negative regulation of T-helper 17 cell differentiation(GO:2000320) |
| 0.1 | 4.9 | GO:0070979 | protein K11-linked ubiquitination(GO:0070979) |
| 0.1 | 0.7 | GO:0071105 | response to interleukin-11(GO:0071105) |
| 0.1 | 0.6 | GO:0016240 | autophagosome docking(GO:0016240) |
| 0.1 | 1.1 | GO:0033629 | negative regulation of cell adhesion mediated by integrin(GO:0033629) |
| 0.1 | 3.1 | GO:0007216 | G-protein coupled glutamate receptor signaling pathway(GO:0007216) |
| 0.1 | 0.6 | GO:0033089 | positive regulation of T cell differentiation in thymus(GO:0033089) positive regulation of thymocyte aggregation(GO:2000400) |
| 0.1 | 1.8 | GO:0006020 | inositol metabolic process(GO:0006020) |
| 0.1 | 0.6 | GO:0016584 | nucleosome positioning(GO:0016584) |
| 0.1 | 2.4 | GO:0007176 | regulation of epidermal growth factor-activated receptor activity(GO:0007176) |
| 0.1 | 0.6 | GO:0021997 | neural plate axis specification(GO:0021997) |
| 0.1 | 1.0 | GO:0090266 | regulation of mitotic cell cycle spindle assembly checkpoint(GO:0090266) regulation of mitotic spindle checkpoint(GO:1903504) |
| 0.1 | 1.5 | GO:0045116 | protein neddylation(GO:0045116) |
| 0.1 | 1.5 | GO:2001241 | positive regulation of extrinsic apoptotic signaling pathway in absence of ligand(GO:2001241) |
| 0.1 | 0.9 | GO:0001672 | regulation of chromatin assembly or disassembly(GO:0001672) |
| 0.1 | 2.8 | GO:0006221 | pyrimidine nucleotide biosynthetic process(GO:0006221) |
| 0.1 | 3.2 | GO:0071108 | protein K48-linked deubiquitination(GO:0071108) |
| 0.1 | 1.5 | GO:0035518 | histone H2A monoubiquitination(GO:0035518) |
| 0.1 | 0.4 | GO:2000152 | regulation of ubiquitin-specific protease activity(GO:2000152) positive regulation of ubiquitin-specific protease activity(GO:2000158) |
| 0.1 | 0.3 | GO:0034770 | histone H4-K20 methylation(GO:0034770) |
| 0.1 | 5.3 | GO:0048384 | retinoic acid receptor signaling pathway(GO:0048384) |
| 0.1 | 4.5 | GO:0006730 | one-carbon metabolic process(GO:0006730) |
| 0.1 | 3.1 | GO:0050873 | brown fat cell differentiation(GO:0050873) |
| 0.1 | 15.1 | GO:0007156 | homophilic cell adhesion via plasma membrane adhesion molecules(GO:0007156) |
| 0.1 | 1.8 | GO:0002467 | germinal center formation(GO:0002467) |
| 0.1 | 1.8 | GO:0016558 | protein import into peroxisome matrix(GO:0016558) |
| 0.1 | 2.5 | GO:0006891 | intra-Golgi vesicle-mediated transport(GO:0006891) |
| 0.1 | 0.8 | GO:0000154 | rRNA modification(GO:0000154) |
| 0.1 | 1.4 | GO:0045109 | intermediate filament organization(GO:0045109) |
| 0.1 | 1.6 | GO:0016973 | poly(A)+ mRNA export from nucleus(GO:0016973) |
| 0.1 | 1.7 | GO:0030539 | male genitalia development(GO:0030539) |
| 0.1 | 0.4 | GO:0051415 | interphase microtubule nucleation by interphase microtubule organizing center(GO:0051415) microtubule nucleation by microtubule organizing center(GO:0051418) |
| 0.1 | 0.3 | GO:0000963 | mitochondrial RNA processing(GO:0000963) |
| 0.1 | 0.3 | GO:0030035 | microspike assembly(GO:0030035) |
| 0.1 | 0.1 | GO:0000478 | cleavage involved in rRNA processing(GO:0000469) endonucleolytic cleavage involved in rRNA processing(GO:0000478) |
| 0.1 | 1.6 | GO:2000036 | regulation of stem cell population maintenance(GO:2000036) |
| 0.1 | 2.9 | GO:0015813 | L-glutamate transport(GO:0015813) |
| 0.1 | 1.5 | GO:0007029 | endoplasmic reticulum organization(GO:0007029) |
| 0.1 | 0.8 | GO:0044827 | modulation by host of viral genome replication(GO:0044827) |
| 0.1 | 1.6 | GO:0070987 | error-free translesion synthesis(GO:0070987) |
| 0.1 | 1.6 | GO:0051444 | negative regulation of ubiquitin-protein transferase activity(GO:0051444) |
| 0.1 | 6.4 | GO:0030521 | androgen receptor signaling pathway(GO:0030521) |
| 0.1 | 1.0 | GO:0070935 | 3'-UTR-mediated mRNA stabilization(GO:0070935) |
| 0.1 | 0.6 | GO:0042866 | pyruvate biosynthetic process(GO:0042866) |
| 0.1 | 0.2 | GO:1905051 | regulation of base-excision repair(GO:1905051) positive regulation of base-excision repair(GO:1905053) |
| 0.1 | 2.2 | GO:0042994 | cytoplasmic sequestering of transcription factor(GO:0042994) |
| 0.1 | 0.2 | GO:0098507 | polynucleotide 5' dephosphorylation(GO:0098507) |
| 0.1 | 0.9 | GO:0035970 | peptidyl-threonine dephosphorylation(GO:0035970) |
| 0.1 | 0.7 | GO:0072321 | chaperone-mediated protein transport(GO:0072321) |
| 0.1 | 1.3 | GO:0045725 | positive regulation of glycogen biosynthetic process(GO:0045725) |
| 0.1 | 3.2 | GO:0006383 | transcription from RNA polymerase III promoter(GO:0006383) |
| 0.1 | 1.3 | GO:0006744 | ubiquinone biosynthetic process(GO:0006744) quinone biosynthetic process(GO:1901663) |
| 0.1 | 1.4 | GO:0035635 | entry of bacterium into host cell(GO:0035635) |
| 0.1 | 1.3 | GO:0034389 | lipid particle organization(GO:0034389) |
| 0.1 | 6.2 | GO:0070268 | cornification(GO:0070268) |
| 0.1 | 1.5 | GO:0071539 | protein localization to centrosome(GO:0071539) |
| 0.1 | 1.1 | GO:0043508 | negative regulation of JUN kinase activity(GO:0043508) |
| 0.1 | 0.5 | GO:2000660 | negative regulation of interleukin-1-mediated signaling pathway(GO:2000660) |
| 0.1 | 1.8 | GO:0051123 | RNA polymerase II transcriptional preinitiation complex assembly(GO:0051123) |
| 0.1 | 2.9 | GO:0042073 | intraciliary transport(GO:0042073) |
| 0.1 | 1.0 | GO:1990126 | retrograde transport, endosome to plasma membrane(GO:1990126) |
| 0.1 | 0.7 | GO:0043249 | erythrocyte maturation(GO:0043249) |
| 0.1 | 0.2 | GO:0021691 | cerebellar Purkinje cell layer maturation(GO:0021691) |
| 0.1 | 7.2 | GO:0046546 | male gonad development(GO:0008584) development of primary male sexual characteristics(GO:0046546) |
| 0.1 | 0.4 | GO:0072733 | response to staurosporine(GO:0072733) cellular response to staurosporine(GO:0072734) |
| 0.1 | 4.5 | GO:0007286 | spermatid development(GO:0007286) |
| 0.1 | 3.4 | GO:0033275 | muscle filament sliding(GO:0030049) actin-myosin filament sliding(GO:0033275) |
| 0.1 | 2.2 | GO:0046839 | phospholipid dephosphorylation(GO:0046839) |
| 0.0 | 3.6 | GO:0007338 | single fertilization(GO:0007338) |
| 0.0 | 1.9 | GO:0006110 | regulation of glycolytic process(GO:0006110) |
| 0.0 | 1.4 | GO:0006400 | tRNA modification(GO:0006400) |
| 0.0 | 1.2 | GO:0033962 | cytoplasmic mRNA processing body assembly(GO:0033962) |
| 0.0 | 1.8 | GO:0007194 | negative regulation of adenylate cyclase activity(GO:0007194) |
| 0.0 | 1.6 | GO:0018146 | keratan sulfate biosynthetic process(GO:0018146) |
| 0.0 | 0.3 | GO:0007096 | regulation of exit from mitosis(GO:0007096) |
| 0.0 | 3.0 | GO:0006890 | retrograde vesicle-mediated transport, Golgi to ER(GO:0006890) |
| 0.0 | 2.2 | GO:0043001 | Golgi to plasma membrane protein transport(GO:0043001) |
| 0.0 | 0.7 | GO:0006903 | vesicle targeting(GO:0006903) |
| 0.0 | 2.0 | GO:1901385 | regulation of voltage-gated calcium channel activity(GO:1901385) |
| 0.0 | 0.9 | GO:0005513 | detection of calcium ion(GO:0005513) |
| 0.0 | 0.4 | GO:1902018 | negative regulation of cilium assembly(GO:1902018) |
| 0.0 | 0.2 | GO:1990253 | cellular response to leucine starvation(GO:1990253) |
| 0.0 | 0.9 | GO:0071526 | semaphorin-plexin signaling pathway(GO:0071526) |
| 0.0 | 1.4 | GO:0045815 | positive regulation of gene expression, epigenetic(GO:0045815) |
| 0.0 | 0.3 | GO:1904322 | response to forskolin(GO:1904321) cellular response to forskolin(GO:1904322) |
| 0.0 | 0.3 | GO:0055129 | proline biosynthetic process(GO:0006561) L-proline biosynthetic process(GO:0055129) |
| 0.0 | 0.6 | GO:0018345 | protein palmitoylation(GO:0018345) |
| 0.0 | 1.8 | GO:0042267 | natural killer cell mediated cytotoxicity(GO:0042267) |
| 0.0 | 0.3 | GO:0002031 | G-protein coupled receptor internalization(GO:0002031) |
| 0.0 | 1.2 | GO:0071431 | tRNA export from nucleus(GO:0006409) tRNA-containing ribonucleoprotein complex export from nucleus(GO:0071431) |
| 0.0 | 1.1 | GO:0031397 | negative regulation of protein ubiquitination(GO:0031397) |
| 0.0 | 0.6 | GO:0050667 | homocysteine metabolic process(GO:0050667) |
| 0.0 | 0.2 | GO:0043570 | maintenance of DNA repeat elements(GO:0043570) |
| 0.0 | 0.3 | GO:0034058 | endosomal vesicle fusion(GO:0034058) |
| 0.0 | 2.3 | GO:0043473 | pigmentation(GO:0043473) |
| 0.0 | 5.5 | GO:0035023 | regulation of Rho protein signal transduction(GO:0035023) |
| 0.0 | 0.8 | GO:0032011 | ARF protein signal transduction(GO:0032011) regulation of ARF protein signal transduction(GO:0032012) |
| 0.0 | 0.9 | GO:0060976 | coronary vasculature development(GO:0060976) |
| 0.0 | 2.8 | GO:0090630 | activation of GTPase activity(GO:0090630) |
| 0.0 | 0.7 | GO:0090314 | positive regulation of protein targeting to membrane(GO:0090314) |
| 0.0 | 0.7 | GO:0060080 | inhibitory postsynaptic potential(GO:0060080) |
| 0.0 | 0.3 | GO:0099517 | anterograde synaptic vesicle transport(GO:0048490) synaptic vesicle cytoskeletal transport(GO:0099514) synaptic vesicle transport along microtubule(GO:0099517) |
| 0.0 | 1.1 | GO:0006284 | base-excision repair(GO:0006284) |
| 0.0 | 0.2 | GO:0016264 | gap junction assembly(GO:0016264) |
| 0.0 | 0.2 | GO:0070129 | regulation of mitochondrial translation(GO:0070129) |
| 0.0 | 0.5 | GO:0030890 | positive regulation of B cell proliferation(GO:0030890) |
| 0.0 | 0.9 | GO:0006692 | prostanoid metabolic process(GO:0006692) prostaglandin metabolic process(GO:0006693) |
| 0.0 | 0.7 | GO:0000281 | mitotic cytokinesis(GO:0000281) |
| 0.0 | 0.2 | GO:0042407 | cristae formation(GO:0042407) |
| 0.0 | 0.6 | GO:0046039 | GTP metabolic process(GO:0046039) |
| 0.0 | 0.9 | GO:0048146 | positive regulation of fibroblast proliferation(GO:0048146) |
| 0.0 | 1.8 | GO:0031532 | actin cytoskeleton reorganization(GO:0031532) |
| 0.0 | 1.5 | GO:0032526 | response to retinoic acid(GO:0032526) |
| 0.0 | 0.5 | GO:0022400 | regulation of rhodopsin mediated signaling pathway(GO:0022400) |
| 0.0 | 0.2 | GO:2000622 | regulation of nuclear-transcribed mRNA catabolic process, nonsense-mediated decay(GO:2000622) negative regulation of nuclear-transcribed mRNA catabolic process, nonsense-mediated decay(GO:2000623) |
| 0.0 | 0.5 | GO:0015721 | bile acid and bile salt transport(GO:0015721) |
| 0.0 | 0.3 | GO:0046069 | cGMP catabolic process(GO:0046069) |
| 0.0 | 0.3 | GO:0022011 | myelination in peripheral nervous system(GO:0022011) peripheral nervous system axon ensheathment(GO:0032292) |
| 0.0 | 4.3 | GO:0006936 | muscle contraction(GO:0006936) |
| 0.0 | 0.5 | GO:1901185 | negative regulation of ERBB signaling pathway(GO:1901185) |
Gene overrepresentation in cellular component category:
| Log-likelihood per target | Total log-likelihood | Term | Description |
|---|---|---|---|
| 3.1 | 15.6 | GO:0032449 | CBM complex(GO:0032449) |
| 2.9 | 8.7 | GO:0018444 | translation release factor complex(GO:0018444) |
| 2.3 | 11.6 | GO:0070847 | core mediator complex(GO:0070847) |
| 2.2 | 6.5 | GO:0043259 | laminin-1 complex(GO:0005606) laminin-10 complex(GO:0043259) |
| 2.0 | 10.2 | GO:0097149 | centralspindlin complex(GO:0097149) |
| 1.8 | 20.0 | GO:0033588 | Elongator holoenzyme complex(GO:0033588) |
| 1.8 | 5.4 | GO:0071818 | BAT3 complex(GO:0071818) ER membrane insertion complex(GO:0072379) |
| 1.8 | 17.8 | GO:0033018 | sarcoplasmic reticulum lumen(GO:0033018) |
| 1.7 | 8.3 | GO:0005958 | DNA-dependent protein kinase-DNA ligase 4 complex(GO:0005958) |
| 1.4 | 18.6 | GO:0098647 | collagen type VI trimer(GO:0005589) collagen beaded filament(GO:0098647) |
| 1.3 | 11.8 | GO:0032133 | chromosome passenger complex(GO:0032133) |
| 1.3 | 3.9 | GO:1902737 | dendritic filopodium(GO:1902737) |
| 1.3 | 12.9 | GO:0071439 | clathrin complex(GO:0071439) |
| 1.2 | 16.0 | GO:0000176 | nuclear exosome (RNase complex)(GO:0000176) |
| 1.1 | 7.5 | GO:0005956 | protein kinase CK2 complex(GO:0005956) |
| 1.0 | 3.1 | GO:0044611 | nuclear pore inner ring(GO:0044611) |
| 1.0 | 3.1 | GO:0005656 | nuclear pre-replicative complex(GO:0005656) pre-replicative complex(GO:0036387) |
| 1.0 | 7.2 | GO:0032021 | NELF complex(GO:0032021) |
| 1.0 | 3.9 | GO:0008537 | proteasome activator complex(GO:0008537) |
| 1.0 | 9.7 | GO:0031595 | nuclear proteasome complex(GO:0031595) |
| 1.0 | 7.6 | GO:0034464 | BBSome(GO:0034464) |
| 0.9 | 3.7 | GO:0034365 | discoidal high-density lipoprotein particle(GO:0034365) |
| 0.9 | 2.7 | GO:0034515 | proteasome storage granule(GO:0034515) |
| 0.9 | 26.1 | GO:0070971 | endoplasmic reticulum exit site(GO:0070971) |
| 0.9 | 8.0 | GO:0033391 | chromatoid body(GO:0033391) |
| 0.9 | 3.5 | GO:0032937 | SREBP-SCAP-Insig complex(GO:0032937) |
| 0.9 | 3.5 | GO:0070435 | Shc-EGFR complex(GO:0070435) |
| 0.9 | 4.3 | GO:0031673 | H zone(GO:0031673) |
| 0.8 | 15.0 | GO:0005832 | chaperonin-containing T-complex(GO:0005832) |
| 0.8 | 8.5 | GO:0032593 | insulin-responsive compartment(GO:0032593) |
| 0.8 | 4.5 | GO:0034673 | inhibin-betaglycan-ActRII complex(GO:0034673) |
| 0.8 | 3.8 | GO:1990425 | terminal cisterna(GO:0014802) ryanodine receptor complex(GO:1990425) |
| 0.7 | 7.2 | GO:0097255 | R2TP complex(GO:0097255) |
| 0.7 | 2.8 | GO:0042272 | nuclear RNA export factor complex(GO:0042272) |
| 0.7 | 13.5 | GO:0031588 | nucleotide-activated protein kinase complex(GO:0031588) |
| 0.6 | 2.4 | GO:0071920 | cleavage body(GO:0071920) |
| 0.6 | 24.3 | GO:0005762 | organellar large ribosomal subunit(GO:0000315) mitochondrial large ribosomal subunit(GO:0005762) |
| 0.6 | 1.8 | GO:0033185 | dolichol-phosphate-mannose synthase complex(GO:0033185) |
| 0.6 | 6.5 | GO:0071014 | post-mRNA release spliceosomal complex(GO:0071014) |
| 0.6 | 5.6 | GO:0043203 | axon hillock(GO:0043203) |
| 0.5 | 2.7 | GO:1990316 | ATG1/ULK1 kinase complex(GO:1990316) |
| 0.5 | 3.7 | GO:1990745 | EARP complex(GO:1990745) |
| 0.5 | 3.2 | GO:0002177 | manchette(GO:0002177) |
| 0.5 | 5.3 | GO:0000439 | core TFIIH complex(GO:0000439) |
| 0.5 | 11.2 | GO:0030128 | clathrin coat of endocytic vesicle(GO:0030128) |
| 0.5 | 4.5 | GO:0042719 | mitochondrial intermembrane space protein transporter complex(GO:0042719) |
| 0.5 | 6.0 | GO:0036454 | insulin-like growth factor binding protein complex(GO:0016942) growth factor complex(GO:0036454) |
| 0.5 | 4.4 | GO:0072546 | ER membrane protein complex(GO:0072546) |
| 0.5 | 1.5 | GO:0070939 | Dsl1p complex(GO:0070939) |
| 0.5 | 3.4 | GO:0031298 | replication fork protection complex(GO:0031298) |
| 0.4 | 1.3 | GO:0034455 | t-UTP complex(GO:0034455) |
| 0.4 | 12.5 | GO:0002080 | acrosomal membrane(GO:0002080) |
| 0.4 | 4.0 | GO:0070765 | gamma-secretase complex(GO:0070765) |
| 0.4 | 23.8 | GO:0002102 | podosome(GO:0002102) |
| 0.4 | 1.3 | GO:0033263 | CORVET complex(GO:0033263) |
| 0.4 | 11.6 | GO:0005779 | integral component of peroxisomal membrane(GO:0005779) intrinsic component of peroxisomal membrane(GO:0031231) |
| 0.4 | 6.2 | GO:0005736 | DNA-directed RNA polymerase I complex(GO:0005736) |
| 0.4 | 5.4 | GO:0005847 | mRNA cleavage and polyadenylation specificity factor complex(GO:0005847) |
| 0.4 | 2.3 | GO:0071797 | LUBAC complex(GO:0071797) |
| 0.4 | 2.2 | GO:0005658 | alpha DNA polymerase:primase complex(GO:0005658) |
| 0.4 | 2.6 | GO:0016272 | prefoldin complex(GO:0016272) |
| 0.3 | 3.7 | GO:0005666 | DNA-directed RNA polymerase III complex(GO:0005666) |
| 0.3 | 3.0 | GO:0097443 | sorting endosome(GO:0097443) |
| 0.3 | 0.9 | GO:0071817 | MMXD complex(GO:0071817) |
| 0.3 | 1.3 | GO:0005899 | insulin receptor complex(GO:0005899) |
| 0.3 | 3.4 | GO:0005862 | muscle thin filament tropomyosin(GO:0005862) |
| 0.3 | 4.3 | GO:0000124 | SAGA complex(GO:0000124) |
| 0.3 | 4.3 | GO:0001673 | male germ cell nucleus(GO:0001673) |
| 0.3 | 4.6 | GO:0034709 | methylosome(GO:0034709) |
| 0.3 | 32.0 | GO:0031093 | platelet alpha granule lumen(GO:0031093) |
| 0.3 | 0.8 | GO:0098536 | deuterosome(GO:0098536) |
| 0.3 | 3.2 | GO:0008250 | oligosaccharyltransferase complex(GO:0008250) |
| 0.3 | 2.3 | GO:0005786 | signal recognition particle, endoplasmic reticulum targeting(GO:0005786) |
| 0.3 | 4.3 | GO:0005671 | Ada2/Gcn5/Ada3 transcription activator complex(GO:0005671) |
| 0.2 | 2.2 | GO:0005672 | transcription factor TFIIA complex(GO:0005672) |
| 0.2 | 1.0 | GO:0005846 | nuclear cap binding complex(GO:0005846) |
| 0.2 | 7.2 | GO:0044322 | endoplasmic reticulum quality control compartment(GO:0044322) |
| 0.2 | 4.9 | GO:0044447 | axoneme part(GO:0044447) |
| 0.2 | 1.1 | GO:0089701 | U2AF(GO:0089701) |
| 0.2 | 2.4 | GO:0031465 | Cul4B-RING E3 ubiquitin ligase complex(GO:0031465) |
| 0.2 | 16.3 | GO:0005881 | cytoplasmic microtubule(GO:0005881) |
| 0.2 | 2.5 | GO:0005869 | dynactin complex(GO:0005869) |
| 0.2 | 7.8 | GO:0005640 | nuclear outer membrane(GO:0005640) |
| 0.2 | 6.3 | GO:0090545 | NuRD complex(GO:0016581) CHD-type complex(GO:0090545) |
| 0.2 | 2.1 | GO:0031371 | ubiquitin conjugating enzyme complex(GO:0031371) |
| 0.2 | 1.1 | GO:0071256 | Sec61 translocon complex(GO:0005784) translocon complex(GO:0071256) |
| 0.2 | 1.6 | GO:0032797 | SMN complex(GO:0032797) |
| 0.2 | 0.5 | GO:1902636 | kinociliary basal body(GO:1902636) |
| 0.2 | 2.3 | GO:0045275 | mitochondrial respiratory chain complex III(GO:0005750) respiratory chain complex III(GO:0045275) |
| 0.2 | 3.0 | GO:0030669 | clathrin-coated endocytic vesicle membrane(GO:0030669) |
| 0.2 | 1.5 | GO:0042382 | paraspeckles(GO:0042382) |
| 0.2 | 1.4 | GO:0000796 | condensin complex(GO:0000796) |
| 0.2 | 3.4 | GO:0030686 | 90S preribosome(GO:0030686) |
| 0.2 | 1.9 | GO:0070449 | elongin complex(GO:0070449) |
| 0.2 | 1.2 | GO:1990726 | Lsm1-7-Pat1 complex(GO:1990726) |
| 0.2 | 4.9 | GO:0030057 | desmosome(GO:0030057) |
| 0.2 | 8.3 | GO:0008180 | COP9 signalosome(GO:0008180) |
| 0.2 | 4.2 | GO:0005763 | organellar small ribosomal subunit(GO:0000314) mitochondrial small ribosomal subunit(GO:0005763) |
| 0.2 | 1.1 | GO:0043196 | varicosity(GO:0043196) |
| 0.1 | 0.4 | GO:0072536 | interleukin-23 receptor complex(GO:0072536) |
| 0.1 | 1.6 | GO:0030127 | COPII vesicle coat(GO:0030127) |
| 0.1 | 1.2 | GO:0030688 | preribosome, small subunit precursor(GO:0030688) |
| 0.1 | 1.6 | GO:0042587 | glycogen granule(GO:0042587) |
| 0.1 | 0.4 | GO:0000923 | equatorial microtubule organizing center(GO:0000923) |
| 0.1 | 0.7 | GO:0034274 | Atg12-Atg5-Atg16 complex(GO:0034274) |
| 0.1 | 5.6 | GO:0032420 | stereocilium(GO:0032420) |
| 0.1 | 2.5 | GO:0031235 | intrinsic component of the cytoplasmic side of the plasma membrane(GO:0031235) |
| 0.1 | 0.9 | GO:0072588 | box H/ACA snoRNP complex(GO:0031429) box H/ACA RNP complex(GO:0072588) box H/ACA scaRNP complex(GO:0072589) box H/ACA telomerase RNP complex(GO:0090661) |
| 0.1 | 10.7 | GO:0032588 | trans-Golgi network membrane(GO:0032588) |
| 0.1 | 1.8 | GO:0005641 | nuclear envelope lumen(GO:0005641) |
| 0.1 | 2.1 | GO:0034362 | low-density lipoprotein particle(GO:0034362) |
| 0.1 | 0.6 | GO:0032302 | MutSbeta complex(GO:0032302) |
| 0.1 | 6.0 | GO:0005871 | kinesin complex(GO:0005871) |
| 0.1 | 0.8 | GO:1990130 | GATOR2 complex(GO:0061700) Iml1 complex(GO:1990130) |
| 0.1 | 3.5 | GO:0030687 | preribosome, large subunit precursor(GO:0030687) |
| 0.1 | 4.5 | GO:0012507 | ER to Golgi transport vesicle membrane(GO:0012507) |
| 0.1 | 5.4 | GO:0019005 | SCF ubiquitin ligase complex(GO:0019005) |
| 0.1 | 0.6 | GO:0020018 | ciliary pocket(GO:0020016) ciliary pocket membrane(GO:0020018) |
| 0.1 | 11.0 | GO:0005796 | Golgi lumen(GO:0005796) |
| 0.1 | 0.3 | GO:0016222 | procollagen-proline 4-dioxygenase complex(GO:0016222) |
| 0.1 | 0.6 | GO:0032059 | bleb(GO:0032059) |
| 0.1 | 3.0 | GO:0005581 | collagen trimer(GO:0005581) |
| 0.1 | 5.2 | GO:0005844 | polysome(GO:0005844) |
| 0.1 | 3.2 | GO:0016592 | mediator complex(GO:0016592) |
| 0.1 | 2.6 | GO:0044298 | neuronal cell body membrane(GO:0032809) cell body membrane(GO:0044298) |
| 0.1 | 1.1 | GO:0005868 | cytoplasmic dynein complex(GO:0005868) |
| 0.1 | 1.6 | GO:0030992 | intraciliary transport particle B(GO:0030992) |
| 0.1 | 1.9 | GO:0005839 | proteasome core complex(GO:0005839) |
| 0.1 | 9.0 | GO:0031227 | intrinsic component of endoplasmic reticulum membrane(GO:0031227) |
| 0.1 | 2.5 | GO:0030173 | integral component of Golgi membrane(GO:0030173) |
| 0.1 | 5.3 | GO:0032580 | Golgi cisterna membrane(GO:0032580) |
| 0.1 | 0.5 | GO:0045252 | oxoglutarate dehydrogenase complex(GO:0045252) |
| 0.1 | 0.3 | GO:0032044 | DSIF complex(GO:0032044) |
| 0.1 | 6.6 | GO:0000779 | condensed chromosome, centromeric region(GO:0000779) |
| 0.1 | 1.5 | GO:0000421 | autophagosome membrane(GO:0000421) |
| 0.1 | 6.6 | GO:0031514 | motile cilium(GO:0031514) |
| 0.1 | 2.2 | GO:0005669 | transcription factor TFIID complex(GO:0005669) |
| 0.1 | 3.0 | GO:0008023 | transcription elongation factor complex(GO:0008023) |
| 0.1 | 1.3 | GO:0001533 | cornified envelope(GO:0001533) |
| 0.1 | 3.0 | GO:0005930 | axoneme(GO:0005930) ciliary plasm(GO:0097014) |
| 0.1 | 9.8 | GO:0045111 | intermediate filament cytoskeleton(GO:0045111) |
| 0.1 | 2.1 | GO:0034451 | centriolar satellite(GO:0034451) |
| 0.1 | 1.1 | GO:0005922 | connexon complex(GO:0005922) |
| 0.1 | 3.5 | GO:0048786 | presynaptic active zone(GO:0048786) |
| 0.1 | 3.0 | GO:0031463 | Cul3-RING ubiquitin ligase complex(GO:0031463) |
| 0.1 | 2.0 | GO:0000159 | protein phosphatase type 2A complex(GO:0000159) |
| 0.1 | 1.6 | GO:0005892 | acetylcholine-gated channel complex(GO:0005892) |
| 0.1 | 1.2 | GO:0031082 | BLOC complex(GO:0031082) |
| 0.1 | 3.1 | GO:0045178 | basal part of cell(GO:0045178) |
| 0.1 | 6.3 | GO:0000922 | spindle pole(GO:0000922) |
| 0.1 | 9.4 | GO:0030018 | Z disc(GO:0030018) |
| 0.1 | 0.6 | GO:0098799 | outer mitochondrial membrane protein complex(GO:0098799) |
| 0.0 | 14.0 | GO:0005788 | endoplasmic reticulum lumen(GO:0005788) |
| 0.0 | 0.2 | GO:1990131 | EGO complex(GO:0034448) Gtr1-Gtr2 GTPase complex(GO:1990131) |
| 0.0 | 0.6 | GO:0043020 | NADPH oxidase complex(GO:0043020) |
| 0.0 | 0.3 | GO:0000127 | transcription factor TFIIIC complex(GO:0000127) |
| 0.0 | 1.7 | GO:0016235 | aggresome(GO:0016235) |
| 0.0 | 2.1 | GO:0005795 | Golgi stack(GO:0005795) |
| 0.0 | 2.0 | GO:0005891 | voltage-gated calcium channel complex(GO:0005891) |
| 0.0 | 0.7 | GO:0005685 | U1 snRNP(GO:0005685) |
| 0.0 | 4.9 | GO:0090575 | RNA polymerase II transcription factor complex(GO:0090575) |
| 0.0 | 1.6 | GO:0001669 | acrosomal vesicle(GO:0001669) |
| 0.0 | 0.4 | GO:0005689 | U12-type spliceosomal complex(GO:0005689) |
| 0.0 | 0.5 | GO:0031011 | Ino80 complex(GO:0031011) DNA helicase complex(GO:0033202) |
| 0.0 | 1.7 | GO:0005875 | microtubule associated complex(GO:0005875) |
| 0.0 | 0.7 | GO:0031941 | filamentous actin(GO:0031941) |
| 0.0 | 0.7 | GO:0005876 | spindle microtubule(GO:0005876) |
| 0.0 | 0.3 | GO:0030126 | COPI vesicle coat(GO:0030126) |
| 0.0 | 2.5 | GO:0005758 | mitochondrial intermembrane space(GO:0005758) |
| 0.0 | 0.2 | GO:0005761 | organellar ribosome(GO:0000313) mitochondrial ribosome(GO:0005761) |
| 0.0 | 0.3 | GO:0030123 | AP-3 adaptor complex(GO:0030123) |
| 0.0 | 2.7 | GO:0043202 | lysosomal lumen(GO:0043202) |
| 0.0 | 0.1 | GO:0097165 | nuclear stress granule(GO:0097165) |
| 0.0 | 8.5 | GO:0005743 | mitochondrial inner membrane(GO:0005743) |
| 0.0 | 0.7 | GO:0009295 | nucleoid(GO:0009295) mitochondrial nucleoid(GO:0042645) |
| 0.0 | 0.1 | GO:0031931 | TORC1 complex(GO:0031931) |
| 0.0 | 0.4 | GO:0042588 | zymogen granule(GO:0042588) |
| 0.0 | 0.1 | GO:0005854 | nascent polypeptide-associated complex(GO:0005854) |
| 0.0 | 0.5 | GO:0005697 | telomerase holoenzyme complex(GO:0005697) |
| 0.0 | 1.0 | GO:0005771 | multivesicular body(GO:0005771) |
| 0.0 | 1.0 | GO:0010494 | cytoplasmic stress granule(GO:0010494) |
| 0.0 | 0.7 | GO:1902711 | GABA-A receptor complex(GO:1902711) |
| 0.0 | 3.2 | GO:0001726 | ruffle(GO:0001726) |
| 0.0 | 4.5 | GO:0019898 | extrinsic component of membrane(GO:0019898) |
| 0.0 | 0.2 | GO:0032040 | small-subunit processome(GO:0032040) |
| 0.0 | 0.3 | GO:0005859 | muscle myosin complex(GO:0005859) |
Gene overrepresentation in molecular function category:
| Log-likelihood per target | Total log-likelihood | Term | Description |
|---|---|---|---|
| 3.4 | 13.4 | GO:0004146 | dihydrofolate reductase activity(GO:0004146) |
| 3.0 | 27.3 | GO:0016206 | catechol O-methyltransferase activity(GO:0016206) |
| 1.9 | 5.6 | GO:0035248 | alpha-1,4-N-acetylgalactosaminyltransferase activity(GO:0035248) |
| 1.9 | 5.6 | GO:0080023 | 3R-hydroxyacyl-CoA dehydratase activity(GO:0080023) |
| 1.8 | 8.9 | GO:0043141 | ATP-dependent 5'-3' DNA helicase activity(GO:0043141) |
| 1.6 | 4.9 | GO:0003978 | UDP-N-acetylglucosamine 4-epimerase activity(GO:0003974) UDP-glucose 4-epimerase activity(GO:0003978) |
| 1.6 | 4.8 | GO:0098519 | nucleotide phosphatase activity, acting on free nucleotides(GO:0098519) |
| 1.5 | 6.1 | GO:0004773 | steryl-sulfatase activity(GO:0004773) |
| 1.5 | 5.9 | GO:0052851 | cupric reductase activity(GO:0008823) ferric-chelate reductase (NADPH) activity(GO:0052851) |
| 1.5 | 10.2 | GO:0003747 | translation release factor activity(GO:0003747) translation termination factor activity(GO:0008079) |
| 1.3 | 4.0 | GO:0031755 | endothelial differentiation G-protein coupled receptor binding(GO:0031753) Edg-2 lysophosphatidic acid receptor binding(GO:0031755) |
| 1.3 | 5.3 | GO:0004505 | phenylalanine 4-monooxygenase activity(GO:0004505) |
| 1.3 | 11.8 | GO:0035174 | histone serine kinase activity(GO:0035174) |
| 1.2 | 4.9 | GO:0004909 | interleukin-1, Type I, activating receptor activity(GO:0004909) |
| 1.0 | 4.0 | GO:0032810 | sterol response element binding(GO:0032810) |
| 1.0 | 3.0 | GO:0004045 | aminoacyl-tRNA hydrolase activity(GO:0004045) |
| 1.0 | 13.9 | GO:0032050 | clathrin heavy chain binding(GO:0032050) |
| 1.0 | 5.8 | GO:0061575 | cyclin-dependent protein serine/threonine kinase activator activity(GO:0061575) |
| 0.9 | 5.6 | GO:0000179 | rRNA (adenine-N6,N6-)-dimethyltransferase activity(GO:0000179) |
| 0.9 | 4.5 | GO:0016427 | tRNA (cytosine) methyltransferase activity(GO:0016427) |
| 0.9 | 1.8 | GO:0097001 | ceramide binding(GO:0097001) |
| 0.9 | 5.2 | GO:0070004 | cysteine-type carboxypeptidase activity(GO:0016807) cysteine-type exopeptidase activity(GO:0070004) |
| 0.9 | 6.8 | GO:0019237 | centromeric DNA binding(GO:0019237) |
| 0.9 | 6.0 | GO:0048408 | epidermal growth factor binding(GO:0048408) |
| 0.8 | 2.3 | GO:0046921 | glycoprotein 6-alpha-L-fucosyltransferase activity(GO:0008424) alpha-(1->6)-fucosyltransferase activity(GO:0046921) |
| 0.7 | 8.2 | GO:0004679 | AMP-activated protein kinase activity(GO:0004679) |
| 0.7 | 2.2 | GO:0001034 | RNA polymerase III transcription factor activity, sequence-specific DNA binding(GO:0001034) |
| 0.7 | 2.2 | GO:0003896 | DNA primase activity(GO:0003896) |
| 0.7 | 9.2 | GO:0019966 | interleukin-1 binding(GO:0019966) |
| 0.7 | 6.2 | GO:0036402 | proteasome-activating ATPase activity(GO:0036402) |
| 0.7 | 18.8 | GO:0005520 | insulin-like growth factor binding(GO:0005520) |
| 0.7 | 2.0 | GO:0052816 | medium-chain acyl-CoA hydrolase activity(GO:0052815) long-chain acyl-CoA hydrolase activity(GO:0052816) |
| 0.7 | 4.0 | GO:0034511 | U3 snoRNA binding(GO:0034511) |
| 0.7 | 2.6 | GO:0034353 | RNA pyrophosphohydrolase activity(GO:0034353) |
| 0.7 | 3.9 | GO:0034046 | poly(G) binding(GO:0034046) |
| 0.6 | 9.4 | GO:0008140 | cAMP response element binding protein binding(GO:0008140) |
| 0.6 | 13.4 | GO:0008191 | metalloendopeptidase inhibitor activity(GO:0008191) |
| 0.6 | 1.8 | GO:0004582 | dolichyl-phosphate beta-D-mannosyltransferase activity(GO:0004582) |
| 0.6 | 1.7 | GO:0008321 | Ral guanyl-nucleotide exchange factor activity(GO:0008321) |
| 0.6 | 4.5 | GO:0098821 | BMP receptor activity(GO:0098821) |
| 0.6 | 4.0 | GO:0008821 | crossover junction endodeoxyribonuclease activity(GO:0008821) |
| 0.6 | 3.9 | GO:0061133 | endopeptidase activator activity(GO:0061133) |
| 0.5 | 1.6 | GO:0044714 | GTP diphosphatase activity(GO:0036219) 2-hydroxy-adenosine triphosphate pyrophosphatase activity(GO:0044713) 2-hydroxy-(deoxy)adenosine-triphosphate pyrophosphatase activity(GO:0044714) ATP diphosphatase activity(GO:0047693) |
| 0.5 | 10.7 | GO:0005522 | profilin binding(GO:0005522) |
| 0.5 | 2.1 | GO:0061628 | H3K27me3 modified histone binding(GO:0061628) |
| 0.5 | 3.6 | GO:0002114 | interleukin-33 receptor activity(GO:0002114) |
| 0.5 | 8.6 | GO:0042809 | vitamin D receptor binding(GO:0042809) |
| 0.5 | 1.5 | GO:0005519 | cytoskeletal regulatory protein binding(GO:0005519) |
| 0.5 | 10.9 | GO:0070273 | phosphatidylinositol-4-phosphate binding(GO:0070273) |
| 0.5 | 13.8 | GO:0034236 | protein kinase A catalytic subunit binding(GO:0034236) |
| 0.5 | 4.8 | GO:0010859 | calcium-dependent cysteine-type endopeptidase inhibitor activity(GO:0010859) |
| 0.5 | 1.9 | GO:0000309 | nicotinamide-nucleotide adenylyltransferase activity(GO:0000309) |
| 0.5 | 7.0 | GO:0015643 | toxic substance binding(GO:0015643) |
| 0.5 | 19.4 | GO:0017091 | AU-rich element binding(GO:0017091) |
| 0.4 | 8.5 | GO:0098748 | clathrin adaptor activity(GO:0035615) endocytic adaptor activity(GO:0098748) |
| 0.4 | 2.2 | GO:0047179 | platelet-activating factor acetyltransferase activity(GO:0047179) |
| 0.4 | 2.2 | GO:0031544 | peptidyl-proline 3-dioxygenase activity(GO:0031544) |
| 0.4 | 2.2 | GO:0003796 | lysozyme activity(GO:0003796) |
| 0.4 | 3.0 | GO:0032217 | riboflavin transporter activity(GO:0032217) |
| 0.4 | 2.5 | GO:0045505 | dynein intermediate chain binding(GO:0045505) |
| 0.4 | 1.2 | GO:0047006 | 17-alpha,20-alpha-dihydroxypregn-4-en-3-one dehydrogenase activity(GO:0047006) |
| 0.4 | 3.7 | GO:0001056 | RNA polymerase III activity(GO:0001056) |
| 0.4 | 1.6 | GO:0004461 | lactose synthase activity(GO:0004461) |
| 0.4 | 15.6 | GO:0044183 | protein binding involved in protein folding(GO:0044183) |
| 0.4 | 2.4 | GO:0004614 | phosphoglucomutase activity(GO:0004614) |
| 0.4 | 3.6 | GO:0004565 | beta-galactosidase activity(GO:0004565) |
| 0.4 | 11.4 | GO:0004550 | nucleoside diphosphate kinase activity(GO:0004550) |
| 0.4 | 6.2 | GO:0001054 | RNA polymerase I activity(GO:0001054) |
| 0.4 | 2.3 | GO:0030942 | endoplasmic reticulum signal peptide binding(GO:0030942) |
| 0.4 | 5.7 | GO:0003993 | acid phosphatase activity(GO:0003993) |
| 0.4 | 2.6 | GO:0005324 | long-chain fatty acid transporter activity(GO:0005324) |
| 0.4 | 38.4 | GO:0004867 | serine-type endopeptidase inhibitor activity(GO:0004867) |
| 0.4 | 1.5 | GO:0000702 | oxidized base lesion DNA N-glycosylase activity(GO:0000702) |
| 0.4 | 2.1 | GO:0008420 | CTD phosphatase activity(GO:0008420) |
| 0.3 | 3.5 | GO:0004064 | arylesterase activity(GO:0004064) |
| 0.3 | 3.5 | GO:0035251 | UDP-glucosyltransferase activity(GO:0035251) |
| 0.3 | 2.1 | GO:0051373 | FATZ binding(GO:0051373) |
| 0.3 | 4.4 | GO:0000774 | adenyl-nucleotide exchange factor activity(GO:0000774) |
| 0.3 | 5.0 | GO:0004985 | opioid receptor activity(GO:0004985) |
| 0.3 | 1.3 | GO:0008311 | double-stranded DNA 3'-5' exodeoxyribonuclease activity(GO:0008311) |
| 0.3 | 2.3 | GO:0060698 | endoribonuclease inhibitor activity(GO:0060698) |
| 0.3 | 1.3 | GO:0071208 | histone pre-mRNA DCP binding(GO:0071208) |
| 0.3 | 2.2 | GO:0008568 | microtubule-severing ATPase activity(GO:0008568) |
| 0.3 | 1.6 | GO:0004105 | choline-phosphate cytidylyltransferase activity(GO:0004105) |
| 0.3 | 1.6 | GO:0004974 | leukotriene receptor activity(GO:0004974) |
| 0.3 | 3.2 | GO:0004579 | oligosaccharyl transferase activity(GO:0004576) dolichyl-diphosphooligosaccharide-protein glycotransferase activity(GO:0004579) |
| 0.3 | 4.6 | GO:0003688 | DNA replication origin binding(GO:0003688) |
| 0.3 | 2.7 | GO:0016015 | morphogen activity(GO:0016015) |
| 0.3 | 8.7 | GO:0005355 | glucose transmembrane transporter activity(GO:0005355) |
| 0.3 | 3.8 | GO:0043024 | ribosomal small subunit binding(GO:0043024) |
| 0.3 | 0.9 | GO:0055077 | gap junction hemi-channel activity(GO:0055077) |
| 0.3 | 2.3 | GO:0008121 | ubiquinol-cytochrome-c reductase activity(GO:0008121) oxidoreductase activity, acting on diphenols and related substances as donors, cytochrome as acceptor(GO:0016681) |
| 0.3 | 1.4 | GO:0004677 | DNA-dependent protein kinase activity(GO:0004677) |
| 0.3 | 3.8 | GO:0016846 | carbon-sulfur lyase activity(GO:0016846) |
| 0.3 | 1.1 | GO:0030628 | pre-mRNA 3'-splice site binding(GO:0030628) |
| 0.3 | 21.7 | GO:0003777 | microtubule motor activity(GO:0003777) |
| 0.3 | 2.4 | GO:0003876 | AMP deaminase activity(GO:0003876) adenosine-phosphate deaminase activity(GO:0047623) |
| 0.3 | 0.8 | GO:0050501 | hyaluronan synthase activity(GO:0050501) |
| 0.3 | 15.5 | GO:0030374 | ligand-dependent nuclear receptor transcription coactivator activity(GO:0030374) |
| 0.3 | 5.8 | GO:0016875 | aminoacyl-tRNA ligase activity(GO:0004812) ligase activity, forming carbon-oxygen bonds(GO:0016875) ligase activity, forming aminoacyl-tRNA and related compounds(GO:0016876) |
| 0.2 | 3.0 | GO:0015129 | lactate transmembrane transporter activity(GO:0015129) |
| 0.2 | 1.4 | GO:0042289 | MHC class II protein binding(GO:0042289) |
| 0.2 | 3.8 | GO:0048185 | calcium channel inhibitor activity(GO:0019855) activin binding(GO:0048185) |
| 0.2 | 1.5 | GO:0042799 | histone methyltransferase activity (H4-K20 specific)(GO:0042799) |
| 0.2 | 7.6 | GO:0051059 | NF-kappaB binding(GO:0051059) |
| 0.2 | 1.7 | GO:0042975 | peroxisome proliferator activated receptor binding(GO:0042975) |
| 0.2 | 3.1 | GO:0017056 | structural constituent of nuclear pore(GO:0017056) |
| 0.2 | 1.4 | GO:0008109 | N-acetyllactosaminide beta-1,6-N-acetylglucosaminyltransferase activity(GO:0008109) |
| 0.2 | 4.5 | GO:0008494 | translation activator activity(GO:0008494) |
| 0.2 | 0.8 | GO:0001588 | dopamine neurotransmitter receptor activity, coupled via Gs(GO:0001588) |
| 0.2 | 1.0 | GO:0051998 | carboxyl-O-methyltransferase activity(GO:0010340) protein carboxyl O-methyltransferase activity(GO:0051998) |
| 0.2 | 8.8 | GO:0008139 | nuclear localization sequence binding(GO:0008139) |
| 0.2 | 3.5 | GO:0008179 | adenylate cyclase binding(GO:0008179) |
| 0.2 | 8.3 | GO:0030159 | receptor signaling complex scaffold activity(GO:0030159) |
| 0.2 | 1.9 | GO:1901612 | cardiolipin binding(GO:1901612) |
| 0.2 | 8.5 | GO:0043027 | cysteine-type endopeptidase inhibitor activity involved in apoptotic process(GO:0043027) |
| 0.2 | 2.1 | GO:1904264 | ubiquitin protein ligase activity involved in ERAD pathway(GO:1904264) |
| 0.2 | 2.6 | GO:0005004 | GPI-linked ephrin receptor activity(GO:0005004) |
| 0.2 | 0.9 | GO:0047374 | methylumbelliferyl-acetate deacetylase activity(GO:0047374) |
| 0.2 | 4.3 | GO:0046966 | thyroid hormone receptor binding(GO:0046966) |
| 0.2 | 3.6 | GO:0008353 | RNA polymerase II carboxy-terminal domain kinase activity(GO:0008353) |
| 0.2 | 3.1 | GO:0035256 | G-protein coupled glutamate receptor binding(GO:0035256) |
| 0.2 | 11.9 | GO:0070888 | E-box binding(GO:0070888) |
| 0.2 | 2.6 | GO:0030215 | semaphorin receptor binding(GO:0030215) |
| 0.2 | 1.0 | GO:0004839 | ubiquitin activating enzyme activity(GO:0004839) |
| 0.2 | 1.9 | GO:0043138 | 3'-5' DNA helicase activity(GO:0043138) |
| 0.2 | 1.6 | GO:0001042 | RNA polymerase I core binding(GO:0001042) |
| 0.2 | 1.4 | GO:0004969 | histamine receptor activity(GO:0004969) |
| 0.2 | 2.2 | GO:0042577 | lipid phosphatase activity(GO:0042577) |
| 0.2 | 0.9 | GO:1904288 | BAT3 complex binding(GO:1904288) |
| 0.1 | 0.6 | GO:0004743 | pyruvate kinase activity(GO:0004743) |
| 0.1 | 0.4 | GO:0042019 | interleukin-23 binding(GO:0042019) interleukin-23 receptor activity(GO:0042020) |
| 0.1 | 1.7 | GO:0016423 | tRNA (guanine) methyltransferase activity(GO:0016423) |
| 0.1 | 0.7 | GO:0035614 | snRNA stem-loop binding(GO:0035614) |
| 0.1 | 0.7 | GO:0019776 | Atg8 ligase activity(GO:0019776) |
| 0.1 | 3.0 | GO:0048018 | receptor agonist activity(GO:0048018) |
| 0.1 | 8.1 | GO:0008138 | protein tyrosine/serine/threonine phosphatase activity(GO:0008138) |
| 0.1 | 3.6 | GO:0005523 | tropomyosin binding(GO:0005523) |
| 0.1 | 6.4 | GO:0004864 | protein phosphatase inhibitor activity(GO:0004864) |
| 0.1 | 0.9 | GO:0034513 | box H/ACA snoRNA binding(GO:0034513) |
| 0.1 | 1.7 | GO:0008429 | phosphatidylethanolamine binding(GO:0008429) |
| 0.1 | 1.3 | GO:0031543 | peptidyl-proline dioxygenase activity(GO:0031543) peptidyl-proline 4-dioxygenase activity(GO:0031545) |
| 0.1 | 23.1 | GO:0017137 | Rab GTPase binding(GO:0017137) |
| 0.1 | 0.5 | GO:0043208 | glycosphingolipid binding(GO:0043208) |
| 0.1 | 4.4 | GO:0001671 | ATPase activator activity(GO:0001671) |
| 0.1 | 2.0 | GO:0004535 | poly(A)-specific ribonuclease activity(GO:0004535) |
| 0.1 | 1.0 | GO:0000340 | RNA 7-methylguanosine cap binding(GO:0000340) |
| 0.1 | 0.6 | GO:0019826 | oxygen sensor activity(GO:0019826) |
| 0.1 | 3.1 | GO:0005031 | tumor necrosis factor-activated receptor activity(GO:0005031) death receptor activity(GO:0005035) |
| 0.1 | 5.9 | GO:0070063 | RNA polymerase binding(GO:0070063) |
| 0.1 | 2.2 | GO:0032794 | GTPase activating protein binding(GO:0032794) |
| 0.1 | 0.4 | GO:0035800 | deubiquitinase activator activity(GO:0035800) |
| 0.1 | 1.4 | GO:0070628 | proteasome binding(GO:0070628) |
| 0.1 | 3.2 | GO:0030544 | Hsp70 protein binding(GO:0030544) |
| 0.1 | 0.7 | GO:0071933 | Arp2/3 complex binding(GO:0071933) |
| 0.1 | 1.3 | GO:0030515 | snoRNA binding(GO:0030515) |
| 0.1 | 0.5 | GO:0016748 | succinyltransferase activity(GO:0016748) |
| 0.1 | 1.5 | GO:0008093 | cytoskeletal adaptor activity(GO:0008093) |
| 0.1 | 1.7 | GO:0032266 | phosphatidylinositol-3-phosphate binding(GO:0032266) |
| 0.1 | 0.4 | GO:0004792 | thiosulfate sulfurtransferase activity(GO:0004792) |
| 0.1 | 0.8 | GO:0070679 | inositol 1,4,5 trisphosphate binding(GO:0070679) |
| 0.1 | 0.6 | GO:0000268 | peroxisome targeting sequence binding(GO:0000268) |
| 0.1 | 1.0 | GO:0004089 | carbonate dehydratase activity(GO:0004089) |
| 0.1 | 2.4 | GO:0043539 | protein serine/threonine kinase activator activity(GO:0043539) |
| 0.1 | 6.9 | GO:0000979 | RNA polymerase II core promoter sequence-specific DNA binding(GO:0000979) |
| 0.1 | 3.7 | GO:0001102 | RNA polymerase II activating transcription factor binding(GO:0001102) |
| 0.1 | 2.9 | GO:0008536 | Ran GTPase binding(GO:0008536) |
| 0.1 | 1.1 | GO:0033612 | receptor serine/threonine kinase binding(GO:0033612) |
| 0.1 | 5.0 | GO:0051087 | chaperone binding(GO:0051087) |
| 0.1 | 0.2 | GO:0000406 | double-strand/single-strand DNA junction binding(GO:0000406) dinucleotide repeat insertion binding(GO:0032181) |
| 0.1 | 0.5 | GO:0003910 | DNA ligase (ATP) activity(GO:0003910) |
| 0.1 | 2.0 | GO:0008331 | high voltage-gated calcium channel activity(GO:0008331) |
| 0.1 | 7.0 | GO:0008013 | beta-catenin binding(GO:0008013) |
| 0.1 | 6.0 | GO:0005201 | extracellular matrix structural constituent(GO:0005201) |
| 0.1 | 2.8 | GO:0061631 | ubiquitin conjugating enzyme activity(GO:0061631) |
| 0.1 | 1.6 | GO:0022848 | acetylcholine-gated cation channel activity(GO:0022848) |
| 0.1 | 0.4 | GO:0051011 | microtubule minus-end binding(GO:0051011) |
| 0.1 | 1.8 | GO:0016891 | endoribonuclease activity, producing 5'-phosphomonoesters(GO:0016891) |
| 0.1 | 0.6 | GO:0035381 | extracellular ATP-gated cation channel activity(GO:0004931) ATP-gated ion channel activity(GO:0035381) |
| 0.1 | 2.2 | GO:0003678 | DNA helicase activity(GO:0003678) |
| 0.1 | 0.5 | GO:0032052 | bile acid binding(GO:0032052) |
| 0.1 | 3.6 | GO:0004527 | exonuclease activity(GO:0004527) |
| 0.1 | 12.3 | GO:0044822 | mRNA binding(GO:0003729) poly(A) RNA binding(GO:0044822) |
| 0.1 | 0.1 | GO:1903136 | cuprous ion binding(GO:1903136) |
| 0.1 | 0.7 | GO:0022851 | GABA-gated chloride ion channel activity(GO:0022851) |
| 0.0 | 1.3 | GO:0071949 | FAD binding(GO:0071949) |
| 0.0 | 0.3 | GO:0004735 | pyrroline-5-carboxylate reductase activity(GO:0004735) |
| 0.0 | 3.7 | GO:0008307 | structural constituent of muscle(GO:0008307) |
| 0.0 | 0.7 | GO:0032036 | myosin heavy chain binding(GO:0032036) |
| 0.0 | 1.4 | GO:0001104 | RNA polymerase II transcription cofactor activity(GO:0001104) |
| 0.0 | 1.3 | GO:0030676 | Rac guanyl-nucleotide exchange factor activity(GO:0030676) |
| 0.0 | 0.5 | GO:0070034 | telomerase RNA binding(GO:0070034) |
| 0.0 | 0.7 | GO:0008349 | MAP kinase kinase kinase kinase activity(GO:0008349) |
| 0.0 | 1.3 | GO:0019239 | deaminase activity(GO:0019239) |
| 0.0 | 0.8 | GO:0042974 | retinoic acid receptor binding(GO:0042974) |
| 0.0 | 0.4 | GO:0022889 | L-serine transmembrane transporter activity(GO:0015194) serine transmembrane transporter activity(GO:0022889) |
| 0.0 | 1.1 | GO:0004708 | MAP kinase kinase activity(GO:0004708) |
| 0.0 | 0.4 | GO:0001135 | transcription factor activity, RNA polymerase II transcription factor recruiting(GO:0001135) |
| 0.0 | 3.7 | GO:0005319 | lipid transporter activity(GO:0005319) |
| 0.0 | 2.8 | GO:0005518 | collagen binding(GO:0005518) |
| 0.0 | 1.9 | GO:0005262 | calcium channel activity(GO:0005262) |
| 0.0 | 22.4 | GO:0005509 | calcium ion binding(GO:0005509) |
| 0.0 | 4.9 | GO:0008083 | growth factor activity(GO:0008083) |
| 0.0 | 0.1 | GO:0001025 | RNA polymerase III transcription factor binding(GO:0001025) |
| 0.0 | 0.9 | GO:0015269 | calcium-activated potassium channel activity(GO:0015269) |
| 0.0 | 4.8 | GO:0035091 | phosphatidylinositol binding(GO:0035091) |
| 0.0 | 0.1 | GO:0004705 | JUN kinase activity(GO:0004705) SAP kinase activity(GO:0016909) |
| 0.0 | 6.5 | GO:0003713 | transcription coactivator activity(GO:0003713) |
| 0.0 | 1.8 | GO:0005089 | Rho guanyl-nucleotide exchange factor activity(GO:0005089) |
| 0.0 | 0.5 | GO:0019870 | potassium channel inhibitor activity(GO:0019870) |
| 0.0 | 0.1 | GO:0005138 | interleukin-6 receptor binding(GO:0005138) |
| 0.0 | 0.5 | GO:0042288 | MHC class I protein binding(GO:0042288) |
| 0.0 | 0.7 | GO:0043531 | ADP binding(GO:0043531) |
| 0.0 | 0.2 | GO:0005243 | gap junction channel activity(GO:0005243) |
| 0.0 | 0.5 | GO:0031491 | nucleosome binding(GO:0031491) |
| 0.0 | 0.9 | GO:0004879 | RNA polymerase II transcription factor activity, ligand-activated sequence-specific DNA binding(GO:0004879) transcription factor activity, direct ligand regulated sequence-specific DNA binding(GO:0098531) |
| 0.0 | 1.1 | GO:0008235 | metalloexopeptidase activity(GO:0008235) |
| 0.0 | 0.3 | GO:0051537 | 2 iron, 2 sulfur cluster binding(GO:0051537) |
| 0.0 | 0.1 | GO:0016805 | dipeptidase activity(GO:0016805) |
| 0.0 | 0.3 | GO:0048487 | beta-tubulin binding(GO:0048487) |
| 0.0 | 0.7 | GO:0004714 | transmembrane receptor protein tyrosine kinase activity(GO:0004714) |
| 0.0 | 0.5 | GO:0000980 | RNA polymerase II distal enhancer sequence-specific DNA binding(GO:0000980) |
| 0.0 | 0.3 | GO:0047555 | 3',5'-cyclic-GMP phosphodiesterase activity(GO:0047555) |
Gene overrepresentation in curated gene sets: canonical pathways category:
| Log-likelihood per target | Total log-likelihood | Term | Description |
|---|---|---|---|
| 0.9 | 25.4 | PID ARF 3PATHWAY | Arf1 pathway |
| 0.6 | 17.8 | PID SYNDECAN 3 PATHWAY | Syndecan-3-mediated signaling events |
| 0.5 | 25.1 | NABA BASEMENT MEMBRANES | Genes encoding structural components of basement membranes |
| 0.5 | 15.3 | PID DNA PK PATHWAY | DNA-PK pathway in nonhomologous end joining |
| 0.4 | 26.1 | PID AURORA B PATHWAY | Aurora B signaling |
| 0.3 | 18.7 | PID HIF2PATHWAY | HIF-2-alpha transcription factor network |
| 0.3 | 7.0 | SA PROGRAMMED CELL DEATH | Programmed cell death, or apoptosis, eliminates damaged or unneeded cells. |
| 0.3 | 14.1 | PID AURORA A PATHWAY | Aurora A signaling |
| 0.3 | 6.9 | PID TCR JNK PATHWAY | JNK signaling in the CD4+ TCR pathway |
| 0.2 | 6.0 | PID PRL SIGNALING EVENTS PATHWAY | Signaling events mediated by PRL |
| 0.2 | 11.0 | PID MYC PATHWAY | C-MYC pathway |
| 0.2 | 12.1 | PID TCR CALCIUM PATHWAY | Calcium signaling in the CD4+ TCR pathway |
| 0.2 | 8.3 | PID FOXM1 PATHWAY | FOXM1 transcription factor network |
| 0.2 | 13.7 | PID DELTA NP63 PATHWAY | Validated transcriptional targets of deltaNp63 isoforms |
| 0.2 | 6.8 | PID SYNDECAN 2 PATHWAY | Syndecan-2-mediated signaling events |
| 0.2 | 3.9 | PID ERBB NETWORK PATHWAY | ErbB receptor signaling network |
| 0.2 | 3.6 | PID HEDGEHOG 2PATHWAY | Signaling events mediated by the Hedgehog family |
| 0.2 | 4.0 | PID P38 ALPHA BETA PATHWAY | Regulation of p38-alpha and p38-beta |
| 0.2 | 1.3 | PID INSULIN PATHWAY | Insulin Pathway |
| 0.2 | 2.7 | SIG CD40PATHWAYMAP | Genes related to CD40 signaling |
| 0.1 | 4.1 | PID BETA CATENIN DEG PATHWAY | Degradation of beta catenin |
| 0.1 | 11.9 | PID AP1 PATHWAY | AP-1 transcription factor network |
| 0.1 | 3.5 | SA TRKA RECEPTOR | The TrkA receptor binds nerve growth factor to activate MAP kinase pathways and promote cell growth. |
| 0.1 | 3.7 | PID ALK1 PATHWAY | ALK1 signaling events |
| 0.1 | 8.1 | PID BMP PATHWAY | BMP receptor signaling |
| 0.1 | 2.6 | PID IL1 PATHWAY | IL1-mediated signaling events |
| 0.1 | 6.0 | PID CDC42 REG PATHWAY | Regulation of CDC42 activity |
| 0.1 | 2.6 | PID EPHA FWDPATHWAY | EPHA forward signaling |
| 0.1 | 4.8 | PID NFKAPPAB CANONICAL PATHWAY | Canonical NF-kappaB pathway |
| 0.1 | 0.7 | PID TCR PATHWAY | TCR signaling in naïve CD4+ T cells |
| 0.1 | 3.0 | PID WNT SIGNALING PATHWAY | Wnt signaling network |
| 0.1 | 0.7 | PID TNF PATHWAY | TNF receptor signaling pathway |
| 0.1 | 1.5 | PID CIRCADIAN PATHWAY | Circadian rhythm pathway |
| 0.1 | 3.7 | ST P38 MAPK PATHWAY | p38 MAPK Pathway |
| 0.1 | 2.6 | PID INTEGRIN3 PATHWAY | Beta3 integrin cell surface interactions |
| 0.1 | 3.1 | PID P38 ALPHA BETA DOWNSTREAM PATHWAY | Signaling mediated by p38-alpha and p38-beta |
| 0.1 | 4.9 | PID AJDISS 2PATHWAY | Posttranslational regulation of adherens junction stability and dissassembly |
| 0.1 | 2.3 | PID FAK PATHWAY | Signaling events mediated by focal adhesion kinase |
| 0.1 | 3.6 | PID TAP63 PATHWAY | Validated transcriptional targets of TAp63 isoforms |
| 0.1 | 2.3 | PID LIS1 PATHWAY | Lissencephaly gene (LIS1) in neuronal migration and development |
| 0.1 | 0.8 | SA G1 AND S PHASES | Cdk2, 4, and 6 bind cyclin D in G1, while cdk2/cyclin E promotes the G1/S transition. |
| 0.1 | 0.7 | PID BARD1 PATHWAY | BARD1 signaling events |
| 0.1 | 11.8 | NABA ECM GLYCOPROTEINS | Genes encoding structural ECM glycoproteins |
| 0.1 | 1.9 | PID AR TF PATHWAY | Regulation of Androgen receptor activity |
| 0.0 | 2.0 | PID PLK1 PATHWAY | PLK1 signaling events |
| 0.0 | 1.6 | PID RHOA PATHWAY | RhoA signaling pathway |
| 0.0 | 2.2 | PID ILK PATHWAY | Integrin-linked kinase signaling |
| 0.0 | 1.2 | PID CD40 PATHWAY | CD40/CD40L signaling |
| 0.0 | 2.2 | PID HNF3B PATHWAY | FOXA2 and FOXA3 transcription factor networks |
| 0.0 | 1.9 | PID LKB1 PATHWAY | LKB1 signaling events |
| 0.0 | 3.2 | PID ERA GENOMIC PATHWAY | Validated nuclear estrogen receptor alpha network |
| 0.0 | 1.5 | PID RXR VDR PATHWAY | RXR and RAR heterodimerization with other nuclear receptor |
| 0.0 | 5.6 | NABA ECM AFFILIATED | Genes encoding proteins affiliated structurally or functionally to extracellular matrix proteins |
| 0.0 | 0.8 | PID ALPHA SYNUCLEIN PATHWAY | Alpha-synuclein signaling |
| 0.0 | 1.9 | PID ENDOTHELIN PATHWAY | Endothelins |
| 0.0 | 2.3 | PID TRKR PATHWAY | Neurotrophic factor-mediated Trk receptor signaling |
| 0.0 | 6.7 | NABA ECM REGULATORS | Genes encoding enzymes and their regulators involved in the remodeling of the extracellular matrix |
| 0.0 | 0.4 | PID A6B1 A6B4 INTEGRIN PATHWAY | a6b1 and a6b4 Integrin signaling |
| 0.0 | 0.6 | PID ERBB1 DOWNSTREAM PATHWAY | ErbB1 downstream signaling |
| 0.0 | 0.4 | PID INTEGRIN A4B1 PATHWAY | Alpha4 beta1 integrin signaling events |
| 0.0 | 0.6 | PID P75 NTR PATHWAY | p75(NTR)-mediated signaling |
| 0.0 | 0.3 | PID HEDGEHOG GLI PATHWAY | Hedgehog signaling events mediated by Gli proteins |
| 0.0 | 0.6 | PID PTP1B PATHWAY | Signaling events mediated by PTP1B |
| 0.0 | 0.5 | PID TGFBR PATHWAY | TGF-beta receptor signaling |
Gene overrepresentation in curated gene sets: REACTOME pathways category:
| Log-likelihood per target | Total log-likelihood | Term | Description |
|---|---|---|---|
| 1.5 | 17.4 | REACTOME MRNA DECAY BY 3 TO 5 EXORIBONUCLEASE | Genes involved in mRNA Decay by 3' to 5' Exoribonuclease |
| 0.9 | 22.4 | REACTOME RETROGRADE NEUROTROPHIN SIGNALLING | Genes involved in Retrograde neurotrophin signalling |
| 0.8 | 21.0 | REACTOME KINESINS | Genes involved in Kinesins |
| 0.6 | 8.7 | REACTOME ROLE OF DCC IN REGULATING APOPTOSIS | Genes involved in Role of DCC in regulating apoptosis |
| 0.5 | 2.4 | REACTOME INFLUENZA VIRAL RNA TRANSCRIPTION AND REPLICATION | Genes involved in Influenza Viral RNA Transcription and Replication |
| 0.5 | 6.1 | REACTOME THE ACTIVATION OF ARYLSULFATASES | Genes involved in The activation of arylsulfatases |
| 0.5 | 10.7 | REACTOME DEPOSITION OF NEW CENPA CONTAINING NUCLEOSOMES AT THE CENTROMERE | Genes involved in Deposition of New CENPA-containing Nucleosomes at the Centromere |
| 0.4 | 8.2 | REACTOME REGULATION OF RHEB GTPASE ACTIVITY BY AMPK | Genes involved in Regulation of Rheb GTPase activity by AMPK |
| 0.4 | 5.3 | REACTOME SLBP DEPENDENT PROCESSING OF REPLICATION DEPENDENT HISTONE PRE MRNAS | Genes involved in SLBP Dependent Processing of Replication-Dependent Histone Pre-mRNAs |
| 0.3 | 3.7 | REACTOME RNA POL III CHAIN ELONGATION | Genes involved in RNA Polymerase III Chain Elongation |
| 0.3 | 5.8 | REACTOME SCFSKP2 MEDIATED DEGRADATION OF P27 P21 | Genes involved in SCF(Skp2)-mediated degradation of p27/p21 |
| 0.3 | 4.0 | REACTOME SIGNALING BY NOTCH3 | Genes involved in Signaling by NOTCH3 |
| 0.3 | 1.5 | REACTOME ACTIVATION OF THE PRE REPLICATIVE COMPLEX | Genes involved in Activation of the pre-replicative complex |
| 0.3 | 11.7 | REACTOME DEGRADATION OF THE EXTRACELLULAR MATRIX | Genes involved in Degradation of the extracellular matrix |
| 0.3 | 6.0 | REACTOME REGULATION OF INSULIN LIKE GROWTH FACTOR IGF ACTIVITY BY INSULIN LIKE GROWTH FACTOR BINDING PROTEINS IGFBPS | Genes involved in Regulation of Insulin-like Growth Factor (IGF) Activity by Insulin-like Growth Factor Binding Proteins (IGFBPs) |
| 0.3 | 18.9 | REACTOME EXTRACELLULAR MATRIX ORGANIZATION | Genes involved in Extracellular matrix organization |
| 0.3 | 4.5 | REACTOME REVERSIBLE HYDRATION OF CARBON DIOXIDE | Genes involved in Reversible Hydration of Carbon Dioxide |
| 0.3 | 10.7 | REACTOME RNA POL I TRANSCRIPTION INITIATION | Genes involved in RNA Polymerase I Transcription Initiation |
| 0.3 | 6.2 | REACTOME ACTIVATION OF NF KAPPAB IN B CELLS | Genes involved in Activation of NF-kappaB in B Cells |
| 0.3 | 13.3 | REACTOME BMAL1 CLOCK NPAS2 ACTIVATES CIRCADIAN EXPRESSION | Genes involved in BMAL1:CLOCK/NPAS2 Activates Circadian Expression |
| 0.3 | 9.5 | REACTOME EXTENSION OF TELOMERES | Genes involved in Extension of Telomeres |
| 0.3 | 4.2 | REACTOME SYNTHESIS OF SUBSTRATES IN N GLYCAN BIOSYTHESIS | Genes involved in Synthesis of substrates in N-glycan biosythesis |
| 0.3 | 10.7 | REACTOME SIGNALING BY BMP | Genes involved in Signaling by BMP |
| 0.3 | 25.4 | REACTOME APC C CDH1 MEDIATED DEGRADATION OF CDC20 AND OTHER APC C CDH1 TARGETED PROTEINS IN LATE MITOSIS EARLY G1 | Genes involved in APC/C:Cdh1 mediated degradation of Cdc20 and other APC/C:Cdh1 targeted proteins in late mitosis/early G1 |
| 0.3 | 4.6 | REACTOME ALPHA LINOLENIC ACID ALA METABOLISM | Genes involved in alpha-linolenic acid (ALA) metabolism |
| 0.3 | 7.8 | REACTOME DOUBLE STRAND BREAK REPAIR | Genes involved in Double-Strand Break Repair |
| 0.2 | 2.2 | REACTOME RNA POL III TRANSCRIPTION INITIATION FROM TYPE 2 PROMOTER | Genes involved in RNA Polymerase III Transcription Initiation From Type 2 Promoter |
| 0.2 | 2.6 | REACTOME CDT1 ASSOCIATION WITH THE CDC6 ORC ORIGIN COMPLEX | Genes involved in CDT1 association with the CDC6:ORC:origin complex |
| 0.2 | 6.2 | REACTOME CTNNB1 PHOSPHORYLATION CASCADE | Genes involved in Beta-catenin phosphorylation cascade |
| 0.2 | 2.4 | REACTOME SIGNALING BY HIPPO | Genes involved in Signaling by Hippo |
| 0.2 | 8.5 | REACTOME IL1 SIGNALING | Genes involved in Interleukin-1 signaling |
| 0.2 | 2.9 | REACTOME TGF BETA RECEPTOR SIGNALING IN EMT EPITHELIAL TO MESENCHYMAL TRANSITION | Genes involved in TGF-beta receptor signaling in EMT (epithelial to mesenchymal transition) |
| 0.2 | 8.1 | REACTOME SEMA4D INDUCED CELL MIGRATION AND GROWTH CONE COLLAPSE | Genes involved in Sema4D induced cell migration and growth-cone collapse |
| 0.2 | 3.0 | REACTOME BILE SALT AND ORGANIC ANION SLC TRANSPORTERS | Genes involved in Bile salt and organic anion SLC transporters |
| 0.2 | 8.3 | REACTOME SMOOTH MUSCLE CONTRACTION | Genes involved in Smooth Muscle Contraction |
| 0.2 | 3.5 | REACTOME SIGNAL ATTENUATION | Genes involved in Signal attenuation |
| 0.2 | 7.2 | REACTOME REGULATION OF GENE EXPRESSION IN BETA CELLS | Genes involved in Regulation of gene expression in beta cells |
| 0.2 | 2.3 | REACTOME DNA STRAND ELONGATION | Genes involved in DNA strand elongation |
| 0.2 | 4.0 | REACTOME P38MAPK EVENTS | Genes involved in p38MAPK events |
| 0.1 | 12.0 | REACTOME TRANSCRIPTIONAL REGULATION OF WHITE ADIPOCYTE DIFFERENTIATION | Genes involved in Transcriptional Regulation of White Adipocyte Differentiation |
| 0.1 | 3.9 | REACTOME N GLYCAN ANTENNAE ELONGATION IN THE MEDIAL TRANS GOLGI | Genes involved in N-glycan antennae elongation in the medial/trans-Golgi |
| 0.1 | 1.7 | REACTOME GAMMA CARBOXYLATION TRANSPORT AND AMINO TERMINAL CLEAVAGE OF PROTEINS | Genes involved in Gamma-carboxylation, transport, and amino-terminal cleavage of proteins |
| 0.1 | 2.1 | REACTOME RECYCLING OF BILE ACIDS AND SALTS | Genes involved in Recycling of bile acids and salts |
| 0.1 | 6.4 | REACTOME SIGNAL TRANSDUCTION BY L1 | Genes involved in Signal transduction by L1 |
| 0.1 | 5.0 | REACTOME PREFOLDIN MEDIATED TRANSFER OF SUBSTRATE TO CCT TRIC | Genes involved in Prefoldin mediated transfer of substrate to CCT/TriC |
| 0.1 | 4.3 | REACTOME RNA POL II TRANSCRIPTION PRE INITIATION AND PROMOTER OPENING | Genes involved in RNA Polymerase II Transcription Pre-Initiation And Promoter Opening |
| 0.1 | 1.9 | REACTOME MITOCHONDRIAL TRNA AMINOACYLATION | Genes involved in Mitochondrial tRNA aminoacylation |
| 0.1 | 2.4 | REACTOME ENDOSOMAL SORTING COMPLEX REQUIRED FOR TRANSPORT ESCRT | Genes involved in Endosomal Sorting Complex Required For Transport (ESCRT) |
| 0.1 | 0.1 | REACTOME RECEPTOR LIGAND BINDING INITIATES THE SECOND PROTEOLYTIC CLEAVAGE OF NOTCH RECEPTOR | Genes involved in Receptor-ligand binding initiates the second proteolytic cleavage of Notch receptor |
| 0.1 | 7.2 | REACTOME LOSS OF NLP FROM MITOTIC CENTROSOMES | Genes involved in Loss of Nlp from mitotic centrosomes |
| 0.1 | 0.9 | REACTOME EGFR DOWNREGULATION | Genes involved in EGFR downregulation |
| 0.1 | 1.0 | REACTOME POST CHAPERONIN TUBULIN FOLDING PATHWAY | Genes involved in Post-chaperonin tubulin folding pathway |
| 0.1 | 2.1 | REACTOME SIGNALING BY TGF BETA RECEPTOR COMPLEX | Genes involved in Signaling by TGF-beta Receptor Complex |
| 0.1 | 4.1 | REACTOME METABOLISM OF NON CODING RNA | Genes involved in Metabolism of non-coding RNA |
| 0.1 | 28.5 | REACTOME GENERIC TRANSCRIPTION PATHWAY | Genes involved in Generic Transcription Pathway |
| 0.1 | 1.6 | REACTOME EICOSANOID LIGAND BINDING RECEPTORS | Genes involved in Eicosanoid ligand-binding receptors |
| 0.1 | 1.6 | REACTOME PRESYNAPTIC NICOTINIC ACETYLCHOLINE RECEPTORS | Genes involved in Presynaptic nicotinic acetylcholine receptors |
| 0.1 | 1.5 | REACTOME RESOLUTION OF AP SITES VIA THE MULTIPLE NUCLEOTIDE PATCH REPLACEMENT PATHWAY | Genes involved in Resolution of AP sites via the multiple-nucleotide patch replacement pathway |
| 0.1 | 0.9 | REACTOME TRANSCRIPTION COUPLED NER TC NER | Genes involved in Transcription-coupled NER (TC-NER) |
| 0.1 | 1.1 | REACTOME PROCESSING OF CAPPED INTRONLESS PRE MRNA | Genes involved in Processing of Capped Intronless Pre-mRNA |
| 0.1 | 0.6 | REACTOME RNA POL III TRANSCRIPTION INITIATION FROM TYPE 3 PROMOTER | Genes involved in RNA Polymerase III Transcription Initiation From Type 3 Promoter |
| 0.1 | 3.5 | REACTOME MYOGENESIS | Genes involved in Myogenesis |
| 0.1 | 1.1 | REACTOME GAP JUNCTION ASSEMBLY | Genes involved in Gap junction assembly |
| 0.1 | 1.6 | REACTOME SYNTHESIS OF PC | Genes involved in Synthesis of PC |
| 0.1 | 3.2 | REACTOME ION TRANSPORT BY P TYPE ATPASES | Genes involved in Ion transport by P-type ATPases |
| 0.1 | 1.0 | REACTOME OXYGEN DEPENDENT PROLINE HYDROXYLATION OF HYPOXIA INDUCIBLE FACTOR ALPHA | Genes involved in Oxygen-dependent Proline Hydroxylation of Hypoxia-inducible Factor Alpha |
| 0.1 | 0.3 | REACTOME ABORTIVE ELONGATION OF HIV1 TRANSCRIPT IN THE ABSENCE OF TAT | Genes involved in Abortive elongation of HIV-1 transcript in the absence of Tat |
| 0.1 | 5.2 | REACTOME L1CAM INTERACTIONS | Genes involved in L1CAM interactions |
| 0.1 | 3.1 | REACTOME PPARA ACTIVATES GENE EXPRESSION | Genes involved in PPARA Activates Gene Expression |
| 0.1 | 1.7 | REACTOME SYNTHESIS AND INTERCONVERSION OF NUCLEOTIDE DI AND TRIPHOSPHATES | Genes involved in Synthesis and interconversion of nucleotide di- and triphosphates |
| 0.0 | 0.7 | REACTOME TRAFFICKING OF GLUR2 CONTAINING AMPA RECEPTORS | Genes involved in Trafficking of GluR2-containing AMPA receptors |
| 0.0 | 0.7 | REACTOME MTORC1 MEDIATED SIGNALLING | Genes involved in mTORC1-mediated signalling |
| 0.0 | 0.8 | REACTOME OTHER SEMAPHORIN INTERACTIONS | Genes involved in Other semaphorin interactions |
| 0.0 | 1.7 | REACTOME NCAM1 INTERACTIONS | Genes involved in NCAM1 interactions |
| 0.0 | 2.4 | REACTOME ASPARAGINE N LINKED GLYCOSYLATION | Genes involved in Asparagine N-linked glycosylation |
| 0.0 | 1.5 | REACTOME AMINE LIGAND BINDING RECEPTORS | Genes involved in Amine ligand-binding receptors |
| 0.0 | 0.5 | REACTOME NONSENSE MEDIATED DECAY ENHANCED BY THE EXON JUNCTION COMPLEX | Genes involved in Nonsense Mediated Decay Enhanced by the Exon Junction Complex |
| 0.0 | 0.4 | REACTOME THE NLRP3 INFLAMMASOME | Genes involved in The NLRP3 inflammasome |
| 0.0 | 0.4 | REACTOME ADENYLATE CYCLASE INHIBITORY PATHWAY | Genes involved in Adenylate cyclase inhibitory pathway |
| 0.0 | 0.7 | REACTOME DOWNSTREAM SIGNAL TRANSDUCTION | Genes involved in Downstream signal transduction |
| 0.0 | 0.8 | REACTOME HYALURONAN METABOLISM | Genes involved in Hyaluronan metabolism |
| 0.0 | 3.3 | REACTOME RESPONSE TO ELEVATED PLATELET CYTOSOLIC CA2 | Genes involved in Response to elevated platelet cytosolic Ca2+ |
| 0.0 | 1.2 | REACTOME CGMP EFFECTS | Genes involved in cGMP effects |
| 0.0 | 0.3 | REACTOME COPI MEDIATED TRANSPORT | Genes involved in COPI Mediated Transport |
| 0.0 | 0.9 | REACTOME MHC CLASS II ANTIGEN PRESENTATION | Genes involved in MHC class II antigen presentation |
| 0.0 | 1.0 | REACTOME NUCLEAR SIGNALING BY ERBB4 | Genes involved in Nuclear signaling by ERBB4 |
| 0.0 | 3.5 | REACTOME APOPTOSIS | Genes involved in Apoptosis |
| 0.0 | 0.6 | REACTOME PKA MEDIATED PHOSPHORYLATION OF CREB | Genes involved in PKA-mediated phosphorylation of CREB |
| 0.0 | 0.7 | REACTOME GABA A RECEPTOR ACTIVATION | Genes involved in GABA A receptor activation |
| 0.0 | 0.4 | REACTOME TRAF6 MEDIATED IRF7 ACTIVATION | Genes involved in TRAF6 mediated IRF7 activation |