Project
GNF SymAtlas + NCI-60 cancer cell lines, human (Su, 2004; Ross, 2000)
Navigation
Downloads
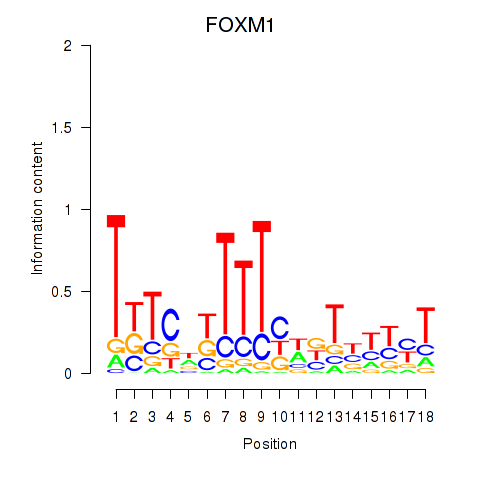
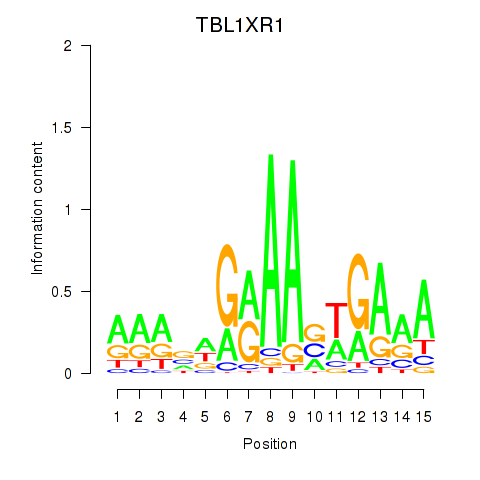
Results for FOXM1_TBL1XR1
Z-value: 2.17
Motif logo
Transcription factors associated with FOXM1_TBL1XR1
| Gene Symbol | Gene ID | Gene Info |
|---|---|---|
|
FOXM1
|
ENSG00000111206.13 | FOXM1 |
|
TBL1XR1
|
ENSG00000177565.18 | TBL1XR1 |
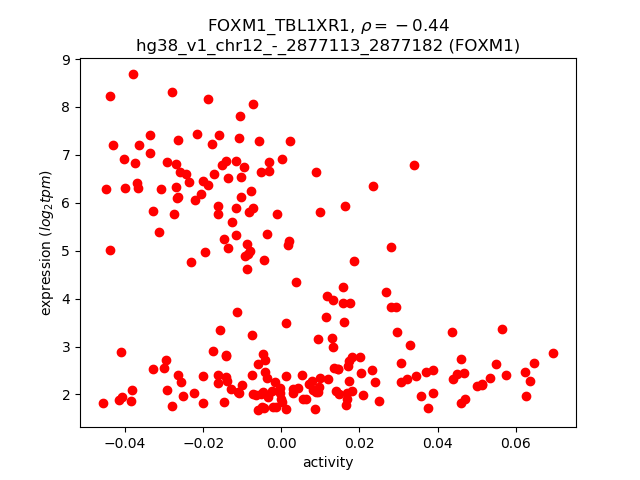
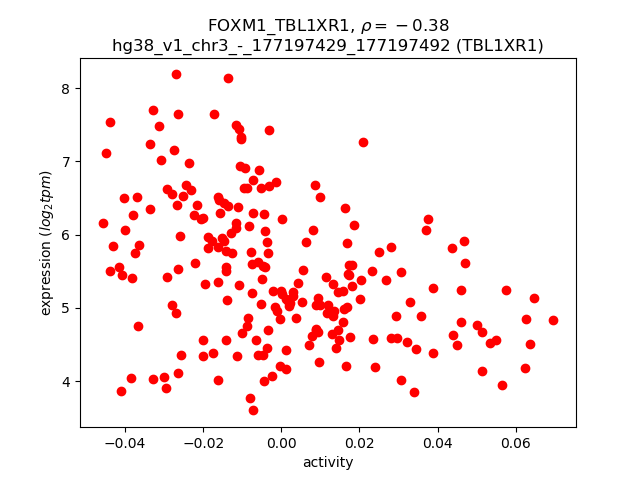
Activity-expression correlation:
| Gene | Promoter | Pearson corr. coef. | P-value | Plot |
|---|---|---|---|---|
| FOXM1 | hg38_v1_chr12_-_2877113_2877182, hg38_v1_chr12_-_2876986_2877092 | -0.44 | 1.7e-11 | Click! |
| TBL1XR1 | hg38_v1_chr3_-_177197429_177197492, hg38_v1_chr3_-_177196451_177196489, hg38_v1_chr3_-_177197210_177197233 | -0.38 | 7.4e-09 | Click! |
Activity profile of FOXM1_TBL1XR1 motif
Sorted Z-values of FOXM1_TBL1XR1 motif
Network of associatons between targets according to the STRING database.

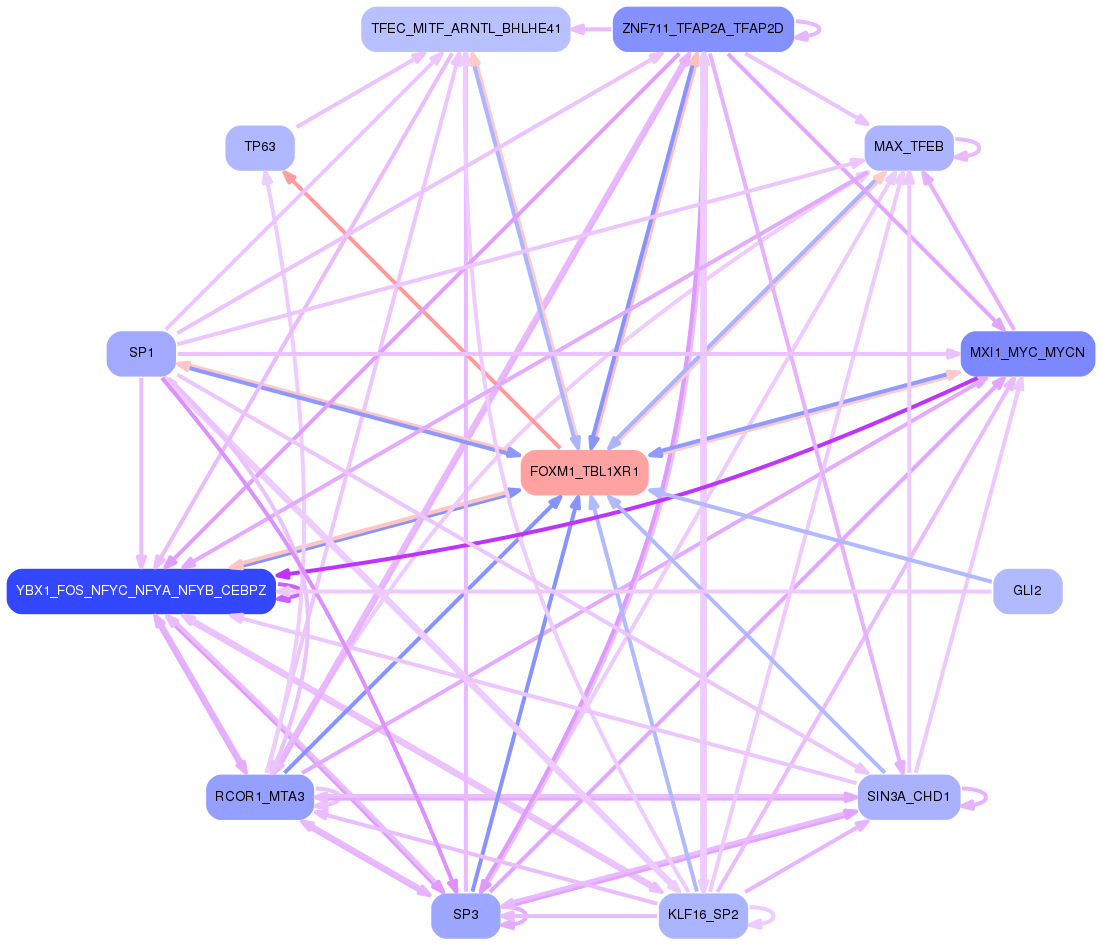
First level regulatory network of FOXM1_TBL1XR1
Gene Ontology Analysis
Gene overrepresentation in biological process category:
| Log-likelihood per target | Total log-likelihood | Term | Description |
|---|---|---|---|
| 31.5 | 410.0 | GO:1900747 | negative regulation of vascular endothelial growth factor signaling pathway(GO:1900747) |
| 16.1 | 48.3 | GO:0001868 | regulation of complement activation, lectin pathway(GO:0001868) negative regulation of complement activation, lectin pathway(GO:0001869) |
| 12.7 | 50.8 | GO:0007499 | ectoderm and mesoderm interaction(GO:0007499) |
| 10.8 | 10.8 | GO:0010430 | fatty acid omega-oxidation(GO:0010430) |
| 10.7 | 53.4 | GO:1902847 | regulation of neuronal signal transduction(GO:1902847) positive regulation of neurofibrillary tangle assembly(GO:1902998) |
| 8.7 | 43.7 | GO:0044858 | plasma membrane raft distribution(GO:0044855) plasma membrane raft localization(GO:0044856) plasma membrane raft polarization(GO:0044858) regulation of plasma membrane raft polarization(GO:1903906) |
| 8.0 | 39.9 | GO:0006432 | phenylalanyl-tRNA aminoacylation(GO:0006432) |
| 7.9 | 15.9 | GO:0036292 | DNA rewinding(GO:0036292) |
| 7.5 | 22.6 | GO:0030185 | nitric oxide transport(GO:0030185) |
| 7.5 | 22.5 | GO:0006982 | response to lipid hydroperoxide(GO:0006982) |
| 7.4 | 22.2 | GO:0071139 | resolution of recombination intermediates(GO:0071139) resolution of mitotic recombination intermediates(GO:0071140) |
| 6.5 | 19.5 | GO:1904397 | negative regulation of neuromuscular junction development(GO:1904397) |
| 6.4 | 19.1 | GO:0014813 | skeletal muscle satellite cell commitment(GO:0014813) |
| 6.4 | 57.2 | GO:0032790 | ribosome disassembly(GO:0032790) |
| 6.0 | 23.9 | GO:0046968 | peptide antigen transport(GO:0046968) |
| 6.0 | 23.9 | GO:0090299 | fibroblast growth factor receptor signaling pathway involved in neural plate anterior/posterior pattern formation(GO:0060825) regulation of neural crest formation(GO:0090299) negative regulation of neural crest formation(GO:0090301) regulation of fibroblast growth factor receptor signaling pathway involved in neural plate anterior/posterior pattern formation(GO:2000313) negative regulation of fibroblast growth factor receptor signaling pathway involved in neural plate anterior/posterior pattern formation(GO:2000314) |
| 5.8 | 17.5 | GO:1902283 | negative regulation of primary amine oxidase activity(GO:1902283) |
| 5.8 | 17.3 | GO:0001794 | type IIa hypersensitivity(GO:0001794) regulation of type IIa hypersensitivity(GO:0001796) type II hypersensitivity(GO:0002445) regulation of type II hypersensitivity(GO:0002892) |
| 5.6 | 22.5 | GO:1902530 | regulation of protein linear polyubiquitination(GO:1902528) positive regulation of protein linear polyubiquitination(GO:1902530) |
| 5.6 | 11.2 | GO:0002884 | negative regulation of hypersensitivity(GO:0002884) |
| 5.4 | 16.3 | GO:2000097 | regulation of smooth muscle cell-matrix adhesion(GO:2000097) |
| 5.3 | 16.0 | GO:0071934 | thiamine transport(GO:0015888) thiamine transmembrane transport(GO:0071934) |
| 5.3 | 5.3 | GO:0061518 | macrophage proliferation(GO:0061517) microglial cell proliferation(GO:0061518) |
| 5.2 | 31.3 | GO:1902572 | negative regulation of serine-type endopeptidase activity(GO:1900004) negative regulation of serine-type peptidase activity(GO:1902572) |
| 5.2 | 10.3 | GO:0060932 | His-Purkinje system cell differentiation(GO:0060932) |
| 5.1 | 15.3 | GO:0019075 | virus maturation(GO:0019075) |
| 5.1 | 20.3 | GO:0031117 | positive regulation of microtubule depolymerization(GO:0031117) |
| 5.1 | 15.2 | GO:0018963 | phthalate metabolic process(GO:0018963) |
| 5.0 | 10.1 | GO:1904204 | regulation of skeletal muscle hypertrophy(GO:1904204) |
| 4.9 | 87.5 | GO:0015671 | oxygen transport(GO:0015671) |
| 4.8 | 14.5 | GO:0030573 | bile acid catabolic process(GO:0030573) |
| 4.7 | 18.8 | GO:0035790 | platelet-derived growth factor receptor-alpha signaling pathway(GO:0035790) |
| 4.7 | 18.7 | GO:0036269 | swimming behavior(GO:0036269) |
| 4.6 | 27.9 | GO:0060414 | aorta smooth muscle tissue morphogenesis(GO:0060414) |
| 4.6 | 13.9 | GO:1901877 | regulation of calcium ion binding(GO:1901876) negative regulation of calcium ion binding(GO:1901877) |
| 4.6 | 91.2 | GO:0006957 | complement activation, alternative pathway(GO:0006957) |
| 4.5 | 17.9 | GO:0002370 | natural killer cell cytokine production(GO:0002370) regulation of natural killer cell cytokine production(GO:0002727) |
| 4.3 | 12.9 | GO:0036079 | GDP-fucose transport(GO:0015783) purine nucleotide-sugar transport(GO:0036079) |
| 4.3 | 4.3 | GO:1904933 | regulation of cell proliferation in midbrain(GO:1904933) |
| 4.3 | 12.8 | GO:0034769 | basement membrane disassembly(GO:0034769) |
| 4.2 | 17.0 | GO:0002399 | MHC class II protein complex assembly(GO:0002399) |
| 4.2 | 12.5 | GO:2000296 | negative regulation of hydrogen peroxide catabolic process(GO:2000296) |
| 4.1 | 49.5 | GO:0006069 | ethanol oxidation(GO:0006069) |
| 4.1 | 16.5 | GO:0010900 | negative regulation of phosphatidylcholine catabolic process(GO:0010900) |
| 4.1 | 24.5 | GO:0071896 | protein localization to adherens junction(GO:0071896) |
| 4.1 | 32.6 | GO:0070543 | response to linoleic acid(GO:0070543) |
| 4.1 | 12.2 | GO:0090341 | negative regulation of secretion of lysosomal enzymes(GO:0090341) |
| 4.0 | 28.3 | GO:1903237 | negative regulation of leukocyte tethering or rolling(GO:1903237) |
| 4.0 | 400.7 | GO:0050911 | detection of chemical stimulus involved in sensory perception of smell(GO:0050911) |
| 4.0 | 4.0 | GO:0046010 | positive regulation of circadian sleep/wake cycle, non-REM sleep(GO:0046010) |
| 4.0 | 15.9 | GO:1900190 | biofilm formation(GO:0042710) single-species biofilm formation(GO:0044010) single-species biofilm formation in or on host organism(GO:0044407) regulation of single-species biofilm formation(GO:1900190) negative regulation of single-species biofilm formation(GO:1900191) regulation of single-species biofilm formation in or on host organism(GO:1900228) negative regulation of single-species biofilm formation in or on host organism(GO:1900229) |
| 4.0 | 4.0 | GO:0002408 | myeloid dendritic cell chemotaxis(GO:0002408) |
| 3.9 | 11.7 | GO:0045897 | positive regulation of transcription during mitosis(GO:0045897) |
| 3.9 | 7.8 | GO:1902617 | response to fluoride(GO:1902617) |
| 3.9 | 11.7 | GO:0007181 | transforming growth factor beta receptor complex assembly(GO:0007181) |
| 3.9 | 15.5 | GO:0019805 | quinolinate biosynthetic process(GO:0019805) |
| 3.9 | 7.7 | GO:0032097 | positive regulation of response to food(GO:0032097) positive regulation of appetite(GO:0032100) |
| 3.9 | 30.8 | GO:0015705 | iodide transport(GO:0015705) |
| 3.8 | 11.5 | GO:0033591 | response to L-ascorbic acid(GO:0033591) |
| 3.8 | 7.6 | GO:0035759 | mesangial cell-matrix adhesion(GO:0035759) |
| 3.7 | 11.2 | GO:1990451 | cellular stress response to acidic pH(GO:1990451) |
| 3.7 | 11.1 | GO:0045645 | regulation of eosinophil differentiation(GO:0045643) positive regulation of eosinophil differentiation(GO:0045645) |
| 3.7 | 37.0 | GO:0002430 | complement receptor mediated signaling pathway(GO:0002430) |
| 3.7 | 22.1 | GO:0003350 | pulmonary myocardium development(GO:0003350) |
| 3.7 | 7.3 | GO:0016068 | regulation of type I hypersensitivity(GO:0001810) positive regulation of type I hypersensitivity(GO:0001812) type I hypersensitivity(GO:0016068) |
| 3.7 | 62.1 | GO:0007021 | tubulin complex assembly(GO:0007021) |
| 3.6 | 10.9 | GO:1905237 | response to cyclosporin A(GO:1905237) |
| 3.6 | 10.9 | GO:0060875 | subpallium cell proliferation in forebrain(GO:0022012) lateral ganglionic eminence cell proliferation(GO:0022018) lambdoid suture morphogenesis(GO:0060366) sagittal suture morphogenesis(GO:0060367) anterior semicircular canal development(GO:0060873) lateral semicircular canal development(GO:0060875) |
| 3.6 | 7.3 | GO:0003166 | bundle of His development(GO:0003166) |
| 3.6 | 25.4 | GO:0071315 | cellular response to morphine(GO:0071315) cellular response to isoquinoline alkaloid(GO:0071317) |
| 3.6 | 7.2 | GO:0044782 | cilium organization(GO:0044782) |
| 3.6 | 7.2 | GO:1904379 | protein localization to cytosolic proteasome complex(GO:1904327) protein localization to cytosolic proteasome complex involved in ERAD pathway(GO:1904379) |
| 3.6 | 25.1 | GO:1901509 | regulation of endothelial tube morphogenesis(GO:1901509) |
| 3.6 | 10.7 | GO:0052047 | interaction with other organism via secreted substance involved in symbiotic interaction(GO:0052047) |
| 3.6 | 14.3 | GO:0051866 | general adaptation syndrome(GO:0051866) |
| 3.6 | 7.1 | GO:0097676 | histone H3-K36 dimethylation(GO:0097676) |
| 3.6 | 10.7 | GO:0071529 | cementum mineralization(GO:0071529) |
| 3.5 | 10.6 | GO:0098528 | skeletal muscle fiber differentiation(GO:0098528) regulation of skeletal muscle fiber differentiation(GO:1902809) |
| 3.5 | 10.5 | GO:1904580 | regulation of intracellular mRNA localization(GO:1904580) positive regulation of intracellular mRNA localization(GO:1904582) |
| 3.5 | 17.4 | GO:0001957 | intramembranous ossification(GO:0001957) direct ossification(GO:0036072) |
| 3.5 | 13.8 | GO:0006663 | platelet activating factor biosynthetic process(GO:0006663) |
| 3.4 | 10.2 | GO:0051710 | regulation of cytolysis in other organism(GO:0051710) |
| 3.4 | 3.4 | GO:0060729 | intestinal epithelial structure maintenance(GO:0060729) |
| 3.4 | 50.5 | GO:0036149 | phosphatidylinositol acyl-chain remodeling(GO:0036149) |
| 3.4 | 20.2 | GO:0001692 | histamine metabolic process(GO:0001692) |
| 3.4 | 3.4 | GO:0030241 | skeletal muscle myosin thick filament assembly(GO:0030241) |
| 3.3 | 26.7 | GO:0001887 | selenium compound metabolic process(GO:0001887) |
| 3.3 | 60.1 | GO:0042737 | drug catabolic process(GO:0042737) |
| 3.3 | 6.7 | GO:0006145 | purine nucleobase catabolic process(GO:0006145) |
| 3.3 | 23.1 | GO:0034587 | piRNA metabolic process(GO:0034587) |
| 3.3 | 19.7 | GO:0035469 | determination of pancreatic left/right asymmetry(GO:0035469) |
| 3.3 | 13.1 | GO:0035962 | response to interleukin-13(GO:0035962) |
| 3.2 | 3.2 | GO:0007341 | penetration of zona pellucida(GO:0007341) |
| 3.2 | 3.2 | GO:0032224 | positive regulation of synaptic transmission, cholinergic(GO:0032224) |
| 3.2 | 16.2 | GO:1904073 | regulation of trophectodermal cell proliferation(GO:1904073) positive regulation of trophectodermal cell proliferation(GO:1904075) |
| 3.2 | 6.4 | GO:0060018 | astrocyte fate commitment(GO:0060018) |
| 3.2 | 12.7 | GO:0070434 | positive regulation of nucleotide-binding oligomerization domain containing signaling pathway(GO:0070426) positive regulation of nucleotide-binding oligomerization domain containing 2 signaling pathway(GO:0070434) |
| 3.2 | 9.5 | GO:1990654 | regulation of extrathymic T cell differentiation(GO:0033082) sebum secreting cell proliferation(GO:1990654) |
| 3.1 | 9.3 | GO:1990641 | response to iron ion starvation(GO:1990641) |
| 3.1 | 95.9 | GO:0098743 | cell aggregation(GO:0098743) |
| 3.1 | 9.3 | GO:0015855 | pyrimidine nucleobase transport(GO:0015855) purine nucleobase transmembrane transport(GO:1904823) |
| 3.1 | 9.2 | GO:0070317 | negative regulation of G0 to G1 transition(GO:0070317) |
| 3.1 | 12.3 | GO:0007161 | calcium-independent cell-matrix adhesion(GO:0007161) |
| 3.0 | 9.1 | GO:0070408 | carbamoyl phosphate metabolic process(GO:0070408) carbamoyl phosphate biosynthetic process(GO:0070409) cellular response to oleic acid(GO:0071400) response to ammonia(GO:1903717) cellular response to ammonia(GO:1903718) |
| 3.0 | 3.0 | GO:0070309 | lens fiber cell morphogenesis(GO:0070309) |
| 3.0 | 9.0 | GO:0007525 | somatic muscle development(GO:0007525) |
| 3.0 | 56.8 | GO:1902083 | negative regulation of peptidyl-cysteine S-nitrosylation(GO:1902083) |
| 3.0 | 26.9 | GO:0002175 | protein localization to paranode region of axon(GO:0002175) |
| 3.0 | 8.9 | GO:0006683 | galactosylceramide catabolic process(GO:0006683) |
| 3.0 | 17.8 | GO:0019732 | antifungal humoral response(GO:0019732) |
| 3.0 | 26.6 | GO:1902035 | positive regulation of hematopoietic stem cell proliferation(GO:1902035) |
| 2.9 | 5.9 | GO:0072011 | glomerular endothelium development(GO:0072011) |
| 2.9 | 14.5 | GO:0030070 | insulin processing(GO:0030070) |
| 2.9 | 2.9 | GO:0035441 | cell migration involved in vasculogenesis(GO:0035441) |
| 2.9 | 8.7 | GO:0006910 | phagocytosis, recognition(GO:0006910) |
| 2.9 | 5.8 | GO:0042746 | regulation of circadian sleep/wake cycle, wakefulness(GO:0010840) circadian sleep/wake cycle, wakefulness(GO:0042746) |
| 2.9 | 8.6 | GO:2000053 | regulation of Wnt signaling pathway involved in dorsal/ventral axis specification(GO:2000053) |
| 2.9 | 17.1 | GO:1904306 | regulation of gastro-intestinal system smooth muscle contraction(GO:1904304) positive regulation of gastro-intestinal system smooth muscle contraction(GO:1904306) |
| 2.9 | 2.9 | GO:0035566 | regulation of metanephros size(GO:0035566) |
| 2.8 | 19.9 | GO:1901098 | positive regulation of autophagosome maturation(GO:1901098) |
| 2.8 | 11.3 | GO:0038124 | toll-like receptor TLR6:TLR2 signaling pathway(GO:0038124) response to diacyl bacterial lipopeptide(GO:0071724) cellular response to diacyl bacterial lipopeptide(GO:0071726) |
| 2.8 | 11.3 | GO:0097283 | keratinocyte apoptotic process(GO:0097283) regulation of keratinocyte apoptotic process(GO:1902172) |
| 2.8 | 2.8 | GO:0097475 | motor neuron migration(GO:0097475) |
| 2.8 | 19.7 | GO:0072757 | cellular response to camptothecin(GO:0072757) |
| 2.8 | 44.8 | GO:0018026 | peptidyl-lysine monomethylation(GO:0018026) |
| 2.8 | 19.6 | GO:0070560 | protein secretion by platelet(GO:0070560) |
| 2.8 | 8.4 | GO:1902866 | regulation of neural retina development(GO:0061074) regulation of retina development in camera-type eye(GO:1902866) |
| 2.8 | 16.8 | GO:0006398 | mRNA 3'-end processing by stem-loop binding and cleavage(GO:0006398) |
| 2.8 | 11.2 | GO:0002913 | positive regulation of T cell anergy(GO:0002669) positive regulation of lymphocyte anergy(GO:0002913) |
| 2.8 | 5.6 | GO:0043504 | mitochondrial DNA repair(GO:0043504) |
| 2.8 | 11.1 | GO:0071918 | urea transmembrane transport(GO:0071918) |
| 2.7 | 2.7 | GO:0048850 | hypophysis morphogenesis(GO:0048850) diencephalon morphogenesis(GO:0048852) |
| 2.7 | 10.9 | GO:2001034 | positive regulation of double-strand break repair via nonhomologous end joining(GO:2001034) |
| 2.7 | 2.7 | GO:0034146 | toll-like receptor 5 signaling pathway(GO:0034146) |
| 2.7 | 56.9 | GO:0033141 | positive regulation of peptidyl-serine phosphorylation of STAT protein(GO:0033141) |
| 2.7 | 10.8 | GO:0086097 | phospholipase C-activating angiotensin-activated signaling pathway(GO:0086097) |
| 2.7 | 27.0 | GO:0042908 | xenobiotic transport(GO:0042908) |
| 2.7 | 29.6 | GO:0048007 | antigen processing and presentation of lipid antigen via MHC class Ib(GO:0048003) antigen processing and presentation, exogenous lipid antigen via MHC class Ib(GO:0048007) |
| 2.7 | 2.7 | GO:0010882 | regulation of cardiac muscle contraction by calcium ion signaling(GO:0010882) |
| 2.7 | 2.7 | GO:0021957 | corticospinal tract morphogenesis(GO:0021957) |
| 2.7 | 21.4 | GO:0042904 | 9-cis-retinoic acid biosynthetic process(GO:0042904) 9-cis-retinoic acid metabolic process(GO:0042905) |
| 2.7 | 21.3 | GO:0045919 | positive regulation of cytolysis(GO:0045919) |
| 2.7 | 8.0 | GO:1901491 | negative regulation of lymphangiogenesis(GO:1901491) |
| 2.7 | 8.0 | GO:0051946 | regulation of amino acid uptake involved in synaptic transmission(GO:0051941) regulation of glutamate uptake involved in transmission of nerve impulse(GO:0051946) regulation of L-glutamate import(GO:1900920) |
| 2.6 | 15.9 | GO:0002118 | aggressive behavior(GO:0002118) |
| 2.6 | 10.6 | GO:0046440 | L-lysine catabolic process to acetyl-CoA(GO:0019474) L-lysine catabolic process(GO:0019477) L-lysine metabolic process(GO:0046440) |
| 2.6 | 7.9 | GO:0008065 | establishment of blood-nerve barrier(GO:0008065) |
| 2.6 | 10.6 | GO:0036369 | transcription factor catabolic process(GO:0036369) |
| 2.6 | 7.8 | GO:0051939 | gamma-aminobutyric acid import(GO:0051939) |
| 2.6 | 15.5 | GO:0061737 | leukotriene signaling pathway(GO:0061737) |
| 2.6 | 28.5 | GO:1904262 | negative regulation of TORC1 signaling(GO:1904262) |
| 2.6 | 7.8 | GO:0061394 | regulation of transcription from RNA polymerase II promoter in response to arsenic-containing substance(GO:0061394) |
| 2.6 | 10.3 | GO:0010645 | regulation of cell communication by chemical coupling(GO:0010645) positive regulation of cell communication by chemical coupling(GO:0010652) |
| 2.6 | 15.4 | GO:0016926 | protein desumoylation(GO:0016926) |
| 2.6 | 30.7 | GO:0003406 | retinal pigment epithelium development(GO:0003406) |
| 2.6 | 2.6 | GO:0002438 | acute inflammatory response to antigenic stimulus(GO:0002438) |
| 2.6 | 10.2 | GO:1990637 | response to prolactin(GO:1990637) |
| 2.5 | 7.6 | GO:2000439 | positive regulation of monocyte extravasation(GO:2000439) |
| 2.5 | 7.6 | GO:1990168 | protein K33-linked deubiquitination(GO:1990168) |
| 2.5 | 7.5 | GO:1905075 | occluding junction disassembly(GO:1905071) regulation of occluding junction disassembly(GO:1905073) positive regulation of occluding junction disassembly(GO:1905075) |
| 2.5 | 10.0 | GO:0006542 | glutamine biosynthetic process(GO:0006542) |
| 2.5 | 7.5 | GO:0097272 | ammonia homeostasis(GO:0097272) |
| 2.5 | 10.0 | GO:0035106 | operant conditioning(GO:0035106) |
| 2.5 | 22.5 | GO:0060267 | positive regulation of respiratory burst(GO:0060267) |
| 2.5 | 7.4 | GO:0070845 | misfolded protein transport(GO:0070843) polyubiquitinated protein transport(GO:0070844) polyubiquitinated misfolded protein transport(GO:0070845) Hsp90 deacetylation(GO:0070846) |
| 2.5 | 7.4 | GO:0061699 | protein demalonylation(GO:0036046) peptidyl-lysine demalonylation(GO:0036047) protein desuccinylation(GO:0036048) peptidyl-lysine desuccinylation(GO:0036049) protein deglutarylation(GO:0061698) peptidyl-lysine deglutarylation(GO:0061699) |
| 2.5 | 12.3 | GO:0042360 | vitamin E metabolic process(GO:0042360) |
| 2.5 | 9.8 | GO:0034627 | nicotinamide nucleotide biosynthetic process from aspartate(GO:0019355) 'de novo' NAD biosynthetic process(GO:0034627) 'de novo' NAD biosynthetic process from aspartate(GO:0034628) |
| 2.4 | 12.2 | GO:0006041 | glucosamine metabolic process(GO:0006041) |
| 2.4 | 26.9 | GO:0006032 | chitin metabolic process(GO:0006030) chitin catabolic process(GO:0006032) |
| 2.4 | 7.3 | GO:0045591 | positive regulation of regulatory T cell differentiation(GO:0045591) |
| 2.4 | 14.6 | GO:0070829 | response to vitamin B2(GO:0033274) heterochromatin maintenance(GO:0070829) |
| 2.4 | 4.9 | GO:0014835 | myoblast differentiation involved in skeletal muscle regeneration(GO:0014835) |
| 2.4 | 14.6 | GO:0060770 | negative regulation of epithelial cell proliferation involved in prostate gland development(GO:0060770) |
| 2.4 | 4.8 | GO:0050720 | interleukin-1 beta biosynthetic process(GO:0050720) |
| 2.4 | 2.4 | GO:2000334 | blood microparticle formation(GO:0072564) regulation of blood microparticle formation(GO:2000332) positive regulation of blood microparticle formation(GO:2000334) |
| 2.4 | 7.2 | GO:0098758 | response to interleukin-8(GO:0098758) cellular response to interleukin-8(GO:0098759) |
| 2.4 | 19.1 | GO:2001199 | negative regulation of dendritic cell differentiation(GO:2001199) |
| 2.4 | 9.5 | GO:0099558 | maintenance of synapse structure(GO:0099558) |
| 2.4 | 9.5 | GO:0010897 | negative regulation of triglyceride catabolic process(GO:0010897) |
| 2.4 | 14.2 | GO:0051121 | hepoxilin metabolic process(GO:0051121) hepoxilin biosynthetic process(GO:0051122) |
| 2.4 | 26.0 | GO:0043152 | induction of bacterial agglutination(GO:0043152) |
| 2.4 | 7.1 | GO:0018002 | N-terminal peptidyl-serine acetylation(GO:0017198) N-terminal peptidyl-glutamic acid acetylation(GO:0018002) peptidyl-serine acetylation(GO:0030920) |
| 2.3 | 9.4 | GO:0033693 | neurofilament bundle assembly(GO:0033693) |
| 2.3 | 9.4 | GO:0032489 | regulation of Cdc42 protein signal transduction(GO:0032489) |
| 2.3 | 9.4 | GO:0032430 | positive regulation of phospholipase A2 activity(GO:0032430) |
| 2.3 | 9.4 | GO:1902023 | L-arginine import(GO:0043091) arginine import(GO:0090467) L-arginine transport(GO:1902023) |
| 2.3 | 11.6 | GO:0006001 | fructose catabolic process(GO:0006001) fructose catabolic process to hydroxyacetone phosphate and glyceraldehyde-3-phosphate(GO:0061624) |
| 2.3 | 14.0 | GO:0002784 | positive regulation of antimicrobial peptide production(GO:0002225) positive regulation of antimicrobial humoral response(GO:0002760) regulation of antimicrobial peptide production(GO:0002784) regulation of antibacterial peptide production(GO:0002786) positive regulation of antibacterial peptide production(GO:0002803) |
| 2.3 | 7.0 | GO:0002933 | lipid hydroxylation(GO:0002933) |
| 2.3 | 13.9 | GO:1902261 | positive regulation of delayed rectifier potassium channel activity(GO:1902261) |
| 2.3 | 2.3 | GO:0002693 | positive regulation of cellular extravasation(GO:0002693) |
| 2.3 | 4.6 | GO:0006210 | pyrimidine nucleobase catabolic process(GO:0006208) thymine catabolic process(GO:0006210) thymine metabolic process(GO:0019859) nucleobase catabolic process(GO:0046113) |
| 2.3 | 4.6 | GO:0071221 | response to bacterial lipoprotein(GO:0032493) response to bacterial lipopeptide(GO:0070339) cellular response to bacterial lipoprotein(GO:0071220) cellular response to bacterial lipopeptide(GO:0071221) |
| 2.3 | 6.8 | GO:0007538 | primary sex determination(GO:0007538) |
| 2.3 | 6.8 | GO:1904491 | protein localization to ciliary transition zone(GO:1904491) |
| 2.3 | 2.3 | GO:1903978 | regulation of microglial cell activation(GO:1903978) |
| 2.3 | 6.8 | GO:0070508 | sterol import(GO:0035376) cholesterol import(GO:0070508) |
| 2.3 | 9.1 | GO:0060940 | epithelial to mesenchymal transition involved in cardiac fibroblast development(GO:0060940) |
| 2.3 | 2.3 | GO:0032621 | interleukin-18 production(GO:0032621) regulation of interleukin-18 production(GO:0032661) |
| 2.3 | 72.3 | GO:0015695 | organic cation transport(GO:0015695) |
| 2.2 | 4.5 | GO:0044828 | negative regulation by host of viral genome replication(GO:0044828) |
| 2.2 | 13.5 | GO:0016554 | cytidine to uridine editing(GO:0016554) |
| 2.2 | 8.9 | GO:0010572 | positive regulation of platelet activation(GO:0010572) |
| 2.2 | 4.4 | GO:0007016 | cytoskeletal anchoring at plasma membrane(GO:0007016) |
| 2.2 | 17.7 | GO:0033087 | negative regulation of immature T cell proliferation(GO:0033087) negative regulation of immature T cell proliferation in thymus(GO:0033088) |
| 2.2 | 13.3 | GO:0018095 | protein polyglutamylation(GO:0018095) |
| 2.2 | 15.4 | GO:0038172 | interleukin-33-mediated signaling pathway(GO:0038172) |
| 2.2 | 4.4 | GO:0001897 | cytolysis by symbiont of host cells(GO:0001897) hemolysis by symbiont of host erythrocytes(GO:0019836) hemolysis in other organism(GO:0044179) hemolysis in other organism involved in symbiotic interaction(GO:0052331) |
| 2.2 | 13.2 | GO:0032571 | response to vitamin K(GO:0032571) |
| 2.2 | 10.9 | GO:1900017 | positive regulation of cytokine production involved in inflammatory response(GO:1900017) |
| 2.2 | 13.0 | GO:0031999 | negative regulation of fatty acid beta-oxidation(GO:0031999) |
| 2.2 | 15.1 | GO:0070212 | protein poly-ADP-ribosylation(GO:0070212) |
| 2.1 | 6.4 | GO:0034241 | macrophage fusion(GO:0034238) regulation of macrophage fusion(GO:0034239) positive regulation of macrophage fusion(GO:0034241) multinuclear osteoclast differentiation(GO:0072674) osteoclast fusion(GO:0072675) |
| 2.1 | 6.4 | GO:0010847 | regulation of chromatin assembly(GO:0010847) |
| 2.1 | 10.7 | GO:1900245 | positive regulation of MDA-5 signaling pathway(GO:1900245) |
| 2.1 | 10.6 | GO:0090131 | mesenchyme migration(GO:0090131) |
| 2.1 | 10.6 | GO:0018352 | protein-pyridoxal-5-phosphate linkage(GO:0018352) |
| 2.1 | 6.4 | GO:0038156 | interleukin-3-mediated signaling pathway(GO:0038156) |
| 2.1 | 21.2 | GO:0043031 | negative regulation of macrophage activation(GO:0043031) |
| 2.1 | 2.1 | GO:1900104 | hyaluranon cable assembly(GO:0036118) regulation of hyaluranon cable assembly(GO:1900104) positive regulation of hyaluranon cable assembly(GO:1900106) |
| 2.1 | 36.0 | GO:0007130 | synaptonemal complex assembly(GO:0007130) |
| 2.1 | 8.4 | GO:0002778 | antimicrobial peptide production(GO:0002775) antibacterial peptide production(GO:0002778) |
| 2.1 | 8.4 | GO:0006562 | proline catabolic process(GO:0006562) |
| 2.1 | 25.1 | GO:0035845 | photoreceptor cell outer segment organization(GO:0035845) |
| 2.1 | 2.1 | GO:0046271 | phenylpropanoid catabolic process(GO:0046271) |
| 2.1 | 112.1 | GO:0015701 | bicarbonate transport(GO:0015701) |
| 2.1 | 6.2 | GO:2000661 | positive regulation of interleukin-1-mediated signaling pathway(GO:2000661) |
| 2.1 | 28.9 | GO:0003351 | epithelial cilium movement(GO:0003351) |
| 2.1 | 24.7 | GO:0060371 | regulation of atrial cardiac muscle cell membrane depolarization(GO:0060371) |
| 2.1 | 10.3 | GO:0051725 | protein de-ADP-ribosylation(GO:0051725) |
| 2.0 | 2.0 | GO:0071603 | endothelial cell-cell adhesion(GO:0071603) |
| 2.0 | 2.0 | GO:0046351 | disaccharide biosynthetic process(GO:0046351) |
| 2.0 | 16.2 | GO:0007598 | blood coagulation, extrinsic pathway(GO:0007598) |
| 2.0 | 8.1 | GO:0045409 | negative regulation of interleukin-6 biosynthetic process(GO:0045409) |
| 2.0 | 10.0 | GO:2000857 | positive regulation of mineralocorticoid secretion(GO:2000857) positive regulation of aldosterone secretion(GO:2000860) |
| 2.0 | 8.0 | GO:0018199 | peptidyl-glutamine modification(GO:0018199) |
| 2.0 | 12.0 | GO:0060282 | positive regulation of oocyte development(GO:0060282) |
| 2.0 | 8.0 | GO:0034441 | plasma lipoprotein particle oxidation(GO:0034441) |
| 2.0 | 10.0 | GO:0001992 | regulation of systemic arterial blood pressure by vasopressin(GO:0001992) |
| 2.0 | 6.0 | GO:1901624 | negative regulation of lymphocyte chemotaxis(GO:1901624) |
| 2.0 | 6.0 | GO:0001207 | histone displacement(GO:0001207) positive regulation of transcription involved in meiotic cell cycle(GO:0051039) |
| 2.0 | 7.9 | GO:0070945 | neutrophil mediated killing of gram-negative bacterium(GO:0070945) |
| 2.0 | 35.6 | GO:0010744 | positive regulation of macrophage derived foam cell differentiation(GO:0010744) |
| 2.0 | 11.8 | GO:0014062 | regulation of serotonin secretion(GO:0014062) |
| 2.0 | 5.9 | GO:1900169 | regulation of glucocorticoid mediated signaling pathway(GO:1900169) |
| 2.0 | 5.9 | GO:0003051 | angiotensin-mediated drinking behavior(GO:0003051) |
| 2.0 | 5.9 | GO:0015798 | myo-inositol transport(GO:0015798) |
| 1.9 | 1.9 | GO:0045763 | negative regulation of cellular amino acid metabolic process(GO:0045763) |
| 1.9 | 7.7 | GO:0009233 | menaquinone metabolic process(GO:0009233) |
| 1.9 | 3.8 | GO:0045356 | positive regulation of interferon-alpha biosynthetic process(GO:0045356) |
| 1.9 | 7.6 | GO:0051138 | regulation of NK T cell differentiation(GO:0051136) positive regulation of NK T cell differentiation(GO:0051138) |
| 1.9 | 5.7 | GO:0098507 | polynucleotide 5' dephosphorylation(GO:0098507) |
| 1.9 | 5.7 | GO:0030240 | skeletal muscle thin filament assembly(GO:0030240) |
| 1.9 | 3.8 | GO:0060164 | regulation of timing of neuron differentiation(GO:0060164) |
| 1.9 | 7.6 | GO:0019086 | late viral transcription(GO:0019086) |
| 1.9 | 11.4 | GO:1900736 | regulation of phospholipase C-activating G-protein coupled receptor signaling pathway(GO:1900736) |
| 1.9 | 3.8 | GO:0060003 | copper ion export(GO:0060003) |
| 1.9 | 5.7 | GO:0002538 | arachidonic acid metabolite production involved in inflammatory response(GO:0002538) leukotriene production involved in inflammatory response(GO:0002540) |
| 1.9 | 5.7 | GO:0072023 | thick ascending limb development(GO:0072023) metanephric thick ascending limb development(GO:0072233) |
| 1.9 | 9.4 | GO:0009624 | response to nematode(GO:0009624) |
| 1.9 | 20.7 | GO:0097688 | AMPA glutamate receptor clustering(GO:0097113) glutamate receptor clustering(GO:0097688) |
| 1.9 | 9.4 | GO:1903385 | regulation of homophilic cell adhesion(GO:1903385) |
| 1.9 | 7.5 | GO:0035054 | embryonic heart tube anterior/posterior pattern specification(GO:0035054) |
| 1.9 | 3.7 | GO:2000569 | T-helper 2 cell activation(GO:0035712) regulation of T-helper 2 cell activation(GO:2000569) positive regulation of T-helper 2 cell activation(GO:2000570) |
| 1.9 | 1.9 | GO:1902159 | regulation of cyclic nucleotide-gated ion channel activity(GO:1902159) |
| 1.9 | 46.3 | GO:0001580 | detection of chemical stimulus involved in sensory perception of bitter taste(GO:0001580) |
| 1.9 | 3.7 | GO:0097325 | melanocyte proliferation(GO:0097325) |
| 1.8 | 5.5 | GO:0021913 | regulation of transcription from RNA polymerase II promoter involved in ventral spinal cord interneuron specification(GO:0021913) |
| 1.8 | 7.4 | GO:0003330 | regulation of extracellular matrix constituent secretion(GO:0003330) positive regulation of extracellular matrix constituent secretion(GO:0003331) |
| 1.8 | 3.7 | GO:0042137 | sequestering of neurotransmitter(GO:0042137) |
| 1.8 | 14.6 | GO:2000427 | positive regulation of apoptotic cell clearance(GO:2000427) |
| 1.8 | 14.6 | GO:2000318 | positive regulation of T-helper 17 type immune response(GO:2000318) |
| 1.8 | 21.9 | GO:0001867 | complement activation, lectin pathway(GO:0001867) |
| 1.8 | 10.9 | GO:0008354 | germ cell migration(GO:0008354) |
| 1.8 | 9.1 | GO:0010890 | positive regulation of sequestering of triglyceride(GO:0010890) |
| 1.8 | 5.4 | GO:0021965 | spinal cord ventral commissure morphogenesis(GO:0021965) |
| 1.8 | 21.6 | GO:0021979 | hypothalamus cell differentiation(GO:0021979) |
| 1.8 | 5.4 | GO:0035672 | oligopeptide transmembrane transport(GO:0035672) |
| 1.8 | 1.8 | GO:0071947 | protein deubiquitination involved in ubiquitin-dependent protein catabolic process(GO:0071947) |
| 1.8 | 5.4 | GO:1990504 | dense core granule exocytosis(GO:1990504) |
| 1.8 | 1.8 | GO:1903348 | positive regulation of bicellular tight junction assembly(GO:1903348) |
| 1.8 | 5.3 | GO:0002584 | negative regulation of antigen processing and presentation of peptide antigen(GO:0002584) |
| 1.8 | 1.8 | GO:0061092 | regulation of phospholipid translocation(GO:0061091) positive regulation of phospholipid translocation(GO:0061092) |
| 1.8 | 7.0 | GO:0050910 | detection of mechanical stimulus involved in sensory perception of sound(GO:0050910) |
| 1.8 | 5.3 | GO:2001183 | negative regulation of interleukin-12 secretion(GO:2001183) |
| 1.8 | 3.5 | GO:0001865 | NK T cell differentiation(GO:0001865) |
| 1.7 | 5.2 | GO:0006421 | asparaginyl-tRNA aminoacylation(GO:0006421) |
| 1.7 | 3.5 | GO:0021555 | midbrain-hindbrain boundary morphogenesis(GO:0021555) |
| 1.7 | 8.7 | GO:1990164 | histone H2A phosphorylation(GO:1990164) |
| 1.7 | 12.2 | GO:0015811 | L-cystine transport(GO:0015811) |
| 1.7 | 1.7 | GO:0071361 | cellular response to ethanol(GO:0071361) |
| 1.7 | 31.1 | GO:0097186 | amelogenesis(GO:0097186) |
| 1.7 | 15.5 | GO:0044800 | fusion of virus membrane with host plasma membrane(GO:0019064) membrane fusion involved in viral entry into host cell(GO:0039663) multi-organism membrane fusion(GO:0044800) |
| 1.7 | 5.2 | GO:0038193 | thromboxane A2 signaling pathway(GO:0038193) |
| 1.7 | 15.5 | GO:0032119 | sequestering of zinc ion(GO:0032119) |
| 1.7 | 13.7 | GO:0001661 | conditioned taste aversion(GO:0001661) |
| 1.7 | 6.8 | GO:2001023 | regulation of response to drug(GO:2001023) |
| 1.7 | 5.1 | GO:1901339 | regulation of store-operated calcium channel activity(GO:1901339) |
| 1.7 | 10.2 | GO:0035524 | proline transmembrane transport(GO:0035524) |
| 1.7 | 5.1 | GO:0060474 | positive regulation of sperm motility involved in capacitation(GO:0060474) |
| 1.7 | 1.7 | GO:0032455 | nerve growth factor processing(GO:0032455) |
| 1.7 | 6.8 | GO:0051918 | negative regulation of fibrinolysis(GO:0051918) |
| 1.7 | 3.4 | GO:0002876 | positive regulation of chronic inflammatory response to antigenic stimulus(GO:0002876) |
| 1.7 | 8.4 | GO:0045872 | positive regulation of rhodopsin gene expression(GO:0045872) |
| 1.7 | 11.7 | GO:0015747 | urate transport(GO:0015747) |
| 1.7 | 6.7 | GO:1904799 | negative regulation of dendrite extension(GO:1903860) regulation of neuron remodeling(GO:1904799) negative regulation of neuron remodeling(GO:1904800) negative regulation of branching morphogenesis of a nerve(GO:2000173) |
| 1.7 | 56.2 | GO:0018149 | peptide cross-linking(GO:0018149) |
| 1.7 | 21.5 | GO:1902018 | negative regulation of cilium assembly(GO:1902018) |
| 1.6 | 13.2 | GO:0031284 | positive regulation of guanylate cyclase activity(GO:0031284) |
| 1.6 | 9.9 | GO:0021891 | olfactory bulb interneuron development(GO:0021891) |
| 1.6 | 24.6 | GO:2001224 | positive regulation of neuron migration(GO:2001224) |
| 1.6 | 3.3 | GO:0003341 | cilium movement(GO:0003341) |
| 1.6 | 21.3 | GO:0018342 | protein prenylation(GO:0018342) prenylation(GO:0097354) |
| 1.6 | 8.2 | GO:0038161 | prolactin signaling pathway(GO:0038161) |
| 1.6 | 1.6 | GO:0070093 | negative regulation of glucagon secretion(GO:0070093) |
| 1.6 | 13.0 | GO:0006776 | vitamin A metabolic process(GO:0006776) |
| 1.6 | 14.5 | GO:0032364 | oxygen homeostasis(GO:0032364) |
| 1.6 | 4.8 | GO:0001978 | regulation of systemic arterial blood pressure by carotid sinus baroreceptor feedback(GO:0001978) baroreceptor response to increased systemic arterial blood pressure(GO:0001983) |
| 1.6 | 4.8 | GO:0015842 | aminergic neurotransmitter loading into synaptic vesicle(GO:0015842) |
| 1.6 | 12.9 | GO:0036158 | outer dynein arm assembly(GO:0036158) |
| 1.6 | 8.0 | GO:0046013 | regulation of T cell homeostatic proliferation(GO:0046013) |
| 1.6 | 24.1 | GO:0060044 | negative regulation of cardiac muscle cell proliferation(GO:0060044) |
| 1.6 | 6.4 | GO:0005986 | sucrose biosynthetic process(GO:0005986) |
| 1.6 | 24.0 | GO:0030277 | maintenance of gastrointestinal epithelium(GO:0030277) |
| 1.6 | 1.6 | GO:0046878 | positive regulation of saliva secretion(GO:0046878) |
| 1.6 | 7.9 | GO:0010966 | regulation of phosphate transport(GO:0010966) |
| 1.6 | 4.8 | GO:1902630 | regulation of membrane hyperpolarization(GO:1902630) |
| 1.6 | 7.9 | GO:0035585 | calcium-mediated signaling using extracellular calcium source(GO:0035585) |
| 1.6 | 44.3 | GO:0035428 | hexose transmembrane transport(GO:0035428) glucose transmembrane transport(GO:1904659) |
| 1.6 | 4.7 | GO:0046322 | negative regulation of fatty acid oxidation(GO:0046322) |
| 1.6 | 22.1 | GO:0048172 | regulation of short-term neuronal synaptic plasticity(GO:0048172) |
| 1.6 | 4.7 | GO:0097029 | mature conventional dendritic cell differentiation(GO:0097029) |
| 1.6 | 4.7 | GO:0072138 | mesenchymal cell proliferation involved in ureteric bud development(GO:0072138) |
| 1.6 | 10.9 | GO:0042118 | endothelial cell activation(GO:0042118) |
| 1.6 | 7.8 | GO:0060830 | ciliary receptor clustering involved in smoothened signaling pathway(GO:0060830) |
| 1.6 | 4.7 | GO:0018874 | benzoate metabolic process(GO:0018874) butyrate metabolic process(GO:0019605) |
| 1.6 | 6.2 | GO:2000253 | positive regulation of feeding behavior(GO:2000253) |
| 1.5 | 3.1 | GO:0030806 | negative regulation of cyclic nucleotide catabolic process(GO:0030806) negative regulation of cAMP catabolic process(GO:0030821) |
| 1.5 | 7.7 | GO:0010816 | substance P catabolic process(GO:0010814) calcitonin catabolic process(GO:0010816) endothelin maturation(GO:0034959) |
| 1.5 | 1.5 | GO:0050653 | chondroitin sulfate proteoglycan biosynthetic process, polysaccharide chain biosynthetic process(GO:0050653) |
| 1.5 | 15.4 | GO:0072540 | T-helper 17 cell lineage commitment(GO:0072540) |
| 1.5 | 13.8 | GO:0034638 | phosphatidylcholine catabolic process(GO:0034638) |
| 1.5 | 4.6 | GO:0000350 | generation of catalytic spliceosome for second transesterification step(GO:0000350) |
| 1.5 | 6.1 | GO:0086068 | Purkinje myocyte to ventricular cardiac muscle cell signaling(GO:0086029) Purkinje myocyte to ventricular cardiac muscle cell communication(GO:0086068) |
| 1.5 | 15.2 | GO:0050962 | detection of light stimulus involved in visual perception(GO:0050908) detection of light stimulus involved in sensory perception(GO:0050962) |
| 1.5 | 7.6 | GO:2000467 | positive regulation of glycogen (starch) synthase activity(GO:2000467) |
| 1.5 | 9.1 | GO:0007288 | sperm axoneme assembly(GO:0007288) |
| 1.5 | 6.0 | GO:0051610 | negative regulation of neurotransmitter uptake(GO:0051581) serotonin uptake(GO:0051610) regulation of serotonin uptake(GO:0051611) negative regulation of serotonin uptake(GO:0051612) |
| 1.5 | 40.8 | GO:0071420 | cellular response to histamine(GO:0071420) |
| 1.5 | 4.5 | GO:0044256 | angiotensin catabolic process in blood(GO:0002005) multicellular organismal protein catabolic process(GO:0044254) protein digestion(GO:0044256) multicellular organismal macromolecule catabolic process(GO:0044266) |
| 1.5 | 21.1 | GO:0019731 | antibacterial humoral response(GO:0019731) |
| 1.5 | 6.0 | GO:0080154 | regulation of fertilization(GO:0080154) |
| 1.5 | 4.5 | GO:0042713 | sperm ejaculation(GO:0042713) |
| 1.5 | 1.5 | GO:0035610 | protein side chain deglutamylation(GO:0035610) |
| 1.5 | 4.5 | GO:0060032 | notochord regression(GO:0060032) |
| 1.5 | 4.5 | GO:0021798 | forebrain dorsal/ventral pattern formation(GO:0021798) |
| 1.5 | 3.0 | GO:1900239 | phenotypic switching(GO:0036166) regulation of phenotypic switching(GO:1900239) |
| 1.5 | 32.5 | GO:0090036 | regulation of protein kinase C signaling(GO:0090036) |
| 1.5 | 13.3 | GO:0043950 | positive regulation of cAMP-mediated signaling(GO:0043950) |
| 1.5 | 46.9 | GO:0050829 | defense response to Gram-negative bacterium(GO:0050829) |
| 1.5 | 7.3 | GO:0045348 | positive regulation of MHC class II biosynthetic process(GO:0045348) |
| 1.5 | 4.4 | GO:0042412 | taurine biosynthetic process(GO:0042412) |
| 1.5 | 7.3 | GO:0007320 | insemination(GO:0007320) |
| 1.5 | 13.1 | GO:0098535 | de novo centriole assembly(GO:0098535) |
| 1.4 | 2.9 | GO:1904844 | response to L-glutamine(GO:1904844) cellular response to L-glutamine(GO:1904845) |
| 1.4 | 7.2 | GO:1903960 | negative regulation of anion transmembrane transport(GO:1903960) |
| 1.4 | 2.9 | GO:0042311 | vasodilation(GO:0042311) |
| 1.4 | 10.1 | GO:0035609 | C-terminal protein deglutamylation(GO:0035609) |
| 1.4 | 8.6 | GO:0050955 | thermoception(GO:0050955) |
| 1.4 | 13.0 | GO:0046104 | thymidine metabolic process(GO:0046104) pyrimidine deoxyribonucleoside metabolic process(GO:0046125) |
| 1.4 | 15.8 | GO:1990573 | potassium ion import across plasma membrane(GO:1990573) |
| 1.4 | 2.9 | GO:1902093 | positive regulation of sperm motility(GO:1902093) |
| 1.4 | 1.4 | GO:0003408 | optic cup formation involved in camera-type eye development(GO:0003408) |
| 1.4 | 2.9 | GO:0090182 | regulation of secretion of lysosomal enzymes(GO:0090182) |
| 1.4 | 2.9 | GO:0071494 | cellular response to UV-C(GO:0071494) |
| 1.4 | 24.3 | GO:0001542 | ovulation from ovarian follicle(GO:0001542) |
| 1.4 | 2.8 | GO:0071351 | interleukin-18-mediated signaling pathway(GO:0035655) cellular response to interleukin-18(GO:0071351) |
| 1.4 | 4.3 | GO:2000297 | negative regulation of synapse maturation(GO:2000297) |
| 1.4 | 1.4 | GO:0021529 | spinal cord oligodendrocyte cell differentiation(GO:0021529) spinal cord oligodendrocyte cell fate specification(GO:0021530) oligodendrocyte cell fate specification(GO:0021778) oligodendrocyte cell fate commitment(GO:0021779) glial cell fate specification(GO:0021780) |
| 1.4 | 5.6 | GO:1900827 | maintenance of protein location in membrane(GO:0072658) maintenance of protein location in plasma membrane(GO:0072660) positive regulation of membrane depolarization during cardiac muscle cell action potential(GO:1900827) |
| 1.4 | 18.3 | GO:0043046 | DNA methylation involved in gamete generation(GO:0043046) |
| 1.4 | 1.4 | GO:0061056 | sclerotome development(GO:0061056) |
| 1.4 | 4.2 | GO:0009386 | translational attenuation(GO:0009386) |
| 1.4 | 8.4 | GO:1901317 | regulation of sperm motility(GO:1901317) negative regulation of sperm motility(GO:1901318) |
| 1.4 | 4.2 | GO:0002865 | negative regulation of acute inflammatory response to antigenic stimulus(GO:0002865) |
| 1.4 | 8.4 | GO:0071105 | response to interleukin-11(GO:0071105) |
| 1.4 | 7.0 | GO:0070127 | tRNA aminoacylation for mitochondrial protein translation(GO:0070127) |
| 1.4 | 22.3 | GO:0001660 | fever generation(GO:0001660) |
| 1.4 | 2.8 | GO:0002018 | renin-angiotensin regulation of aldosterone production(GO:0002018) |
| 1.4 | 2.8 | GO:0045715 | negative regulation of low-density lipoprotein particle receptor biosynthetic process(GO:0045715) |
| 1.4 | 11.1 | GO:0070236 | regulation of activation-induced cell death of T cells(GO:0070235) negative regulation of activation-induced cell death of T cells(GO:0070236) |
| 1.4 | 1.4 | GO:0008078 | mesodermal cell migration(GO:0008078) |
| 1.4 | 15.3 | GO:0048251 | elastic fiber assembly(GO:0048251) |
| 1.4 | 11.0 | GO:0000480 | endonucleolytic cleavage in 5'-ETS of tricistronic rRNA transcript (SSU-rRNA, 5.8S rRNA, LSU-rRNA)(GO:0000480) |
| 1.4 | 2.8 | GO:0046959 | habituation(GO:0046959) |
| 1.4 | 5.5 | GO:0051462 | cortisol secretion(GO:0043400) regulation of cortisol secretion(GO:0051462) |
| 1.4 | 4.1 | GO:0061713 | neural crest cell migration involved in heart formation(GO:0003147) cell migration involved in heart formation(GO:0060974) anterior neural tube closure(GO:0061713) |
| 1.4 | 9.5 | GO:0043201 | response to leucine(GO:0043201) |
| 1.4 | 4.1 | GO:0060708 | spongiotrophoblast differentiation(GO:0060708) |
| 1.4 | 4.1 | GO:0060040 | retinal bipolar neuron differentiation(GO:0060040) |
| 1.4 | 23.0 | GO:0090361 | platelet-derived growth factor production(GO:0090360) regulation of platelet-derived growth factor production(GO:0090361) |
| 1.4 | 4.1 | GO:2000348 | regulation of CD40 signaling pathway(GO:2000348) |
| 1.4 | 4.1 | GO:1903487 | regulation of lactation(GO:1903487) |
| 1.4 | 10.8 | GO:0051414 | response to cortisol(GO:0051414) |
| 1.4 | 4.1 | GO:0035691 | macrophage migration inhibitory factor signaling pathway(GO:0035691) |
| 1.3 | 8.1 | GO:1903232 | melanosome assembly(GO:1903232) |
| 1.3 | 2.7 | GO:0034128 | negative regulation of MyD88-independent toll-like receptor signaling pathway(GO:0034128) |
| 1.3 | 1.3 | GO:0033700 | phospholipid efflux(GO:0033700) |
| 1.3 | 4.0 | GO:0048633 | positive regulation of skeletal muscle tissue growth(GO:0048633) |
| 1.3 | 16.1 | GO:0098719 | sodium ion import across plasma membrane(GO:0098719) sodium ion import into cell(GO:1990118) |
| 1.3 | 5.4 | GO:0060054 | positive regulation of epithelial cell proliferation involved in wound healing(GO:0060054) |
| 1.3 | 1.3 | GO:0070673 | response to interleukin-18(GO:0070673) |
| 1.3 | 5.4 | GO:0060029 | convergent extension involved in organogenesis(GO:0060029) |
| 1.3 | 5.3 | GO:2000773 | negative regulation of cellular senescence(GO:2000773) |
| 1.3 | 58.7 | GO:0048791 | calcium ion-regulated exocytosis of neurotransmitter(GO:0048791) |
| 1.3 | 24.0 | GO:0099517 | anterograde synaptic vesicle transport(GO:0048490) synaptic vesicle cytoskeletal transport(GO:0099514) synaptic vesicle transport along microtubule(GO:0099517) |
| 1.3 | 4.0 | GO:0060398 | regulation of growth hormone receptor signaling pathway(GO:0060398) |
| 1.3 | 4.0 | GO:0043012 | regulation of fusion of sperm to egg plasma membrane(GO:0043012) |
| 1.3 | 1.3 | GO:0044240 | multicellular organism lipid catabolic process(GO:0044240) |
| 1.3 | 1.3 | GO:0032423 | regulation of mismatch repair(GO:0032423) positive regulation of mismatch repair(GO:0032425) |
| 1.3 | 1.3 | GO:0072276 | metanephric glomerulus morphogenesis(GO:0072275) metanephric glomerulus vasculature morphogenesis(GO:0072276) metanephric glomerular capillary formation(GO:0072277) |
| 1.3 | 4.0 | GO:0032914 | positive regulation of transforming growth factor beta1 production(GO:0032914) |
| 1.3 | 4.0 | GO:0001767 | establishment of lymphocyte polarity(GO:0001767) |
| 1.3 | 2.6 | GO:0060017 | parathyroid gland development(GO:0060017) |
| 1.3 | 2.6 | GO:2000400 | positive regulation of T cell differentiation in thymus(GO:0033089) positive regulation of thymocyte aggregation(GO:2000400) |
| 1.3 | 9.2 | GO:0045007 | depurination(GO:0045007) |
| 1.3 | 4.0 | GO:0060022 | hard palate development(GO:0060022) |
| 1.3 | 9.2 | GO:0030321 | transepithelial chloride transport(GO:0030321) |
| 1.3 | 5.3 | GO:0036101 | leukotriene catabolic process(GO:0036100) leukotriene B4 catabolic process(GO:0036101) leukotriene B4 metabolic process(GO:0036102) icosanoid catabolic process(GO:1901523) fatty acid derivative catabolic process(GO:1901569) |
| 1.3 | 6.6 | GO:0003376 | sphingosine-1-phosphate signaling pathway(GO:0003376) |
| 1.3 | 1.3 | GO:0019376 | galactolipid catabolic process(GO:0019376) |
| 1.3 | 5.2 | GO:0016127 | cholesterol catabolic process(GO:0006707) sterol catabolic process(GO:0016127) |
| 1.3 | 1.3 | GO:2001033 | negative regulation of double-strand break repair via nonhomologous end joining(GO:2001033) |
| 1.3 | 15.6 | GO:0006570 | tyrosine metabolic process(GO:0006570) |
| 1.3 | 1.3 | GO:1901420 | negative regulation of response to alcohol(GO:1901420) |
| 1.3 | 3.9 | GO:0035881 | amacrine cell differentiation(GO:0035881) |
| 1.3 | 5.2 | GO:1990502 | dense core granule maturation(GO:1990502) |
| 1.3 | 1.3 | GO:0000393 | spliceosomal conformational changes to generate catalytic conformation(GO:0000393) |
| 1.3 | 6.4 | GO:0019323 | pentose catabolic process(GO:0019323) |
| 1.3 | 2.6 | GO:0035992 | tendon cell differentiation(GO:0035990) tendon formation(GO:0035992) |
| 1.3 | 3.8 | GO:1990426 | homologous recombination-dependent replication fork processing(GO:1990426) |
| 1.3 | 11.5 | GO:0060012 | synaptic transmission, glycinergic(GO:0060012) |
| 1.3 | 2.5 | GO:0035385 | Roundabout signaling pathway(GO:0035385) |
| 1.3 | 7.6 | GO:0097396 | response to interleukin-17(GO:0097396) cellular response to interleukin-17(GO:0097398) |
| 1.3 | 3.8 | GO:0045110 | intermediate filament bundle assembly(GO:0045110) |
| 1.3 | 10.2 | GO:1904896 | ESCRT complex disassembly(GO:1904896) ESCRT III complex disassembly(GO:1904903) |
| 1.3 | 5.1 | GO:1990253 | cellular response to leucine starvation(GO:1990253) |
| 1.3 | 3.8 | GO:1901165 | positive regulation of trophoblast cell migration(GO:1901165) |
| 1.3 | 2.5 | GO:1903288 | positive regulation of potassium ion import(GO:1903288) |
| 1.3 | 1.3 | GO:0090076 | relaxation of skeletal muscle(GO:0090076) |
| 1.3 | 7.5 | GO:0061436 | establishment of skin barrier(GO:0061436) |
| 1.3 | 3.8 | GO:0045836 | positive regulation of meiotic nuclear division(GO:0045836) |
| 1.2 | 6.2 | GO:0010826 | negative regulation of centrosome duplication(GO:0010826) negative regulation of centrosome cycle(GO:0046606) |
| 1.2 | 3.7 | GO:0030207 | chondroitin sulfate catabolic process(GO:0030207) |
| 1.2 | 10.0 | GO:1903010 | regulation of bone development(GO:1903010) |
| 1.2 | 19.9 | GO:0071285 | cellular response to lithium ion(GO:0071285) |
| 1.2 | 3.7 | GO:0048691 | modulation by virus of host transcription(GO:0019056) positive regulation of sprouting of injured axon(GO:0048687) positive regulation of axon extension involved in regeneration(GO:0048691) modulation by symbiont of host transcription(GO:0052026) |
| 1.2 | 1.2 | GO:1903336 | negative regulation of vacuolar transport(GO:1903336) |
| 1.2 | 2.5 | GO:0038162 | erythropoietin-mediated signaling pathway(GO:0038162) |
| 1.2 | 11.1 | GO:0042428 | serotonin metabolic process(GO:0042428) |
| 1.2 | 1.2 | GO:1903413 | cellular response to bile acid(GO:1903413) |
| 1.2 | 11.0 | GO:0099566 | regulation of postsynaptic cytosolic calcium ion concentration(GO:0099566) |
| 1.2 | 1.2 | GO:0002025 | vasodilation by norepinephrine-epinephrine involved in regulation of systemic arterial blood pressure(GO:0002025) |
| 1.2 | 3.7 | GO:0001955 | blood vessel maturation(GO:0001955) |
| 1.2 | 4.9 | GO:0031443 | fast-twitch skeletal muscle fiber contraction(GO:0031443) |
| 1.2 | 4.9 | GO:1903936 | response to sodium arsenite(GO:1903935) cellular response to sodium arsenite(GO:1903936) |
| 1.2 | 1.2 | GO:0019254 | carnitine metabolic process, CoA-linked(GO:0019254) |
| 1.2 | 2.4 | GO:0086100 | endothelin receptor signaling pathway(GO:0086100) |
| 1.2 | 3.6 | GO:0002416 | IgG immunoglobulin transcytosis in epithelial cells mediated by FcRn immunoglobulin receptor(GO:0002416) |
| 1.2 | 4.8 | GO:0006651 | diacylglycerol biosynthetic process(GO:0006651) |
| 1.2 | 3.6 | GO:0006940 | regulation of smooth muscle contraction(GO:0006940) |
| 1.2 | 7.2 | GO:0010248 | establishment or maintenance of transmembrane electrochemical gradient(GO:0010248) |
| 1.2 | 16.8 | GO:0048096 | chromatin-mediated maintenance of transcription(GO:0048096) |
| 1.2 | 1.2 | GO:0039020 | pronephric nephron tubule development(GO:0039020) |
| 1.2 | 4.8 | GO:0045829 | negative regulation of isotype switching(GO:0045829) |
| 1.2 | 3.6 | GO:0002578 | negative regulation of antigen processing and presentation(GO:0002578) |
| 1.2 | 4.8 | GO:0015791 | polyol transport(GO:0015791) |
| 1.2 | 2.4 | GO:0006004 | fucose metabolic process(GO:0006004) |
| 1.2 | 1.2 | GO:0045085 | negative regulation of interleukin-2 biosynthetic process(GO:0045085) |
| 1.2 | 2.4 | GO:0072249 | metanephric glomerular epithelium development(GO:0072244) metanephric glomerular visceral epithelial cell differentiation(GO:0072248) metanephric glomerular visceral epithelial cell development(GO:0072249) metanephric glomerular epithelial cell differentiation(GO:0072312) metanephric glomerular epithelial cell development(GO:0072313) |
| 1.2 | 10.7 | GO:0071492 | cellular response to UV-A(GO:0071492) |
| 1.2 | 13.0 | GO:0019373 | epoxygenase P450 pathway(GO:0019373) |
| 1.2 | 9.5 | GO:0048712 | negative regulation of astrocyte differentiation(GO:0048712) |
| 1.2 | 1.2 | GO:1900107 | regulation of nodal signaling pathway(GO:1900107) |
| 1.2 | 3.5 | GO:1900365 | positive regulation of mRNA polyadenylation(GO:1900365) |
| 1.2 | 18.7 | GO:0006705 | mineralocorticoid biosynthetic process(GO:0006705) mineralocorticoid metabolic process(GO:0008212) |
| 1.2 | 1.2 | GO:1902908 | regulation of melanosome transport(GO:1902908) |
| 1.2 | 5.8 | GO:2000418 | positive regulation of eosinophil migration(GO:2000418) |
| 1.2 | 2.3 | GO:0030917 | midbrain-hindbrain boundary development(GO:0030917) |
| 1.1 | 11.5 | GO:0032264 | IMP salvage(GO:0032264) |
| 1.1 | 3.4 | GO:0071043 | CUT catabolic process(GO:0071034) CUT metabolic process(GO:0071043) |
| 1.1 | 5.7 | GO:2001241 | positive regulation of extrinsic apoptotic signaling pathway in absence of ligand(GO:2001241) |
| 1.1 | 29.8 | GO:0043567 | regulation of insulin-like growth factor receptor signaling pathway(GO:0043567) |
| 1.1 | 4.6 | GO:1900157 | regulation of bone mineralization involved in bone maturation(GO:1900157) |
| 1.1 | 9.1 | GO:0060068 | vagina development(GO:0060068) |
| 1.1 | 2.3 | GO:0035973 | aggrephagy(GO:0035973) |
| 1.1 | 3.4 | GO:1903015 | regulation of exo-alpha-sialidase activity(GO:1903015) |
| 1.1 | 3.4 | GO:0036414 | protein citrullination(GO:0018101) histone citrullination(GO:0036414) |
| 1.1 | 4.5 | GO:0072137 | condensed mesenchymal cell proliferation(GO:0072137) |
| 1.1 | 1.1 | GO:0030862 | positive regulation of polarized epithelial cell differentiation(GO:0030862) |
| 1.1 | 14.7 | GO:0015812 | gamma-aminobutyric acid transport(GO:0015812) |
| 1.1 | 6.8 | GO:0008343 | adult feeding behavior(GO:0008343) |
| 1.1 | 2.3 | GO:0010901 | regulation of very-low-density lipoprotein particle remodeling(GO:0010901) chylomicron remodeling(GO:0034371) |
| 1.1 | 2.3 | GO:0070459 | prolactin secretion(GO:0070459) |
| 1.1 | 7.9 | GO:0034374 | low-density lipoprotein particle remodeling(GO:0034374) |
| 1.1 | 9.0 | GO:0015693 | magnesium ion transport(GO:0015693) |
| 1.1 | 84.8 | GO:0070098 | chemokine-mediated signaling pathway(GO:0070098) |
| 1.1 | 22.3 | GO:0042462 | eye photoreceptor cell development(GO:0042462) |
| 1.1 | 4.5 | GO:0015942 | formate metabolic process(GO:0015942) |
| 1.1 | 3.3 | GO:0042423 | catechol-containing compound biosynthetic process(GO:0009713) catecholamine biosynthetic process(GO:0042423) |
| 1.1 | 24.4 | GO:0007398 | ectoderm development(GO:0007398) |
| 1.1 | 3.3 | GO:0021521 | ventral spinal cord interneuron specification(GO:0021521) cell fate specification involved in pattern specification(GO:0060573) |
| 1.1 | 3.3 | GO:0097156 | fasciculation of motor neuron axon(GO:0097156) |
| 1.1 | 3.3 | GO:0030916 | otic vesicle formation(GO:0030916) |
| 1.1 | 4.4 | GO:0042758 | long-chain fatty acid catabolic process(GO:0042758) diacylglycerol catabolic process(GO:0046340) |
| 1.1 | 4.4 | GO:1904381 | Golgi apparatus mannose trimming(GO:1904381) |
| 1.1 | 2.2 | GO:0031133 | regulation of axon diameter(GO:0031133) |
| 1.1 | 5.5 | GO:0090625 | mRNA cleavage involved in gene silencing by miRNA(GO:0035279) mRNA cleavage involved in gene silencing by siRNA(GO:0090625) mRNA cleavage involved in gene silencing(GO:0098795) |
| 1.1 | 5.5 | GO:0097498 | endothelial tube lumen extension(GO:0097498) |
| 1.1 | 8.7 | GO:0070307 | lens fiber cell development(GO:0070307) |
| 1.1 | 9.8 | GO:0086023 | adrenergic receptor signaling pathway involved in heart process(GO:0086023) |
| 1.1 | 3.3 | GO:0032308 | regulation of prostaglandin secretion(GO:0032306) positive regulation of prostaglandin secretion(GO:0032308) |
| 1.1 | 3.2 | GO:0035865 | cellular response to potassium ion(GO:0035865) |
| 1.1 | 5.4 | GO:0086042 | cardiac muscle cell-cardiac muscle cell adhesion(GO:0086042) bundle of His cell-Purkinje myocyte adhesion involved in cell communication(GO:0086073) |
| 1.1 | 1.1 | GO:0032494 | response to peptidoglycan(GO:0032494) |
| 1.1 | 1.1 | GO:0048859 | formation of anatomical boundary(GO:0048859) |
| 1.1 | 4.3 | GO:1904428 | negative regulation of tubulin deacetylation(GO:1904428) |
| 1.1 | 12.8 | GO:0015074 | DNA integration(GO:0015074) |
| 1.1 | 4.2 | GO:0045906 | negative regulation of vasoconstriction(GO:0045906) |
| 1.1 | 2.1 | GO:0097211 | response to gonadotropin-releasing hormone(GO:0097210) cellular response to gonadotropin-releasing hormone(GO:0097211) |
| 1.1 | 2.1 | GO:0070633 | transepithelial transport(GO:0070633) |
| 1.1 | 3.2 | GO:0048213 | Golgi vesicle prefusion complex stabilization(GO:0048213) |
| 1.1 | 2.1 | GO:0038001 | paracrine signaling(GO:0038001) |
| 1.1 | 2.1 | GO:1900825 | regulation of membrane depolarization during cardiac muscle cell action potential(GO:1900825) |
| 1.0 | 4.2 | GO:0033504 | floor plate development(GO:0033504) |
| 1.0 | 3.1 | GO:1901053 | sarcosine metabolic process(GO:1901052) sarcosine catabolic process(GO:1901053) |
| 1.0 | 8.3 | GO:0060484 | lung-associated mesenchyme development(GO:0060484) |
| 1.0 | 8.3 | GO:0006384 | transcription initiation from RNA polymerase III promoter(GO:0006384) |
| 1.0 | 22.8 | GO:0036065 | fucosylation(GO:0036065) |
| 1.0 | 1.0 | GO:0048842 | positive regulation of axon extension involved in axon guidance(GO:0048842) |
| 1.0 | 2.1 | GO:0072178 | nephric duct morphogenesis(GO:0072178) |
| 1.0 | 3.1 | GO:0008298 | intracellular mRNA localization(GO:0008298) |
| 1.0 | 3.1 | GO:0097460 | ferrous iron import into cell(GO:0097460) ferrous iron import across plasma membrane(GO:0098707) |
| 1.0 | 1.0 | GO:0021984 | adenohypophysis development(GO:0021984) |
| 1.0 | 9.3 | GO:0097070 | ductus arteriosus closure(GO:0097070) |
| 1.0 | 1.0 | GO:0046533 | negative regulation of photoreceptor cell differentiation(GO:0046533) |
| 1.0 | 3.1 | GO:0071922 | establishment of sister chromatid cohesion(GO:0034085) cohesin loading(GO:0071921) regulation of cohesin loading(GO:0071922) |
| 1.0 | 8.2 | GO:0048664 | neuron fate determination(GO:0048664) |
| 1.0 | 20.5 | GO:0042403 | thyroid hormone metabolic process(GO:0042403) |
| 1.0 | 5.1 | GO:0035021 | negative regulation of Rac protein signal transduction(GO:0035021) |
| 1.0 | 3.1 | GO:0070079 | peptidyl-lysine hydroxylation to 5-hydroxy-L-lysine(GO:0018395) histone arginine demethylation(GO:0070077) histone H3-R2 demethylation(GO:0070078) histone H4-R3 demethylation(GO:0070079) |
| 1.0 | 6.1 | GO:0035457 | cellular response to interferon-alpha(GO:0035457) |
| 1.0 | 6.1 | GO:1903566 | positive regulation of protein localization to cilium(GO:1903566) |
| 1.0 | 6.1 | GO:0007207 | phospholipase C-activating G-protein coupled acetylcholine receptor signaling pathway(GO:0007207) |
| 1.0 | 5.1 | GO:0045023 | G0 to G1 transition(GO:0045023) |
| 1.0 | 1.0 | GO:0048631 | regulation of skeletal muscle tissue growth(GO:0048631) |
| 1.0 | 3.0 | GO:0001539 | cilium or flagellum-dependent cell motility(GO:0001539) |
| 1.0 | 3.0 | GO:0070105 | positive regulation of interleukin-6-mediated signaling pathway(GO:0070105) |
| 1.0 | 2.0 | GO:0060526 | prostate glandular acinus morphogenesis(GO:0060526) prostate epithelial cord arborization involved in prostate glandular acinus morphogenesis(GO:0060527) |
| 1.0 | 15.1 | GO:2000194 | regulation of female gonad development(GO:2000194) |
| 1.0 | 7.0 | GO:0032287 | peripheral nervous system myelin maintenance(GO:0032287) |
| 1.0 | 3.0 | GO:0021513 | spinal cord dorsal/ventral patterning(GO:0021513) |
| 1.0 | 5.0 | GO:0014816 | skeletal muscle satellite cell differentiation(GO:0014816) |
| 1.0 | 1.0 | GO:2000380 | regulation of mesoderm development(GO:2000380) |
| 1.0 | 3.0 | GO:0045903 | positive regulation of translational fidelity(GO:0045903) |
| 1.0 | 1.0 | GO:0099550 | trans-synaptic signalling, modulating synaptic transmission(GO:0099550) |
| 1.0 | 66.3 | GO:0006501 | C-terminal protein lipidation(GO:0006501) |
| 1.0 | 5.9 | GO:0060754 | positive regulation of mast cell chemotaxis(GO:0060754) |
| 1.0 | 8.8 | GO:0030050 | vesicle transport along actin filament(GO:0030050) |
| 1.0 | 10.8 | GO:0030202 | heparin metabolic process(GO:0030202) heparin biosynthetic process(GO:0030210) |
| 1.0 | 3.9 | GO:1905225 | thyroid-stimulating hormone signaling pathway(GO:0038194) cellular response to glycoprotein(GO:1904588) response to thyrotropin-releasing hormone(GO:1905225) cellular response to thyrotropin-releasing hormone(GO:1905229) |
| 1.0 | 7.8 | GO:0061343 | cell adhesion involved in heart morphogenesis(GO:0061343) |
| 1.0 | 14.6 | GO:0005513 | detection of calcium ion(GO:0005513) |
| 1.0 | 1.0 | GO:0032765 | positive regulation of mast cell cytokine production(GO:0032765) |
| 1.0 | 1.9 | GO:1903378 | positive regulation of oxidative stress-induced neuron intrinsic apoptotic signaling pathway(GO:1903378) |
| 1.0 | 26.2 | GO:0003416 | endochondral bone growth(GO:0003416) |
| 1.0 | 5.8 | GO:0030885 | regulation of myeloid dendritic cell activation(GO:0030885) |
| 1.0 | 1.9 | GO:1902612 | regulation of anti-Mullerian hormone signaling pathway(GO:1902612) negative regulation of anti-Mullerian hormone signaling pathway(GO:1902613) anti-Mullerian hormone signaling pathway(GO:1990262) |
| 1.0 | 4.8 | GO:0036343 | psychomotor behavior(GO:0036343) motor behavior(GO:0061744) |
| 1.0 | 3.8 | GO:0048861 | leukemia inhibitory factor signaling pathway(GO:0048861) |
| 1.0 | 2.9 | GO:0043321 | regulation of natural killer cell degranulation(GO:0043321) positive regulation of natural killer cell degranulation(GO:0043323) |
| 1.0 | 5.7 | GO:1903546 | protein localization to photoreceptor outer segment(GO:1903546) |
| 1.0 | 1.9 | GO:0015722 | canalicular bile acid transport(GO:0015722) |
| 1.0 | 2.9 | GO:0051295 | establishment of meiotic spindle localization(GO:0051295) |
| 1.0 | 5.7 | GO:0097152 | mesenchymal cell apoptotic process(GO:0097152) |
| 1.0 | 2.9 | GO:0090050 | positive regulation of cell migration involved in sprouting angiogenesis(GO:0090050) |
| 1.0 | 1.0 | GO:0021940 | positive regulation of cerebellar granule cell precursor proliferation(GO:0021940) |
| 0.9 | 4.7 | GO:1901202 | negative regulation of extracellular matrix assembly(GO:1901202) |
| 0.9 | 3.8 | GO:0002925 | positive regulation of humoral immune response mediated by circulating immunoglobulin(GO:0002925) |
| 0.9 | 1.9 | GO:0010996 | response to auditory stimulus(GO:0010996) |
| 0.9 | 2.8 | GO:0046603 | negative regulation of mitotic centrosome separation(GO:0046603) |
| 0.9 | 1.9 | GO:0097155 | fasciculation of sensory neuron axon(GO:0097155) |
| 0.9 | 7.5 | GO:0060019 | radial glial cell differentiation(GO:0060019) |
| 0.9 | 3.7 | GO:0038044 | transforming growth factor-beta secretion(GO:0038044) |
| 0.9 | 14.0 | GO:0010991 | regulation of SMAD protein complex assembly(GO:0010990) negative regulation of SMAD protein complex assembly(GO:0010991) |
| 0.9 | 4.6 | GO:0050713 | negative regulation of interleukin-1 beta secretion(GO:0050713) |
| 0.9 | 4.6 | GO:0045347 | negative regulation of MHC class II biosynthetic process(GO:0045347) |
| 0.9 | 4.6 | GO:0007262 | STAT protein import into nucleus(GO:0007262) |
| 0.9 | 12.0 | GO:0033617 | mitochondrial respiratory chain complex IV assembly(GO:0033617) |
| 0.9 | 1.8 | GO:0014827 | intestine smooth muscle contraction(GO:0014827) |
| 0.9 | 105.7 | GO:0006958 | complement activation, classical pathway(GO:0006958) |
| 0.9 | 5.5 | GO:0071477 | hypotonic salinity response(GO:0042539) cellular hypotonic salinity response(GO:0071477) |
| 0.9 | 31.0 | GO:0018146 | keratan sulfate biosynthetic process(GO:0018146) |
| 0.9 | 7.3 | GO:0016557 | peroxisome membrane biogenesis(GO:0016557) |
| 0.9 | 4.5 | GO:0038016 | insulin receptor internalization(GO:0038016) |
| 0.9 | 0.9 | GO:0010046 | response to mycotoxin(GO:0010046) |
| 0.9 | 4.5 | GO:0006704 | glucocorticoid biosynthetic process(GO:0006704) |
| 0.9 | 2.7 | GO:0097032 | respiratory chain complex II assembly(GO:0034552) mitochondrial respiratory chain complex II assembly(GO:0034553) mitochondrial respiratory chain complex II biogenesis(GO:0097032) |
| 0.9 | 2.7 | GO:0048630 | skeletal muscle tissue growth(GO:0048630) |
| 0.9 | 8.1 | GO:1990035 | calcium ion import across plasma membrane(GO:0098703) calcium ion import into cell(GO:1990035) |
| 0.9 | 7.2 | GO:0009642 | response to light intensity(GO:0009642) |
| 0.9 | 11.6 | GO:0060662 | tube lumen cavitation(GO:0060605) salivary gland cavitation(GO:0060662) |
| 0.9 | 7.1 | GO:0044241 | lipid digestion(GO:0044241) |
| 0.9 | 1.8 | GO:0061101 | neuroendocrine cell differentiation(GO:0061101) |
| 0.9 | 2.7 | GO:0002904 | positive regulation of B cell apoptotic process(GO:0002904) |
| 0.9 | 19.6 | GO:0007340 | acrosome reaction(GO:0007340) |
| 0.9 | 12.4 | GO:0015874 | norepinephrine transport(GO:0015874) |
| 0.9 | 0.9 | GO:0001920 | negative regulation of receptor recycling(GO:0001920) |
| 0.9 | 1.8 | GO:0031393 | negative regulation of prostaglandin biosynthetic process(GO:0031393) |
| 0.9 | 4.4 | GO:0033629 | negative regulation of cell adhesion mediated by integrin(GO:0033629) |
| 0.9 | 2.6 | GO:0001757 | somite specification(GO:0001757) |
| 0.9 | 6.1 | GO:0002347 | response to tumor cell(GO:0002347) |
| 0.9 | 1.8 | GO:0002645 | positive regulation of tolerance induction(GO:0002645) |
| 0.9 | 0.9 | GO:1901529 | positive regulation of anion channel activity(GO:1901529) |
| 0.9 | 10.5 | GO:0002726 | positive regulation of T cell cytokine production(GO:0002726) |
| 0.9 | 9.6 | GO:0030322 | stabilization of membrane potential(GO:0030322) |
| 0.9 | 3.5 | GO:0019072 | viral genome packaging(GO:0019072) viral RNA genome packaging(GO:0019074) |
| 0.9 | 7.8 | GO:0007196 | adenylate cyclase-inhibiting G-protein coupled glutamate receptor signaling pathway(GO:0007196) |
| 0.9 | 3.5 | GO:0006154 | adenosine catabolic process(GO:0006154) hypoxanthine salvage(GO:0043103) inosine biosynthetic process(GO:0046103) |
| 0.9 | 2.6 | GO:0006857 | oligopeptide transport(GO:0006857) |
| 0.9 | 2.6 | GO:0034378 | chylomicron assembly(GO:0034378) |
| 0.9 | 6.0 | GO:0042483 | negative regulation of odontogenesis(GO:0042483) |
| 0.9 | 2.6 | GO:0034154 | toll-like receptor 7 signaling pathway(GO:0034154) |
| 0.9 | 3.4 | GO:0044829 | positive regulation by host of viral genome replication(GO:0044829) |
| 0.9 | 2.6 | GO:0090027 | negative regulation of monocyte chemotaxis(GO:0090027) |
| 0.9 | 7.7 | GO:1901552 | positive regulation of endothelial cell development(GO:1901552) positive regulation of establishment of endothelial barrier(GO:1903142) |
| 0.9 | 2.6 | GO:0007500 | mesodermal cell fate determination(GO:0007500) |
| 0.8 | 3.4 | GO:0021615 | glossopharyngeal nerve morphogenesis(GO:0021615) |
| 0.8 | 7.6 | GO:0019934 | cGMP-mediated signaling(GO:0019934) |
| 0.8 | 2.5 | GO:0022027 | interkinetic nuclear migration(GO:0022027) |
| 0.8 | 15.9 | GO:0051004 | regulation of lipoprotein lipase activity(GO:0051004) |
| 0.8 | 3.3 | GO:0072033 | renal vesicle formation(GO:0072033) ureteric bud invasion(GO:0072092) metanephric renal vesicle formation(GO:0072093) |
| 0.8 | 8.3 | GO:0007616 | long-term memory(GO:0007616) |
| 0.8 | 1.7 | GO:0044339 | canonical Wnt signaling pathway involved in osteoblast differentiation(GO:0044339) |
| 0.8 | 3.3 | GO:0007351 | tripartite regional subdivision(GO:0007351) anterior/posterior axis specification, embryo(GO:0008595) |
| 0.8 | 4.9 | GO:0034983 | peptidyl-lysine deacetylation(GO:0034983) |
| 0.8 | 4.1 | GO:0007141 | male meiosis I(GO:0007141) |
| 0.8 | 4.9 | GO:0000722 | telomere maintenance via recombination(GO:0000722) |
| 0.8 | 5.7 | GO:0042148 | strand invasion(GO:0042148) |
| 0.8 | 3.2 | GO:0032972 | regulation of muscle filament sliding speed(GO:0032972) |
| 0.8 | 5.7 | GO:0006003 | fructose 2,6-bisphosphate metabolic process(GO:0006003) |
| 0.8 | 13.7 | GO:0032060 | bleb assembly(GO:0032060) |
| 0.8 | 10.5 | GO:0035082 | axoneme assembly(GO:0035082) |
| 0.8 | 1.6 | GO:1990822 | basic amino acid transmembrane transport(GO:1990822) |
| 0.8 | 2.4 | GO:0099563 | modification of synaptic structure(GO:0099563) |
| 0.8 | 4.8 | GO:0034551 | respiratory chain complex III assembly(GO:0017062) mitochondrial respiratory chain complex III assembly(GO:0034551) |
| 0.8 | 2.4 | GO:0050904 | diapedesis(GO:0050904) |
| 0.8 | 3.2 | GO:0014807 | regulation of somitogenesis(GO:0014807) |
| 0.8 | 8.7 | GO:0097094 | craniofacial suture morphogenesis(GO:0097094) |
| 0.8 | 3.2 | GO:0072366 | positive regulation of gluconeogenesis by positive regulation of transcription from RNA polymerase II promoter(GO:0035948) regulation of cellular ketone metabolic process by positive regulation of transcription from RNA polymerase II promoter(GO:0072366) |
| 0.8 | 0.8 | GO:0032754 | positive regulation of interleukin-5 production(GO:0032754) |
| 0.8 | 1.6 | GO:0010760 | negative regulation of macrophage chemotaxis(GO:0010760) |
| 0.8 | 1.6 | GO:0098735 | positive regulation of the force of heart contraction(GO:0098735) |
| 0.8 | 0.8 | GO:1900424 | regulation of defense response to bacterium(GO:1900424) |
| 0.8 | 4.0 | GO:0060158 | phospholipase C-activating dopamine receptor signaling pathway(GO:0060158) |
| 0.8 | 2.4 | GO:1990036 | regulation of calcium ion import into sarcoplasmic reticulum(GO:1902080) negative regulation of calcium ion import into sarcoplasmic reticulum(GO:1902081) calcium ion import into sarcoplasmic reticulum(GO:1990036) |
| 0.8 | 1.6 | GO:0035357 | peroxisome proliferator activated receptor signaling pathway(GO:0035357) |
| 0.8 | 2.4 | GO:0006072 | glycerol-3-phosphate metabolic process(GO:0006072) glycerol-3-phosphate biosynthetic process(GO:0046167) |
| 0.8 | 1.6 | GO:1990086 | lens fiber cell apoptotic process(GO:1990086) |
| 0.8 | 3.9 | GO:0045986 | negative regulation of smooth muscle contraction(GO:0045986) |
| 0.8 | 2.3 | GO:0045629 | negative regulation of T-helper 2 cell differentiation(GO:0045629) |
| 0.8 | 3.1 | GO:0002328 | pro-B cell differentiation(GO:0002328) |
| 0.8 | 12.5 | GO:0032291 | central nervous system myelination(GO:0022010) axon ensheathment in central nervous system(GO:0032291) |
| 0.8 | 4.7 | GO:0002281 | macrophage activation involved in immune response(GO:0002281) |
| 0.8 | 0.8 | GO:0045656 | negative regulation of monocyte differentiation(GO:0045656) |
| 0.8 | 4.6 | GO:1900165 | negative regulation of interleukin-6 secretion(GO:1900165) |
| 0.8 | 0.8 | GO:0018242 | protein O-linked glycosylation via serine(GO:0018242) |
| 0.8 | 5.4 | GO:0035116 | embryonic hindlimb morphogenesis(GO:0035116) |
| 0.8 | 3.1 | GO:0032000 | positive regulation of fatty acid beta-oxidation(GO:0032000) |
| 0.8 | 2.3 | GO:0035624 | receptor transactivation(GO:0035624) |
| 0.8 | 0.8 | GO:0086043 | bundle of His cell to Purkinje myocyte signaling(GO:0086028) bundle of His cell action potential(GO:0086043) |
| 0.8 | 3.1 | GO:0070278 | extracellular matrix constituent secretion(GO:0070278) |
| 0.8 | 3.0 | GO:0070842 | aggresome assembly(GO:0070842) |
| 0.8 | 6.8 | GO:0035360 | positive regulation of peroxisome proliferator activated receptor signaling pathway(GO:0035360) |
| 0.8 | 3.8 | GO:0071107 | response to parathyroid hormone(GO:0071107) |
| 0.8 | 4.5 | GO:0051013 | microtubule severing(GO:0051013) |
| 0.8 | 5.3 | GO:0019227 | neuronal action potential propagation(GO:0019227) action potential propagation(GO:0098870) |
| 0.8 | 3.8 | GO:0034384 | high-density lipoprotein particle clearance(GO:0034384) |
| 0.8 | 1.5 | GO:0031587 | positive regulation of inositol 1,4,5-trisphosphate-sensitive calcium-release channel activity(GO:0031587) |
| 0.8 | 2.3 | GO:0006842 | tricarboxylic acid transport(GO:0006842) citrate transport(GO:0015746) |
| 0.7 | 25.5 | GO:0032755 | positive regulation of interleukin-6 production(GO:0032755) |
| 0.7 | 9.0 | GO:0045109 | intermediate filament organization(GO:0045109) |
| 0.7 | 5.2 | GO:0035791 | platelet-derived growth factor receptor-beta signaling pathway(GO:0035791) |
| 0.7 | 0.7 | GO:0060316 | positive regulation of ryanodine-sensitive calcium-release channel activity(GO:0060316) |
| 0.7 | 13.5 | GO:0045332 | lipid translocation(GO:0034204) phospholipid translocation(GO:0045332) |
| 0.7 | 2.2 | GO:0018160 | peptidyl-pyrromethane cofactor linkage(GO:0018160) |
| 0.7 | 3.7 | GO:0023041 | neuronal signal transduction(GO:0023041) |
| 0.7 | 5.2 | GO:0097084 | vascular smooth muscle cell development(GO:0097084) |
| 0.7 | 1.5 | GO:2000020 | regulation of male gonad development(GO:2000018) positive regulation of male gonad development(GO:2000020) |
| 0.7 | 2.2 | GO:0097368 | establishment of Sertoli cell barrier(GO:0097368) |
| 0.7 | 29.2 | GO:0002292 | T cell differentiation involved in immune response(GO:0002292) |
| 0.7 | 4.4 | GO:0030728 | ovulation(GO:0030728) |
| 0.7 | 8.0 | GO:0070493 | thrombin receptor signaling pathway(GO:0070493) |
| 0.7 | 2.2 | GO:1902232 | regulation of positive thymic T cell selection(GO:1902232) |
| 0.7 | 1.4 | GO:0000023 | maltose metabolic process(GO:0000023) |
| 0.7 | 3.6 | GO:0052422 | modulation by symbiont of host molecular function(GO:0052055) modulation of catalytic activity in other organism involved in symbiotic interaction(GO:0052203) modulation by host of symbiont catalytic activity(GO:0052422) |
| 0.7 | 4.3 | GO:0042832 | defense response to protozoan(GO:0042832) |
| 0.7 | 3.6 | GO:0071600 | otic vesicle morphogenesis(GO:0071600) |
| 0.7 | 2.1 | GO:0030174 | regulation of DNA-dependent DNA replication initiation(GO:0030174) |
| 0.7 | 7.9 | GO:0043508 | negative regulation of JUN kinase activity(GO:0043508) |
| 0.7 | 1.4 | GO:0034653 | diterpenoid catabolic process(GO:0016103) retinoic acid catabolic process(GO:0034653) |
| 0.7 | 2.1 | GO:0098915 | membrane repolarization during ventricular cardiac muscle cell action potential(GO:0098915) |
| 0.7 | 13.5 | GO:0097503 | sialylation(GO:0097503) |
| 0.7 | 3.5 | GO:0006127 | glycerophosphate shuttle(GO:0006127) |
| 0.7 | 9.9 | GO:0048070 | regulation of developmental pigmentation(GO:0048070) |
| 0.7 | 2.1 | GO:0008218 | bioluminescence(GO:0008218) |
| 0.7 | 4.2 | GO:0002158 | osteoclast proliferation(GO:0002158) |
| 0.7 | 1.4 | GO:0070640 | calcitriol biosynthetic process from calciol(GO:0036378) vitamin D3 metabolic process(GO:0070640) |
| 0.7 | 2.8 | GO:0090136 | epithelial cell-cell adhesion(GO:0090136) |
| 0.7 | 2.8 | GO:0070474 | regulation of uterine smooth muscle contraction(GO:0070472) positive regulation of uterine smooth muscle contraction(GO:0070474) |
| 0.7 | 2.8 | GO:0010226 | response to lithium ion(GO:0010226) |
| 0.7 | 14.4 | GO:0016486 | peptide hormone processing(GO:0016486) |
| 0.7 | 1.4 | GO:1901895 | negative regulation of calcium-transporting ATPase activity(GO:1901895) |
| 0.7 | 11.0 | GO:0010763 | positive regulation of fibroblast migration(GO:0010763) |
| 0.7 | 0.7 | GO:0010726 | positive regulation of hydrogen peroxide metabolic process(GO:0010726) |
| 0.7 | 0.7 | GO:0051574 | positive regulation of histone H3-K9 methylation(GO:0051574) |
| 0.7 | 2.0 | GO:0002101 | tRNA wobble cytosine modification(GO:0002101) |
| 0.7 | 2.0 | GO:0045743 | positive regulation of fibroblast growth factor receptor signaling pathway(GO:0045743) |
| 0.7 | 6.8 | GO:0006824 | cobalt ion transport(GO:0006824) |
| 0.7 | 6.1 | GO:0032324 | molybdopterin cofactor biosynthetic process(GO:0032324) molybdopterin cofactor metabolic process(GO:0043545) prosthetic group metabolic process(GO:0051189) |
| 0.7 | 14.9 | GO:0045600 | positive regulation of fat cell differentiation(GO:0045600) |
| 0.7 | 0.7 | GO:0046532 | regulation of photoreceptor cell differentiation(GO:0046532) |
| 0.7 | 5.4 | GO:1904781 | positive regulation of protein localization to centrosome(GO:1904781) |
| 0.7 | 4.0 | GO:0055091 | phospholipid homeostasis(GO:0055091) |
| 0.7 | 25.4 | GO:0070830 | bicellular tight junction assembly(GO:0070830) |
| 0.7 | 32.0 | GO:0086010 | membrane depolarization during action potential(GO:0086010) |
| 0.7 | 1.3 | GO:1901492 | positive regulation of lymphangiogenesis(GO:1901492) |
| 0.7 | 3.9 | GO:0060539 | diaphragm development(GO:0060539) |
| 0.7 | 18.3 | GO:0043268 | positive regulation of potassium ion transport(GO:0043268) |
| 0.7 | 1.3 | GO:0032228 | regulation of synaptic transmission, GABAergic(GO:0032228) |
| 0.7 | 1.3 | GO:0032689 | negative regulation of interferon-gamma production(GO:0032689) |
| 0.6 | 7.1 | GO:0097106 | postsynaptic density organization(GO:0097106) postsynaptic density assembly(GO:0097107) gephyrin clustering involved in postsynaptic density assembly(GO:0097116) |
| 0.6 | 16.8 | GO:0046596 | regulation of viral entry into host cell(GO:0046596) |
| 0.6 | 0.6 | GO:0010193 | response to ozone(GO:0010193) |
| 0.6 | 1.9 | GO:0071350 | interleukin-15-mediated signaling pathway(GO:0035723) extrathymic T cell selection(GO:0045062) cellular response to interleukin-15(GO:0071350) |
| 0.6 | 3.9 | GO:0031860 | telomeric 3' overhang formation(GO:0031860) |
| 0.6 | 2.6 | GO:2001106 | regulation of Rho guanyl-nucleotide exchange factor activity(GO:2001106) |
| 0.6 | 1.3 | GO:0071104 | response to interleukin-9(GO:0071104) |
| 0.6 | 3.8 | GO:0007000 | nucleolus organization(GO:0007000) |
| 0.6 | 1.9 | GO:0042074 | cell migration involved in gastrulation(GO:0042074) |
| 0.6 | 4.5 | GO:0042989 | sequestering of actin monomers(GO:0042989) |
| 0.6 | 1.3 | GO:1904048 | spontaneous neurotransmitter secretion(GO:0061669) spontaneous synaptic transmission(GO:0098814) regulation of spontaneous neurotransmitter secretion(GO:1904048) negative regulation of spontaneous neurotransmitter secretion(GO:1904049) |
| 0.6 | 0.6 | GO:0006701 | progesterone biosynthetic process(GO:0006701) |
| 0.6 | 1.9 | GO:0071286 | cellular response to magnesium ion(GO:0071286) |
| 0.6 | 1.9 | GO:1901842 | negative regulation of high voltage-gated calcium channel activity(GO:1901842) |
| 0.6 | 0.6 | GO:1903659 | regulation of complement-dependent cytotoxicity(GO:1903659) |
| 0.6 | 0.6 | GO:1990167 | protein K27-linked deubiquitination(GO:1990167) |
| 0.6 | 0.6 | GO:1902414 | protein localization to cell junction(GO:1902414) |
| 0.6 | 5.6 | GO:0009950 | dorsal/ventral axis specification(GO:0009950) |
| 0.6 | 3.7 | GO:1902259 | regulation of delayed rectifier potassium channel activity(GO:1902259) |
| 0.6 | 5.0 | GO:0071380 | cellular response to prostaglandin E stimulus(GO:0071380) |
| 0.6 | 5.0 | GO:0030502 | negative regulation of bone mineralization(GO:0030502) |
| 0.6 | 1.9 | GO:0070681 | glutaminyl-tRNAGln biosynthesis via transamidation(GO:0070681) |
| 0.6 | 6.2 | GO:0045821 | positive regulation of glycolytic process(GO:0045821) positive regulation of cofactor metabolic process(GO:0051194) positive regulation of coenzyme metabolic process(GO:0051197) |
| 0.6 | 2.5 | GO:0007056 | spindle assembly involved in female meiosis(GO:0007056) |
| 0.6 | 1.8 | GO:0006711 | estrogen catabolic process(GO:0006711) |
| 0.6 | 0.6 | GO:0019918 | peptidyl-arginine methylation, to symmetrical-dimethyl arginine(GO:0019918) |
| 0.6 | 2.5 | GO:0001826 | inner cell mass cell differentiation(GO:0001826) |
| 0.6 | 1.2 | GO:0010793 | regulation of mRNA export from nucleus(GO:0010793) |
| 0.6 | 3.1 | GO:0043117 | positive regulation of vascular permeability(GO:0043117) |
| 0.6 | 3.1 | GO:0031666 | positive regulation of lipopolysaccharide-mediated signaling pathway(GO:0031666) |
| 0.6 | 3.1 | GO:0035093 | spermatogenesis, exchange of chromosomal proteins(GO:0035093) |
| 0.6 | 1.2 | GO:0033007 | negative regulation of mast cell activation involved in immune response(GO:0033007) |
| 0.6 | 2.4 | GO:0043456 | regulation of pentose-phosphate shunt(GO:0043456) |
| 0.6 | 4.8 | GO:0048012 | hepatocyte growth factor receptor signaling pathway(GO:0048012) |
| 0.6 | 1.8 | GO:0050928 | negative regulation of positive chemotaxis(GO:0050928) |
| 0.6 | 5.4 | GO:0001569 | patterning of blood vessels(GO:0001569) |
| 0.6 | 1.2 | GO:0042436 | tryptophan catabolic process(GO:0006569) indole-containing compound catabolic process(GO:0042436) indolalkylamine catabolic process(GO:0046218) |
| 0.6 | 14.5 | GO:0032958 | inositol phosphate biosynthetic process(GO:0032958) |
| 0.6 | 1.8 | GO:0046066 | dGDP metabolic process(GO:0046066) |
| 0.6 | 1.8 | GO:2000616 | negative regulation of histone H3-K9 acetylation(GO:2000616) |
| 0.6 | 2.4 | GO:0070131 | positive regulation of mitochondrial translation(GO:0070131) |
| 0.6 | 9.0 | GO:0010623 | programmed cell death involved in cell development(GO:0010623) |
| 0.6 | 2.4 | GO:0006669 | sphinganine-1-phosphate biosynthetic process(GO:0006669) |
| 0.6 | 7.8 | GO:2001013 | epithelial cell proliferation involved in renal tubule morphogenesis(GO:2001013) |
| 0.6 | 1.2 | GO:2000189 | positive regulation of cholesterol homeostasis(GO:2000189) |
| 0.6 | 8.9 | GO:0042953 | lipoprotein transport(GO:0042953) lipoprotein localization(GO:0044872) |
| 0.6 | 0.6 | GO:0010513 | positive regulation of phosphatidylinositol biosynthetic process(GO:0010513) |
| 0.6 | 1.8 | GO:0098596 | vocal learning(GO:0042297) imitative learning(GO:0098596) observational learning(GO:0098597) learned vocalization behavior or vocal learning(GO:0098598) |
| 0.6 | 3.5 | GO:0001731 | formation of translation preinitiation complex(GO:0001731) |
| 0.6 | 1.8 | GO:1900114 | positive regulation of histone H3-K9 trimethylation(GO:1900114) |
| 0.6 | 2.9 | GO:0045777 | positive regulation of blood pressure(GO:0045777) |
| 0.6 | 3.5 | GO:0007506 | gonadal mesoderm development(GO:0007506) |
| 0.6 | 1.7 | GO:0098935 | dendritic transport(GO:0098935) anterograde dendritic transport(GO:0098937) |
| 0.6 | 5.8 | GO:0070208 | protein heterotrimerization(GO:0070208) |
| 0.6 | 2.9 | GO:0001754 | eye photoreceptor cell differentiation(GO:0001754) |
| 0.6 | 2.3 | GO:0060644 | mammary gland epithelial cell differentiation(GO:0060644) |
| 0.6 | 6.3 | GO:0042753 | positive regulation of circadian rhythm(GO:0042753) |
| 0.6 | 0.6 | GO:0031998 | regulation of fatty acid beta-oxidation(GO:0031998) |
| 0.6 | 10.2 | GO:0007608 | sensory perception of smell(GO:0007608) |
| 0.6 | 2.8 | GO:1902412 | regulation of mitotic cytokinesis(GO:1902412) |
| 0.6 | 0.6 | GO:0002577 | regulation of antigen processing and presentation(GO:0002577) |
| 0.6 | 1.7 | GO:0061107 | seminal vesicle development(GO:0061107) |
| 0.6 | 10.7 | GO:0030851 | granulocyte differentiation(GO:0030851) |
| 0.6 | 2.2 | GO:0060800 | regulation of cell differentiation involved in embryonic placenta development(GO:0060800) |
| 0.6 | 2.8 | GO:0038170 | somatostatin receptor signaling pathway(GO:0038169) somatostatin signaling pathway(GO:0038170) |
| 0.6 | 1.1 | GO:0002331 | pre-B cell differentiation(GO:0002329) pre-B cell allelic exclusion(GO:0002331) |
| 0.6 | 1.1 | GO:0051533 | positive regulation of NFAT protein import into nucleus(GO:0051533) |
| 0.6 | 3.9 | GO:0045475 | locomotor rhythm(GO:0045475) |
| 0.6 | 30.0 | GO:0044243 | multicellular organism catabolic process(GO:0044243) |
| 0.6 | 9.4 | GO:0003322 | pancreatic A cell development(GO:0003322) |
| 0.6 | 82.6 | GO:0007601 | visual perception(GO:0007601) |
| 0.6 | 5.5 | GO:0034058 | endosomal vesicle fusion(GO:0034058) |
| 0.6 | 19.3 | GO:0010107 | potassium ion import(GO:0010107) |
| 0.5 | 0.5 | GO:0035641 | locomotory exploration behavior(GO:0035641) |
| 0.5 | 7.1 | GO:0070072 | proton-transporting V-type ATPase complex assembly(GO:0070070) vacuolar proton-transporting V-type ATPase complex assembly(GO:0070072) |
| 0.5 | 2.7 | GO:0042986 | positive regulation of amyloid precursor protein biosynthetic process(GO:0042986) |
| 0.5 | 2.7 | GO:0048539 | bone marrow development(GO:0048539) |
| 0.5 | 2.7 | GO:0051418 | interphase microtubule nucleation by interphase microtubule organizing center(GO:0051415) microtubule nucleation by microtubule organizing center(GO:0051418) |
| 0.5 | 9.2 | GO:0016558 | protein import into peroxisome matrix(GO:0016558) |
| 0.5 | 7.0 | GO:0048854 | brain morphogenesis(GO:0048854) |
| 0.5 | 11.7 | GO:0046463 | neutral lipid biosynthetic process(GO:0046460) acylglycerol biosynthetic process(GO:0046463) |
| 0.5 | 2.7 | GO:0021997 | neural plate axis specification(GO:0021997) |
| 0.5 | 6.4 | GO:0007258 | JUN phosphorylation(GO:0007258) |
| 0.5 | 1.6 | GO:1900116 | extracellular regulation of signal transduction(GO:1900115) extracellular negative regulation of signal transduction(GO:1900116) |
| 0.5 | 4.2 | GO:0070571 | negative regulation of axon regeneration(GO:0048681) negative regulation of neuron projection regeneration(GO:0070571) |
| 0.5 | 1.1 | GO:0015824 | proline transport(GO:0015824) |
| 0.5 | 2.1 | GO:0070445 | oligodendrocyte progenitor proliferation(GO:0070444) regulation of oligodendrocyte progenitor proliferation(GO:0070445) |
| 0.5 | 1.0 | GO:0061113 | pancreas morphogenesis(GO:0061113) |
| 0.5 | 4.1 | GO:0086036 | regulation of cardiac muscle cell membrane potential(GO:0086036) |
| 0.5 | 0.5 | GO:0048769 | sarcomerogenesis(GO:0048769) |
| 0.5 | 4.1 | GO:0070995 | NADPH oxidation(GO:0070995) |
| 0.5 | 4.7 | GO:0021670 | lateral ventricle development(GO:0021670) |
| 0.5 | 1.0 | GO:0045003 | DNA recombinase assembly(GO:0000730) double-strand break repair via synthesis-dependent strand annealing(GO:0045003) |
| 0.5 | 6.2 | GO:0007194 | negative regulation of adenylate cyclase activity(GO:0007194) |
| 0.5 | 0.5 | GO:0070102 | interleukin-6-mediated signaling pathway(GO:0070102) |
| 0.5 | 6.7 | GO:0045662 | negative regulation of myoblast differentiation(GO:0045662) |
| 0.5 | 25.6 | GO:0006968 | cellular defense response(GO:0006968) |
| 0.5 | 1.0 | GO:0048262 | determination of dorsal/ventral asymmetry(GO:0048262) determination of dorsal identity(GO:0048263) |
| 0.5 | 3.6 | GO:0006930 | substrate-dependent cell migration, cell extension(GO:0006930) |
| 0.5 | 1.0 | GO:0048105 | establishment of body hair or bristle planar orientation(GO:0048104) establishment of body hair planar orientation(GO:0048105) |
| 0.5 | 3.0 | GO:0035878 | nail development(GO:0035878) |
| 0.5 | 1.0 | GO:0042418 | epinephrine metabolic process(GO:0042414) epinephrine biosynthetic process(GO:0042418) |
| 0.5 | 0.5 | GO:1903625 | negative regulation of DNA catabolic process(GO:1903625) |
| 0.5 | 4.0 | GO:0019262 | N-acetylneuraminate catabolic process(GO:0019262) |
| 0.5 | 3.0 | GO:0006828 | manganese ion transport(GO:0006828) |
| 0.5 | 6.5 | GO:0050901 | leukocyte tethering or rolling(GO:0050901) |
| 0.5 | 4.5 | GO:0005981 | regulation of glycogen catabolic process(GO:0005981) |
| 0.5 | 3.0 | GO:0001759 | organ induction(GO:0001759) |
| 0.5 | 5.0 | GO:0070327 | thyroid hormone transport(GO:0070327) |
| 0.5 | 1.5 | GO:0090285 | negative regulation of protein glycosylation in Golgi(GO:0090285) |
| 0.5 | 68.0 | GO:0007156 | homophilic cell adhesion via plasma membrane adhesion molecules(GO:0007156) |
| 0.5 | 0.5 | GO:0001964 | startle response(GO:0001964) |
| 0.5 | 2.0 | GO:0090208 | positive regulation of triglyceride metabolic process(GO:0090208) |
| 0.5 | 1.5 | GO:0018298 | protein-chromophore linkage(GO:0018298) |
| 0.5 | 11.8 | GO:0007214 | gamma-aminobutyric acid signaling pathway(GO:0007214) |
| 0.5 | 2.4 | GO:1903799 | negative regulation of production of miRNAs involved in gene silencing by miRNA(GO:1903799) |
| 0.5 | 0.5 | GO:2000382 | positive regulation of mesoderm development(GO:2000382) |
| 0.5 | 1.0 | GO:0023035 | CD40 signaling pathway(GO:0023035) |
| 0.5 | 7.2 | GO:0003334 | keratinocyte development(GO:0003334) |
| 0.5 | 2.4 | GO:0050965 | detection of temperature stimulus involved in sensory perception(GO:0050961) detection of temperature stimulus involved in sensory perception of pain(GO:0050965) |
| 0.5 | 5.2 | GO:0034389 | lipid particle organization(GO:0034389) |
| 0.5 | 2.4 | GO:0014059 | dopamine secretion(GO:0014046) regulation of dopamine secretion(GO:0014059) |
| 0.5 | 0.5 | GO:0048069 | eye pigmentation(GO:0048069) |
| 0.5 | 2.3 | GO:0045162 | clustering of voltage-gated sodium channels(GO:0045162) |
| 0.5 | 2.3 | GO:1901911 | diadenosine polyphosphate catabolic process(GO:0015961) diphosphoinositol polyphosphate metabolic process(GO:0071543) diadenosine pentaphosphate metabolic process(GO:1901906) diadenosine pentaphosphate catabolic process(GO:1901907) diadenosine hexaphosphate metabolic process(GO:1901908) diadenosine hexaphosphate catabolic process(GO:1901909) adenosine 5'-(hexahydrogen pentaphosphate) metabolic process(GO:1901910) adenosine 5'-(hexahydrogen pentaphosphate) catabolic process(GO:1901911) |
| 0.5 | 2.3 | GO:0042116 | macrophage activation(GO:0042116) |
| 0.5 | 3.6 | GO:0042359 | vitamin D metabolic process(GO:0042359) |
| 0.5 | 1.4 | GO:1900383 | regulation of synaptic plasticity by receptor localization to synapse(GO:1900383) |
| 0.5 | 1.4 | GO:0043691 | high-density lipoprotein particle remodeling(GO:0034375) reverse cholesterol transport(GO:0043691) |
| 0.5 | 3.2 | GO:0045907 | positive regulation of vasoconstriction(GO:0045907) |
| 0.5 | 13.2 | GO:0007200 | phospholipase C-activating G-protein coupled receptor signaling pathway(GO:0007200) |
| 0.5 | 12.7 | GO:0016266 | O-glycan processing(GO:0016266) |
| 0.5 | 5.0 | GO:0042711 | maternal behavior(GO:0042711) parental behavior(GO:0060746) |
| 0.5 | 0.5 | GO:1903004 | regulation of protein K63-linked deubiquitination(GO:1903004) positive regulation of protein K63-linked deubiquitination(GO:1903006) |
| 0.4 | 1.3 | GO:0060453 | regulation of gastric acid secretion(GO:0060453) |
| 0.4 | 7.1 | GO:0030205 | dermatan sulfate metabolic process(GO:0030205) |
| 0.4 | 3.1 | GO:0006489 | dolichyl diphosphate biosynthetic process(GO:0006489) dolichyl diphosphate metabolic process(GO:0046465) |
| 0.4 | 0.4 | GO:0016139 | glycoside catabolic process(GO:0016139) |
| 0.4 | 1.3 | GO:0050760 | thymidylate synthase biosynthetic process(GO:0050757) regulation of thymidylate synthase biosynthetic process(GO:0050758) negative regulation of thymidylate synthase biosynthetic process(GO:0050760) |
| 0.4 | 1.8 | GO:2000111 | positive regulation of macrophage apoptotic process(GO:2000111) |
| 0.4 | 0.9 | GO:0033058 | directional locomotion(GO:0033058) |
| 0.4 | 1.7 | GO:0008272 | sulfate transport(GO:0008272) |
| 0.4 | 3.0 | GO:0071360 | cellular response to exogenous dsRNA(GO:0071360) |
| 0.4 | 0.9 | GO:0002143 | tRNA wobble position uridine thiolation(GO:0002143) |
| 0.4 | 1.3 | GO:0032049 | cardiolipin biosynthetic process(GO:0032049) |
| 0.4 | 4.7 | GO:0048599 | oocyte development(GO:0048599) |
| 0.4 | 21.0 | GO:0033275 | muscle filament sliding(GO:0030049) actin-myosin filament sliding(GO:0033275) |
| 0.4 | 3.4 | GO:0001975 | response to amphetamine(GO:0001975) |
| 0.4 | 3.0 | GO:0071692 | sequestering of extracellular ligand from receptor(GO:0035581) sequestering of TGFbeta in extracellular matrix(GO:0035583) protein localization to extracellular region(GO:0071692) maintenance of protein location in extracellular region(GO:0071694) |
| 0.4 | 2.1 | GO:0044245 | polysaccharide digestion(GO:0044245) |
| 0.4 | 3.4 | GO:0045905 | translational frameshifting(GO:0006452) positive regulation of translational termination(GO:0045905) |
| 0.4 | 8.3 | GO:0016254 | preassembly of GPI anchor in ER membrane(GO:0016254) |
| 0.4 | 0.8 | GO:1904970 | brush border assembly(GO:1904970) |
| 0.4 | 0.8 | GO:0006540 | glutamate decarboxylation to succinate(GO:0006540) |
| 0.4 | 1.2 | GO:0042487 | regulation of odontogenesis of dentin-containing tooth(GO:0042487) |
| 0.4 | 5.3 | GO:0046337 | phosphatidylethanolamine metabolic process(GO:0046337) |
| 0.4 | 5.7 | GO:0042104 | positive regulation of activated T cell proliferation(GO:0042104) |
| 0.4 | 8.5 | GO:0032729 | positive regulation of interferon-gamma production(GO:0032729) |
| 0.4 | 0.8 | GO:0038165 | oncostatin-M-mediated signaling pathway(GO:0038165) |
| 0.4 | 1.6 | GO:0033564 | anterior/posterior axon guidance(GO:0033564) |
| 0.4 | 3.6 | GO:0051386 | regulation of neurotrophin TRK receptor signaling pathway(GO:0051386) |
| 0.4 | 2.8 | GO:0006203 | dGTP catabolic process(GO:0006203) |
| 0.4 | 0.4 | GO:0060137 | maternal process involved in parturition(GO:0060137) |
| 0.4 | 2.0 | GO:0046643 | regulation of gamma-delta T cell activation(GO:0046643) |
| 0.4 | 1.2 | GO:0002024 | diet induced thermogenesis(GO:0002024) |
| 0.4 | 7.2 | GO:0097120 | receptor localization to synapse(GO:0097120) |
| 0.4 | 2.0 | GO:0045924 | regulation of female receptivity(GO:0045924) female mating behavior(GO:0060180) |
| 0.4 | 4.0 | GO:0035095 | behavioral response to nicotine(GO:0035095) |
| 0.4 | 6.7 | GO:0035435 | phosphate ion transmembrane transport(GO:0035435) |
| 0.4 | 1.2 | GO:0042435 | melatonin metabolic process(GO:0030186) melatonin biosynthetic process(GO:0030187) indole-containing compound biosynthetic process(GO:0042435) indolalkylamine biosynthetic process(GO:0046219) |
| 0.4 | 1.2 | GO:0006975 | DNA damage induced protein phosphorylation(GO:0006975) |
| 0.4 | 1.2 | GO:0044565 | dendritic cell proliferation(GO:0044565) |
| 0.4 | 9.0 | GO:0007274 | neuromuscular synaptic transmission(GO:0007274) |
| 0.4 | 0.8 | GO:0021558 | trochlear nerve development(GO:0021558) |
| 0.4 | 2.0 | GO:0030539 | male genitalia development(GO:0030539) |
| 0.4 | 1.9 | GO:0031119 | tRNA pseudouridine synthesis(GO:0031119) |
| 0.4 | 0.4 | GO:0070827 | chromatin maintenance(GO:0070827) |
| 0.4 | 1.5 | GO:0099624 | membrane repolarization during atrial cardiac muscle cell action potential(GO:0098914) atrial cardiac muscle cell membrane repolarization(GO:0099624) |
| 0.4 | 1.2 | GO:0003199 | endocardial cushion to mesenchymal transition involved in heart valve formation(GO:0003199) |
| 0.4 | 1.1 | GO:0016256 | N-glycan processing to lysosome(GO:0016256) |
| 0.4 | 1.9 | GO:0060134 | prepulse inhibition(GO:0060134) |
| 0.4 | 4.2 | GO:1904706 | negative regulation of vascular smooth muscle cell proliferation(GO:1904706) |
| 0.4 | 5.3 | GO:0021522 | spinal cord motor neuron differentiation(GO:0021522) |
| 0.4 | 1.1 | GO:0035574 | histone H4-K20 demethylation(GO:0035574) |
| 0.4 | 3.0 | GO:0034312 | diol biosynthetic process(GO:0034312) sphingosine biosynthetic process(GO:0046512) sphingoid biosynthetic process(GO:0046520) |
| 0.4 | 4.1 | GO:0031293 | membrane protein intracellular domain proteolysis(GO:0031293) |
| 0.4 | 0.7 | GO:0001574 | ganglioside biosynthetic process(GO:0001574) |
| 0.4 | 4.1 | GO:0015871 | choline transport(GO:0015871) |
| 0.4 | 2.2 | GO:0006265 | DNA topological change(GO:0006265) |
| 0.4 | 2.6 | GO:0010863 | positive regulation of phospholipase C activity(GO:0010863) |
| 0.4 | 20.4 | GO:0007586 | digestion(GO:0007586) |
| 0.4 | 9.3 | GO:1901687 | glutathione derivative metabolic process(GO:1901685) glutathione derivative biosynthetic process(GO:1901687) |
| 0.4 | 1.5 | GO:0018125 | peptidyl-cysteine methylation(GO:0018125) |
| 0.4 | 1.8 | GO:0046208 | spermine catabolic process(GO:0046208) |
| 0.4 | 4.0 | GO:0006685 | sphingomyelin catabolic process(GO:0006685) |
| 0.4 | 1.5 | GO:0035860 | glial cell-derived neurotrophic factor receptor signaling pathway(GO:0035860) |
| 0.4 | 1.8 | GO:0090308 | regulation of methylation-dependent chromatin silencing(GO:0090308) |
| 0.4 | 3.3 | GO:0071526 | semaphorin-plexin signaling pathway(GO:0071526) |
| 0.4 | 0.4 | GO:0061428 | negative regulation of transcription from RNA polymerase II promoter in response to hypoxia(GO:0061428) |
| 0.4 | 0.7 | GO:0007618 | mating(GO:0007618) |
| 0.4 | 1.4 | GO:1904180 | negative regulation of mitochondrial depolarization(GO:0051902) negative regulation of membrane depolarization(GO:1904180) |
| 0.4 | 2.1 | GO:0019344 | cysteine biosynthetic process(GO:0019344) |
| 0.4 | 1.4 | GO:0002457 | T cell antigen processing and presentation(GO:0002457) |
| 0.4 | 2.1 | GO:0006833 | water transport(GO:0006833) |
| 0.4 | 2.5 | GO:0031665 | negative regulation of lipopolysaccharide-mediated signaling pathway(GO:0031665) |
| 0.3 | 1.0 | GO:0048014 | Tie signaling pathway(GO:0048014) |
| 0.3 | 1.7 | GO:0001714 | endodermal cell fate specification(GO:0001714) |
| 0.3 | 0.7 | GO:2000651 | positive regulation of sodium ion transmembrane transporter activity(GO:2000651) |
| 0.3 | 3.1 | GO:0050930 | induction of positive chemotaxis(GO:0050930) |
| 0.3 | 2.7 | GO:0010575 | positive regulation of vascular endothelial growth factor production(GO:0010575) |
| 0.3 | 0.7 | GO:0097527 | necroptotic signaling pathway(GO:0097527) |
| 0.3 | 2.7 | GO:0006686 | sphingomyelin biosynthetic process(GO:0006686) |
| 0.3 | 3.0 | GO:0030815 | negative regulation of cAMP metabolic process(GO:0030815) |
| 0.3 | 4.4 | GO:0006488 | dolichol-linked oligosaccharide biosynthetic process(GO:0006488) |
| 0.3 | 2.0 | GO:0055059 | asymmetric neuroblast division(GO:0055059) |
| 0.3 | 1.7 | GO:0055090 | acylglycerol homeostasis(GO:0055090) triglyceride homeostasis(GO:0070328) |
| 0.3 | 5.0 | GO:0010172 | embryonic body morphogenesis(GO:0010172) |
| 0.3 | 2.3 | GO:0002360 | T cell lineage commitment(GO:0002360) |
| 0.3 | 6.8 | GO:0007099 | centriole replication(GO:0007099) |
| 0.3 | 1.9 | GO:0017185 | peptidyl-lysine hydroxylation(GO:0017185) |
| 0.3 | 5.8 | GO:0006744 | ubiquinone biosynthetic process(GO:0006744) quinone biosynthetic process(GO:1901663) |
| 0.3 | 1.6 | GO:2000291 | regulation of myoblast proliferation(GO:2000291) |
| 0.3 | 0.3 | GO:0061366 | behavioral response to chemical pain(GO:0061366) behavioral response to formalin induced pain(GO:0061368) |
| 0.3 | 1.0 | GO:0021722 | pons maturation(GO:0021586) superior olivary nucleus development(GO:0021718) superior olivary nucleus maturation(GO:0021722) |
| 0.3 | 0.6 | GO:0050746 | regulation of lipoprotein metabolic process(GO:0050746) |
| 0.3 | 3.8 | GO:0045187 | regulation of circadian sleep/wake cycle(GO:0042749) regulation of circadian sleep/wake cycle, sleep(GO:0045187) |
| 0.3 | 0.3 | GO:0060080 | inhibitory postsynaptic potential(GO:0060080) |
| 0.3 | 1.6 | GO:0014877 | response to muscle inactivity involved in regulation of muscle adaptation(GO:0014877) response to denervation involved in regulation of muscle adaptation(GO:0014894) |
| 0.3 | 0.9 | GO:0097011 | cellular response to granulocyte macrophage colony-stimulating factor stimulus(GO:0097011) response to granulocyte macrophage colony-stimulating factor(GO:0097012) |
| 0.3 | 0.6 | GO:1990918 | meiotic DNA double-strand break processing(GO:0000706) double-strand break repair involved in meiotic recombination(GO:1990918) |
| 0.3 | 0.9 | GO:0016082 | synaptic vesicle priming(GO:0016082) |
| 0.3 | 1.2 | GO:0006020 | inositol metabolic process(GO:0006020) |
| 0.3 | 10.3 | GO:0007218 | neuropeptide signaling pathway(GO:0007218) |
| 0.3 | 2.1 | GO:0007567 | parturition(GO:0007567) |
| 0.3 | 0.3 | GO:0019249 | lactate biosynthetic process(GO:0019249) |
| 0.3 | 0.9 | GO:0035048 | splicing factor protein import into nucleus(GO:0035048) |
| 0.3 | 0.9 | GO:0090245 | axis elongation involved in somitogenesis(GO:0090245) |
| 0.3 | 0.6 | GO:1904469 | positive regulation of tumor necrosis factor secretion(GO:1904469) |
| 0.3 | 0.9 | GO:2000341 | chemokine (C-X-C motif) ligand 2 production(GO:0072567) regulation of chemokine (C-X-C motif) ligand 2 production(GO:2000341) |
| 0.3 | 0.9 | GO:0035754 | B cell chemotaxis(GO:0035754) |
| 0.3 | 0.9 | GO:0060244 | negative regulation of cell proliferation involved in contact inhibition(GO:0060244) |
| 0.3 | 2.4 | GO:0003215 | cardiac right ventricle morphogenesis(GO:0003215) |
| 0.3 | 3.8 | GO:0046069 | cGMP catabolic process(GO:0046069) |
| 0.3 | 0.6 | GO:0098722 | asymmetric stem cell division(GO:0098722) |
| 0.3 | 0.8 | GO:0060907 | positive regulation of macrophage cytokine production(GO:0060907) |
| 0.3 | 1.4 | GO:0071711 | basement membrane organization(GO:0071711) |
| 0.3 | 16.2 | GO:1902476 | chloride transmembrane transport(GO:1902476) |
| 0.3 | 0.6 | GO:0038043 | interleukin-5-mediated signaling pathway(GO:0038043) |
| 0.3 | 2.5 | GO:0044062 | regulation of excretion(GO:0044062) |
| 0.3 | 0.8 | GO:0019046 | release from viral latency(GO:0019046) |
| 0.3 | 2.7 | GO:0071168 | protein localization to chromatin(GO:0071168) |
| 0.3 | 1.3 | GO:0070875 | positive regulation of glycogen metabolic process(GO:0070875) |
| 0.3 | 3.0 | GO:0007250 | activation of NF-kappaB-inducing kinase activity(GO:0007250) |
| 0.3 | 1.3 | GO:0036289 | peptidyl-serine autophosphorylation(GO:0036289) |
| 0.3 | 3.7 | GO:0035249 | synaptic transmission, glutamatergic(GO:0035249) |
| 0.3 | 20.4 | GO:0046854 | phosphatidylinositol phosphorylation(GO:0046854) |
| 0.3 | 0.8 | GO:2001151 | regulation of renal water transport(GO:2001151) positive regulation of renal water transport(GO:2001153) |
| 0.3 | 2.1 | GO:0050882 | voluntary musculoskeletal movement(GO:0050882) |
| 0.3 | 1.8 | GO:0032202 | telomere assembly(GO:0032202) |
| 0.3 | 1.8 | GO:0035640 | exploration behavior(GO:0035640) |
| 0.3 | 1.6 | GO:0045494 | photoreceptor cell maintenance(GO:0045494) |
| 0.3 | 0.5 | GO:0060671 | epithelial cell differentiation involved in embryonic placenta development(GO:0060671) epithelial cell morphogenesis involved in placental branching(GO:0060672) |
| 0.3 | 1.0 | GO:0042249 | establishment of planar polarity of embryonic epithelium(GO:0042249) |
| 0.3 | 0.3 | GO:0021764 | amygdala development(GO:0021764) |
| 0.3 | 1.8 | GO:0090042 | tubulin deacetylation(GO:0090042) regulation of tubulin deacetylation(GO:0090043) |
| 0.3 | 2.5 | GO:0090557 | establishment of endothelial intestinal barrier(GO:0090557) |
| 0.3 | 0.8 | GO:0035026 | leading edge cell differentiation(GO:0035026) |
| 0.2 | 2.0 | GO:0042789 | mRNA transcription from RNA polymerase II promoter(GO:0042789) |
| 0.2 | 2.2 | GO:0001833 | inner cell mass cell proliferation(GO:0001833) |
| 0.2 | 0.7 | GO:0046015 | regulation of transcription by glucose(GO:0046015) |
| 0.2 | 0.2 | GO:0002317 | plasma cell differentiation(GO:0002317) |
| 0.2 | 1.0 | GO:1903173 | phytol metabolic process(GO:0033306) fatty alcohol metabolic process(GO:1903173) |
| 0.2 | 2.4 | GO:0045776 | negative regulation of blood pressure(GO:0045776) |
| 0.2 | 1.4 | GO:0008626 | granzyme-mediated apoptotic signaling pathway(GO:0008626) |
| 0.2 | 3.6 | GO:0015721 | bile acid and bile salt transport(GO:0015721) |
| 0.2 | 0.9 | GO:0021952 | central nervous system projection neuron axonogenesis(GO:0021952) |
| 0.2 | 0.7 | GO:0015732 | prostaglandin transport(GO:0015732) |
| 0.2 | 2.5 | GO:0006688 | glycosphingolipid biosynthetic process(GO:0006688) |
| 0.2 | 0.7 | GO:0015014 | heparan sulfate proteoglycan biosynthetic process, polysaccharide chain biosynthetic process(GO:0015014) |
| 0.2 | 1.1 | GO:1902231 | positive regulation of intrinsic apoptotic signaling pathway in response to DNA damage(GO:1902231) |
| 0.2 | 1.1 | GO:0060252 | positive regulation of glial cell proliferation(GO:0060252) |
| 0.2 | 7.8 | GO:0070884 | regulation of calcineurin-NFAT signaling cascade(GO:0070884) |
| 0.2 | 1.6 | GO:0048485 | sympathetic nervous system development(GO:0048485) |
| 0.2 | 1.8 | GO:0071493 | cellular response to UV-B(GO:0071493) |
| 0.2 | 0.4 | GO:0072114 | pronephros morphogenesis(GO:0072114) |
| 0.2 | 1.7 | GO:0048333 | mesodermal cell differentiation(GO:0048333) |
| 0.2 | 1.3 | GO:0071467 | cellular response to pH(GO:0071467) |
| 0.2 | 0.9 | GO:2000178 | negative regulation of neural precursor cell proliferation(GO:2000178) |
| 0.2 | 1.3 | GO:0051665 | membrane raft localization(GO:0051665) |
| 0.2 | 35.0 | GO:0060271 | cilium morphogenesis(GO:0060271) |
| 0.2 | 0.4 | GO:0007182 | common-partner SMAD protein phosphorylation(GO:0007182) |
| 0.2 | 1.0 | GO:0007638 | mechanosensory behavior(GO:0007638) |
| 0.2 | 1.2 | GO:0021544 | subpallium development(GO:0021544) striatum development(GO:0021756) |
| 0.2 | 1.0 | GO:0015886 | heme transport(GO:0015886) |
| 0.2 | 1.4 | GO:0071447 | cellular response to hydroperoxide(GO:0071447) |
| 0.2 | 2.2 | GO:0042135 | neurotransmitter catabolic process(GO:0042135) |
| 0.2 | 5.6 | GO:0007528 | neuromuscular junction development(GO:0007528) |
| 0.2 | 0.6 | GO:2000535 | regulation of entry of bacterium into host cell(GO:2000535) |
| 0.2 | 1.0 | GO:0008063 | Toll signaling pathway(GO:0008063) |
| 0.2 | 0.4 | GO:0044804 | nucleophagy(GO:0044804) |
| 0.2 | 0.4 | GO:0048840 | otolith development(GO:0048840) |
| 0.2 | 1.5 | GO:2000251 | positive regulation of actin cytoskeleton reorganization(GO:2000251) |
| 0.2 | 0.6 | GO:0002949 | tRNA threonylcarbamoyladenosine modification(GO:0002949) |
| 0.2 | 0.4 | GO:0070562 | regulation of vitamin D receptor signaling pathway(GO:0070562) |
| 0.2 | 1.7 | GO:0007628 | adult walking behavior(GO:0007628) |
| 0.2 | 1.4 | GO:0032715 | negative regulation of interleukin-6 production(GO:0032715) |
| 0.2 | 0.7 | GO:1903556 | negative regulation of tumor necrosis factor production(GO:0032720) negative regulation of tumor necrosis factor superfamily cytokine production(GO:1903556) |
| 0.2 | 0.7 | GO:0034122 | negative regulation of toll-like receptor signaling pathway(GO:0034122) |
| 0.2 | 3.2 | GO:0016973 | poly(A)+ mRNA export from nucleus(GO:0016973) |
| 0.2 | 0.7 | GO:1900113 | negative regulation of histone H3-K9 trimethylation(GO:1900113) |
| 0.2 | 2.4 | GO:0050982 | detection of mechanical stimulus(GO:0050982) |
| 0.2 | 1.7 | GO:1904978 | regulation of endosome organization(GO:1904978) |
| 0.2 | 0.8 | GO:0045671 | negative regulation of osteoclast differentiation(GO:0045671) |
| 0.2 | 1.3 | GO:0031087 | deadenylation-independent decapping of nuclear-transcribed mRNA(GO:0031087) |
| 0.2 | 0.6 | GO:0007625 | grooming behavior(GO:0007625) |
| 0.2 | 0.6 | GO:2000346 | negative regulation of hepatocyte proliferation(GO:2000346) |
| 0.2 | 0.5 | GO:0036123 | histone H3-K9 dimethylation(GO:0036123) |
| 0.2 | 0.2 | GO:0033004 | negative regulation of mast cell activation(GO:0033004) |
| 0.2 | 2.1 | GO:0007193 | adenylate cyclase-inhibiting G-protein coupled receptor signaling pathway(GO:0007193) |
| 0.2 | 5.7 | GO:1904893 | negative regulation of JAK-STAT cascade(GO:0046426) negative regulation of STAT cascade(GO:1904893) |
| 0.2 | 0.5 | GO:0006391 | transcription initiation from mitochondrial promoter(GO:0006391) |
| 0.2 | 1.9 | GO:0035873 | lactate transport(GO:0015727) lactate transmembrane transport(GO:0035873) |
| 0.2 | 0.9 | GO:0014002 | astrocyte development(GO:0014002) |
| 0.2 | 0.5 | GO:0050951 | sensory perception of temperature stimulus(GO:0050951) |
| 0.2 | 8.9 | GO:0003333 | amino acid transmembrane transport(GO:0003333) |
| 0.2 | 0.3 | GO:0021548 | pons development(GO:0021548) |
| 0.2 | 1.7 | GO:0006706 | steroid catabolic process(GO:0006706) |
| 0.2 | 2.0 | GO:0042551 | neuron maturation(GO:0042551) |
| 0.2 | 0.6 | GO:1904100 | regulation of protein O-linked glycosylation(GO:1904098) positive regulation of protein O-linked glycosylation(GO:1904100) |
| 0.2 | 0.8 | GO:0010669 | epithelial structure maintenance(GO:0010669) |
| 0.2 | 0.3 | GO:1904948 | midbrain dopaminergic neuron differentiation(GO:1904948) |
| 0.1 | 1.6 | GO:0006516 | glycoprotein catabolic process(GO:0006516) |
| 0.1 | 0.9 | GO:0002455 | humoral immune response mediated by circulating immunoglobulin(GO:0002455) |
| 0.1 | 4.6 | GO:0007189 | adenylate cyclase-activating G-protein coupled receptor signaling pathway(GO:0007189) |
| 0.1 | 0.7 | GO:0007549 | dosage compensation(GO:0007549) dosage compensation by inactivation of X chromosome(GO:0009048) |
| 0.1 | 0.4 | GO:0015691 | cadmium ion transport(GO:0015691) cadmium ion transmembrane transport(GO:0070574) |
| 0.1 | 0.4 | GO:0050893 | sensory processing(GO:0050893) |
| 0.1 | 0.8 | GO:0030213 | hyaluronan biosynthetic process(GO:0030213) |
| 0.1 | 1.7 | GO:0051181 | cofactor transport(GO:0051181) |
| 0.1 | 0.7 | GO:2000286 | receptor internalization involved in canonical Wnt signaling pathway(GO:2000286) |
| 0.1 | 2.6 | GO:0050853 | B cell receptor signaling pathway(GO:0050853) |
| 0.1 | 1.8 | GO:0034497 | protein localization to pre-autophagosomal structure(GO:0034497) |
| 0.1 | 1.0 | GO:0035162 | embryonic hemopoiesis(GO:0035162) |
| 0.1 | 1.4 | GO:0043983 | histone H4-K12 acetylation(GO:0043983) |
| 0.1 | 0.4 | GO:0051127 | positive regulation of actin nucleation(GO:0051127) |
| 0.1 | 0.7 | GO:0071941 | nitrogen cycle metabolic process(GO:0071941) |
| 0.1 | 0.3 | GO:0050995 | negative regulation of lipid catabolic process(GO:0050995) |
| 0.1 | 0.3 | GO:1902363 | regulation of spindle elongation(GO:0032887) regulation of mitotic spindle elongation(GO:0032888) anastral spindle assembly(GO:0055048) protein localization to spindle pole body(GO:0071988) regulation of protein localization to spindle pole body(GO:1902363) positive regulation of protein localization to spindle pole body(GO:1902365) positive regulation of mitotic spindle elongation(GO:1902846) |
| 0.1 | 0.3 | GO:0050884 | neuromuscular process controlling posture(GO:0050884) |
| 0.1 | 0.9 | GO:0010804 | negative regulation of tumor necrosis factor-mediated signaling pathway(GO:0010804) |
| 0.1 | 0.5 | GO:2000389 | neutrophil extravasation(GO:0072672) regulation of neutrophil extravasation(GO:2000389) |
| 0.1 | 0.5 | GO:2000311 | regulation of alpha-amino-3-hydroxy-5-methyl-4-isoxazole propionate selective glutamate receptor activity(GO:2000311) |
| 0.1 | 0.6 | GO:0017183 | peptidyl-diphthamide metabolic process(GO:0017182) peptidyl-diphthamide biosynthetic process from peptidyl-histidine(GO:0017183) |
| 0.1 | 2.1 | GO:0032011 | ARF protein signal transduction(GO:0032011) |
| 0.1 | 0.1 | GO:0021889 | olfactory bulb interneuron differentiation(GO:0021889) |
| 0.1 | 1.1 | GO:0060397 | JAK-STAT cascade involved in growth hormone signaling pathway(GO:0060397) |
| 0.1 | 0.1 | GO:0097154 | GABAergic neuron differentiation(GO:0097154) |
| 0.1 | 0.3 | GO:0048387 | negative regulation of retinoic acid receptor signaling pathway(GO:0048387) |
| 0.1 | 0.3 | GO:0034334 | adherens junction maintenance(GO:0034334) |
| 0.1 | 1.1 | GO:0033539 | fatty acid beta-oxidation using acyl-CoA dehydrogenase(GO:0033539) |
| 0.1 | 0.2 | GO:0032703 | negative regulation of interleukin-2 production(GO:0032703) |
| 0.1 | 0.4 | GO:0009954 | proximal/distal pattern formation(GO:0009954) |
| 0.1 | 0.5 | GO:0019368 | fatty acid elongation, saturated fatty acid(GO:0019367) fatty acid elongation, unsaturated fatty acid(GO:0019368) fatty acid elongation, monounsaturated fatty acid(GO:0034625) fatty acid elongation, polyunsaturated fatty acid(GO:0034626) |
| 0.1 | 0.1 | GO:0032675 | regulation of interleukin-6 production(GO:0032675) |
| 0.1 | 0.5 | GO:0030514 | negative regulation of BMP signaling pathway(GO:0030514) |
| 0.1 | 0.4 | GO:0033314 | mitotic DNA replication checkpoint(GO:0033314) |
| 0.1 | 0.1 | GO:0032753 | positive regulation of interleukin-4 production(GO:0032753) |
| 0.0 | 0.5 | GO:0071157 | negative regulation of cell cycle arrest(GO:0071157) |
| 0.0 | 1.1 | GO:0097435 | fibril organization(GO:0097435) |
| 0.0 | 0.1 | GO:1903031 | regulation of microtubule plus-end binding(GO:1903031) positive regulation of microtubule plus-end binding(GO:1903033) |
| 0.0 | 0.2 | GO:0070781 | response to biotin(GO:0070781) |
| 0.0 | 0.4 | GO:0055075 | potassium ion homeostasis(GO:0055075) |
| 0.0 | 0.2 | GO:0008090 | retrograde axonal transport(GO:0008090) |
| 0.0 | 0.1 | GO:0016999 | antibiotic metabolic process(GO:0016999) |
| 0.0 | 0.3 | GO:0070537 | histone H2A K63-linked deubiquitination(GO:0070537) |
| 0.0 | 0.7 | GO:0045026 | plasma membrane fusion(GO:0045026) |
| 0.0 | 0.2 | GO:0006657 | CDP-choline pathway(GO:0006657) |
| 0.0 | 0.2 | GO:0046391 | 5-phosphoribose 1-diphosphate biosynthetic process(GO:0006015) 5-phosphoribose 1-diphosphate metabolic process(GO:0046391) |
| 0.0 | 0.7 | GO:0071108 | protein K48-linked deubiquitination(GO:0071108) |
| 0.0 | 0.2 | GO:0060976 | coronary vasculature development(GO:0060976) |
| 0.0 | 1.4 | GO:0006687 | glycosphingolipid metabolic process(GO:0006687) |
| 0.0 | 0.0 | GO:0072017 | distal tubule development(GO:0072017) |
| 0.0 | 0.2 | GO:0050919 | negative chemotaxis(GO:0050919) |
| 0.0 | 0.1 | GO:0035330 | regulation of hippo signaling(GO:0035330) |
| 0.0 | 0.0 | GO:1901727 | positive regulation of histone deacetylase activity(GO:1901727) |
Gene overrepresentation in cellular component category:
| Log-likelihood per target | Total log-likelihood | Term | Description |
|---|---|---|---|
| 33.0 | 429.4 | GO:0098647 | collagen type VI trimer(GO:0005589) collagen beaded filament(GO:0098647) |
| 13.3 | 39.9 | GO:0009328 | phenylalanine-tRNA ligase complex(GO:0009328) |
| 8.6 | 34.4 | GO:0031838 | haptoglobin-hemoglobin complex(GO:0031838) |
| 7.3 | 95.4 | GO:0005833 | hemoglobin complex(GO:0005833) |
| 6.5 | 103.8 | GO:0097512 | cardiac myofibril(GO:0097512) |
| 6.5 | 51.8 | GO:0005579 | membrane attack complex(GO:0005579) |
| 6.3 | 19.0 | GO:0097229 | sperm end piece(GO:0097229) |
| 6.1 | 18.3 | GO:0030485 | smooth muscle contractile fiber(GO:0030485) |
| 5.9 | 23.5 | GO:0000801 | central element(GO:0000801) |
| 5.8 | 23.1 | GO:0071546 | pi-body(GO:0071546) |
| 5.6 | 16.9 | GO:0090571 | RNA polymerase II transcription repressor complex(GO:0090571) |
| 5.5 | 16.4 | GO:0071752 | dimeric IgA immunoglobulin complex(GO:0071750) secretory dimeric IgA immunoglobulin complex(GO:0071752) |
| 4.6 | 13.8 | GO:0005944 | phosphatidylinositol 3-kinase complex, class IB(GO:0005944) |
| 4.5 | 53.9 | GO:0036454 | insulin-like growth factor binding protein complex(GO:0016942) growth factor complex(GO:0036454) |
| 4.1 | 61.7 | GO:0097418 | neurofibrillary tangle(GO:0097418) |
| 3.9 | 23.3 | GO:1990316 | ATG1/ULK1 kinase complex(GO:1990316) |
| 3.8 | 57.7 | GO:0030478 | actin cap(GO:0030478) |
| 3.7 | 3.7 | GO:0097679 | other organism cytoplasm(GO:0097679) |
| 3.7 | 44.8 | GO:0016013 | syntrophin complex(GO:0016013) |
| 3.7 | 22.2 | GO:0044279 | other organism cell membrane(GO:0044218) other organism membrane(GO:0044279) |
| 3.7 | 11.0 | GO:0031085 | BLOC-3 complex(GO:0031085) |
| 3.6 | 10.7 | GO:0065010 | extracellular membrane-bounded organelle(GO:0065010) |
| 3.6 | 14.2 | GO:0030895 | apolipoprotein B mRNA editing enzyme complex(GO:0030895) |
| 3.6 | 24.9 | GO:0030991 | intraciliary transport particle A(GO:0030991) |
| 3.5 | 28.3 | GO:0061689 | tricellular tight junction(GO:0061689) |
| 3.4 | 13.6 | GO:0002080 | acrosomal membrane(GO:0002080) |
| 3.3 | 23.2 | GO:0033655 | host cell cytoplasm(GO:0030430) host cell cytoplasm part(GO:0033655) |
| 3.3 | 62.5 | GO:0042613 | MHC class II protein complex(GO:0042613) |
| 3.2 | 9.7 | GO:0033011 | perinuclear theca(GO:0033011) cytoskeletal calyx(GO:0033150) |
| 3.2 | 22.5 | GO:0097025 | MPP7-DLG1-LIN7 complex(GO:0097025) |
| 2.9 | 20.4 | GO:0036021 | endolysosome lumen(GO:0036021) |
| 2.8 | 55.4 | GO:0001527 | microfibril(GO:0001527) fibril(GO:0043205) |
| 2.6 | 31.7 | GO:0097486 | multivesicular body lumen(GO:0097486) |
| 2.6 | 13.0 | GO:0032807 | DNA ligase IV complex(GO:0032807) |
| 2.6 | 2.6 | GO:0097013 | phagocytic vesicle lumen(GO:0097013) |
| 2.6 | 7.7 | GO:0044609 | DBIRD complex(GO:0044609) |
| 2.5 | 15.2 | GO:0002177 | manchette(GO:0002177) |
| 2.5 | 7.6 | GO:0035354 | Toll-like receptor 1-Toll-like receptor 2 protein complex(GO:0035354) |
| 2.5 | 9.9 | GO:1990879 | CST complex(GO:1990879) |
| 2.5 | 17.3 | GO:0097209 | epidermal lamellar body(GO:0097209) |
| 2.4 | 14.6 | GO:0032437 | cuticular plate(GO:0032437) |
| 2.4 | 7.3 | GO:0098536 | deuterosome(GO:0098536) |
| 2.4 | 9.6 | GO:0042272 | nuclear RNA export factor complex(GO:0042272) |
| 2.4 | 7.1 | GO:0005953 | CAAX-protein geranylgeranyltransferase complex(GO:0005953) |
| 2.3 | 16.2 | GO:1990745 | EARP complex(GO:1990745) |
| 2.2 | 11.2 | GO:0044305 | calyx of Held(GO:0044305) |
| 2.2 | 4.5 | GO:0035869 | ciliary transition zone(GO:0035869) |
| 2.2 | 42.1 | GO:0036038 | MKS complex(GO:0036038) |
| 2.2 | 12.9 | GO:0005879 | axonemal microtubule(GO:0005879) |
| 2.1 | 15.0 | GO:0008282 | ATP-sensitive potassium channel complex(GO:0008282) |
| 2.1 | 10.6 | GO:0005947 | mitochondrial alpha-ketoglutarate dehydrogenase complex(GO:0005947) |
| 2.1 | 41.5 | GO:0031089 | platelet dense granule lumen(GO:0031089) |
| 2.1 | 6.2 | GO:0097224 | sperm connecting piece(GO:0097224) |
| 2.0 | 6.1 | GO:0005760 | gamma DNA polymerase complex(GO:0005760) |
| 2.0 | 16.0 | GO:0034464 | BBSome(GO:0034464) |
| 2.0 | 14.0 | GO:0035686 | sperm fibrous sheath(GO:0035686) |
| 2.0 | 5.9 | GO:0071065 | alpha9-beta1 integrin-vascular cell adhesion molecule-1 complex(GO:0071065) |
| 2.0 | 35.4 | GO:0042622 | photoreceptor outer segment membrane(GO:0042622) |
| 1.9 | 5.8 | GO:0033263 | CORVET complex(GO:0033263) |
| 1.9 | 26.2 | GO:1990712 | HFE-transferrin receptor complex(GO:1990712) |
| 1.9 | 16.8 | GO:0070652 | HAUS complex(GO:0070652) |
| 1.9 | 7.5 | GO:0005602 | complement component C1 complex(GO:0005602) |
| 1.9 | 3.7 | GO:0071438 | invadopodium membrane(GO:0071438) |
| 1.8 | 25.7 | GO:0030123 | AP-3 adaptor complex(GO:0030123) |
| 1.8 | 7.1 | GO:0002945 | cyclin K-CDK13 complex(GO:0002945) |
| 1.8 | 7.0 | GO:0038038 | G-protein coupled receptor homodimeric complex(GO:0038038) |
| 1.8 | 7.0 | GO:0035841 | growing cell tip(GO:0035838) new growing cell tip(GO:0035841) |
| 1.8 | 3.5 | GO:0005965 | protein farnesyltransferase complex(GO:0005965) |
| 1.7 | 24.0 | GO:0098839 | postsynaptic density membrane(GO:0098839) |
| 1.7 | 5.1 | GO:0070931 | Golgi-associated vesicle lumen(GO:0070931) |
| 1.7 | 22.3 | GO:0005583 | fibrillar collagen trimer(GO:0005583) banded collagen fibril(GO:0098643) |
| 1.7 | 20.4 | GO:0005577 | fibrinogen complex(GO:0005577) |
| 1.7 | 8.5 | GO:0019815 | B cell receptor complex(GO:0019815) |
| 1.7 | 8.5 | GO:0032280 | symmetric synapse(GO:0032280) |
| 1.7 | 33.8 | GO:0033270 | paranode region of axon(GO:0033270) |
| 1.7 | 15.1 | GO:0046696 | lipopolysaccharide receptor complex(GO:0046696) |
| 1.7 | 1.7 | GO:0034678 | integrin alpha8-beta1 complex(GO:0034678) |
| 1.7 | 14.9 | GO:0032133 | chromosome passenger complex(GO:0032133) |
| 1.6 | 11.4 | GO:0033391 | chromatoid body(GO:0033391) |
| 1.6 | 14.6 | GO:0097524 | sperm plasma membrane(GO:0097524) |
| 1.6 | 76.8 | GO:0001533 | cornified envelope(GO:0001533) |
| 1.6 | 8.0 | GO:0005896 | interleukin-6 receptor complex(GO:0005896) |
| 1.6 | 6.3 | GO:0034366 | spherical high-density lipoprotein particle(GO:0034366) |
| 1.5 | 7.7 | GO:0031302 | intrinsic component of endosome membrane(GO:0031302) |
| 1.5 | 33.7 | GO:0001518 | voltage-gated sodium channel complex(GO:0001518) |
| 1.5 | 4.5 | GO:1990622 | CHOP-ATF3 complex(GO:1990622) |
| 1.5 | 7.5 | GO:0036128 | CatSper complex(GO:0036128) |
| 1.5 | 3.0 | GO:0031906 | late endosome lumen(GO:0031906) |
| 1.5 | 1.5 | GO:0034666 | integrin alpha2-beta1 complex(GO:0034666) |
| 1.5 | 3.0 | GO:1990393 | 3M complex(GO:1990393) |
| 1.5 | 5.9 | GO:0005889 | hydrogen:potassium-exchanging ATPase complex(GO:0005889) |
| 1.5 | 5.8 | GO:0005899 | insulin receptor complex(GO:0005899) |
| 1.4 | 5.7 | GO:0070876 | SOSS complex(GO:0070876) |
| 1.4 | 9.8 | GO:0035976 | AP1 complex(GO:0035976) |
| 1.4 | 2.8 | GO:0071062 | alphav-beta3 integrin-vitronectin complex(GO:0071062) |
| 1.4 | 29.2 | GO:0090533 | cation-transporting ATPase complex(GO:0090533) |
| 1.4 | 20.5 | GO:0043020 | NADPH oxidase complex(GO:0043020) |
| 1.4 | 16.3 | GO:0097539 | ciliary transition fiber(GO:0097539) |
| 1.4 | 14.9 | GO:0005847 | mRNA cleavage and polyadenylation specificity factor complex(GO:0005847) |
| 1.4 | 10.8 | GO:0014701 | junctional sarcoplasmic reticulum membrane(GO:0014701) |
| 1.3 | 6.7 | GO:0071458 | integral component of cytoplasmic side of endoplasmic reticulum membrane(GO:0071458) |
| 1.3 | 6.7 | GO:0034448 | EGO complex(GO:0034448) Gtr1-Gtr2 GTPase complex(GO:1990131) |
| 1.3 | 12.0 | GO:0000137 | Golgi cis cisterna(GO:0000137) |
| 1.3 | 5.3 | GO:0005968 | Rab-protein geranylgeranyltransferase complex(GO:0005968) |
| 1.3 | 6.6 | GO:0044322 | endoplasmic reticulum quality control compartment(GO:0044322) |
| 1.3 | 5.1 | GO:0070578 | RISC-loading complex(GO:0070578) |
| 1.3 | 3.8 | GO:0033593 | BRCA2-MAGE-D1 complex(GO:0033593) |
| 1.3 | 1.3 | GO:0098984 | neuron to neuron synapse(GO:0098984) |
| 1.3 | 6.3 | GO:1902937 | inward rectifier potassium channel complex(GO:1902937) |
| 1.2 | 21.2 | GO:0042627 | chylomicron(GO:0042627) |
| 1.2 | 5.0 | GO:0060091 | kinocilium(GO:0060091) |
| 1.2 | 2.4 | GO:0071754 | IgM immunoglobulin complex(GO:0071753) IgM immunoglobulin complex, circulating(GO:0071754) pentameric IgM immunoglobulin complex(GO:0071756) |
| 1.2 | 26.6 | GO:0014731 | spectrin-associated cytoskeleton(GO:0014731) |
| 1.2 | 77.7 | GO:0005581 | collagen trimer(GO:0005581) |
| 1.2 | 7.1 | GO:0034673 | inhibin-betaglycan-ActRII complex(GO:0034673) |
| 1.2 | 2.4 | GO:0034706 | sodium channel complex(GO:0034706) |
| 1.1 | 4.6 | GO:0000818 | nuclear MIS12/MIND complex(GO:0000818) |
| 1.1 | 10.3 | GO:0030061 | mitochondrial crista(GO:0030061) |
| 1.1 | 45.6 | GO:1902711 | GABA-A receptor complex(GO:1902711) |
| 1.1 | 3.4 | GO:0036398 | TCR signalosome(GO:0036398) |
| 1.1 | 9.0 | GO:0030868 | smooth endoplasmic reticulum membrane(GO:0030868) smooth endoplasmic reticulum part(GO:0097425) |
| 1.1 | 4.4 | GO:0005916 | fascia adherens(GO:0005916) |
| 1.1 | 8.8 | GO:0097442 | CA3 pyramidal cell dendrite(GO:0097442) |
| 1.1 | 8.8 | GO:0043203 | axon hillock(GO:0043203) |
| 1.1 | 13.0 | GO:0046658 | anchored component of plasma membrane(GO:0046658) |
| 1.1 | 5.3 | GO:0097165 | nuclear stress granule(GO:0097165) |
| 1.0 | 181.6 | GO:0072562 | blood microparticle(GO:0072562) |
| 1.0 | 40.8 | GO:0001917 | photoreceptor inner segment(GO:0001917) |
| 1.0 | 124.2 | GO:0005796 | Golgi lumen(GO:0005796) |
| 1.0 | 2.1 | GO:0031232 | extrinsic component of external side of plasma membrane(GO:0031232) |
| 1.0 | 39.6 | GO:0034707 | chloride channel complex(GO:0034707) |
| 1.0 | 75.5 | GO:0031526 | brush border membrane(GO:0031526) |
| 1.0 | 56.6 | GO:0005891 | voltage-gated calcium channel complex(GO:0005891) |
| 1.0 | 4.8 | GO:0035253 | ciliary rootlet(GO:0035253) |
| 1.0 | 35.7 | GO:0034451 | centriolar satellite(GO:0034451) |
| 0.9 | 0.9 | GO:0099634 | postsynaptic specialization membrane(GO:0099634) |
| 0.9 | 15.1 | GO:0035102 | PRC1 complex(GO:0035102) |
| 0.9 | 5.7 | GO:0071953 | elastic fiber(GO:0071953) |
| 0.9 | 3.7 | GO:0034681 | integrin alpha11-beta1 complex(GO:0034681) |
| 0.9 | 3.7 | GO:0034685 | integrin alphav-beta6 complex(GO:0034685) |
| 0.9 | 8.3 | GO:0000813 | ESCRT I complex(GO:0000813) |
| 0.9 | 2.7 | GO:0072536 | interleukin-23 receptor complex(GO:0072536) |
| 0.9 | 6.3 | GO:0030897 | HOPS complex(GO:0030897) |
| 0.9 | 10.7 | GO:0016461 | unconventional myosin complex(GO:0016461) |
| 0.9 | 2.7 | GO:0001520 | outer dense fiber(GO:0001520) |
| 0.9 | 4.4 | GO:0030896 | checkpoint clamp complex(GO:0030896) |
| 0.9 | 2.6 | GO:0098636 | protein complex involved in cell adhesion(GO:0098636) |
| 0.9 | 14.7 | GO:0034364 | high-density lipoprotein particle(GO:0034364) |
| 0.9 | 29.2 | GO:0009925 | basal plasma membrane(GO:0009925) |
| 0.9 | 19.6 | GO:0042629 | mast cell granule(GO:0042629) |
| 0.8 | 1.7 | GO:0036026 | protein C inhibitor-TMPRSS7 complex(GO:0036024) protein C inhibitor-TMPRSS11E complex(GO:0036025) protein C inhibitor-PLAT complex(GO:0036026) protein C inhibitor-PLAU complex(GO:0036027) protein C inhibitor-thrombin complex(GO:0036028) protein C inhibitor-KLK3 complex(GO:0036029) protein C inhibitor-plasma kallikrein complex(GO:0036030) serine protease inhibitor complex(GO:0097180) protein C inhibitor-coagulation factor V complex(GO:0097181) protein C inhibitor-coagulation factor Xa complex(GO:0097182) protein C inhibitor-coagulation factor XI complex(GO:0097183) |
| 0.8 | 5.1 | GO:1990769 | proximal neuron projection(GO:1990769) |
| 0.8 | 10.8 | GO:0036057 | filtration diaphragm(GO:0036056) slit diaphragm(GO:0036057) |
| 0.8 | 5.8 | GO:0042406 | extrinsic component of endoplasmic reticulum membrane(GO:0042406) |
| 0.8 | 23.9 | GO:0005892 | acetylcholine-gated channel complex(GO:0005892) |
| 0.8 | 4.1 | GO:0000120 | RNA polymerase I transcription factor complex(GO:0000120) |
| 0.8 | 31.2 | GO:0005859 | muscle myosin complex(GO:0005859) |
| 0.8 | 2.4 | GO:0008275 | gamma-tubulin small complex(GO:0008275) |
| 0.8 | 5.7 | GO:0008024 | cyclin/CDK positive transcription elongation factor complex(GO:0008024) |
| 0.8 | 6.5 | GO:0097504 | Gemini of coiled bodies(GO:0097504) |
| 0.8 | 0.8 | GO:0034688 | integrin alphaM-beta2 complex(GO:0034688) |
| 0.8 | 0.8 | GO:0031227 | intrinsic component of endoplasmic reticulum membrane(GO:0031227) |
| 0.8 | 6.3 | GO:0072487 | MSL complex(GO:0072487) |
| 0.8 | 20.3 | GO:0044298 | neuronal cell body membrane(GO:0032809) cell body membrane(GO:0044298) |
| 0.8 | 14.6 | GO:0031233 | intrinsic component of external side of plasma membrane(GO:0031233) |
| 0.8 | 15.4 | GO:0032391 | photoreceptor connecting cilium(GO:0032391) |
| 0.8 | 3.8 | GO:0016011 | dystroglycan complex(GO:0016011) sarcoglycan complex(GO:0016012) |
| 0.8 | 225.4 | GO:0005578 | proteinaceous extracellular matrix(GO:0005578) |
| 0.8 | 8.4 | GO:0071437 | invadopodium(GO:0071437) |
| 0.8 | 3.0 | GO:1990851 | Wnt-Frizzled-LRP5/6 complex(GO:1990851) |
| 0.7 | 4.5 | GO:0042827 | platelet dense granule(GO:0042827) |
| 0.7 | 5.2 | GO:0005883 | neurofilament(GO:0005883) |
| 0.7 | 20.0 | GO:0043218 | compact myelin(GO:0043218) |
| 0.7 | 90.3 | GO:0034705 | voltage-gated potassium channel complex(GO:0008076) potassium channel complex(GO:0034705) |
| 0.7 | 0.7 | GO:0002081 | outer acrosomal membrane(GO:0002081) |
| 0.7 | 13.3 | GO:0005922 | connexon complex(GO:0005922) |
| 0.7 | 2.9 | GO:0097123 | cyclin A1-CDK2 complex(GO:0097123) |
| 0.7 | 7.4 | GO:0031462 | Cul2-RING ubiquitin ligase complex(GO:0031462) |
| 0.7 | 2.2 | GO:0043293 | apoptosome(GO:0043293) |
| 0.7 | 5.7 | GO:1903440 | calcitonin family receptor complex(GO:1903439) amylin receptor complex(GO:1903440) |
| 0.7 | 1.4 | GO:0097135 | cyclin E2-CDK2 complex(GO:0097135) |
| 0.7 | 2.1 | GO:0017071 | intracellular cyclic nucleotide activated cation channel complex(GO:0017071) |
| 0.7 | 160.0 | GO:0016323 | basolateral plasma membrane(GO:0016323) |
| 0.7 | 4.9 | GO:0043196 | varicosity(GO:0043196) |
| 0.7 | 2.8 | GO:0005726 | perichromatin fibrils(GO:0005726) |
| 0.7 | 4.2 | GO:0046581 | intercellular canaliculus(GO:0046581) |
| 0.7 | 22.7 | GO:0080008 | Cul4-RING E3 ubiquitin ligase complex(GO:0080008) |
| 0.7 | 3.4 | GO:0000836 | ER ubiquitin ligase complex(GO:0000835) Hrd1p ubiquitin ligase complex(GO:0000836) |
| 0.7 | 3.4 | GO:0043083 | synaptic cleft(GO:0043083) |
| 0.7 | 8.8 | GO:0044300 | cerebellar mossy fiber(GO:0044300) |
| 0.7 | 17.7 | GO:0032590 | dendrite membrane(GO:0032590) |
| 0.7 | 4.0 | GO:0033063 | DNA recombinase mediator complex(GO:0033061) Rad51B-Rad51C-Rad51D-XRCC2 complex(GO:0033063) |
| 0.7 | 1.3 | GO:1990597 | AIP1-IRE1 complex(GO:1990597) |
| 0.7 | 37.3 | GO:0005902 | microvillus(GO:0005902) |
| 0.7 | 15.2 | GO:0031904 | endosome lumen(GO:0031904) |
| 0.6 | 66.9 | GO:0031225 | anchored component of membrane(GO:0031225) |
| 0.6 | 1.3 | GO:0045179 | apical cortex(GO:0045179) |
| 0.6 | 3.9 | GO:0034687 | integrin alphaL-beta2 complex(GO:0034687) |
| 0.6 | 26.2 | GO:0048786 | presynaptic active zone(GO:0048786) |
| 0.6 | 1.9 | GO:0030956 | glutamyl-tRNA(Gln) amidotransferase complex(GO:0030956) |
| 0.6 | 35.3 | GO:0036064 | ciliary basal body(GO:0036064) |
| 0.6 | 710.0 | GO:0005615 | extracellular space(GO:0005615) |
| 0.6 | 2.4 | GO:0097443 | sorting endosome(GO:0097443) |
| 0.6 | 5.3 | GO:0035068 | micro-ribonucleoprotein complex(GO:0035068) |
| 0.6 | 3.5 | GO:0009331 | glycerol-3-phosphate dehydrogenase complex(GO:0009331) |
| 0.6 | 1.8 | GO:0032009 | early phagosome(GO:0032009) |
| 0.6 | 9.2 | GO:0097542 | ciliary tip(GO:0097542) |
| 0.6 | 31.1 | GO:0009897 | external side of plasma membrane(GO:0009897) |
| 0.6 | 5.2 | GO:0060077 | inhibitory synapse(GO:0060077) |
| 0.6 | 1.7 | GO:0031251 | PAN complex(GO:0031251) |
| 0.6 | 2.3 | GO:0043541 | UDP-N-acetylglucosamine transferase complex(GO:0043541) |
| 0.6 | 6.2 | GO:0000808 | origin recognition complex(GO:0000808) nuclear origin of replication recognition complex(GO:0005664) |
| 0.6 | 13.4 | GO:0005801 | cis-Golgi network(GO:0005801) |
| 0.6 | 3.9 | GO:0070083 | clathrin-sculpted monoamine transport vesicle(GO:0070081) clathrin-sculpted monoamine transport vesicle membrane(GO:0070083) |
| 0.5 | 4.9 | GO:0005858 | axonemal dynein complex(GO:0005858) |
| 0.5 | 4.9 | GO:0071014 | post-mRNA release spliceosomal complex(GO:0071014) |
| 0.5 | 1.6 | GO:0097225 | sperm midpiece(GO:0097225) |
| 0.5 | 2.2 | GO:0031091 | platelet alpha granule(GO:0031091) |
| 0.5 | 2.6 | GO:0032444 | activin responsive factor complex(GO:0032444) |
| 0.5 | 1.1 | GO:0008074 | guanylate cyclase complex, soluble(GO:0008074) |
| 0.5 | 2.6 | GO:1990761 | growth cone lamellipodium(GO:1990761) |
| 0.5 | 4.6 | GO:0016342 | catenin complex(GO:0016342) |
| 0.5 | 4.9 | GO:0098533 | ATPase dependent transmembrane transport complex(GO:0098533) |
| 0.5 | 671.0 | GO:0005887 | integral component of plasma membrane(GO:0005887) |
| 0.5 | 14.3 | GO:0005791 | rough endoplasmic reticulum(GO:0005791) |
| 0.5 | 5.9 | GO:0097440 | apical dendrite(GO:0097440) |
| 0.4 | 4.9 | GO:0042587 | glycogen granule(GO:0042587) |
| 0.4 | 6.1 | GO:0048188 | Set1C/COMPASS complex(GO:0048188) |
| 0.4 | 5.1 | GO:0030992 | intraciliary transport particle B(GO:0030992) |
| 0.4 | 3.7 | GO:0097381 | photoreceptor disc membrane(GO:0097381) |
| 0.4 | 4.5 | GO:0097427 | microtubule bundle(GO:0097427) |
| 0.4 | 6.6 | GO:0005861 | troponin complex(GO:0005861) |
| 0.4 | 10.8 | GO:0031093 | platelet alpha granule lumen(GO:0031093) |
| 0.4 | 1.9 | GO:0005854 | nascent polypeptide-associated complex(GO:0005854) |
| 0.4 | 8.6 | GO:0031226 | intrinsic component of plasma membrane(GO:0031226) |
| 0.3 | 2.8 | GO:0042788 | polysomal ribosome(GO:0042788) |
| 0.3 | 8.7 | GO:0005901 | caveola(GO:0005901) |
| 0.3 | 2.9 | GO:0005964 | phosphorylase kinase complex(GO:0005964) |
| 0.3 | 5.2 | GO:0042734 | presynaptic membrane(GO:0042734) |
| 0.3 | 1.1 | GO:0044354 | pinosome(GO:0044352) macropinosome(GO:0044354) |
| 0.3 | 1.6 | GO:0097129 | cyclin D2-CDK4 complex(GO:0097129) |
| 0.3 | 9.6 | GO:0005930 | axoneme(GO:0005930) ciliary plasm(GO:0097014) |
| 0.3 | 11.1 | GO:0101003 | ficolin-1-rich granule membrane(GO:0101003) |
| 0.2 | 2.2 | GO:1990023 | mitotic spindle midzone(GO:1990023) |
| 0.2 | 2.6 | GO:0033588 | Elongator holoenzyme complex(GO:0033588) |
| 0.2 | 1.6 | GO:0035985 | senescence-associated heterochromatin focus(GO:0035985) |
| 0.2 | 13.2 | GO:0031463 | Cul3-RING ubiquitin ligase complex(GO:0031463) |
| 0.2 | 0.4 | GO:0034657 | GID complex(GO:0034657) |
| 0.2 | 1.2 | GO:0033553 | rDNA heterochromatin(GO:0033553) |
| 0.2 | 0.4 | GO:0030057 | desmosome(GO:0030057) |
| 0.2 | 1.0 | GO:0016533 | cyclin-dependent protein kinase 5 holoenzyme complex(GO:0016533) |
| 0.2 | 1.0 | GO:0070847 | core mediator complex(GO:0070847) |
| 0.2 | 530.2 | GO:0016021 | integral component of membrane(GO:0016021) |
| 0.2 | 1.1 | GO:0031313 | extrinsic component of endosome membrane(GO:0031313) |
| 0.2 | 2.1 | GO:0031082 | BLOC complex(GO:0031082) |
| 0.2 | 3.1 | GO:0032421 | stereocilium bundle(GO:0032421) |
| 0.2 | 2.1 | GO:0000800 | lateral element(GO:0000800) |
| 0.2 | 4.8 | GO:0035145 | exon-exon junction complex(GO:0035145) |
| 0.1 | 16.4 | GO:0030427 | site of polarized growth(GO:0030427) |
| 0.1 | 0.9 | GO:1990130 | Iml1 complex(GO:1990130) |
| 0.1 | 3.9 | GO:0000791 | euchromatin(GO:0000791) |
| 0.1 | 0.3 | GO:0000923 | equatorial microtubule organizing center(GO:0000923) |
| 0.1 | 2.4 | GO:0005942 | phosphatidylinositol 3-kinase complex(GO:0005942) |
| 0.1 | 0.5 | GO:0005915 | zonula adherens(GO:0005915) |
| 0.1 | 0.4 | GO:0005873 | plus-end kinesin complex(GO:0005873) |
| 0.1 | 6.7 | GO:0005814 | centriole(GO:0005814) |
| 0.1 | 0.2 | GO:0000805 | X chromosome(GO:0000805) |
| 0.1 | 0.7 | GO:0000145 | exocyst(GO:0000145) |
| 0.1 | 0.3 | GO:0032144 | 4-aminobutyrate transaminase complex(GO:0032144) |
| 0.1 | 0.2 | GO:0034274 | Atg12-Atg5-Atg16 complex(GO:0034274) |
| 0.1 | 2.8 | GO:0031907 | peroxisomal matrix(GO:0005782) microbody lumen(GO:0031907) |
| 0.0 | 0.2 | GO:0089701 | U2AF(GO:0089701) |
| 0.0 | 0.3 | GO:0008290 | F-actin capping protein complex(GO:0008290) |
| 0.0 | 0.1 | GO:0031045 | dense core granule(GO:0031045) |
| 0.0 | 0.1 | GO:0031415 | NatA complex(GO:0031415) |
| 0.0 | 0.1 | GO:0030915 | Smc5-Smc6 complex(GO:0030915) |
| 0.0 | 0.1 | GO:1990907 | beta-catenin-TCF complex(GO:1990907) |
Gene overrepresentation in molecular function category:
| Log-likelihood per target | Total log-likelihood | Term | Description |
|---|---|---|---|
| 14.3 | 42.9 | GO:0019959 | interleukin-8 binding(GO:0019959) |
| 9.9 | 69.5 | GO:0030492 | hemoglobin binding(GO:0030492) |
| 8.0 | 39.9 | GO:0004826 | phenylalanine-tRNA ligase activity(GO:0004826) |
| 6.7 | 6.7 | GO:0004031 | aldehyde oxidase activity(GO:0004031) |
| 6.6 | 39.6 | GO:0004430 | 1-phosphatidylinositol 4-kinase activity(GO:0004430) |
| 6.0 | 72.0 | GO:0005344 | oxygen transporter activity(GO:0005344) |
| 5.9 | 17.7 | GO:0005017 | platelet-derived growth factor-activated receptor activity(GO:0005017) |
| 5.8 | 69.6 | GO:0008430 | selenium binding(GO:0008430) |
| 5.6 | 28.0 | GO:0048248 | CXCR3 chemokine receptor binding(GO:0048248) |
| 5.5 | 43.7 | GO:0004024 | alcohol dehydrogenase activity, zinc-dependent(GO:0004024) |
| 5.4 | 32.5 | GO:0008273 | calcium, potassium:sodium antiporter activity(GO:0008273) |
| 5.4 | 474.1 | GO:0050840 | extracellular matrix binding(GO:0050840) |
| 5.3 | 16.0 | GO:0015234 | thiamine transmembrane transporter activity(GO:0015234) thiamine uptake transmembrane transporter activity(GO:0015403) |
| 5.0 | 15.1 | GO:0030350 | iron-responsive element binding(GO:0030350) |
| 4.8 | 19.1 | GO:0016434 | rRNA (cytosine) methyltransferase activity(GO:0016434) |
| 4.7 | 46.7 | GO:0005549 | odorant binding(GO:0005549) |
| 4.6 | 23.1 | GO:0005152 | interleukin-1 receptor antagonist activity(GO:0005152) |
| 4.6 | 13.8 | GO:0035662 | Toll-like receptor 4 binding(GO:0035662) |
| 4.6 | 22.8 | GO:0004522 | ribonuclease A activity(GO:0004522) |
| 4.4 | 17.7 | GO:0052595 | tryptamine:oxygen oxidoreductase (deaminating) activity(GO:0052593) aminoacetone:oxygen oxidoreductase(deaminating) activity(GO:0052594) aliphatic-amine oxidase activity(GO:0052595) phenethylamine:oxygen oxidoreductase (deaminating) activity(GO:0052596) |
| 4.4 | 13.2 | GO:0030305 | heparanase activity(GO:0030305) |
| 4.3 | 12.9 | GO:0005457 | GDP-fucose transmembrane transporter activity(GO:0005457) purine nucleotide-sugar transmembrane transporter activity(GO:0036080) |
| 4.3 | 128.8 | GO:0005212 | structural constituent of eye lens(GO:0005212) |
| 4.3 | 4.3 | GO:0047787 | enone reductase activity(GO:0035671) delta4-3-oxosteroid 5beta-reductase activity(GO:0047787) |
| 4.2 | 4.2 | GO:0038064 | collagen receptor activity(GO:0038064) |
| 4.1 | 4.1 | GO:0008988 | rRNA (adenine-N6-)-methyltransferase activity(GO:0008988) |
| 4.1 | 12.4 | GO:0004833 | tryptophan 2,3-dioxygenase activity(GO:0004833) |
| 4.1 | 32.6 | GO:0070892 | lipoteichoic acid receptor activity(GO:0070892) |
| 4.1 | 12.2 | GO:0031862 | prostanoid receptor binding(GO:0031862) |
| 4.0 | 40.2 | GO:0047498 | calcium-dependent phospholipase A2 activity(GO:0047498) |
| 4.0 | 12.0 | GO:0016833 | oxo-acid-lyase activity(GO:0016833) |
| 4.0 | 23.7 | GO:0015333 | peptide:proton symporter activity(GO:0015333) proton-dependent peptide secondary active transmembrane transporter activity(GO:0022897) |
| 3.8 | 34.5 | GO:0046974 | histone methyltransferase activity (H3-K9 specific)(GO:0046974) |
| 3.8 | 57.1 | GO:0005132 | type I interferon receptor binding(GO:0005132) |
| 3.8 | 353.8 | GO:0004984 | olfactory receptor activity(GO:0004984) |
| 3.8 | 11.4 | GO:0004144 | diacylglycerol O-acyltransferase activity(GO:0004144) |
| 3.7 | 11.2 | GO:0030171 | voltage-gated proton channel activity(GO:0030171) |
| 3.7 | 11.1 | GO:0005137 | interleukin-5 receptor binding(GO:0005137) |
| 3.7 | 18.3 | GO:0051120 | hepoxilin A3 synthase activity(GO:0051120) |
| 3.6 | 14.4 | GO:0004505 | phenylalanine 4-monooxygenase activity(GO:0004505) |
| 3.5 | 45.8 | GO:0097371 | MDM2/MDM4 family protein binding(GO:0097371) |
| 3.4 | 6.9 | GO:0005151 | interleukin-1, Type II receptor binding(GO:0005151) |
| 3.4 | 72.0 | GO:0001011 | transcription factor activity, sequence-specific DNA binding, RNA polymerase recruiting(GO:0001011) transcription factor activity, TFIIB-class binding(GO:0001087) |
| 3.4 | 10.3 | GO:0061609 | fructose-1-phosphate aldolase activity(GO:0061609) |
| 3.3 | 10.0 | GO:0016497 | substance K receptor activity(GO:0016497) |
| 3.3 | 16.4 | GO:0034875 | oxidoreductase activity, acting on CH or CH2 groups, quinone or similar compound as acceptor(GO:0033695) caffeine oxidase activity(GO:0034875) |
| 3.2 | 9.6 | GO:0008900 | hydrogen:potassium-exchanging ATPase activity(GO:0008900) |
| 3.2 | 28.6 | GO:0030884 | lipid antigen binding(GO:0030882) endogenous lipid antigen binding(GO:0030883) exogenous lipid antigen binding(GO:0030884) |
| 3.1 | 9.4 | GO:0003829 | beta-1,3-galactosyl-O-glycosyl-glycoprotein beta-1,6-N-acetylglucosaminyltransferase activity(GO:0003829) |
| 3.1 | 9.4 | GO:0004878 | complement component C5a receptor activity(GO:0004878) |
| 3.1 | 37.4 | GO:0031995 | insulin-like growth factor II binding(GO:0031995) |
| 3.1 | 9.3 | GO:0052798 | beta-galactoside alpha-2,3-sialyltransferase activity(GO:0052798) |
| 3.1 | 9.3 | GO:0015389 | pyrimidine- and adenine-specific:sodium symporter activity(GO:0015389) |
| 3.1 | 6.2 | GO:0043183 | vascular endothelial growth factor receptor 1 binding(GO:0043183) |
| 3.1 | 27.5 | GO:0004875 | complement receptor activity(GO:0004875) |
| 3.1 | 12.2 | GO:0032810 | sterol response element binding(GO:0032810) |
| 3.0 | 12.1 | GO:1904492 | Ac-Asp-Glu binding(GO:1904492) tetrahydrofolyl-poly(glutamate) polymer binding(GO:1904493) |
| 3.0 | 26.9 | GO:0047499 | calcium-independent phospholipase A2 activity(GO:0047499) |
| 3.0 | 8.9 | GO:0004336 | galactosylceramidase activity(GO:0004336) |
| 3.0 | 65.5 | GO:0016712 | oxidoreductase activity, acting on paired donors, with incorporation or reduction of molecular oxygen, reduced flavin or flavoprotein as one donor, and incorporation of one atom of oxygen(GO:0016712) |
| 3.0 | 29.6 | GO:0001042 | RNA polymerase I core binding(GO:0001042) |
| 3.0 | 29.6 | GO:0005237 | inhibitory extracellular ligand-gated ion channel activity(GO:0005237) |
| 3.0 | 8.9 | GO:0031727 | CCR2 chemokine receptor binding(GO:0031727) |
| 2.9 | 8.7 | GO:0002113 | interleukin-33 binding(GO:0002113) |
| 2.9 | 2.9 | GO:0047718 | geranylgeranyl reductase activity(GO:0045550) indanol dehydrogenase activity(GO:0047718) |
| 2.9 | 11.5 | GO:0005497 | androgen binding(GO:0005497) |
| 2.9 | 11.5 | GO:0004741 | [pyruvate dehydrogenase (lipoamide)] phosphatase activity(GO:0004741) |
| 2.9 | 31.5 | GO:0008559 | xenobiotic-transporting ATPase activity(GO:0008559) |
| 2.8 | 11.4 | GO:0004667 | prostaglandin-D synthase activity(GO:0004667) |
| 2.8 | 8.5 | GO:0031731 | CCR6 chemokine receptor binding(GO:0031731) |
| 2.8 | 39.5 | GO:0045159 | myosin II binding(GO:0045159) |
| 2.8 | 50.8 | GO:0004089 | carbonate dehydratase activity(GO:0004089) |
| 2.8 | 11.3 | GO:0038047 | beta-endorphin receptor activity(GO:0004979) morphine receptor activity(GO:0038047) |
| 2.8 | 11.1 | GO:0031728 | CCR3 chemokine receptor binding(GO:0031728) |
| 2.8 | 11.1 | GO:0015204 | urea transmembrane transporter activity(GO:0015204) |
| 2.8 | 13.9 | GO:0019862 | IgA binding(GO:0019862) |
| 2.8 | 22.1 | GO:0031811 | G-protein coupled nucleotide receptor binding(GO:0031811) P2Y1 nucleotide receptor binding(GO:0031812) |
| 2.7 | 13.7 | GO:0004945 | angiotensin receptor activity(GO:0001595) angiotensin type II receptor activity(GO:0004945) |
| 2.7 | 21.9 | GO:0005332 | gamma-aminobutyric acid:sodium symporter activity(GO:0005332) gamma-aminobutyric acid transmembrane transporter activity(GO:0015185) |
| 2.7 | 11.0 | GO:0016019 | peptidoglycan receptor activity(GO:0016019) |
| 2.7 | 10.9 | GO:0035373 | chondroitin sulfate proteoglycan binding(GO:0035373) |
| 2.7 | 32.8 | GO:0004065 | arylsulfatase activity(GO:0004065) |
| 2.7 | 2.7 | GO:0071723 | lipopeptide binding(GO:0071723) |
| 2.7 | 8.0 | GO:0045322 | unmethylated CpG binding(GO:0045322) |
| 2.7 | 40.0 | GO:0019957 | C-C chemokine binding(GO:0019957) |
| 2.6 | 7.9 | GO:0004022 | alcohol dehydrogenase (NAD) activity(GO:0004022) |
| 2.6 | 13.2 | GO:0004974 | leukotriene receptor activity(GO:0004974) |
| 2.6 | 5.2 | GO:0042289 | MHC class II protein binding(GO:0042289) |
| 2.6 | 31.5 | GO:0043855 | intracellular cyclic nucleotide activated cation channel activity(GO:0005221) cyclic nucleotide-gated ion channel activity(GO:0043855) |
| 2.6 | 7.9 | GO:0004165 | dodecenoyl-CoA delta-isomerase activity(GO:0004165) |
| 2.6 | 10.5 | GO:0005334 | norepinephrine:sodium symporter activity(GO:0005334) |
| 2.6 | 2.6 | GO:0047023 | androsterone dehydrogenase activity(GO:0047023) |
| 2.6 | 36.2 | GO:0032395 | MHC class II receptor activity(GO:0032395) |
| 2.6 | 15.4 | GO:0016929 | SUMO-specific protease activity(GO:0016929) |
| 2.6 | 18.0 | GO:0004499 | N,N-dimethylaniline monooxygenase activity(GO:0004499) |
| 2.6 | 10.3 | GO:0050119 | N-acetylglucosamine deacetylase activity(GO:0050119) |
| 2.6 | 10.3 | GO:0003875 | ADP-ribosylarginine hydrolase activity(GO:0003875) |
| 2.6 | 15.4 | GO:0016807 | cysteine-type carboxypeptidase activity(GO:0016807) cysteine-type exopeptidase activity(GO:0070004) |
| 2.6 | 10.2 | GO:0004769 | steroid delta-isomerase activity(GO:0004769) |
| 2.5 | 5.0 | GO:0032090 | Pyrin domain binding(GO:0032090) |
| 2.5 | 10.0 | GO:0016880 | glutamate-ammonia ligase activity(GO:0004356) ammonia ligase activity(GO:0016211) acid-ammonia (or amide) ligase activity(GO:0016880) |
| 2.5 | 2.5 | GO:0003846 | 2-acylglycerol O-acyltransferase activity(GO:0003846) |
| 2.5 | 49.6 | GO:0008510 | sodium:bicarbonate symporter activity(GO:0008510) |
| 2.5 | 29.7 | GO:0019911 | structural constituent of myelin sheath(GO:0019911) |
| 2.5 | 7.4 | GO:0036054 | protein-malonyllysine demalonylase activity(GO:0036054) protein-succinyllysine desuccinylase activity(GO:0036055) protein-glutaryllysine deglutarylase activity(GO:0061697) |
| 2.5 | 19.7 | GO:0015101 | organic cation transmembrane transporter activity(GO:0015101) |
| 2.5 | 9.8 | GO:0000309 | nicotinamide-nucleotide adenylyltransferase activity(GO:0000309) |
| 2.4 | 26.9 | GO:0008061 | chitinase activity(GO:0004568) chitin binding(GO:0008061) |
| 2.4 | 14.6 | GO:0004489 | methylenetetrahydrofolate reductase (NAD(P)H) activity(GO:0004489) |
| 2.4 | 4.9 | GO:0015198 | oligopeptide transporter activity(GO:0015198) oligopeptide transmembrane transporter activity(GO:0035673) |
| 2.4 | 14.6 | GO:0000179 | rRNA (adenine-N6,N6-)-dimethyltransferase activity(GO:0000179) |
| 2.4 | 4.9 | GO:0035663 | Toll-like receptor 2 binding(GO:0035663) |
| 2.4 | 9.7 | GO:0004687 | myosin light chain kinase activity(GO:0004687) |
| 2.4 | 43.6 | GO:0008395 | steroid hydroxylase activity(GO:0008395) |
| 2.4 | 4.8 | GO:0031716 | calcitonin receptor binding(GO:0031716) |
| 2.4 | 4.8 | GO:0004995 | tachykinin receptor activity(GO:0004995) |
| 2.4 | 7.1 | GO:0004662 | CAAX-protein geranylgeranyltransferase activity(GO:0004662) |
| 2.4 | 4.7 | GO:1990763 | arrestin family protein binding(GO:1990763) |
| 2.4 | 14.2 | GO:0017060 | 3-galactosyl-N-acetylglucosaminide 4-alpha-L-fucosyltransferase activity(GO:0017060) |
| 2.4 | 7.1 | GO:1990190 | peptide-glutamate-N-acetyltransferase activity(GO:1990190) |
| 2.3 | 14.0 | GO:0042285 | UDP-xylosyltransferase activity(GO:0035252) xylosyltransferase activity(GO:0042285) |
| 2.3 | 2.3 | GO:0070052 | collagen V binding(GO:0070052) |
| 2.3 | 6.9 | GO:0005333 | norepinephrine transmembrane transporter activity(GO:0005333) |
| 2.3 | 23.0 | GO:0017128 | phospholipid scramblase activity(GO:0017128) |
| 2.3 | 63.3 | GO:0008519 | ammonium transmembrane transporter activity(GO:0008519) |
| 2.3 | 4.5 | GO:0005138 | interleukin-6 receptor binding(GO:0005138) |
| 2.3 | 2.3 | GO:0061628 | H3K27me3 modified histone binding(GO:0061628) |
| 2.3 | 9.0 | GO:0016793 | dGTPase activity(GO:0008832) triphosphoric monoester hydrolase activity(GO:0016793) guanyl deoxyribonucleotide binding(GO:0032560) dGTP binding(GO:0032567) |
| 2.2 | 4.5 | GO:0017151 | DEAD/H-box RNA helicase binding(GO:0017151) |
| 2.2 | 6.7 | GO:0004345 | glucose-6-phosphate dehydrogenase activity(GO:0004345) |
| 2.2 | 10.9 | GO:0070891 | lipoteichoic acid binding(GO:0070891) |
| 2.1 | 10.7 | GO:0004859 | phospholipase inhibitor activity(GO:0004859) |
| 2.1 | 2.1 | GO:0050473 | arachidonate 15-lipoxygenase activity(GO:0050473) |
| 2.1 | 6.4 | GO:0003917 | DNA topoisomerase type I activity(GO:0003917) |
| 2.1 | 6.4 | GO:0001601 | peptide YY receptor activity(GO:0001601) |
| 2.1 | 6.4 | GO:0004912 | interleukin-3 receptor activity(GO:0004912) |
| 2.1 | 6.3 | GO:0005042 | netrin receptor activity(GO:0005042) |
| 2.1 | 8.4 | GO:0008508 | bile acid:sodium symporter activity(GO:0008508) |
| 2.1 | 8.3 | GO:0030107 | HLA-A specific inhibitory MHC class I receptor activity(GO:0030107) |
| 2.1 | 58.3 | GO:0008009 | chemokine activity(GO:0008009) |
| 2.1 | 14.6 | GO:0030369 | ICAM-3 receptor activity(GO:0030369) |
| 2.1 | 14.6 | GO:0008821 | crossover junction endodeoxyribonuclease activity(GO:0008821) |
| 2.1 | 6.2 | GO:0015275 | stretch-activated, cation-selective, calcium channel activity(GO:0015275) |
| 2.1 | 20.7 | GO:0045236 | CXCR chemokine receptor binding(GO:0045236) |
| 2.0 | 18.4 | GO:0015272 | ATP-activated inward rectifier potassium channel activity(GO:0015272) |
| 2.0 | 14.3 | GO:0003810 | protein-glutamine gamma-glutamyltransferase activity(GO:0003810) |
| 2.0 | 8.2 | GO:0047708 | biotinidase activity(GO:0047708) |
| 2.0 | 8.2 | GO:0004925 | prolactin receptor activity(GO:0004925) |
| 2.0 | 8.1 | GO:0022850 | serotonin-gated cation channel activity(GO:0022850) |
| 2.0 | 20.3 | GO:0004321 | fatty-acyl-CoA synthase activity(GO:0004321) |
| 2.0 | 6.0 | GO:0004577 | N-acetylglucosaminyldiphosphodolichol N-acetylglucosaminyltransferase activity(GO:0004577) |
| 2.0 | 6.0 | GO:0035375 | zymogen binding(GO:0035375) |
| 2.0 | 45.3 | GO:0051787 | misfolded protein binding(GO:0051787) |
| 2.0 | 5.9 | GO:0008241 | peptidyl-dipeptidase activity(GO:0008241) |
| 2.0 | 7.8 | GO:0004773 | steryl-sulfatase activity(GO:0004773) |
| 1.9 | 9.6 | GO:0001875 | lipopolysaccharide receptor activity(GO:0001875) |
| 1.9 | 19.2 | GO:0031013 | troponin I binding(GO:0031013) |
| 1.9 | 1.9 | GO:0004955 | prostaglandin receptor activity(GO:0004955) |
| 1.9 | 5.7 | GO:0050698 | proteoglycan sulfotransferase activity(GO:0050698) |
| 1.9 | 19.1 | GO:0097642 | calcitonin family receptor activity(GO:0097642) |
| 1.9 | 5.7 | GO:0004651 | polynucleotide 5'-phosphatase activity(GO:0004651) |
| 1.9 | 9.5 | GO:0005298 | proline:sodium symporter activity(GO:0005298) |
| 1.9 | 5.7 | GO:0004051 | arachidonate 5-lipoxygenase activity(GO:0004051) |
| 1.9 | 13.2 | GO:0010853 | cyclase activator activity(GO:0010853) guanylate cyclase activator activity(GO:0030250) |
| 1.9 | 11.2 | GO:0051373 | FATZ binding(GO:0051373) |
| 1.9 | 9.3 | GO:0004991 | parathyroid hormone receptor activity(GO:0004991) |
| 1.9 | 5.6 | GO:0004119 | cGMP-inhibited cyclic-nucleotide phosphodiesterase activity(GO:0004119) |
| 1.9 | 194.7 | GO:0004867 | serine-type endopeptidase inhibitor activity(GO:0004867) |
| 1.8 | 11.1 | GO:0004035 | alkaline phosphatase activity(GO:0004035) |
| 1.8 | 29.2 | GO:0017127 | cholesterol transporter activity(GO:0017127) |
| 1.8 | 16.4 | GO:0060228 | phosphatidylcholine-sterol O-acyltransferase activator activity(GO:0060228) |
| 1.8 | 5.4 | GO:0042806 | fucose binding(GO:0042806) |
| 1.8 | 5.4 | GO:0003826 | alpha-ketoacid dehydrogenase activity(GO:0003826) 3-methyl-2-oxobutanoate dehydrogenase (2-methylpropanoyl-transferring) activity(GO:0003863) |
| 1.8 | 5.4 | GO:0033765 | 3-oxo-5-alpha-steroid 4-dehydrogenase activity(GO:0003865) steroid dehydrogenase activity, acting on the CH-CH group of donors(GO:0033765) cholestenone 5-alpha-reductase activity(GO:0047751) |
| 1.8 | 163.4 | GO:0005201 | extracellular matrix structural constituent(GO:0005201) |
| 1.8 | 5.4 | GO:0050528 | acyloxyacyl hydrolase activity(GO:0050528) |
| 1.8 | 51.9 | GO:0004190 | aspartic-type endopeptidase activity(GO:0004190) aspartic-type peptidase activity(GO:0070001) |
| 1.8 | 16.0 | GO:0015143 | urate transmembrane transporter activity(GO:0015143) salt transmembrane transporter activity(GO:1901702) |
| 1.8 | 5.3 | GO:0004750 | ribulose-phosphate 3-epimerase activity(GO:0004750) |
| 1.8 | 10.6 | GO:0009378 | four-way junction helicase activity(GO:0009378) |
| 1.8 | 10.6 | GO:0015057 | thrombin receptor activity(GO:0015057) |
| 1.8 | 5.3 | GO:0004663 | protein geranylgeranyltransferase activity(GO:0004661) Rab geranylgeranyltransferase activity(GO:0004663) |
| 1.8 | 17.6 | GO:0035005 | 1-phosphatidylinositol-4-phosphate 3-kinase activity(GO:0035005) |
| 1.8 | 3.5 | GO:0004660 | protein farnesyltransferase activity(GO:0004660) |
| 1.7 | 5.2 | GO:0052854 | (S)-2-hydroxy-acid oxidase activity(GO:0003973) very-long-chain-(S)-2-hydroxy-acid oxidase activity(GO:0052852) long-chain-(S)-2-hydroxy-long-chain-acid oxidase activity(GO:0052853) medium-chain-(S)-2-hydroxy-acid oxidase activity(GO:0052854) |
| 1.7 | 12.2 | GO:0015184 | L-cystine transmembrane transporter activity(GO:0015184) |
| 1.7 | 20.8 | GO:0005025 | transforming growth factor beta receptor activity, type I(GO:0005025) |
| 1.7 | 10.4 | GO:0008035 | high-density lipoprotein particle binding(GO:0008035) |
| 1.7 | 5.2 | GO:0004961 | thromboxane receptor activity(GO:0004960) thromboxane A2 receptor activity(GO:0004961) |
| 1.7 | 10.3 | GO:0086075 | gap junction channel activity involved in cardiac conduction electrical coupling(GO:0086075) |
| 1.7 | 6.9 | GO:0004087 | carbamoyl-phosphate synthase (ammonia) activity(GO:0004087) carbamoyl-phosphate synthase (glutamine-hydrolyzing) activity(GO:0004088) |
| 1.7 | 6.9 | GO:0005148 | prolactin receptor binding(GO:0005148) |
| 1.7 | 71.8 | GO:0005044 | scavenger receptor activity(GO:0005044) |
| 1.7 | 6.8 | GO:0071987 | WD40-repeat domain binding(GO:0071987) |
| 1.7 | 6.8 | GO:0086062 | voltage-gated sodium channel activity involved in Purkinje myocyte action potential(GO:0086062) |
| 1.7 | 3.4 | GO:0002161 | aminoacyl-tRNA editing activity(GO:0002161) |
| 1.7 | 10.1 | GO:0016402 | pristanoyl-CoA oxidase activity(GO:0016402) |
| 1.7 | 30.1 | GO:0038191 | neuropilin binding(GO:0038191) |
| 1.7 | 6.7 | GO:0002114 | interleukin-33 receptor activity(GO:0002114) |
| 1.7 | 5.0 | GO:0004556 | alpha-amylase activity(GO:0004556) |
| 1.6 | 8.2 | GO:0004447 | iodide peroxidase activity(GO:0004447) |
| 1.6 | 8.2 | GO:0047045 | testosterone 17-beta-dehydrogenase (NADP+) activity(GO:0047045) |
| 1.6 | 8.2 | GO:0005157 | macrophage colony-stimulating factor receptor binding(GO:0005157) |
| 1.6 | 4.9 | GO:0016296 | oleoyl-[acyl-carrier-protein] hydrolase activity(GO:0004320) myristoyl-[acyl-carrier-protein] hydrolase activity(GO:0016295) palmitoyl-[acyl-carrier-protein] hydrolase activity(GO:0016296) acyl-[acyl-carrier-protein] hydrolase activity(GO:0016297) |
| 1.6 | 6.5 | GO:0019976 | interleukin-2 receptor activity(GO:0004911) interleukin-2 binding(GO:0019976) |
| 1.6 | 14.7 | GO:0015277 | kainate selective glutamate receptor activity(GO:0015277) |
| 1.6 | 4.9 | GO:0005502 | 11-cis retinal binding(GO:0005502) |
| 1.6 | 4.9 | GO:0060001 | minus-end directed microfilament motor activity(GO:0060001) |
| 1.6 | 13.0 | GO:0019763 | immunoglobulin receptor activity(GO:0019763) |
| 1.6 | 21.0 | GO:0008503 | benzodiazepine receptor activity(GO:0008503) |
| 1.6 | 16.1 | GO:0022821 | potassium ion antiporter activity(GO:0022821) |
| 1.6 | 6.4 | GO:0042132 | fructose 1,6-bisphosphate 1-phosphatase activity(GO:0042132) |
| 1.6 | 8.0 | GO:0004882 | androgen receptor activity(GO:0004882) |
| 1.6 | 9.6 | GO:0099583 | neurotransmitter receptor activity involved in regulation of postsynaptic cytosolic calcium ion concentration(GO:0099583) |
| 1.6 | 4.8 | GO:0015254 | glycerol channel activity(GO:0015254) |
| 1.6 | 8.0 | GO:0001083 | transcription factor activity, RNA polymerase II basal transcription factor binding(GO:0001083) |
| 1.6 | 6.4 | GO:0000702 | oxidized base lesion DNA N-glycosylase activity(GO:0000702) |
| 1.6 | 22.2 | GO:0005078 | MAP-kinase scaffold activity(GO:0005078) |
| 1.6 | 4.7 | GO:0060422 | peptidyl-dipeptidase inhibitor activity(GO:0060422) |
| 1.6 | 9.4 | GO:0034711 | inhibin binding(GO:0034711) |
| 1.6 | 4.7 | GO:0004967 | glucagon receptor activity(GO:0004967) |
| 1.6 | 60.8 | GO:0005184 | neuropeptide hormone activity(GO:0005184) |
| 1.6 | 29.6 | GO:0005537 | mannose binding(GO:0005537) |
| 1.6 | 12.4 | GO:0004198 | calcium-dependent cysteine-type endopeptidase activity(GO:0004198) |
| 1.6 | 6.2 | GO:0004909 | interleukin-1, Type I, activating receptor activity(GO:0004909) |
| 1.5 | 6.2 | GO:0032406 | MutLbeta complex binding(GO:0032406) MutSbeta complex binding(GO:0032408) |
| 1.5 | 6.1 | GO:0060230 | lipoprotein lipase activator activity(GO:0060230) |
| 1.5 | 39.7 | GO:0050998 | nitric-oxide synthase binding(GO:0050998) |
| 1.5 | 4.6 | GO:0097258 | tocopherol omega-hydroxylase activity(GO:0052870) alpha-tocopherol omega-hydroxylase activity(GO:0052871) 20-hydroxy-leukotriene B4 omega oxidase activity(GO:0097258) 20-aldehyde-leukotriene B4 20-monooxygenase activity(GO:0097259) |
| 1.5 | 6.1 | GO:0042030 | ATPase inhibitor activity(GO:0042030) |
| 1.5 | 1.5 | GO:0001758 | retinal dehydrogenase activity(GO:0001758) |
| 1.5 | 39.1 | GO:0015149 | glucose transmembrane transporter activity(GO:0005355) hexose transmembrane transporter activity(GO:0015149) |
| 1.5 | 7.5 | GO:0000150 | recombinase activity(GO:0000150) |
| 1.5 | 10.5 | GO:0004873 | asialoglycoprotein receptor activity(GO:0004873) |
| 1.5 | 7.5 | GO:0008422 | beta-glucosidase activity(GO:0008422) |
| 1.5 | 52.2 | GO:0043015 | gamma-tubulin binding(GO:0043015) |
| 1.5 | 6.0 | GO:0005006 | epidermal growth factor-activated receptor activity(GO:0005006) |
| 1.5 | 16.4 | GO:0051378 | amine binding(GO:0043176) serotonin binding(GO:0051378) |
| 1.5 | 4.5 | GO:0070573 | metallodipeptidase activity(GO:0070573) |
| 1.5 | 13.4 | GO:0034235 | GPI anchor binding(GO:0034235) |
| 1.5 | 23.5 | GO:0043024 | ribosomal small subunit binding(GO:0043024) |
| 1.5 | 4.4 | GO:0033878 | hormone-sensitive lipase activity(GO:0033878) |
| 1.5 | 7.3 | GO:0003989 | acetyl-CoA carboxylase activity(GO:0003989) |
| 1.5 | 7.3 | GO:0070740 | tubulin-glutamic acid ligase activity(GO:0070740) |
| 1.5 | 4.4 | GO:0008281 | sulfonylurea receptor activity(GO:0008281) |
| 1.4 | 2.9 | GO:0031781 | melanocortin receptor binding(GO:0031779) type 3 melanocortin receptor binding(GO:0031781) type 4 melanocortin receptor binding(GO:0031782) |
| 1.4 | 5.8 | GO:0001093 | TFIIB-class transcription factor binding(GO:0001093) |
| 1.4 | 8.6 | GO:0070728 | leucine binding(GO:0070728) |
| 1.4 | 4.3 | GO:0008431 | vitamin E binding(GO:0008431) |
| 1.4 | 11.5 | GO:0004971 | AMPA glutamate receptor activity(GO:0004971) |
| 1.4 | 4.3 | GO:0042954 | lipoprotein transporter activity(GO:0042954) |
| 1.4 | 4.3 | GO:0047493 | sphingomyelin synthase activity(GO:0033188) ceramide cholinephosphotransferase activity(GO:0047493) |
| 1.4 | 2.8 | GO:0042008 | interleukin-18 receptor activity(GO:0042008) |
| 1.4 | 4.2 | GO:0016714 | oxidoreductase activity, acting on paired donors, with incorporation or reduction of molecular oxygen, reduced pteridine as one donor, and incorporation of one atom of oxygen(GO:0016714) |
| 1.4 | 7.1 | GO:0004666 | prostaglandin-endoperoxide synthase activity(GO:0004666) |
| 1.4 | 7.0 | GO:0097603 | temperature-gated ion channel activity(GO:0097603) |
| 1.4 | 11.1 | GO:0016724 | ferroxidase activity(GO:0004322) oxidoreductase activity, oxidizing metal ions, oxygen as acceptor(GO:0016724) |
| 1.4 | 5.5 | GO:0000405 | bubble DNA binding(GO:0000405) |
| 1.4 | 12.4 | GO:0001968 | fibronectin binding(GO:0001968) |
| 1.4 | 5.5 | GO:0004341 | gluconolactonase activity(GO:0004341) |
| 1.4 | 5.4 | GO:0070095 | fructose-6-phosphate binding(GO:0070095) |
| 1.4 | 10.8 | GO:0032027 | myosin light chain binding(GO:0032027) |
| 1.4 | 4.1 | GO:0052816 | medium-chain acyl-CoA hydrolase activity(GO:0052815) long-chain acyl-CoA hydrolase activity(GO:0052816) |
| 1.3 | 1.3 | GO:0034040 | lipid-transporting ATPase activity(GO:0034040) |
| 1.3 | 4.0 | GO:0015252 | hydrogen ion channel activity(GO:0015252) |
| 1.3 | 8.0 | GO:0001640 | adenylate cyclase inhibiting G-protein coupled glutamate receptor activity(GO:0001640) G-protein coupled glutamate receptor activity(GO:0098988) |
| 1.3 | 2.7 | GO:0004040 | amidase activity(GO:0004040) |
| 1.3 | 8.0 | GO:0035374 | chondroitin sulfate binding(GO:0035374) |
| 1.3 | 4.0 | GO:0051377 | mannose-ethanolamine phosphotransferase activity(GO:0051377) |
| 1.3 | 4.0 | GO:0016713 | oxidoreductase activity, acting on paired donors, with incorporation or reduction of molecular oxygen, reduced iron-sulfur protein as one donor, and incorporation of one atom of oxygen(GO:0016713) |
| 1.3 | 14.5 | GO:0008556 | potassium-transporting ATPase activity(GO:0008556) |
| 1.3 | 6.6 | GO:0003956 | NAD(P)+-protein-arginine ADP-ribosyltransferase activity(GO:0003956) |
| 1.3 | 3.9 | GO:0031871 | proteinase activated receptor binding(GO:0031871) |
| 1.3 | 1.3 | GO:0035325 | Toll-like receptor binding(GO:0035325) |
| 1.3 | 3.9 | GO:0005136 | interleukin-4 receptor binding(GO:0005136) |
| 1.3 | 41.4 | GO:0008331 | high voltage-gated calcium channel activity(GO:0008331) |
| 1.3 | 2.6 | GO:0004720 | protein-lysine 6-oxidase activity(GO:0004720) |
| 1.3 | 7.7 | GO:0004468 | lysine N-acetyltransferase activity, acting on acetyl phosphate as donor(GO:0004468) |
| 1.3 | 11.5 | GO:0047623 | AMP deaminase activity(GO:0003876) adenosine-phosphate deaminase activity(GO:0047623) |
| 1.3 | 2.6 | GO:0004803 | transposase activity(GO:0004803) |
| 1.3 | 14.0 | GO:0005021 | vascular endothelial growth factor-activated receptor activity(GO:0005021) |
| 1.3 | 5.0 | GO:0001588 | dopamine neurotransmitter receptor activity, coupled via Gs(GO:0001588) |
| 1.3 | 2.5 | GO:0019841 | retinol binding(GO:0019841) |
| 1.3 | 2.5 | GO:0099589 | serotonin receptor activity(GO:0099589) |
| 1.3 | 7.5 | GO:0008131 | primary amine oxidase activity(GO:0008131) |
| 1.2 | 5.0 | GO:0004668 | protein-arginine deiminase activity(GO:0004668) |
| 1.2 | 33.5 | GO:0005248 | voltage-gated sodium channel activity(GO:0005248) voltage-gated ion channel activity involved in regulation of postsynaptic membrane potential(GO:1905030) |
| 1.2 | 5.0 | GO:0004983 | neuropeptide Y receptor activity(GO:0004983) |
| 1.2 | 14.8 | GO:0001206 | transcriptional repressor activity, RNA polymerase II distal enhancer sequence-specific binding(GO:0001206) |
| 1.2 | 6.2 | GO:0016427 | tRNA (cytosine) methyltransferase activity(GO:0016427) |
| 1.2 | 17.2 | GO:0031005 | filamin binding(GO:0031005) |
| 1.2 | 8.6 | GO:0071553 | uridine nucleotide receptor activity(GO:0015065) G-protein coupled pyrimidinergic nucleotide receptor activity(GO:0071553) |
| 1.2 | 4.9 | GO:0038187 | signaling pattern recognition receptor activity(GO:0008329) pattern recognition receptor activity(GO:0038187) |
| 1.2 | 15.8 | GO:0016918 | retinal binding(GO:0016918) |
| 1.2 | 12.2 | GO:0019864 | IgG binding(GO:0019864) |
| 1.2 | 20.6 | GO:0015467 | G-protein activated inward rectifier potassium channel activity(GO:0015467) |
| 1.2 | 10.8 | GO:0046975 | histone methyltransferase activity (H3-K36 specific)(GO:0046975) |
| 1.2 | 10.8 | GO:0004969 | histamine receptor activity(GO:0004969) |
| 1.2 | 4.8 | GO:0043546 | molybdopterin cofactor binding(GO:0043546) |
| 1.2 | 6.0 | GO:0047273 | galactosylgalactosylglucosylceramide beta-D-acetylgalactosaminyltransferase activity(GO:0047273) |
| 1.2 | 28.4 | GO:0001223 | transcription coactivator binding(GO:0001223) |
| 1.2 | 8.3 | GO:0003828 | alpha-N-acetylneuraminate alpha-2,8-sialyltransferase activity(GO:0003828) |
| 1.2 | 305.5 | GO:0004252 | serine-type endopeptidase activity(GO:0004252) |
| 1.2 | 3.5 | GO:0043682 | copper-exporting ATPase activity(GO:0004008) copper-transporting ATPase activity(GO:0043682) |
| 1.2 | 8.2 | GO:0004797 | thymidine kinase activity(GO:0004797) |
| 1.2 | 3.5 | GO:0004584 | dolichyl-phosphate-mannose-glycolipid alpha-mannosyltransferase activity(GO:0004584) |
| 1.2 | 25.6 | GO:0004012 | phospholipid-translocating ATPase activity(GO:0004012) |
| 1.2 | 10.4 | GO:0035174 | histone serine kinase activity(GO:0035174) |
| 1.1 | 6.9 | GO:0005143 | interleukin-12 receptor binding(GO:0005143) |
| 1.1 | 12.6 | GO:0039706 | co-receptor binding(GO:0039706) |
| 1.1 | 6.8 | GO:0042392 | sphingosine-1-phosphate phosphatase activity(GO:0042392) |
| 1.1 | 30.4 | GO:0016709 | oxidoreductase activity, acting on paired donors, with incorporation or reduction of molecular oxygen, NAD(P)H as one donor, and incorporation of one atom of oxygen(GO:0016709) |
| 1.1 | 107.7 | GO:0004222 | metalloendopeptidase activity(GO:0004222) |
| 1.1 | 3.4 | GO:0004060 | arylamine N-acetyltransferase activity(GO:0004060) |
| 1.1 | 4.5 | GO:0019981 | interleukin-6 receptor activity(GO:0004915) interleukin-6 binding(GO:0019981) |
| 1.1 | 5.6 | GO:0003796 | lysozyme activity(GO:0003796) |
| 1.1 | 2.2 | GO:0042903 | tubulin deacetylase activity(GO:0042903) |
| 1.1 | 1.1 | GO:0008798 | beta-aspartyl-peptidase activity(GO:0008798) |
| 1.1 | 3.3 | GO:0008294 | calcium- and calmodulin-responsive adenylate cyclase activity(GO:0008294) |
| 1.1 | 8.9 | GO:0008271 | secondary active sulfate transmembrane transporter activity(GO:0008271) |
| 1.1 | 8.9 | GO:0070700 | BMP receptor binding(GO:0070700) |
| 1.1 | 4.4 | GO:0033691 | sialic acid binding(GO:0033691) |
| 1.1 | 4.4 | GO:0047192 | 1-alkylglycerophosphocholine O-acetyltransferase activity(GO:0047192) |
| 1.1 | 8.8 | GO:0005000 | vasopressin receptor activity(GO:0005000) |
| 1.1 | 1.1 | GO:0004647 | phosphoserine phosphatase activity(GO:0004647) |
| 1.1 | 4.4 | GO:0016404 | 15-hydroxyprostaglandin dehydrogenase (NAD+) activity(GO:0016404) |
| 1.1 | 1.1 | GO:0000822 | inositol hexakisphosphate binding(GO:0000822) |
| 1.1 | 4.3 | GO:0008467 | [heparan sulfate]-glucosamine 3-sulfotransferase 1 activity(GO:0008467) |
| 1.1 | 3.2 | GO:0004958 | prostaglandin F receptor activity(GO:0004958) |
| 1.1 | 4.3 | GO:0017159 | pantetheine hydrolase activity(GO:0017159) |
| 1.1 | 3.2 | GO:0047184 | 1-acylglycerophosphocholine O-acyltransferase activity(GO:0047184) |
| 1.1 | 25.9 | GO:0042813 | Wnt-activated receptor activity(GO:0042813) |
| 1.1 | 12.9 | GO:0004535 | poly(A)-specific ribonuclease activity(GO:0004535) |
| 1.1 | 2.1 | GO:0015145 | monosaccharide transmembrane transporter activity(GO:0015145) |
| 1.1 | 12.6 | GO:0008020 | G-protein coupled photoreceptor activity(GO:0008020) |
| 1.0 | 10.5 | GO:0005149 | interleukin-1 receptor binding(GO:0005149) |
| 1.0 | 5.2 | GO:0003696 | satellite DNA binding(GO:0003696) |
| 1.0 | 3.1 | GO:0008480 | sarcosine dehydrogenase activity(GO:0008480) oxidoreductase activity, acting on the CH-NH group of donors, flavin as acceptor(GO:0046997) |
| 1.0 | 10.4 | GO:0004415 | hyalurononglucosaminidase activity(GO:0004415) |
| 1.0 | 6.2 | GO:0004977 | melanocortin receptor activity(GO:0004977) |
| 1.0 | 8.3 | GO:0005242 | inward rectifier potassium channel activity(GO:0005242) |
| 1.0 | 88.9 | GO:0005179 | hormone activity(GO:0005179) |
| 1.0 | 3.1 | GO:0047006 | 17-alpha,20-alpha-dihydroxypregn-4-en-3-one dehydrogenase activity(GO:0047006) |
| 1.0 | 4.1 | GO:0004102 | choline O-acetyltransferase activity(GO:0004102) |
| 1.0 | 7.1 | GO:0008568 | microtubule-severing ATPase activity(GO:0008568) |
| 1.0 | 3.1 | GO:0033746 | histone demethylase activity (H3-R2 specific)(GO:0033746) histone demethylase activity (H4-R3 specific)(GO:0033749) |
| 1.0 | 4.1 | GO:0061714 | folic acid receptor activity(GO:0061714) |
| 1.0 | 23.4 | GO:0005523 | tropomyosin binding(GO:0005523) |
| 1.0 | 7.1 | GO:0016494 | C-X-C chemokine receptor activity(GO:0016494) |
| 1.0 | 5.1 | GO:0016941 | natriuretic peptide receptor activity(GO:0016941) |
| 1.0 | 1.0 | GO:0004339 | glucan 1,4-alpha-glucosidase activity(GO:0004339) |
| 1.0 | 8.1 | GO:0022841 | potassium ion leak channel activity(GO:0022841) |
| 1.0 | 4.0 | GO:0016841 | ammonia-lyase activity(GO:0016841) |
| 1.0 | 3.0 | GO:0003845 | 11-beta-hydroxysteroid dehydrogenase [NAD(P)] activity(GO:0003845) |
| 1.0 | 14.8 | GO:0070403 | NAD+ binding(GO:0070403) |
| 1.0 | 14.7 | GO:0043522 | leucine zipper domain binding(GO:0043522) |
| 1.0 | 4.9 | GO:0034714 | type III transforming growth factor beta receptor binding(GO:0034714) |
| 1.0 | 3.9 | GO:0004146 | dihydrofolate reductase activity(GO:0004146) |
| 1.0 | 1.9 | GO:0015562 | efflux transmembrane transporter activity(GO:0015562) |
| 1.0 | 2.9 | GO:0017153 | sodium:dicarboxylate symporter activity(GO:0017153) |
| 1.0 | 8.6 | GO:0043426 | MRF binding(GO:0043426) |
| 0.9 | 8.5 | GO:0042056 | chemoattractant activity(GO:0042056) |
| 0.9 | 7.6 | GO:0016493 | C-C chemokine receptor activity(GO:0016493) |
| 0.9 | 2.8 | GO:0001016 | RNA polymerase III regulatory region DNA binding(GO:0001016) |
| 0.9 | 6.6 | GO:0004962 | endothelin receptor activity(GO:0004962) |
| 0.9 | 4.6 | GO:0016647 | oxidoreductase activity, acting on the CH-NH group of donors, oxygen as acceptor(GO:0016647) |
| 0.9 | 8.3 | GO:0004117 | calmodulin-dependent cyclic-nucleotide phosphodiesterase activity(GO:0004117) |
| 0.9 | 3.7 | GO:0004768 | stearoyl-CoA 9-desaturase activity(GO:0004768) acyl-CoA desaturase activity(GO:0016215) |
| 0.9 | 4.6 | GO:0032795 | heterotrimeric G-protein binding(GO:0032795) |
| 0.9 | 3.6 | GO:0048403 | brain-derived neurotrophic factor binding(GO:0048403) |
| 0.9 | 3.6 | GO:0019863 | IgE binding(GO:0019863) |
| 0.9 | 3.6 | GO:0032422 | purine-rich negative regulatory element binding(GO:0032422) |
| 0.9 | 3.6 | GO:0032396 | inhibitory MHC class I receptor activity(GO:0032396) |
| 0.9 | 10.8 | GO:0004950 | G-protein coupled chemoattractant receptor activity(GO:0001637) chemokine receptor activity(GO:0004950) |
| 0.9 | 2.7 | GO:0031493 | nucleosomal histone binding(GO:0031493) SAM domain binding(GO:0032093) |
| 0.9 | 4.4 | GO:0033857 | diphosphoinositol-pentakisphosphate kinase activity(GO:0033857) |
| 0.9 | 23.9 | GO:0022848 | acetylcholine-gated cation channel activity(GO:0022848) |
| 0.9 | 8.0 | GO:0030976 | thiamine pyrophosphate binding(GO:0030976) |
| 0.9 | 0.9 | GO:0035650 | AP-1 adaptor complex binding(GO:0035650) |
| 0.9 | 3.5 | GO:0052590 | sn-glycerol-3-phosphate:ubiquinone oxidoreductase activity(GO:0052590) sn-glycerol-3-phosphate:ubiquinone-8 oxidoreductase activity(GO:0052591) |
| 0.9 | 10.5 | GO:0005436 | sodium:phosphate symporter activity(GO:0005436) |
| 0.9 | 7.0 | GO:0016015 | morphogen activity(GO:0016015) |
| 0.9 | 12.2 | GO:0015379 | potassium:chloride symporter activity(GO:0015379) potassium ion symporter activity(GO:0022820) |
| 0.9 | 9.5 | GO:0030280 | structural constituent of epidermis(GO:0030280) |
| 0.9 | 3.5 | GO:0001871 | pattern binding(GO:0001871) polysaccharide binding(GO:0030247) |
| 0.9 | 8.7 | GO:0001530 | lipopolysaccharide binding(GO:0001530) |
| 0.9 | 40.4 | GO:0004114 | 3',5'-cyclic-nucleotide phosphodiesterase activity(GO:0004114) |
| 0.9 | 19.7 | GO:0004181 | metallocarboxypeptidase activity(GO:0004181) |
| 0.9 | 6.0 | GO:0004957 | prostaglandin E receptor activity(GO:0004957) |
| 0.8 | 10.9 | GO:0001730 | 2'-5'-oligoadenylate synthetase activity(GO:0001730) |
| 0.8 | 2.5 | GO:0004772 | sterol O-acyltransferase activity(GO:0004772) cholesterol O-acyltransferase activity(GO:0034736) |
| 0.8 | 3.4 | GO:0008526 | phosphatidylinositol transporter activity(GO:0008526) |
| 0.8 | 4.2 | GO:0071936 | coreceptor activity involved in Wnt signaling pathway(GO:0071936) coreceptor activity involved in Wnt signaling pathway, planar cell polarity pathway(GO:1904929) |
| 0.8 | 2.5 | GO:0010521 | telomerase inhibitor activity(GO:0010521) |
| 0.8 | 7.4 | GO:0050682 | AF-2 domain binding(GO:0050682) |
| 0.8 | 9.0 | GO:1990380 | Lys48-specific deubiquitinase activity(GO:1990380) |
| 0.8 | 4.1 | GO:0016882 | cyclo-ligase activity(GO:0016882) |
| 0.8 | 2.4 | GO:0002046 | opsin binding(GO:0002046) |
| 0.8 | 8.1 | GO:0005372 | water transmembrane transporter activity(GO:0005372) water channel activity(GO:0015250) |
| 0.8 | 2.4 | GO:0004939 | beta-adrenergic receptor activity(GO:0004939) norepinephrine binding(GO:0051380) |
| 0.8 | 5.6 | GO:0001517 | N-acetylglucosamine 6-O-sulfotransferase activity(GO:0001517) |
| 0.8 | 12.1 | GO:0008066 | glutamate receptor activity(GO:0008066) |
| 0.8 | 8.8 | GO:0070915 | lysophosphatidic acid receptor activity(GO:0070915) |
| 0.8 | 13.5 | GO:0008569 | ATP-dependent microtubule motor activity, minus-end-directed(GO:0008569) |
| 0.8 | 1.6 | GO:0038052 | RNA polymerase II transcription factor activity, estrogen-activated sequence-specific DNA binding(GO:0038052) |
| 0.8 | 0.8 | GO:0001851 | complement component C3b binding(GO:0001851) |
| 0.8 | 7.1 | GO:0016594 | glycine binding(GO:0016594) |
| 0.8 | 7.0 | GO:0010385 | double-stranded methylated DNA binding(GO:0010385) |
| 0.8 | 3.9 | GO:0060002 | plus-end directed microfilament motor activity(GO:0060002) |
| 0.8 | 2.3 | GO:0031755 | endothelial differentiation G-protein coupled receptor binding(GO:0031753) Edg-2 lysophosphatidic acid receptor binding(GO:0031755) |
| 0.8 | 11.5 | GO:0033130 | acetylcholine receptor binding(GO:0033130) |
| 0.8 | 4.6 | GO:0039552 | RIG-I binding(GO:0039552) |
| 0.8 | 6.9 | GO:0043394 | proteoglycan binding(GO:0043394) |
| 0.8 | 6.1 | GO:0016176 | superoxide-generating NADPH oxidase activator activity(GO:0016176) |
| 0.7 | 5.2 | GO:0097322 | 7SK snRNA binding(GO:0097322) |
| 0.7 | 5.2 | GO:0048495 | Roundabout binding(GO:0048495) |
| 0.7 | 2.2 | GO:0004418 | hydroxymethylbilane synthase activity(GO:0004418) |
| 0.7 | 2.2 | GO:0061629 | RNA polymerase II sequence-specific DNA binding transcription factor binding(GO:0061629) |
| 0.7 | 3.7 | GO:0015232 | heme transporter activity(GO:0015232) |
| 0.7 | 5.8 | GO:0019215 | intermediate filament binding(GO:0019215) |
| 0.7 | 2.2 | GO:0070984 | SET domain binding(GO:0070984) |
| 0.7 | 12.3 | GO:0015095 | magnesium ion transmembrane transporter activity(GO:0015095) |
| 0.7 | 4.3 | GO:0004699 | calcium-independent protein kinase C activity(GO:0004699) |
| 0.7 | 9.4 | GO:0005326 | neurotransmitter transporter activity(GO:0005326) |
| 0.7 | 23.1 | GO:0005104 | fibroblast growth factor receptor binding(GO:0005104) |
| 0.7 | 58.3 | GO:0005249 | voltage-gated potassium channel activity(GO:0005249) |
| 0.7 | 7.8 | GO:0004745 | retinol dehydrogenase activity(GO:0004745) |
| 0.7 | 1.4 | GO:0036312 | phosphatidylinositol 3-kinase regulatory subunit binding(GO:0036312) |
| 0.7 | 2.8 | GO:0047288 | monosialoganglioside sialyltransferase activity(GO:0047288) |
| 0.7 | 7.6 | GO:0003708 | retinoic acid receptor activity(GO:0003708) |
| 0.7 | 9.6 | GO:0031419 | cobalamin binding(GO:0031419) |
| 0.7 | 9.6 | GO:0005004 | GPI-linked ephrin receptor activity(GO:0005004) |
| 0.7 | 6.1 | GO:0015279 | store-operated calcium channel activity(GO:0015279) |
| 0.7 | 4.8 | GO:0015106 | bicarbonate transmembrane transporter activity(GO:0015106) |
| 0.7 | 0.7 | GO:0015193 | L-proline transmembrane transporter activity(GO:0015193) |
| 0.7 | 2.0 | GO:0004461 | lactose synthase activity(GO:0004461) |
| 0.7 | 14.8 | GO:0008188 | neuropeptide receptor activity(GO:0008188) |
| 0.7 | 5.4 | GO:0004996 | thyroid-stimulating hormone receptor activity(GO:0004996) |
| 0.7 | 2.0 | GO:0001665 | alpha-N-acetylgalactosaminide alpha-2,6-sialyltransferase activity(GO:0001665) |
| 0.7 | 3.3 | GO:0004140 | dephospho-CoA kinase activity(GO:0004140) |
| 0.7 | 4.0 | GO:0030368 | interleukin-17 receptor activity(GO:0030368) |
| 0.7 | 15.1 | GO:0043325 | phosphatidylinositol-3,4-bisphosphate binding(GO:0043325) |
| 0.7 | 6.6 | GO:0030215 | semaphorin receptor binding(GO:0030215) |
| 0.7 | 2.0 | GO:0004924 | oncostatin-M receptor activity(GO:0004924) |
| 0.7 | 2.6 | GO:0034191 | apolipoprotein A-I receptor binding(GO:0034191) |
| 0.6 | 3.2 | GO:0003835 | beta-galactoside alpha-2,6-sialyltransferase activity(GO:0003835) |
| 0.6 | 5.1 | GO:0005005 | transmembrane-ephrin receptor activity(GO:0005005) |
| 0.6 | 1.9 | GO:0005026 | transforming growth factor beta receptor activity, type II(GO:0005026) |
| 0.6 | 2.6 | GO:0008142 | oxysterol binding(GO:0008142) |
| 0.6 | 3.8 | GO:0031014 | troponin T binding(GO:0031014) |
| 0.6 | 7.0 | GO:0004551 | nucleotide diphosphatase activity(GO:0004551) |
| 0.6 | 6.3 | GO:0050692 | DBD domain binding(GO:0050692) |
| 0.6 | 3.1 | GO:0043023 | ribosomal large subunit binding(GO:0043023) |
| 0.6 | 8.0 | GO:0048531 | beta-1,3-galactosyltransferase activity(GO:0048531) |
| 0.6 | 12.2 | GO:0004806 | triglyceride lipase activity(GO:0004806) |
| 0.6 | 4.9 | GO:0086083 | cell adhesive protein binding involved in bundle of His cell-Purkinje myocyte communication(GO:0086083) |
| 0.6 | 3.0 | GO:0070097 | delta-catenin binding(GO:0070097) |
| 0.6 | 6.6 | GO:0004679 | AMP-activated protein kinase activity(GO:0004679) |
| 0.6 | 4.7 | GO:0015643 | toxic substance binding(GO:0015643) |
| 0.6 | 1.8 | GO:0008597 | calcium-dependent protein serine/threonine phosphatase regulator activity(GO:0008597) |
| 0.6 | 4.7 | GO:0015349 | thyroid hormone transmembrane transporter activity(GO:0015349) |
| 0.6 | 0.6 | GO:0005166 | neurotrophin p75 receptor binding(GO:0005166) |
| 0.6 | 4.0 | GO:0016406 | carnitine O-acyltransferase activity(GO:0016406) |
| 0.6 | 1.7 | GO:0004677 | DNA-dependent protein kinase activity(GO:0004677) |
| 0.6 | 1.1 | GO:0031696 | alpha-2C adrenergic receptor binding(GO:0031696) |
| 0.6 | 7.3 | GO:0016722 | oxidoreductase activity, oxidizing metal ions(GO:0016722) |
| 0.6 | 3.4 | GO:0097199 | cysteine-type endopeptidase activity involved in apoptotic signaling pathway(GO:0097199) |
| 0.6 | 1.7 | GO:0052810 | 1-phosphatidylinositol-5-kinase activity(GO:0052810) |
| 0.6 | 5.0 | GO:0005161 | platelet-derived growth factor receptor binding(GO:0005161) |
| 0.6 | 1.7 | GO:0016899 | oxidoreductase activity, acting on the CH-OH group of donors, oxygen as acceptor(GO:0016899) |
| 0.6 | 1.1 | GO:0004052 | arachidonate 12-lipoxygenase activity(GO:0004052) |
| 0.5 | 2.7 | GO:0005229 | intracellular calcium activated chloride channel activity(GO:0005229) |
| 0.5 | 2.2 | GO:0032184 | SUMO polymer binding(GO:0032184) |
| 0.5 | 4.3 | GO:0004716 | receptor signaling protein tyrosine kinase activity(GO:0004716) |
| 0.5 | 2.1 | GO:0045569 | TRAIL binding(GO:0045569) |
| 0.5 | 5.3 | GO:0017046 | peptide hormone binding(GO:0017046) |
| 0.5 | 5.3 | GO:0048018 | receptor agonist activity(GO:0048018) |
| 0.5 | 2.6 | GO:0005052 | peroxisome matrix targeting signal-1 binding(GO:0005052) |
| 0.5 | 24.4 | GO:0016279 | lysine N-methyltransferase activity(GO:0016278) protein-lysine N-methyltransferase activity(GO:0016279) |
| 0.5 | 9.5 | GO:0032454 | histone demethylase activity (H3-K9 specific)(GO:0032454) |
| 0.5 | 11.6 | GO:0004890 | GABA-A receptor activity(GO:0004890) |
| 0.5 | 1.6 | GO:0000064 | L-ornithine transmembrane transporter activity(GO:0000064) |
| 0.5 | 1.6 | GO:0001594 | trace-amine receptor activity(GO:0001594) |
| 0.5 | 2.6 | GO:0005114 | type II transforming growth factor beta receptor binding(GO:0005114) |
| 0.5 | 2.6 | GO:0005119 | smoothened binding(GO:0005119) |
| 0.5 | 813.5 | GO:0003700 | nucleic acid binding transcription factor activity(GO:0001071) transcription factor activity, sequence-specific DNA binding(GO:0003700) |
| 0.5 | 0.5 | GO:0010698 | acetyltransferase activator activity(GO:0010698) |
| 0.5 | 3.0 | GO:0008172 | S-methyltransferase activity(GO:0008172) |
| 0.5 | 4.5 | GO:0017154 | semaphorin receptor activity(GO:0017154) |
| 0.5 | 4.5 | GO:0035014 | phosphatidylinositol 3-kinase regulator activity(GO:0035014) 1-phosphatidylinositol-3-kinase regulator activity(GO:0046935) |
| 0.5 | 4.4 | GO:0034452 | dynactin binding(GO:0034452) |
| 0.5 | 6.4 | GO:0016909 | JUN kinase activity(GO:0004705) SAP kinase activity(GO:0016909) |
| 0.5 | 13.6 | GO:0000993 | RNA polymerase II core binding(GO:0000993) |
| 0.5 | 18.5 | GO:0042805 | actinin binding(GO:0042805) |
| 0.5 | 2.4 | GO:0004619 | bisphosphoglycerate mutase activity(GO:0004082) phosphoglycerate mutase activity(GO:0004619) 2,3-bisphosphoglycerate-dependent phosphoglycerate mutase activity(GO:0046538) |
| 0.5 | 4.3 | GO:0005520 | insulin-like growth factor binding(GO:0005520) |
| 0.5 | 3.3 | GO:0035368 | selenocysteine insertion sequence binding(GO:0035368) |
| 0.5 | 3.3 | GO:0017050 | sphinganine kinase activity(GO:0008481) D-erythro-sphingosine kinase activity(GO:0017050) |
| 0.5 | 2.9 | GO:0003998 | acylphosphatase activity(GO:0003998) |
| 0.5 | 2.4 | GO:0004370 | glycerol kinase activity(GO:0004370) |
| 0.5 | 1.9 | GO:0042328 | heparan sulfate N-acetylglucosaminyltransferase activity(GO:0042328) |
| 0.5 | 1.9 | GO:0042015 | interleukin-20 binding(GO:0042015) |
| 0.5 | 0.9 | GO:0097677 | STAT family protein binding(GO:0097677) |
| 0.5 | 35.5 | GO:0008201 | heparin binding(GO:0008201) |
| 0.5 | 4.2 | GO:0005351 | sugar:proton symporter activity(GO:0005351) cation:sugar symporter activity(GO:0005402) |
| 0.5 | 90.2 | GO:0004930 | G-protein coupled receptor activity(GO:0004930) |
| 0.5 | 25.4 | GO:0030507 | spectrin binding(GO:0030507) |
| 0.5 | 0.9 | GO:0005124 | scavenger receptor binding(GO:0005124) |
| 0.5 | 5.0 | GO:0032036 | myosin heavy chain binding(GO:0032036) |
| 0.5 | 3.2 | GO:0004571 | mannosyl-oligosaccharide 1,2-alpha-mannosidase activity(GO:0004571) |
| 0.5 | 2.3 | GO:0019912 | cyclin-dependent protein kinase activating kinase activity(GO:0019912) |
| 0.5 | 10.9 | GO:0070300 | phosphatidic acid binding(GO:0070300) |
| 0.4 | 6.3 | GO:0015245 | fatty acid transporter activity(GO:0015245) |
| 0.4 | 10.3 | GO:0004497 | monooxygenase activity(GO:0004497) |
| 0.4 | 4.0 | GO:0004767 | sphingomyelin phosphodiesterase activity(GO:0004767) |
| 0.4 | 11.6 | GO:0005227 | calcium activated cation channel activity(GO:0005227) |
| 0.4 | 1.3 | GO:0004698 | calcium-dependent protein kinase C activity(GO:0004698) |
| 0.4 | 2.2 | GO:0046899 | nucleoside triphosphate adenylate kinase activity(GO:0046899) |
| 0.4 | 1.3 | GO:0030290 | sphingolipid activator protein activity(GO:0030290) beta-N-acetylgalactosaminidase activity(GO:0032428) |
| 0.4 | 1.3 | GO:0016314 | phosphatidylinositol-3,4,5-trisphosphate 3-phosphatase activity(GO:0016314) |
| 0.4 | 1.3 | GO:0050254 | rhodopsin kinase activity(GO:0050254) |
| 0.4 | 5.2 | GO:0016702 | oxidoreductase activity, acting on single donors with incorporation of molecular oxygen, incorporation of two atoms of oxygen(GO:0016702) |
| 0.4 | 3.4 | GO:0036310 | annealing helicase activity(GO:0036310) |
| 0.4 | 6.8 | GO:0032451 | demethylase activity(GO:0032451) |
| 0.4 | 2.9 | GO:0003747 | translation release factor activity(GO:0003747) translation termination factor activity(GO:0008079) |
| 0.4 | 8.7 | GO:0070063 | RNA polymerase binding(GO:0070063) |
| 0.4 | 0.8 | GO:0050501 | hyaluronan synthase activity(GO:0050501) |
| 0.4 | 1.2 | GO:0003916 | DNA topoisomerase activity(GO:0003916) |
| 0.4 | 1.2 | GO:0008969 | phosphohistidine phosphatase activity(GO:0008969) |
| 0.4 | 45.3 | GO:0005089 | Rho guanyl-nucleotide exchange factor activity(GO:0005089) |
| 0.4 | 2.3 | GO:0004630 | phospholipase D activity(GO:0004630) |
| 0.4 | 1.2 | GO:0034056 | estrogen response element binding(GO:0034056) |
| 0.4 | 6.6 | GO:0015026 | coreceptor activity(GO:0015026) |
| 0.4 | 1.1 | GO:0047757 | chondroitin-glucuronate 5-epimerase activity(GO:0047757) |
| 0.4 | 4.2 | GO:0004030 | aldehyde dehydrogenase [NAD(P)+] activity(GO:0004030) |
| 0.4 | 15.7 | GO:0005254 | chloride channel activity(GO:0005254) |
| 0.4 | 1.1 | GO:0052795 | exo-alpha-(2->3)-sialidase activity(GO:0052794) exo-alpha-(2->6)-sialidase activity(GO:0052795) exo-alpha-(2->8)-sialidase activity(GO:0052796) |
| 0.4 | 10.0 | GO:0003746 | translation elongation factor activity(GO:0003746) |
| 0.4 | 2.9 | GO:1901476 | carbohydrate transmembrane transporter activity(GO:0015144) carbohydrate transporter activity(GO:1901476) |
| 0.4 | 1.4 | GO:0032450 | maltose alpha-glucosidase activity(GO:0032450) |
| 0.4 | 0.4 | GO:0019826 | oxygen sensor activity(GO:0019826) |
| 0.4 | 1.4 | GO:0004306 | ethanolamine-phosphate cytidylyltransferase activity(GO:0004306) |
| 0.4 | 1.8 | GO:0004692 | cGMP-dependent protein kinase activity(GO:0004692) |
| 0.4 | 1.4 | GO:0008158 | hedgehog receptor activity(GO:0008158) |
| 0.4 | 1.1 | GO:0099604 | calcium-release channel activity(GO:0015278) ligand-gated calcium channel activity(GO:0099604) |
| 0.3 | 2.8 | GO:0005220 | inositol 1,4,5-trisphosphate-sensitive calcium-release channel activity(GO:0005220) |
| 0.3 | 1.0 | GO:0005477 | pyruvate secondary active transmembrane transporter activity(GO:0005477) |
| 0.3 | 5.4 | GO:0005109 | frizzled binding(GO:0005109) |
| 0.3 | 5.3 | GO:0008252 | nucleotidase activity(GO:0008252) |
| 0.3 | 0.7 | GO:0003945 | N-acetyllactosamine synthase activity(GO:0003945) |
| 0.3 | 2.0 | GO:0004740 | pyruvate dehydrogenase (acetyl-transferring) kinase activity(GO:0004740) |
| 0.3 | 1.0 | GO:0050436 | microfibril binding(GO:0050436) |
| 0.3 | 1.0 | GO:0030506 | ankyrin binding(GO:0030506) |
| 0.3 | 5.9 | GO:0004435 | phosphatidylinositol phospholipase C activity(GO:0004435) |
| 0.3 | 1.6 | GO:0005225 | volume-sensitive anion channel activity(GO:0005225) |
| 0.3 | 1.3 | GO:0003997 | acyl-CoA oxidase activity(GO:0003997) |
| 0.3 | 0.3 | GO:0001162 | intronic transcription regulatory region sequence-specific DNA binding(GO:0001161) RNA polymerase II intronic transcription regulatory region sequence-specific DNA binding(GO:0001162) intronic transcription regulatory region DNA binding(GO:0044213) |
| 0.3 | 0.6 | GO:0019834 | phospholipase A2 inhibitor activity(GO:0019834) |
| 0.3 | 1.0 | GO:0016534 | cyclin-dependent protein kinase 5 activator activity(GO:0016534) |
| 0.3 | 3.2 | GO:0045294 | alpha-catenin binding(GO:0045294) |
| 0.3 | 0.6 | GO:0050211 | procollagen galactosyltransferase activity(GO:0050211) |
| 0.3 | 1.2 | GO:0005003 | ephrin receptor activity(GO:0005003) |
| 0.3 | 7.1 | GO:0004180 | carboxypeptidase activity(GO:0004180) |
| 0.3 | 3.1 | GO:0016175 | superoxide-generating NADPH oxidase activity(GO:0016175) |
| 0.3 | 1.8 | GO:0086080 | protein binding involved in heterotypic cell-cell adhesion(GO:0086080) |
| 0.3 | 1.8 | GO:0061665 | SUMO ligase activity(GO:0061665) |
| 0.3 | 2.4 | GO:0035259 | glucocorticoid receptor binding(GO:0035259) |
| 0.3 | 2.1 | GO:0016167 | glial cell-derived neurotrophic factor receptor activity(GO:0016167) |
| 0.3 | 2.9 | GO:0004689 | phosphorylase kinase activity(GO:0004689) |
| 0.3 | 7.8 | GO:0048306 | calcium-dependent protein binding(GO:0048306) |
| 0.3 | 46.6 | GO:0017137 | Rab GTPase binding(GO:0017137) |
| 0.3 | 1.1 | GO:0099580 | ion antiporter activity involved in regulation of postsynaptic membrane potential(GO:0099580) |
| 0.3 | 0.9 | GO:0046920 | alpha-(1->3)-fucosyltransferase activity(GO:0046920) |
| 0.3 | 1.4 | GO:0047374 | methylumbelliferyl-acetate deacetylase activity(GO:0047374) |
| 0.3 | 0.6 | GO:0004914 | interleukin-5 receptor activity(GO:0004914) |
| 0.3 | 1.1 | GO:0004142 | diacylglycerol cholinephosphotransferase activity(GO:0004142) |
| 0.3 | 0.5 | GO:0050567 | glutaminyl-tRNA synthase (glutamine-hydrolyzing) activity(GO:0050567) |
| 0.3 | 6.8 | GO:0030742 | GTP-dependent protein binding(GO:0030742) |
| 0.3 | 4.8 | GO:0070513 | death domain binding(GO:0070513) |
| 0.3 | 2.9 | GO:1990841 | promoter-specific chromatin binding(GO:1990841) |
| 0.3 | 1.6 | GO:0005219 | ryanodine-sensitive calcium-release channel activity(GO:0005219) |
| 0.3 | 0.8 | GO:0019166 | trans-2-enoyl-CoA reductase (NADPH) activity(GO:0019166) |
| 0.3 | 2.4 | GO:0005243 | gap junction channel activity(GO:0005243) |
| 0.3 | 1.8 | GO:0050291 | sphingosine N-acyltransferase activity(GO:0050291) |
| 0.3 | 6.2 | GO:0070412 | R-SMAD binding(GO:0070412) |
| 0.2 | 0.2 | GO:0000035 | acyl binding(GO:0000035) |
| 0.2 | 1.2 | GO:0047238 | glucuronosyl-N-acetylgalactosaminyl-proteoglycan 4-beta-N-acetylgalactosaminyltransferase activity(GO:0047238) |
| 0.2 | 6.7 | GO:0004714 | transmembrane receptor protein tyrosine kinase activity(GO:0004714) |
| 0.2 | 2.6 | GO:0004861 | cyclin-dependent protein serine/threonine kinase inhibitor activity(GO:0004861) |
| 0.2 | 1.2 | GO:0032393 | MHC class I receptor activity(GO:0032393) |
| 0.2 | 4.5 | GO:0005522 | profilin binding(GO:0005522) |
| 0.2 | 1.8 | GO:0008269 | JAK pathway signal transduction adaptor activity(GO:0008269) |
| 0.2 | 0.9 | GO:0016230 | sphingomyelin phosphodiesterase activator activity(GO:0016230) |
| 0.2 | 0.6 | GO:0008970 | phosphatidylcholine 1-acylhydrolase activity(GO:0008970) |
| 0.2 | 1.5 | GO:0009008 | DNA-methyltransferase activity(GO:0009008) |
| 0.2 | 1.1 | GO:0035184 | histone threonine kinase activity(GO:0035184) |
| 0.2 | 1.3 | GO:0043533 | inositol 1,3,4,5 tetrakisphosphate binding(GO:0043533) |
| 0.2 | 0.2 | GO:0004559 | alpha-mannosidase activity(GO:0004559) |
| 0.2 | 9.6 | GO:0005319 | lipid transporter activity(GO:0005319) |
| 0.2 | 2.9 | GO:0005245 | voltage-gated calcium channel activity(GO:0005245) |
| 0.2 | 1.2 | GO:0008420 | CTD phosphatase activity(GO:0008420) |
| 0.2 | 4.4 | GO:0008028 | monocarboxylic acid transmembrane transporter activity(GO:0008028) |
| 0.2 | 0.2 | GO:0031685 | adenosine receptor binding(GO:0031685) |
| 0.2 | 2.5 | GO:0035612 | AP-2 adaptor complex binding(GO:0035612) |
| 0.2 | 0.8 | GO:0005169 | neurotrophin TRKB receptor binding(GO:0005169) |
| 0.2 | 0.9 | GO:0015108 | chloride transmembrane transporter activity(GO:0015108) |
| 0.2 | 33.2 | GO:0005516 | calmodulin binding(GO:0005516) |
| 0.2 | 1.5 | GO:0003993 | acid phosphatase activity(GO:0003993) |
| 0.2 | 1.5 | GO:0005087 | Ran guanyl-nucleotide exchange factor activity(GO:0005087) |
| 0.2 | 0.7 | GO:0004906 | interferon-gamma receptor activity(GO:0004906) |
| 0.2 | 0.5 | GO:0004634 | phosphopyruvate hydratase activity(GO:0004634) |
| 0.2 | 0.8 | GO:0004703 | G-protein coupled receptor kinase activity(GO:0004703) beta-adrenergic receptor kinase activity(GO:0047696) |
| 0.2 | 2.5 | GO:0017017 | MAP kinase tyrosine/serine/threonine phosphatase activity(GO:0017017) |
| 0.2 | 3.8 | GO:0005031 | tumor necrosis factor-activated receptor activity(GO:0005031) death receptor activity(GO:0005035) |
| 0.2 | 1.4 | GO:0042834 | peptidoglycan binding(GO:0042834) |
| 0.2 | 1.5 | GO:0015491 | cation:cation antiporter activity(GO:0015491) |
| 0.2 | 0.2 | GO:0030249 | guanylate cyclase regulator activity(GO:0030249) |
| 0.2 | 2.0 | GO:0036374 | glutathione hydrolase activity(GO:0036374) |
| 0.2 | 1.8 | GO:0017136 | NAD-dependent histone deacetylase activity(GO:0017136) |
| 0.1 | 6.1 | GO:0017112 | Rab guanyl-nucleotide exchange factor activity(GO:0017112) |
| 0.1 | 1.2 | GO:0042043 | neurexin family protein binding(GO:0042043) |
| 0.1 | 28.6 | GO:0030246 | carbohydrate binding(GO:0030246) |
| 0.1 | 0.4 | GO:0000182 | rDNA binding(GO:0000182) |
| 0.1 | 0.3 | GO:0000268 | peroxisome targeting sequence binding(GO:0000268) |
| 0.1 | 0.4 | GO:0008384 | IkappaB kinase activity(GO:0008384) |
| 0.1 | 0.5 | GO:0034353 | RNA pyrophosphohydrolase activity(GO:0034353) |
| 0.1 | 0.5 | GO:0005499 | vitamin D binding(GO:0005499) |
| 0.1 | 0.9 | GO:0004726 | non-membrane spanning protein tyrosine phosphatase activity(GO:0004726) |
| 0.1 | 0.8 | GO:0042577 | lipid phosphatase activity(GO:0042577) |
| 0.1 | 0.6 | GO:0004905 | type I interferon receptor activity(GO:0004905) |
| 0.1 | 1.3 | GO:0016849 | phosphorus-oxygen lyase activity(GO:0016849) |
| 0.1 | 0.5 | GO:0015183 | L-aspartate transmembrane transporter activity(GO:0015183) |
| 0.1 | 1.8 | GO:0016876 | aminoacyl-tRNA ligase activity(GO:0004812) ligase activity, forming carbon-oxygen bonds(GO:0016875) ligase activity, forming aminoacyl-tRNA and related compounds(GO:0016876) |
| 0.1 | 0.3 | GO:0030549 | acetylcholine receptor activator activity(GO:0030549) |
| 0.1 | 3.1 | GO:0008307 | structural constituent of muscle(GO:0008307) |
| 0.1 | 0.3 | GO:0031543 | peptidyl-proline dioxygenase activity(GO:0031543) |
| 0.1 | 0.3 | GO:0051011 | microtubule minus-end binding(GO:0051011) |
| 0.1 | 0.3 | GO:0032145 | 4-aminobutyrate transaminase activity(GO:0003867) succinate-semialdehyde dehydrogenase binding(GO:0032145) (S)-3-amino-2-methylpropionate transaminase activity(GO:0047298) |
| 0.1 | 0.2 | GO:0071253 | connexin binding(GO:0071253) |
| 0.1 | 0.6 | GO:0050733 | RS domain binding(GO:0050733) |
| 0.1 | 0.2 | GO:0031849 | olfactory receptor binding(GO:0031849) |
| 0.1 | 1.7 | GO:0032266 | phosphatidylinositol-3-phosphate binding(GO:0032266) |
| 0.1 | 0.2 | GO:0008410 | CoA-transferase activity(GO:0008410) |
| 0.1 | 35.6 | GO:0005509 | calcium ion binding(GO:0005509) |
| 0.1 | 1.4 | GO:0005160 | transforming growth factor beta receptor binding(GO:0005160) |
| 0.1 | 0.2 | GO:0004427 | inorganic diphosphatase activity(GO:0004427) |
| 0.1 | 0.4 | GO:0030274 | LIM domain binding(GO:0030274) |
| 0.1 | 2.2 | GO:0005164 | tumor necrosis factor receptor binding(GO:0005164) |
| 0.0 | 0.2 | GO:0030628 | pre-mRNA 3'-splice site binding(GO:0030628) |
| 0.0 | 0.6 | GO:0004697 | protein kinase C activity(GO:0004697) |
| 0.0 | 1.0 | GO:0008175 | tRNA methyltransferase activity(GO:0008175) |
| 0.0 | 0.2 | GO:0004078 | biotin-[acetyl-CoA-carboxylase] ligase activity(GO:0004077) biotin-[methylcrotonoyl-CoA-carboxylase] ligase activity(GO:0004078) biotin-[methylmalonyl-CoA-carboxytransferase] ligase activity(GO:0004079) biotin-[propionyl-CoA-carboxylase (ATP-hydrolyzing)] ligase activity(GO:0004080) biotin-protein ligase activity(GO:0018271) |
| 0.0 | 0.1 | GO:0019150 | D-ribulokinase activity(GO:0019150) |
| 0.0 | 0.5 | GO:0030297 | transmembrane receptor protein tyrosine kinase activator activity(GO:0030297) |
| 0.0 | 0.3 | GO:0008429 | phosphatidylethanolamine binding(GO:0008429) |
| 0.0 | 1.0 | GO:0004709 | MAP kinase kinase kinase activity(GO:0004709) |
| 0.0 | 0.2 | GO:0008417 | fucosyltransferase activity(GO:0008417) |
| 0.0 | 0.1 | GO:0008195 | phosphatidate phosphatase activity(GO:0008195) |
| 0.0 | 0.1 | GO:0044736 | acid-sensing ion channel activity(GO:0044736) |
| 0.0 | 0.1 | GO:0016812 | hydrolase activity, acting on carbon-nitrogen (but not peptide) bonds, in cyclic amides(GO:0016812) |
| 0.0 | 0.1 | GO:0004749 | ribose phosphate diphosphokinase activity(GO:0004749) |
| 0.0 | 0.2 | GO:0052658 | inositol-1,4,5-trisphosphate 5-phosphatase activity(GO:0052658) |
| 0.0 | 0.3 | GO:0102391 | decanoate--CoA ligase activity(GO:0102391) |
| 0.0 | 0.1 | GO:0008853 | exodeoxyribonuclease III activity(GO:0008853) |
Gene overrepresentation in curated gene sets: canonical pathways category:
| Log-likelihood per target | Total log-likelihood | Term | Description |
|---|---|---|---|
| 8.6 | 441.1 | NABA PROTEOGLYCANS | Genes encoding proteoglycans |
| 3.8 | 7.5 | PID ECADHERIN NASCENT AJ PATHWAY | E-cadherin signaling in the nascent adherens junction |
| 3.5 | 10.5 | PID AR NONGENOMIC PATHWAY | Nongenotropic Androgen signaling |
| 2.1 | 10.7 | ST TYPE I INTERFERON PATHWAY | Type I Interferon (alpha/beta IFN) Pathway |
| 2.1 | 37.4 | NABA BASEMENT MEMBRANES | Genes encoding structural components of basement membranes |
| 1.9 | 9.6 | ST PHOSPHOINOSITIDE 3 KINASE PATHWAY | PI3K Pathway |
| 1.9 | 32.4 | ST INTERFERON GAMMA PATHWAY | Interferon gamma pathway. |
| 1.7 | 19.1 | PID RAC1 PATHWAY | RAC1 signaling pathway |
| 1.7 | 24.8 | PID ERBB NETWORK PATHWAY | ErbB receptor signaling network |
| 1.5 | 15.4 | PID CONE PATHWAY | Visual signal transduction: Cones |
| 1.5 | 50.2 | PID RHODOPSIN PATHWAY | Visual signal transduction: Rods |
| 1.3 | 376.0 | NABA ECM REGULATORS | Genes encoding enzymes and their regulators involved in the remodeling of the extracellular matrix |
| 1.3 | 1.3 | PID CXCR3 PATHWAY | CXCR3-mediated signaling events |
| 1.3 | 295.6 | NABA ECM GLYCOPROTEINS | Genes encoding structural ECM glycoproteins |
| 1.2 | 2.5 | PID TCR RAS PATHWAY | Ras signaling in the CD4+ TCR pathway |
| 1.2 | 49.4 | PID INTEGRIN1 PATHWAY | Beta1 integrin cell surface interactions |
| 1.1 | 22.8 | SA REG CASCADE OF CYCLIN EXPR | Expression of cyclins regulates progression through the cell cycle by activating cyclin-dependent kinases. |
| 1.1 | 18.1 | PID VEGF VEGFR PATHWAY | VEGF and VEGFR signaling network |
| 1.1 | 22.2 | PID HEDGEHOG 2PATHWAY | Signaling events mediated by the Hedgehog family |
| 1.0 | 176.0 | NABA ECM AFFILIATED | Genes encoding proteins affiliated structurally or functionally to extracellular matrix proteins |
| 1.0 | 379.7 | NABA SECRETED FACTORS | Genes encoding secreted soluble factors |
| 0.9 | 48.0 | ST MYOCYTE AD PATHWAY | Myocyte Adrenergic Pathway is a specific case of the generalized Adrenergic Pathway. |
| 0.9 | 53.8 | PID DELTA NP63 PATHWAY | Validated transcriptional targets of deltaNp63 isoforms |
| 0.8 | 24.4 | PID ATF2 PATHWAY | ATF-2 transcription factor network |
| 0.8 | 2.5 | PID EPO PATHWAY | EPO signaling pathway |
| 0.8 | 17.1 | PID UPA UPAR PATHWAY | Urokinase-type plasminogen activator (uPA) and uPAR-mediated signaling |
| 0.8 | 4.7 | ST STAT3 PATHWAY | STAT3 Pathway |
| 0.8 | 15.5 | PID INTEGRIN CS PATHWAY | Integrin family cell surface interactions |
| 0.8 | 15.9 | PID TCR JNK PATHWAY | JNK signaling in the CD4+ TCR pathway |
| 0.7 | 12.7 | PID INTEGRIN A9B1 PATHWAY | Alpha9 beta1 integrin signaling events |
| 0.7 | 6.7 | PID THROMBIN PAR4 PATHWAY | PAR4-mediated thrombin signaling events |
| 0.7 | 34.8 | PID IL12 STAT4 PATHWAY | IL12 signaling mediated by STAT4 |
| 0.7 | 5.1 | SIG REGULATION OF THE ACTIN CYTOSKELETON BY RHO GTPASES | Genes related to regulation of the actin cytoskeleton |
| 0.7 | 45.3 | PID NCADHERIN PATHWAY | N-cadherin signaling events |
| 0.7 | 1.3 | PID CD8 TCR PATHWAY | TCR signaling in naïve CD8+ T cells |
| 0.6 | 13.5 | PID WNT SIGNALING PATHWAY | Wnt signaling network |
| 0.6 | 12.2 | NABA MATRISOME | Ensemble of genes encoding extracellular matrix and extracellular matrix-associated proteins |
| 0.6 | 5.4 | PID REELIN PATHWAY | Reelin signaling pathway |
| 0.6 | 4.1 | PID ANTHRAX PATHWAY | Cellular roles of Anthrax toxin |
| 0.6 | 5.8 | SIG BCR SIGNALING PATHWAY | Members of the BCR signaling pathway |
| 0.6 | 10.8 | PID PTP1B PATHWAY | Signaling events mediated by PTP1B |
| 0.6 | 0.6 | PID VEGFR1 PATHWAY | VEGFR1 specific signals |
| 0.6 | 7.9 | PID ENDOTHELIN PATHWAY | Endothelins |
| 0.5 | 4.9 | ST ERK1 ERK2 MAPK PATHWAY | ERK1/ERK2 MAPK Pathway |
| 0.5 | 26.3 | SIG PIP3 SIGNALING IN B LYMPHOCYTES | Genes related to PIP3 signaling in B lymphocytes |
| 0.5 | 1.6 | ST JAK STAT PATHWAY | Jak-STAT Pathway |
| 0.5 | 3.1 | PID WNT NONCANONICAL PATHWAY | Noncanonical Wnt signaling pathway |
| 0.5 | 32.6 | PID HNF3A PATHWAY | FOXA1 transcription factor network |
| 0.5 | 1.0 | PID THROMBIN PAR1 PATHWAY | PAR1-mediated thrombin signaling events |
| 0.5 | 5.4 | PID BCR 5PATHWAY | BCR signaling pathway |
| 0.5 | 11.4 | PID EPHA FWDPATHWAY | EPHA forward signaling |
| 0.4 | 15.4 | PID NFAT TFPATHWAY | Calcineurin-regulated NFAT-dependent transcription in lymphocytes |
| 0.4 | 20.9 | PID BMP PATHWAY | BMP receptor signaling |
| 0.4 | 9.6 | PID INTEGRIN2 PATHWAY | Beta2 integrin cell surface interactions |
| 0.4 | 22.0 | PID RXR VDR PATHWAY | RXR and RAR heterodimerization with other nuclear receptor |
| 0.4 | 6.9 | PID NETRIN PATHWAY | Netrin-mediated signaling events |
| 0.4 | 10.9 | PID TCR CALCIUM PATHWAY | Calcium signaling in the CD4+ TCR pathway |
| 0.4 | 9.4 | PID IL8 CXCR1 PATHWAY | IL8- and CXCR1-mediated signaling events |
| 0.4 | 9.5 | PID FRA PATHWAY | Validated transcriptional targets of AP1 family members Fra1 and Fra2 |
| 0.4 | 1.2 | PID S1P S1P4 PATHWAY | S1P4 pathway |
| 0.4 | 9.2 | PID TOLL ENDOGENOUS PATHWAY | Endogenous TLR signaling |
| 0.4 | 6.2 | PID PDGFRA PATHWAY | PDGFR-alpha signaling pathway |
| 0.4 | 1.4 | PID IL3 PATHWAY | IL3-mediated signaling events |
| 0.3 | 4.1 | PID IL27 PATHWAY | IL27-mediated signaling events |
| 0.3 | 9.3 | PID P38 ALPHA BETA PATHWAY | Regulation of p38-alpha and p38-beta |
| 0.3 | 6.8 | PID ER NONGENOMIC PATHWAY | Plasma membrane estrogen receptor signaling |
| 0.3 | 4.9 | PID SYNDECAN 4 PATHWAY | Syndecan-4-mediated signaling events |
| 0.3 | 2.9 | PID PI3KCI PATHWAY | Class I PI3K signaling events |
| 0.3 | 2.2 | PID S1P S1P3 PATHWAY | S1P3 pathway |
| 0.3 | 3.7 | PID SHP2 PATHWAY | SHP2 signaling |
| 0.3 | 9.7 | PID RAS PATHWAY | Regulation of Ras family activation |
| 0.3 | 4.4 | ST ADRENERGIC | Adrenergic Pathway |
| 0.3 | 1.9 | PID ALK2 PATHWAY | ALK2 signaling events |
| 0.3 | 3.3 | PID PI3KCI AKT PATHWAY | Class I PI3K signaling events mediated by Akt |
| 0.3 | 6.1 | PID ERBB4 PATHWAY | ErbB4 signaling events |
| 0.3 | 4.1 | ST WNT CA2 CYCLIC GMP PATHWAY | Wnt/Ca2+/cyclic GMP signaling. |
| 0.2 | 8.0 | PID FGF PATHWAY | FGF signaling pathway |
| 0.2 | 2.0 | PID NECTIN PATHWAY | Nectin adhesion pathway |
| 0.2 | 16.4 | PID IL4 2PATHWAY | IL4-mediated signaling events |
| 0.2 | 1.6 | PID AMB2 NEUTROPHILS PATHWAY | amb2 Integrin signaling |
| 0.2 | 2.2 | PID S1P META PATHWAY | Sphingosine 1-phosphate (S1P) pathway |
| 0.2 | 1.7 | PID ECADHERIN KERATINOCYTE PATHWAY | E-cadherin signaling in keratinocytes |
| 0.2 | 3.0 | PID WNT CANONICAL PATHWAY | Canonical Wnt signaling pathway |
| 0.2 | 1.9 | PID A6B1 A6B4 INTEGRIN PATHWAY | a6b1 and a6b4 Integrin signaling |
| 0.2 | 1.9 | ST GRANULE CELL SURVIVAL PATHWAY | Granule Cell Survival Pathway is a specific case of more general PAC1 Receptor Pathway. |
| 0.2 | 2.8 | PID EPHRINB REV PATHWAY | Ephrin B reverse signaling |
| 0.2 | 8.5 | PID LKB1 PATHWAY | LKB1 signaling events |
| 0.2 | 1.7 | PID CD8 TCR DOWNSTREAM PATHWAY | Downstream signaling in naïve CD8+ T cells |
| 0.1 | 1.4 | PID EPHB FWD PATHWAY | EPHB forward signaling |
| 0.1 | 0.9 | PID IL23 PATHWAY | IL23-mediated signaling events |
| 0.1 | 2.1 | PID LYSOPHOSPHOLIPID PATHWAY | LPA receptor mediated events |
| 0.1 | 5.1 | PID MTOR 4PATHWAY | mTOR signaling pathway |
| 0.1 | 1.3 | PID HIF1A PATHWAY | Hypoxic and oxygen homeostasis regulation of HIF-1-alpha |
| 0.1 | 0.6 | PID IL5 PATHWAY | IL5-mediated signaling events |
| 0.1 | 1.0 | PID ERBB2 ERBB3 PATHWAY | ErbB2/ErbB3 signaling events |
| 0.1 | 1.3 | PID LPA4 PATHWAY | LPA4-mediated signaling events |
| 0.1 | 1.5 | ST GAQ PATHWAY | G alpha q Pathway |
| 0.1 | 1.6 | PID TRAIL PATHWAY | TRAIL signaling pathway |
| 0.1 | 9.1 | PID MYC REPRESS PATHWAY | Validated targets of C-MYC transcriptional repression |
| 0.1 | 2.1 | PID AR TF PATHWAY | Regulation of Androgen receptor activity |
| 0.1 | 2.5 | PID ARF6 PATHWAY | Arf6 signaling events |
| 0.1 | 1.2 | ST TUMOR NECROSIS FACTOR PATHWAY | Tumor Necrosis Factor Pathway. |
| 0.0 | 0.9 | PID RHOA REG PATHWAY | Regulation of RhoA activity |
Gene overrepresentation in curated gene sets: REACTOME pathways category:
| Log-likelihood per target | Total log-likelihood | Term | Description |
|---|---|---|---|
| 14.7 | 396.0 | REACTOME CS DS DEGRADATION | Genes involved in CS/DS degradation |
| 4.4 | 44.2 | REACTOME ETHANOL OXIDATION | Genes involved in Ethanol oxidation |
| 4.0 | 27.9 | REACTOME TRYPTOPHAN CATABOLISM | Genes involved in Tryptophan catabolism |
| 3.8 | 345.7 | REACTOME OLFACTORY SIGNALING PATHWAY | Genes involved in Olfactory Signaling Pathway |
| 3.4 | 58.1 | REACTOME ACYL CHAIN REMODELLING OF PI | Genes involved in Acyl chain remodelling of PI |
| 3.4 | 37.3 | REACTOME THE ACTIVATION OF ARYLSULFATASES | Genes involved in The activation of arylsulfatases |
| 3.4 | 54.1 | REACTOME REVERSIBLE HYDRATION OF CARBON DIOXIDE | Genes involved in Reversible Hydration of Carbon Dioxide |
| 3.4 | 60.9 | REACTOME XENOBIOTICS | Genes involved in Xenobiotics |
| 2.9 | 5.8 | REACTOME PHOSPHOLIPASE C MEDIATED CASCADE | Genes involved in Phospholipase C-mediated cascade |
| 2.9 | 54.6 | REACTOME INITIAL TRIGGERING OF COMPLEMENT | Genes involved in Initial triggering of complement |
| 2.7 | 5.4 | REACTOME DESTABILIZATION OF MRNA BY BRF1 | Genes involved in Destabilization of mRNA by Butyrate Response Factor 1 (BRF1) |
| 2.7 | 66.9 | REACTOME REGULATION OF INSULIN LIKE GROWTH FACTOR IGF ACTIVITY BY INSULIN LIKE GROWTH FACTOR BINDING PROTEINS IGFBPS | Genes involved in Regulation of Insulin-like Growth Factor (IGF) Activity by Insulin-like Growth Factor Binding Proteins (IGFBPs) |
| 2.7 | 31.8 | REACTOME SYNTHESIS OF BILE ACIDS AND BILE SALTS VIA 24 HYDROXYCHOLESTEROL | Genes involved in Synthesis of bile acids and bile salts via 24-hydroxycholesterol |
| 2.7 | 26.5 | REACTOME BETA DEFENSINS | Genes involved in Beta defensins |
| 2.3 | 14.1 | REACTOME BINDING AND ENTRY OF HIV VIRION | Genes involved in Binding and entry of HIV virion |
| 2.3 | 2.3 | REACTOME RAS ACTIVATION UOPN CA2 INFUX THROUGH NMDA RECEPTOR | Genes involved in Ras activation uopn Ca2+ infux through NMDA receptor |
| 2.3 | 54.2 | REACTOME HDL MEDIATED LIPID TRANSPORT | Genes involved in HDL-mediated lipid transport |
| 2.0 | 117.1 | REACTOME CHEMOKINE RECEPTORS BIND CHEMOKINES | Genes involved in Chemokine receptors bind chemokines |
| 1.9 | 38.4 | REACTOME TRANSLOCATION OF ZAP 70 TO IMMUNOLOGICAL SYNAPSE | Genes involved in Translocation of ZAP-70 to Immunological synapse |
| 1.8 | 18.3 | REACTOME ACYL CHAIN REMODELLING OF PC | Genes involved in Acyl chain remodelling of PC |
| 1.8 | 24.8 | REACTOME ANDROGEN BIOSYNTHESIS | Genes involved in Androgen biosynthesis |
| 1.8 | 5.3 | REACTOME SYNTHESIS SECRETION AND DEACYLATION OF GHRELIN | Genes involved in Synthesis, Secretion, and Deacylation of Ghrelin |
| 1.7 | 20.7 | REACTOME DIGESTION OF DIETARY CARBOHYDRATE | Genes involved in Digestion of dietary carbohydrate |
| 1.7 | 33.9 | REACTOME STEROID HORMONES | Genes involved in Steroid hormones |
| 1.7 | 5.1 | REACTOME PLATELET AGGREGATION PLUG FORMATION | Genes involved in Platelet Aggregation (Plug Formation) |
| 1.7 | 65.6 | REACTOME AMINE COMPOUND SLC TRANSPORTERS | Genes involved in Amine compound SLC transporters |
| 1.7 | 43.6 | REACTOME COMPLEMENT CASCADE | Genes involved in Complement cascade |
| 1.7 | 64.7 | REACTOME ABC FAMILY PROTEINS MEDIATED TRANSPORT | Genes involved in ABC-family proteins mediated transport |
| 1.6 | 31.4 | REACTOME EICOSANOID LIGAND BINDING RECEPTORS | Genes involved in Eicosanoid ligand-binding receptors |
| 1.5 | 71.6 | REACTOME LIGAND GATED ION CHANNEL TRANSPORT | Genes involved in Ligand-gated ion channel transport |
| 1.5 | 15.0 | REACTOME DEFENSINS | Genes involved in Defensins |
| 1.4 | 49.2 | REACTOME REGULATION OF IFNA SIGNALING | Genes involved in Regulation of IFNA signaling |
| 1.4 | 35.6 | REACTOME OTHER SEMAPHORIN INTERACTIONS | Genes involved in Other semaphorin interactions |
| 1.4 | 41.2 | REACTOME KERATAN SULFATE BIOSYNTHESIS | Genes involved in Keratan sulfate biosynthesis |
| 1.4 | 36.9 | REACTOME CYTOCHROME P450 ARRANGED BY SUBSTRATE TYPE | Genes involved in Cytochrome P450 - arranged by substrate type |
| 1.4 | 9.5 | REACTOME PLATELET ADHESION TO EXPOSED COLLAGEN | Genes involved in Platelet Adhesion to exposed collagen |
| 1.3 | 18.9 | REACTOME SEROTONIN RECEPTORS | Genes involved in Serotonin receptors |
| 1.3 | 5.3 | REACTOME METABOLISM OF STEROID HORMONES AND VITAMINS A AND D | Genes involved in Metabolism of steroid hormones and vitamins A and D |
| 1.3 | 26.0 | REACTOME AMINE DERIVED HORMONES | Genes involved in Amine-derived hormones |
| 1.3 | 18.0 | REACTOME COMMON PATHWAY | Genes involved in Common Pathway |
| 1.3 | 2.5 | REACTOME SIGNALING BY ILS | Genes involved in Signaling by Interleukins |
| 1.3 | 171.7 | REACTOME TRANSPORT OF INORGANIC CATIONS ANIONS AND AMINO ACIDS OLIGOPEPTIDES | Genes involved in Transport of inorganic cations/anions and amino acids/oligopeptides |
| 1.3 | 21.5 | REACTOME TRAF6 MEDIATED INDUCTION OF TAK1 COMPLEX | Genes involved in TRAF6 mediated induction of TAK1 complex |
| 1.2 | 53.6 | REACTOME AMYLOIDS | Genes involved in Amyloids |
| 1.2 | 158.0 | REACTOME PEPTIDE LIGAND BINDING RECEPTORS | Genes involved in Peptide ligand-binding receptors |
| 1.2 | 2.4 | REACTOME REGULATION OF INSULIN SECRETION BY GLUCAGON LIKE PEPTIDE1 | Genes involved in Regulation of Insulin Secretion by Glucagon-like Peptide-1 |
| 1.2 | 68.2 | REACTOME TRANSCRIPTIONAL REGULATION OF WHITE ADIPOCYTE DIFFERENTIATION | Genes involved in Transcriptional Regulation of White Adipocyte Differentiation |
| 1.1 | 10.1 | REACTOME CYTOSOLIC TRNA AMINOACYLATION | Genes involved in Cytosolic tRNA aminoacylation |
| 1.1 | 72.8 | REACTOME STRIATED MUSCLE CONTRACTION | Genes involved in Striated Muscle Contraction |
| 1.1 | 22.3 | REACTOME ANTIGEN ACTIVATES B CELL RECEPTOR LEADING TO GENERATION OF SECOND MESSENGERS | Genes involved in Antigen Activates B Cell Receptor Leading to Generation of Second Messengers |
| 1.1 | 472.4 | REACTOME GENERIC TRANSCRIPTION PATHWAY | Genes involved in Generic Transcription Pathway |
| 1.0 | 17.4 | REACTOME P2Y RECEPTORS | Genes involved in P2Y receptors |
| 1.0 | 9.1 | REACTOME IL 6 SIGNALING | Genes involved in Interleukin-6 signaling |
| 1.0 | 46.6 | REACTOME CGMP EFFECTS | Genes involved in cGMP effects |
| 1.0 | 2.0 | REACTOME DOWNSTREAM SIGNALING OF ACTIVATED FGFR | Genes involved in Downstream signaling of activated FGFR |
| 1.0 | 48.6 | REACTOME SYNTHESIS OF PIPS AT THE PLASMA MEMBRANE | Genes involved in Synthesis of PIPs at the plasma membrane |
| 1.0 | 19.7 | REACTOME CLASS C 3 METABOTROPIC GLUTAMATE PHEROMONE RECEPTORS | Genes involved in Class C/3 (Metabotropic glutamate/pheromone receptors) |
| 1.0 | 38.1 | REACTOME REGULATION OF GENE EXPRESSION IN BETA CELLS | Genes involved in Regulation of gene expression in beta cells |
| 1.0 | 72.8 | REACTOME NCAM1 INTERACTIONS | Genes involved in NCAM1 interactions |
| 1.0 | 21.3 | REACTOME DOPAMINE NEUROTRANSMITTER RELEASE CYCLE | Genes involved in Dopamine Neurotransmitter Release Cycle |
| 0.9 | 11.0 | REACTOME ROLE OF SECOND MESSENGERS IN NETRIN1 SIGNALING | Genes involved in Role of second messengers in netrin-1 signaling |
| 0.9 | 22.7 | REACTOME SIGNALING BY BMP | Genes involved in Signaling by BMP |
| 0.9 | 11.8 | REACTOME SIGNALING BY CONSTITUTIVELY ACTIVE EGFR | Genes involved in Signaling by constitutively active EGFR |
| 0.9 | 15.4 | REACTOME VEGF LIGAND RECEPTOR INTERACTIONS | Genes involved in VEGF ligand-receptor interactions |
| 0.9 | 14.3 | REACTOME PHASE1 FUNCTIONALIZATION OF COMPOUNDS | Genes involved in Phase 1 - Functionalization of compounds |
| 0.9 | 24.6 | REACTOME AMINE LIGAND BINDING RECEPTORS | Genes involved in Amine ligand-binding receptors |
| 0.9 | 51.0 | REACTOME VOLTAGE GATED POTASSIUM CHANNELS | Genes involved in Voltage gated Potassium channels |
| 0.9 | 10.5 | REACTOME TRAFFICKING AND PROCESSING OF ENDOSOMAL TLR | Genes involved in Trafficking and processing of endosomal TLR |
| 0.9 | 38.3 | REACTOME HEPARAN SULFATE HEPARIN HS GAG METABOLISM | Genes involved in Heparan sulfate/heparin (HS-GAG) metabolism |
| 0.8 | 31.7 | REACTOME INWARDLY RECTIFYING K CHANNELS | Genes involved in Inwardly rectifying K+ channels |
| 0.8 | 4.1 | REACTOME ACETYLCHOLINE NEUROTRANSMITTER RELEASE CYCLE | Genes involved in Acetylcholine Neurotransmitter Release Cycle |
| 0.8 | 5.6 | REACTOME REGULATION OF BETA CELL DEVELOPMENT | Genes involved in Regulation of beta-cell development |
| 0.8 | 25.6 | REACTOME ACTIVATED AMPK STIMULATES FATTY ACID OXIDATION IN MUSCLE | Genes involved in Activated AMPK stimulates fatty-acid oxidation in muscle |
| 0.8 | 8.8 | REACTOME HORMONE LIGAND BINDING RECEPTORS | Genes involved in Hormone ligand-binding receptors |
| 0.8 | 31.7 | REACTOME SMOOTH MUSCLE CONTRACTION | Genes involved in Smooth Muscle Contraction |
| 0.8 | 30.6 | REACTOME INTERACTION BETWEEN L1 AND ANKYRINS | Genes involved in Interaction between L1 and Ankyrins |
| 0.8 | 41.6 | REACTOME ION CHANNEL TRANSPORT | Genes involved in Ion channel transport |
| 0.8 | 17.3 | REACTOME HIGHLY CALCIUM PERMEABLE POSTSYNAPTIC NICOTINIC ACETYLCHOLINE RECEPTORS | Genes involved in Highly calcium permeable postsynaptic nicotinic acetylcholine receptors |
| 0.7 | 13.3 | REACTOME GAP JUNCTION ASSEMBLY | Genes involved in Gap junction assembly |
| 0.7 | 9.6 | REACTOME PASSIVE TRANSPORT BY AQUAPORINS | Genes involved in Passive Transport by Aquaporins |
| 0.7 | 54.2 | REACTOME MYOGENESIS | Genes involved in Myogenesis |
| 0.7 | 1.4 | REACTOME ENDOSOMAL VACUOLAR PATHWAY | Genes involved in Endosomal/Vacuolar pathway |
| 0.7 | 12.7 | REACTOME SIGNALING BY FGFR3 MUTANTS | Genes involved in Signaling by FGFR3 mutants |
| 0.7 | 3.9 | REACTOME SIGNALLING TO P38 VIA RIT AND RIN | Genes involved in Signalling to p38 via RIT and RIN |
| 0.7 | 6.6 | REACTOME DOWNSTREAM TCR SIGNALING | Genes involved in Downstream TCR signaling |
| 0.7 | 14.4 | REACTOME ACTIVATION OF THE AP1 FAMILY OF TRANSCRIPTION FACTORS | Genes involved in Activation of the AP-1 family of transcription factors |
| 0.6 | 12.2 | REACTOME TERMINATION OF O GLYCAN BIOSYNTHESIS | Genes involved in Termination of O-glycan biosynthesis |
| 0.6 | 13.8 | REACTOME RIP MEDIATED NFKB ACTIVATION VIA DAI | Genes involved in RIP-mediated NFkB activation via DAI |
| 0.6 | 15.2 | REACTOME G ALPHA S SIGNALLING EVENTS | Genes involved in G alpha (s) signalling events |
| 0.6 | 14.3 | REACTOME IL1 SIGNALING | Genes involved in Interleukin-1 signaling |
| 0.6 | 14.8 | REACTOME DOWNREGULATION OF ERBB2 ERBB3 SIGNALING | Genes involved in Downregulation of ERBB2:ERBB3 signaling |
| 0.6 | 4.1 | REACTOME HYALURONAN UPTAKE AND DEGRADATION | Genes involved in Hyaluronan uptake and degradation |
| 0.6 | 7.6 | REACTOME CDC6 ASSOCIATION WITH THE ORC ORIGIN COMPLEX | Genes involved in CDC6 association with the ORC:origin complex |
| 0.6 | 4.6 | REACTOME BILE SALT AND ORGANIC ANION SLC TRANSPORTERS | Genes involved in Bile salt and organic anion SLC transporters |
| 0.6 | 5.7 | REACTOME G ALPHA Z SIGNALLING EVENTS | Genes involved in G alpha (z) signalling events |
| 0.6 | 6.6 | REACTOME SIGNALING BY HIPPO | Genes involved in Signaling by Hippo |
| 0.6 | 3.9 | REACTOME SIGNALING BY SCF KIT | Genes involved in Signaling by SCF-KIT |
| 0.5 | 6.5 | REACTOME GAMMA CARBOXYLATION TRANSPORT AND AMINO TERMINAL CLEAVAGE OF PROTEINS | Genes involved in Gamma-carboxylation, transport, and amino-terminal cleavage of proteins |
| 0.5 | 6.4 | REACTOME LIPOPROTEIN METABOLISM | Genes involved in Lipoprotein metabolism |
| 0.5 | 10.0 | REACTOME FACILITATIVE NA INDEPENDENT GLUCOSE TRANSPORTERS | Genes involved in Facilitative Na+-independent glucose transporters |
| 0.5 | 5.8 | REACTOME RECYCLING OF BILE ACIDS AND SALTS | Genes involved in Recycling of bile acids and salts |
| 0.5 | 6.3 | REACTOME TRANSPORT OF ORGANIC ANIONS | Genes involved in Transport of organic anions |
| 0.5 | 4.4 | REACTOME ADP SIGNALLING THROUGH P2RY1 | Genes involved in ADP signalling through P2Y purinoceptor 1 |
| 0.5 | 38.5 | REACTOME CELL SURFACE INTERACTIONS AT THE VASCULAR WALL | Genes involved in Cell surface interactions at the vascular wall |
| 0.5 | 2.4 | REACTOME G BETA GAMMA SIGNALLING THROUGH PLC BETA | Genes involved in G beta:gamma signalling through PLC beta |
| 0.5 | 1.9 | REACTOME RORA ACTIVATES CIRCADIAN EXPRESSION | Genes involved in RORA Activates Circadian Expression |
| 0.5 | 1.0 | REACTOME IRAK1 RECRUITS IKK COMPLEX | Genes involved in IRAK1 recruits IKK complex |
| 0.5 | 12.8 | REACTOME ADHERENS JUNCTIONS INTERACTIONS | Genes involved in Adherens junctions interactions |
| 0.5 | 6.1 | REACTOME NFKB ACTIVATION THROUGH FADD RIP1 PATHWAY MEDIATED BY CASPASE 8 AND10 | Genes involved in NF-kB activation through FADD/RIP-1 pathway mediated by caspase-8 and -10 |
| 0.5 | 43.2 | REACTOME CLASS B 2 SECRETIN FAMILY RECEPTORS | Genes involved in Class B/2 (Secretin family receptors) |
| 0.5 | 13.3 | REACTOME IL RECEPTOR SHC SIGNALING | Genes involved in Interleukin receptor SHC signaling |
| 0.5 | 7.8 | REACTOME ORGANIC CATION ANION ZWITTERION TRANSPORT | Genes involved in Organic cation/anion/zwitterion transport |
| 0.4 | 2.6 | REACTOME RNA POL I PROMOTER OPENING | Genes involved in RNA Polymerase I Promoter Opening |
| 0.4 | 6.9 | REACTOME SIGNALING BY NODAL | Genes involved in Signaling by NODAL |
| 0.4 | 13.5 | REACTOME UNBLOCKING OF NMDA RECEPTOR GLUTAMATE BINDING AND ACTIVATION | Genes involved in Unblocking of NMDA receptor, glutamate binding and activation |
| 0.4 | 4.7 | REACTOME OPSINS | Genes involved in Opsins |
| 0.4 | 1.7 | REACTOME NFKB IS ACTIVATED AND SIGNALS SURVIVAL | Genes involved in NF-kB is activated and signals survival |
| 0.4 | 0.8 | REACTOME HYALURONAN METABOLISM | Genes involved in Hyaluronan metabolism |
| 0.4 | 2.8 | REACTOME FGFR2C LIGAND BINDING AND ACTIVATION | Genes involved in FGFR2c ligand binding and activation |
| 0.4 | 0.4 | REACTOME PROLONGED ERK ACTIVATION EVENTS | Genes involved in Prolonged ERK activation events |
| 0.4 | 3.1 | REACTOME SIGNAL ATTENUATION | Genes involved in Signal attenuation |
| 0.4 | 10.7 | REACTOME GROWTH HORMONE RECEPTOR SIGNALING | Genes involved in Growth hormone receptor signaling |
| 0.4 | 7.5 | REACTOME SYNTHESIS OF GLYCOSYLPHOSPHATIDYLINOSITOL GPI | Genes involved in Synthesis of glycosylphosphatidylinositol (GPI) |
| 0.4 | 10.7 | REACTOME DEGRADATION OF THE EXTRACELLULAR MATRIX | Genes involved in Degradation of the extracellular matrix |
| 0.3 | 2.4 | REACTOME TANDEM PORE DOMAIN POTASSIUM CHANNELS | Genes involved in Tandem pore domain potassium channels |
| 0.3 | 3.1 | REACTOME SEMA3A PLEXIN REPULSION SIGNALING BY INHIBITING INTEGRIN ADHESION | Genes involved in SEMA3A-Plexin repulsion signaling by inhibiting Integrin adhesion |
| 0.3 | 5.1 | REACTOME PYRIMIDINE CATABOLISM | Genes involved in Pyrimidine catabolism |
| 0.3 | 2.5 | REACTOME GLUTAMATE NEUROTRANSMITTER RELEASE CYCLE | Genes involved in Glutamate Neurotransmitter Release Cycle |
| 0.3 | 1.5 | REACTOME GAP JUNCTION DEGRADATION | Genes involved in Gap junction degradation |
| 0.3 | 3.4 | REACTOME POTASSIUM CHANNELS | Genes involved in Potassium Channels |
| 0.3 | 17.2 | REACTOME G ALPHA I SIGNALLING EVENTS | Genes involved in G alpha (i) signalling events |
| 0.3 | 3.5 | REACTOME NEF MEDIATED DOWNREGULATION OF MHC CLASS I COMPLEX CELL SURFACE EXPRESSION | Genes involved in Nef mediated downregulation of MHC class I complex cell surface expression |
| 0.3 | 7.5 | REACTOME TRANSPORT OF GLUCOSE AND OTHER SUGARS BILE SALTS AND ORGANIC ACIDS METAL IONS AND AMINE COMPOUNDS | Genes involved in Transport of glucose and other sugars, bile salts and organic acids, metal ions and amine compounds |
| 0.3 | 7.2 | REACTOME NUCLEAR SIGNALING BY ERBB4 | Genes involved in Nuclear signaling by ERBB4 |
| 0.2 | 3.6 | REACTOME SYNTHESIS OF PE | Genes involved in Synthesis of PE |
| 0.2 | 0.9 | REACTOME SIGNAL REGULATORY PROTEIN SIRP FAMILY INTERACTIONS | Genes involved in Signal regulatory protein (SIRP) family interactions |
| 0.2 | 0.9 | REACTOME REGULATION OF SIGNALING BY CBL | Genes involved in Regulation of signaling by CBL |
| 0.2 | 7.5 | REACTOME EXTRACELLULAR MATRIX ORGANIZATION | Genes involved in Extracellular matrix organization |
| 0.2 | 1.6 | REACTOME GPVI MEDIATED ACTIVATION CASCADE | Genes involved in GPVI-mediated activation cascade |
| 0.2 | 0.9 | REACTOME NGF SIGNALLING VIA TRKA FROM THE PLASMA MEMBRANE | Genes involved in NGF signalling via TRKA from the plasma membrane |
| 0.2 | 2.5 | REACTOME ACTIVATION OF CHAPERONES BY ATF6 ALPHA | Genes involved in Activation of Chaperones by ATF6-alpha |
| 0.2 | 4.0 | REACTOME TRANSPORT OF VITAMINS NUCLEOSIDES AND RELATED MOLECULES | Genes involved in Transport of vitamins, nucleosides, and related molecules |
| 0.2 | 1.2 | REACTOME NITRIC OXIDE STIMULATES GUANYLATE CYCLASE | Genes involved in Nitric oxide stimulates guanylate cyclase |
| 0.2 | 0.8 | REACTOME FGFR1 LIGAND BINDING AND ACTIVATION | Genes involved in FGFR1 ligand binding and activation |
| 0.1 | 1.1 | REACTOME REGULATION OF THE FANCONI ANEMIA PATHWAY | Genes involved in Regulation of the Fanconi anemia pathway |
| 0.1 | 7.7 | REACTOME IMMUNOREGULATORY INTERACTIONS BETWEEN A LYMPHOID AND A NON LYMPHOID CELL | Genes involved in Immunoregulatory interactions between a Lymphoid and a non-Lymphoid cell |
| 0.1 | 3.9 | REACTOME TIGHT JUNCTION INTERACTIONS | Genes involved in Tight junction interactions |
| 0.1 | 1.9 | REACTOME PROCESSING OF INTRONLESS PRE MRNAS | Genes involved in Processing of Intronless Pre-mRNAs |
| 0.1 | 1.1 | REACTOME ACTIVATED NOTCH1 TRANSMITS SIGNAL TO THE NUCLEUS | Genes involved in Activated NOTCH1 Transmits Signal to the Nucleus |
| 0.1 | 0.6 | REACTOME GLYCOPROTEIN HORMONES | Genes involved in Glycoprotein hormones |
| 0.1 | 0.8 | REACTOME AKT PHOSPHORYLATES TARGETS IN THE CYTOSOL | Genes involved in AKT phosphorylates targets in the cytosol |
| 0.1 | 0.3 | REACTOME IL 7 SIGNALING | Genes involved in Interleukin-7 signaling |
| 0.1 | 0.7 | REACTOME CRMPS IN SEMA3A SIGNALING | Genes involved in CRMPs in Sema3A signaling |
| 0.0 | 0.2 | REACTOME REGULATION OF KIT SIGNALING | Genes involved in Regulation of KIT signaling |
| 0.0 | 0.1 | REACTOME ACETYLCHOLINE BINDING AND DOWNSTREAM EVENTS | Genes involved in Acetylcholine Binding And Downstream Events |
| 0.0 | 0.3 | REACTOME REGULATION OF IFNG SIGNALING | Genes involved in Regulation of IFNG signaling |