Project
GNF SymAtlas + NCI-60 cancer cell lines, human (Su, 2004; Ross, 2000)
Navigation
Downloads
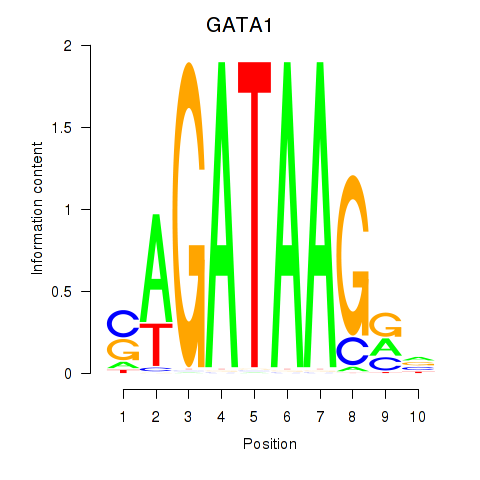
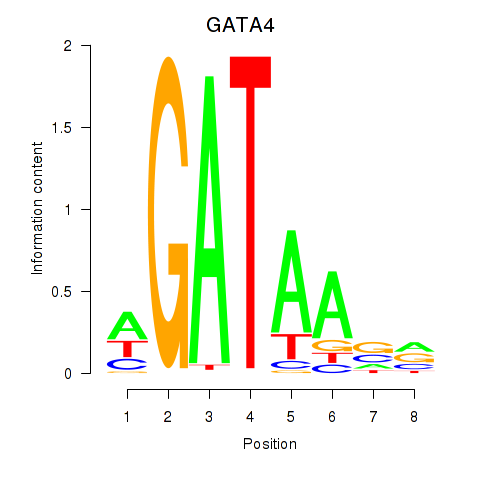
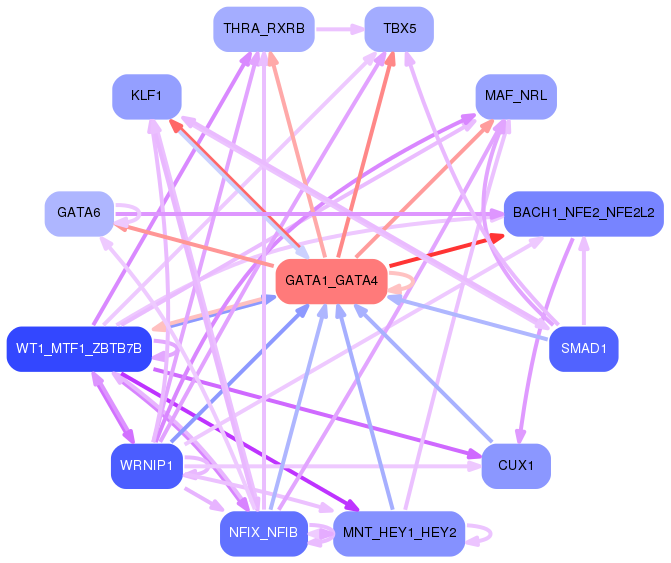
Results for GATA1_GATA4
Z-value: 2.12
Motif logo
Transcription factors associated with GATA1_GATA4
| Gene Symbol | Gene ID | Gene Info |
|---|---|---|
|
GATA1
|
ENSG00000102145.15 | GATA1 |
|
GATA4
|
ENSG00000136574.19 | GATA4 |
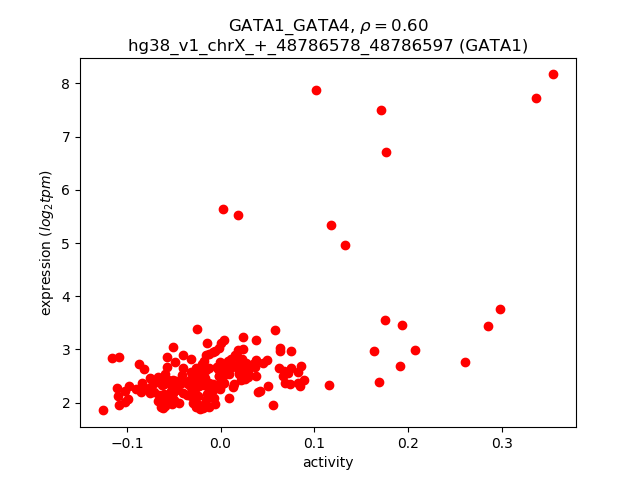
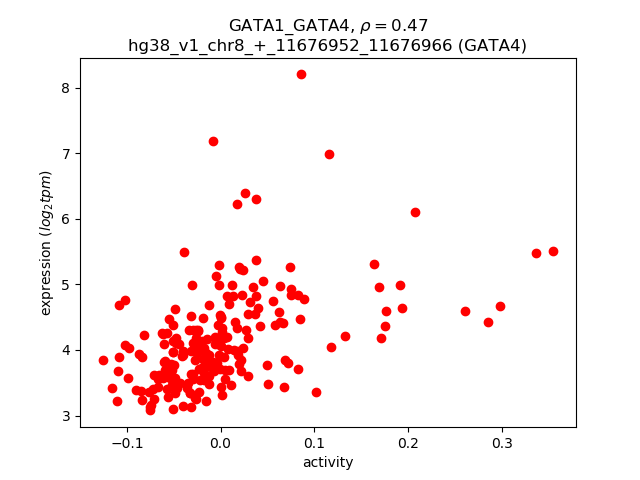
Activity-expression correlation:
| Gene | Promoter | Pearson corr. coef. | P-value | Plot |
|---|---|---|---|---|
| GATA1 | hg38_v1_chrX_+_48786578_48786597 | 0.60 | 1.1e-22 | Click! |
| GATA4 | hg38_v1_chr8_+_11676952_11676966 | 0.47 | 1.5e-13 | Click! |
Activity profile of GATA1_GATA4 motif
Sorted Z-values of GATA1_GATA4 motif
Network of associatons between targets according to the STRING database.

First level regulatory network of GATA1_GATA4
Gene Ontology Analysis
Gene overrepresentation in biological process category:
| Log-likelihood per target | Total log-likelihood | Term | Description |
|---|---|---|---|
| 8.1 | 24.3 | GO:0052331 | hemolysis by symbiont of host erythrocytes(GO:0019836) hemolysis in other organism(GO:0044179) hemolysis in other organism involved in symbiotic interaction(GO:0052331) |
| 7.9 | 102.7 | GO:0043249 | erythrocyte maturation(GO:0043249) |
| 7.6 | 15.2 | GO:0038162 | erythropoietin-mediated signaling pathway(GO:0038162) |
| 7.2 | 28.9 | GO:1903611 | regulation of calcium-dependent ATPase activity(GO:1903610) negative regulation of calcium-dependent ATPase activity(GO:1903611) regulation of dUTP diphosphatase activity(GO:1903627) positive regulation of dUTP diphosphatase activity(GO:1903629) negative regulation of aminoacyl-tRNA ligase activity(GO:1903631) regulation of leucine-tRNA ligase activity(GO:1903633) negative regulation of leucine-tRNA ligase activity(GO:1903634) |
| 7.2 | 28.7 | GO:0009822 | alkaloid catabolic process(GO:0009822) |
| 6.2 | 18.5 | GO:0003218 | cardiac left ventricle formation(GO:0003218) |
| 6.1 | 18.3 | GO:0018160 | peptidyl-pyrromethane cofactor linkage(GO:0018160) |
| 5.6 | 22.4 | GO:0044333 | Wnt signaling pathway involved in digestive tract morphogenesis(GO:0044333) |
| 5.2 | 175.1 | GO:0015695 | organic cation transport(GO:0015695) |
| 4.9 | 14.7 | GO:0032912 | negative regulation of transforming growth factor beta2 production(GO:0032912) |
| 4.6 | 127.7 | GO:0044241 | lipid digestion(GO:0044241) |
| 3.7 | 15.0 | GO:0002933 | lipid hydroxylation(GO:0002933) |
| 3.7 | 7.4 | GO:0033326 | cerebrospinal fluid secretion(GO:0033326) |
| 3.5 | 17.3 | GO:0045872 | positive regulation of rhodopsin gene expression(GO:0045872) |
| 3.2 | 19.4 | GO:0098707 | ferrous iron import into cell(GO:0097460) ferrous iron import across plasma membrane(GO:0098707) |
| 3.2 | 6.4 | GO:0042418 | epinephrine biosynthetic process(GO:0042418) |
| 3.1 | 12.5 | GO:0002215 | defense response to nematode(GO:0002215) |
| 3.0 | 9.1 | GO:0097272 | ammonia homeostasis(GO:0097272) |
| 2.9 | 8.8 | GO:1902303 | regulation of heart rate by hormone(GO:0003064) negative regulation of potassium ion export(GO:1902303) |
| 2.6 | 7.9 | GO:1990451 | cellular stress response to acidic pH(GO:1990451) |
| 2.6 | 10.3 | GO:0071918 | urea transmembrane transport(GO:0071918) |
| 2.5 | 7.4 | GO:0001869 | regulation of complement activation, lectin pathway(GO:0001868) negative regulation of complement activation, lectin pathway(GO:0001869) |
| 2.3 | 16.2 | GO:0042539 | hypotonic salinity response(GO:0042539) cellular hypotonic salinity response(GO:0071477) |
| 2.3 | 16.0 | GO:0031133 | cellular magnesium ion homeostasis(GO:0010961) regulation of axon diameter(GO:0031133) |
| 2.3 | 18.3 | GO:0042866 | pyruvate biosynthetic process(GO:0042866) |
| 2.2 | 26.6 | GO:0001955 | blood vessel maturation(GO:0001955) |
| 2.2 | 13.1 | GO:0015842 | aminergic neurotransmitter loading into synaptic vesicle(GO:0015842) |
| 2.2 | 15.1 | GO:0045347 | negative regulation of MHC class II biosynthetic process(GO:0045347) |
| 2.2 | 34.4 | GO:0006782 | protoporphyrinogen IX biosynthetic process(GO:0006782) |
| 2.1 | 12.8 | GO:1904274 | tricellular tight junction assembly(GO:1904274) |
| 2.1 | 6.2 | GO:0050928 | negative regulation of positive chemotaxis(GO:0050928) |
| 2.1 | 35.3 | GO:0015671 | oxygen transport(GO:0015671) |
| 2.1 | 6.2 | GO:0001544 | initiation of primordial ovarian follicle growth(GO:0001544) |
| 2.0 | 4.1 | GO:0018963 | phthalate metabolic process(GO:0018963) |
| 2.0 | 56.1 | GO:0009235 | cobalamin metabolic process(GO:0009235) |
| 2.0 | 9.9 | GO:0061113 | pancreas morphogenesis(GO:0061113) |
| 1.9 | 13.3 | GO:0072513 | positive regulation of secondary heart field cardioblast proliferation(GO:0072513) |
| 1.9 | 1.9 | GO:1903015 | regulation of exo-alpha-sialidase activity(GO:1903015) |
| 1.8 | 5.5 | GO:0060298 | positive regulation of sarcomere organization(GO:0060298) |
| 1.8 | 9.0 | GO:0061107 | seminal vesicle development(GO:0061107) |
| 1.8 | 7.0 | GO:0007499 | ectoderm and mesoderm interaction(GO:0007499) |
| 1.7 | 3.3 | GO:1902612 | regulation of anti-Mullerian hormone signaling pathway(GO:1902612) negative regulation of anti-Mullerian hormone signaling pathway(GO:1902613) anti-Mullerian hormone signaling pathway(GO:1990262) |
| 1.6 | 9.6 | GO:0052805 | histidine catabolic process(GO:0006548) imidazole-containing compound catabolic process(GO:0052805) |
| 1.6 | 14.2 | GO:0033088 | negative regulation of immature T cell proliferation in thymus(GO:0033088) |
| 1.5 | 9.2 | GO:0034196 | acylglycerol transport(GO:0034196) triglyceride transport(GO:0034197) |
| 1.5 | 4.6 | GO:0051365 | cellular response to potassium ion starvation(GO:0051365) |
| 1.5 | 19.3 | GO:1900747 | negative regulation of vascular endothelial growth factor signaling pathway(GO:1900747) |
| 1.5 | 10.2 | GO:0021999 | neural plate anterior/posterior regionalization(GO:0021999) |
| 1.4 | 10.1 | GO:0000821 | regulation of arginine metabolic process(GO:0000821) basic amino acid transmembrane transport(GO:1990822) |
| 1.4 | 10.0 | GO:0038172 | interleukin-33-mediated signaling pathway(GO:0038172) |
| 1.3 | 15.5 | GO:0001867 | complement activation, lectin pathway(GO:0001867) |
| 1.3 | 7.7 | GO:0036101 | leukotriene catabolic process(GO:0036100) leukotriene B4 catabolic process(GO:0036101) leukotriene B4 metabolic process(GO:0036102) icosanoid catabolic process(GO:1901523) fatty acid derivative catabolic process(GO:1901569) |
| 1.2 | 4.9 | GO:0005986 | sucrose biosynthetic process(GO:0005986) |
| 1.2 | 3.7 | GO:1903718 | carbamoyl phosphate metabolic process(GO:0070408) carbamoyl phosphate biosynthetic process(GO:0070409) cellular response to oleic acid(GO:0071400) response to ammonia(GO:1903717) cellular response to ammonia(GO:1903718) |
| 1.2 | 7.1 | GO:0002803 | positive regulation of antimicrobial peptide production(GO:0002225) positive regulation of antimicrobial humoral response(GO:0002760) positive regulation of antibacterial peptide production(GO:0002803) |
| 1.2 | 3.6 | GO:0071461 | cellular response to redox state(GO:0071461) |
| 1.1 | 3.4 | GO:1903288 | positive regulation of potassium ion import(GO:1903288) |
| 1.1 | 3.4 | GO:1903487 | regulation of lactation(GO:1903487) |
| 1.1 | 35.8 | GO:0006337 | nucleosome disassembly(GO:0006337) |
| 1.1 | 3.3 | GO:1901876 | regulation of the force of heart contraction by cardiac conduction(GO:0086092) regulation of calcium ion binding(GO:1901876) negative regulation of calcium ion binding(GO:1901877) negative regulation of calcium-transporting ATPase activity(GO:1901895) |
| 1.1 | 3.3 | GO:0033082 | regulation of extrathymic T cell differentiation(GO:0033082) sebum secreting cell proliferation(GO:1990654) |
| 1.1 | 3.3 | GO:1901165 | positive regulation of trophoblast cell migration(GO:1901165) |
| 1.1 | 4.4 | GO:0090107 | regulation of high-density lipoprotein particle assembly(GO:0090107) |
| 1.1 | 5.4 | GO:0070574 | cadmium ion transport(GO:0015691) cadmium ion transmembrane transport(GO:0070574) |
| 1.1 | 2.1 | GO:0045168 | cell-cell signaling involved in cell fate commitment(GO:0045168) |
| 1.0 | 5.2 | GO:0051935 | amino acid neurotransmitter reuptake(GO:0051933) glutamate reuptake(GO:0051935) |
| 1.0 | 8.2 | GO:0006477 | protein sulfation(GO:0006477) |
| 1.0 | 18.1 | GO:0020027 | hemoglobin metabolic process(GO:0020027) |
| 1.0 | 10.0 | GO:0035865 | cellular response to potassium ion(GO:0035865) |
| 1.0 | 2.0 | GO:0001807 | regulation of type IV hypersensitivity(GO:0001807) negative regulation of hypersensitivity(GO:0002884) |
| 1.0 | 3.0 | GO:0061394 | regulation of transcription from RNA polymerase II promoter in response to arsenic-containing substance(GO:0061394) |
| 1.0 | 30.3 | GO:1901685 | glutathione derivative metabolic process(GO:1901685) glutathione derivative biosynthetic process(GO:1901687) |
| 1.0 | 2.9 | GO:0072312 | metanephric glomerular epithelium development(GO:0072244) metanephric glomerular visceral epithelial cell differentiation(GO:0072248) metanephric glomerular visceral epithelial cell development(GO:0072249) metanephric glomerular epithelial cell differentiation(GO:0072312) metanephric glomerular epithelial cell development(GO:0072313) |
| 0.9 | 2.8 | GO:2001033 | negative regulation of double-strand break repair via nonhomologous end joining(GO:2001033) |
| 0.9 | 6.5 | GO:0035021 | negative regulation of Rac protein signal transduction(GO:0035021) |
| 0.9 | 9.3 | GO:0006621 | protein retention in ER lumen(GO:0006621) |
| 0.9 | 5.5 | GO:0006196 | AMP catabolic process(GO:0006196) |
| 0.9 | 11.1 | GO:0043031 | negative regulation of macrophage activation(GO:0043031) positive regulation of phospholipid biosynthetic process(GO:0071073) |
| 0.9 | 2.7 | GO:0019376 | galactolipid catabolic process(GO:0019376) |
| 0.9 | 2.7 | GO:0035054 | embryonic heart tube anterior/posterior pattern specification(GO:0035054) |
| 0.9 | 3.6 | GO:0086097 | phospholipase C-activating angiotensin-activated signaling pathway(GO:0086097) |
| 0.9 | 2.7 | GO:0097156 | fasciculation of motor neuron axon(GO:0097156) |
| 0.9 | 23.7 | GO:0046597 | negative regulation of viral entry into host cell(GO:0046597) |
| 0.9 | 2.6 | GO:0061364 | apoptotic process involved in luteolysis(GO:0061364) |
| 0.9 | 3.5 | GO:0002879 | positive regulation of acute inflammatory response to non-antigenic stimulus(GO:0002879) |
| 0.9 | 6.9 | GO:0042904 | 9-cis-retinoic acid biosynthetic process(GO:0042904) 9-cis-retinoic acid metabolic process(GO:0042905) |
| 0.9 | 1.7 | GO:0033084 | regulation of immature T cell proliferation in thymus(GO:0033084) |
| 0.8 | 18.5 | GO:0007597 | blood coagulation, intrinsic pathway(GO:0007597) |
| 0.8 | 3.3 | GO:0072166 | posterior mesonephric tubule development(GO:0072166) negative regulation of metanephric glomerulus development(GO:0072299) negative regulation of metanephric glomerular mesangial cell proliferation(GO:0072302) |
| 0.8 | 3.1 | GO:0014738 | regulation of muscle hyperplasia(GO:0014738) |
| 0.8 | 9.4 | GO:0051873 | killing by host of symbiont cells(GO:0051873) |
| 0.8 | 8.4 | GO:1990573 | potassium ion import across plasma membrane(GO:1990573) |
| 0.8 | 4.6 | GO:0070171 | negative regulation of tooth mineralization(GO:0070171) |
| 0.8 | 2.3 | GO:0090370 | negative regulation of cholesterol efflux(GO:0090370) |
| 0.7 | 17.9 | GO:0001976 | neurological system process involved in regulation of systemic arterial blood pressure(GO:0001976) |
| 0.7 | 3.7 | GO:0015886 | heme transport(GO:0015886) |
| 0.7 | 1.5 | GO:0048859 | formation of anatomical boundary(GO:0048859) |
| 0.7 | 3.6 | GO:1904073 | regulation of trophectodermal cell proliferation(GO:1904073) positive regulation of trophectodermal cell proliferation(GO:1904075) |
| 0.7 | 2.1 | GO:0032707 | negative regulation of interleukin-23 production(GO:0032707) |
| 0.7 | 12.7 | GO:0006704 | glucocorticoid biosynthetic process(GO:0006704) |
| 0.7 | 3.4 | GO:0018352 | protein-pyridoxal-5-phosphate linkage(GO:0018352) |
| 0.7 | 2.1 | GO:0038043 | interleukin-5-mediated signaling pathway(GO:0038043) |
| 0.7 | 2.0 | GO:0007525 | somatic muscle development(GO:0007525) |
| 0.7 | 8.2 | GO:0008627 | intrinsic apoptotic signaling pathway in response to osmotic stress(GO:0008627) |
| 0.7 | 3.4 | GO:0032971 | regulation of muscle filament sliding(GO:0032971) |
| 0.7 | 10.8 | GO:0016540 | protein autoprocessing(GO:0016540) |
| 0.7 | 7.4 | GO:0032000 | positive regulation of fatty acid beta-oxidation(GO:0032000) |
| 0.7 | 4.0 | GO:0022614 | membrane to membrane docking(GO:0022614) |
| 0.7 | 0.7 | GO:0002784 | regulation of antimicrobial peptide production(GO:0002784) regulation of antibacterial peptide production(GO:0002786) |
| 0.6 | 15.4 | GO:0033014 | porphyrin-containing compound biosynthetic process(GO:0006779) tetrapyrrole biosynthetic process(GO:0033014) |
| 0.6 | 4.5 | GO:0072656 | maintenance of protein location in mitochondrion(GO:0072656) |
| 0.6 | 2.5 | GO:0006581 | acetylcholine catabolic process in synaptic cleft(GO:0001507) acetylcholine catabolic process(GO:0006581) |
| 0.6 | 4.4 | GO:0071504 | response to heparin(GO:0071503) cellular response to heparin(GO:0071504) |
| 0.6 | 3.1 | GO:0002074 | extraocular skeletal muscle development(GO:0002074) |
| 0.6 | 1.8 | GO:0007538 | primary sex determination(GO:0007538) |
| 0.6 | 3.6 | GO:0001826 | inner cell mass cell differentiation(GO:0001826) |
| 0.6 | 2.9 | GO:1903385 | regulation of homophilic cell adhesion(GO:1903385) |
| 0.6 | 2.9 | GO:0021997 | neural plate axis specification(GO:0021997) |
| 0.6 | 2.9 | GO:2000382 | positive regulation of mesoderm development(GO:2000382) |
| 0.6 | 9.8 | GO:0045199 | maintenance of apical/basal cell polarity(GO:0035090) maintenance of epithelial cell apical/basal polarity(GO:0045199) |
| 0.6 | 11.3 | GO:0010623 | programmed cell death involved in cell development(GO:0010623) |
| 0.6 | 6.2 | GO:0046951 | ketone body biosynthetic process(GO:0046951) |
| 0.6 | 6.7 | GO:0006069 | ethanol oxidation(GO:0006069) |
| 0.6 | 4.5 | GO:0009957 | epidermal cell fate specification(GO:0009957) |
| 0.6 | 3.9 | GO:0060750 | epithelial cell proliferation involved in mammary gland duct elongation(GO:0060750) |
| 0.6 | 1.1 | GO:0061582 | intestinal epithelial cell migration(GO:0061582) |
| 0.6 | 13.2 | GO:0042359 | vitamin D metabolic process(GO:0042359) |
| 0.6 | 3.3 | GO:0045918 | negative regulation of cytolysis(GO:0045918) |
| 0.5 | 2.2 | GO:0097168 | condensed mesenchymal cell proliferation(GO:0072137) mesenchymal stem cell proliferation(GO:0097168) positive regulation of chondrocyte proliferation(GO:1902732) |
| 0.5 | 5.8 | GO:0051791 | medium-chain fatty acid metabolic process(GO:0051791) |
| 0.5 | 11.5 | GO:0052695 | cellular glucuronidation(GO:0052695) |
| 0.5 | 10.3 | GO:0006957 | complement activation, alternative pathway(GO:0006957) |
| 0.5 | 1.5 | GO:0033364 | mast cell secretory granule organization(GO:0033364) |
| 0.5 | 2.6 | GO:0033216 | ferric iron import(GO:0033216) ferric iron import into cell(GO:0097461) ferric iron import across plasma membrane(GO:0098706) |
| 0.5 | 1.5 | GO:0002378 | immunoglobulin biosynthetic process(GO:0002378) |
| 0.5 | 3.5 | GO:0055009 | atrial cardiac muscle tissue development(GO:0003228) atrial cardiac muscle tissue morphogenesis(GO:0055009) |
| 0.5 | 0.5 | GO:1900425 | negative regulation of defense response to bacterium(GO:1900425) |
| 0.5 | 3.0 | GO:0060011 | Sertoli cell proliferation(GO:0060011) |
| 0.5 | 0.5 | GO:2000405 | negative regulation of T cell migration(GO:2000405) |
| 0.5 | 1.4 | GO:0007343 | egg activation(GO:0007343) |
| 0.5 | 4.2 | GO:0099566 | regulation of postsynaptic cytosolic calcium ion concentration(GO:0099566) |
| 0.5 | 1.8 | GO:0050917 | sensory perception of umami taste(GO:0050917) |
| 0.5 | 9.2 | GO:0035855 | megakaryocyte development(GO:0035855) |
| 0.5 | 3.7 | GO:0070995 | NADPH oxidation(GO:0070995) |
| 0.5 | 1.4 | GO:0014022 | neural plate elongation(GO:0014022) convergent extension involved in neural plate elongation(GO:0022007) |
| 0.5 | 1.8 | GO:0016098 | monoterpenoid metabolic process(GO:0016098) |
| 0.5 | 0.5 | GO:0045401 | interleukin-3 production(GO:0032632) regulation of interleukin-3 production(GO:0032672) positive regulation of interleukin-3 production(GO:0032752) interleukin-3 biosynthetic process(GO:0042223) regulation of interleukin-3 biosynthetic process(GO:0045399) positive regulation of interleukin-3 biosynthetic process(GO:0045401) regulation of granulocyte macrophage colony-stimulating factor biosynthetic process(GO:0045423) positive regulation of granulocyte macrophage colony-stimulating factor biosynthetic process(GO:0045425) |
| 0.5 | 2.7 | GO:0001920 | negative regulation of receptor recycling(GO:0001920) |
| 0.5 | 2.3 | GO:0071895 | odontoblast differentiation(GO:0071895) |
| 0.4 | 1.3 | GO:0019605 | benzoate metabolic process(GO:0018874) butyrate metabolic process(GO:0019605) |
| 0.4 | 28.1 | GO:0060135 | maternal process involved in female pregnancy(GO:0060135) |
| 0.4 | 1.7 | GO:0030035 | microspike assembly(GO:0030035) |
| 0.4 | 16.1 | GO:0090022 | regulation of neutrophil chemotaxis(GO:0090022) |
| 0.4 | 1.3 | GO:1901624 | negative regulation of lymphocyte chemotaxis(GO:1901624) |
| 0.4 | 1.3 | GO:0034653 | diterpenoid catabolic process(GO:0016103) retinoic acid catabolic process(GO:0034653) |
| 0.4 | 1.3 | GO:1900383 | regulation of synaptic plasticity by receptor localization to synapse(GO:1900383) |
| 0.4 | 3.8 | GO:0007288 | sperm axoneme assembly(GO:0007288) |
| 0.4 | 3.8 | GO:0086024 | adrenergic receptor signaling pathway involved in positive regulation of heart rate(GO:0086024) |
| 0.4 | 30.6 | GO:0019730 | antimicrobial humoral response(GO:0019730) |
| 0.4 | 1.6 | GO:0006572 | tyrosine catabolic process(GO:0006572) |
| 0.4 | 1.2 | GO:0035377 | transepithelial water transport(GO:0035377) positive regulation of cyclic nucleotide-gated ion channel activity(GO:1902161) |
| 0.4 | 2.3 | GO:0072502 | cellular phosphate ion homeostasis(GO:0030643) cellular divalent inorganic anion homeostasis(GO:0072501) cellular trivalent inorganic anion homeostasis(GO:0072502) |
| 0.4 | 4.9 | GO:2000291 | regulation of myoblast proliferation(GO:2000291) |
| 0.4 | 1.9 | GO:0051454 | pH elevation(GO:0045852) intracellular pH elevation(GO:0051454) |
| 0.4 | 2.6 | GO:0042738 | exogenous drug catabolic process(GO:0042738) |
| 0.4 | 9.9 | GO:0003301 | physiological muscle hypertrophy(GO:0003298) physiological cardiac muscle hypertrophy(GO:0003301) cell growth involved in cardiac muscle cell development(GO:0061049) |
| 0.4 | 3.6 | GO:0034058 | endosomal vesicle fusion(GO:0034058) |
| 0.3 | 2.0 | GO:0006651 | diacylglycerol biosynthetic process(GO:0006651) |
| 0.3 | 1.0 | GO:2000317 | negative regulation of T-helper 17 type immune response(GO:2000317) negative regulation of T-helper 17 cell differentiation(GO:2000320) |
| 0.3 | 1.0 | GO:0015888 | thiamine transport(GO:0015888) thiamine transmembrane transport(GO:0071934) |
| 0.3 | 2.0 | GO:1903237 | negative regulation of leukocyte tethering or rolling(GO:1903237) negative regulation of leukocyte adhesion to vascular endothelial cell(GO:1904995) |
| 0.3 | 7.5 | GO:0050860 | negative regulation of T cell receptor signaling pathway(GO:0050860) |
| 0.3 | 1.3 | GO:0036269 | swimming behavior(GO:0036269) |
| 0.3 | 19.1 | GO:0032642 | regulation of chemokine production(GO:0032642) |
| 0.3 | 1.0 | GO:0035502 | metanephric part of ureteric bud development(GO:0035502) |
| 0.3 | 0.9 | GO:0060708 | spongiotrophoblast differentiation(GO:0060708) |
| 0.3 | 0.9 | GO:1904387 | response to human chorionic gonadotropin(GO:0044752) cellular response to thyroxine stimulus(GO:0097069) cellular response to L-phenylalanine derivative(GO:1904387) |
| 0.3 | 6.2 | GO:0006525 | arginine metabolic process(GO:0006525) |
| 0.3 | 5.2 | GO:0006825 | copper ion transport(GO:0006825) |
| 0.3 | 12.2 | GO:0018149 | peptide cross-linking(GO:0018149) |
| 0.3 | 3.3 | GO:0006657 | CDP-choline pathway(GO:0006657) |
| 0.3 | 8.4 | GO:0050829 | defense response to Gram-negative bacterium(GO:0050829) |
| 0.3 | 42.3 | GO:0046718 | viral entry into host cell(GO:0046718) |
| 0.3 | 1.5 | GO:0045959 | regulation of complement activation, classical pathway(GO:0030450) negative regulation of complement activation, classical pathway(GO:0045959) |
| 0.3 | 7.3 | GO:0071420 | cellular response to histamine(GO:0071420) |
| 0.3 | 3.7 | GO:0015074 | DNA integration(GO:0015074) |
| 0.3 | 2.5 | GO:0006189 | 'de novo' IMP biosynthetic process(GO:0006189) tetrahydrofolate biosynthetic process(GO:0046654) |
| 0.3 | 7.7 | GO:0016338 | calcium-independent cell-cell adhesion via plasma membrane cell-adhesion molecules(GO:0016338) |
| 0.3 | 1.9 | GO:0060088 | auditory receptor cell stereocilium organization(GO:0060088) |
| 0.3 | 1.1 | GO:2001106 | regulation of Rho guanyl-nucleotide exchange factor activity(GO:2001106) |
| 0.3 | 3.2 | GO:0030854 | positive regulation of granulocyte differentiation(GO:0030854) |
| 0.3 | 4.6 | GO:0002726 | positive regulation of T cell cytokine production(GO:0002726) |
| 0.3 | 2.6 | GO:0086043 | bundle of His cell to Purkinje myocyte signaling(GO:0086028) bundle of His cell action potential(GO:0086043) |
| 0.3 | 4.9 | GO:0002820 | negative regulation of adaptive immune response(GO:0002820) |
| 0.2 | 1.7 | GO:0060452 | positive regulation of cardiac muscle contraction(GO:0060452) |
| 0.2 | 2.0 | GO:0043951 | negative regulation of cAMP-mediated signaling(GO:0043951) |
| 0.2 | 3.9 | GO:0097151 | positive regulation of inhibitory postsynaptic potential(GO:0097151) modulation of inhibitory postsynaptic potential(GO:0098828) |
| 0.2 | 2.7 | GO:0021702 | cerebellar Purkinje cell layer formation(GO:0021694) cerebellar Purkinje cell differentiation(GO:0021702) |
| 0.2 | 3.2 | GO:0051386 | regulation of neurotrophin TRK receptor signaling pathway(GO:0051386) |
| 0.2 | 3.4 | GO:0045725 | positive regulation of glycogen biosynthetic process(GO:0045725) |
| 0.2 | 1.4 | GO:1904936 | cerebral cortex GABAergic interneuron migration(GO:0021853) interneuron migration(GO:1904936) |
| 0.2 | 3.3 | GO:0001973 | adenosine receptor signaling pathway(GO:0001973) |
| 0.2 | 4.0 | GO:0019371 | cyclooxygenase pathway(GO:0019371) |
| 0.2 | 9.8 | GO:0007618 | mating(GO:0007618) |
| 0.2 | 1.1 | GO:2000860 | positive regulation of mineralocorticoid secretion(GO:2000857) positive regulation of aldosterone secretion(GO:2000860) |
| 0.2 | 0.8 | GO:0030862 | positive regulation of polarized epithelial cell differentiation(GO:0030862) |
| 0.2 | 10.4 | GO:0006730 | one-carbon metabolic process(GO:0006730) |
| 0.2 | 0.8 | GO:0070092 | glucagon secretion(GO:0070091) regulation of glucagon secretion(GO:0070092) |
| 0.2 | 5.0 | GO:0007214 | gamma-aminobutyric acid signaling pathway(GO:0007214) |
| 0.2 | 4.1 | GO:2000178 | negative regulation of neural precursor cell proliferation(GO:2000178) |
| 0.2 | 0.4 | GO:0060335 | positive regulation of response to interferon-gamma(GO:0060332) positive regulation of interferon-gamma-mediated signaling pathway(GO:0060335) |
| 0.2 | 1.7 | GO:0002175 | protein localization to paranode region of axon(GO:0002175) |
| 0.2 | 15.2 | GO:0046849 | bone remodeling(GO:0046849) |
| 0.2 | 1.1 | GO:2000189 | positive regulation of cholesterol homeostasis(GO:2000189) |
| 0.2 | 2.7 | GO:0006883 | cellular sodium ion homeostasis(GO:0006883) |
| 0.2 | 2.6 | GO:0018214 | peptidyl-glutamic acid carboxylation(GO:0017187) protein carboxylation(GO:0018214) |
| 0.2 | 0.5 | GO:0044339 | canonical Wnt signaling pathway involved in osteoblast differentiation(GO:0044339) |
| 0.2 | 1.5 | GO:0061343 | cell adhesion involved in heart morphogenesis(GO:0061343) |
| 0.2 | 4.2 | GO:0044804 | nucleophagy(GO:0044804) |
| 0.2 | 1.5 | GO:0002438 | acute inflammatory response to antigenic stimulus(GO:0002438) |
| 0.2 | 2.4 | GO:0035970 | peptidyl-threonine dephosphorylation(GO:0035970) |
| 0.2 | 3.2 | GO:0006833 | water transport(GO:0006833) |
| 0.2 | 12.0 | GO:1990748 | cellular oxidant detoxification(GO:0098869) cellular detoxification(GO:1990748) |
| 0.2 | 2.6 | GO:0045662 | negative regulation of myoblast differentiation(GO:0045662) |
| 0.2 | 0.8 | GO:0034378 | chylomicron assembly(GO:0034378) |
| 0.2 | 1.1 | GO:0010886 | positive regulation of cholesterol storage(GO:0010886) |
| 0.2 | 8.9 | GO:0016266 | O-glycan processing(GO:0016266) |
| 0.2 | 4.1 | GO:0016246 | RNA interference(GO:0016246) |
| 0.1 | 8.5 | GO:0048384 | retinoic acid receptor signaling pathway(GO:0048384) |
| 0.1 | 4.1 | GO:0045746 | negative regulation of Notch signaling pathway(GO:0045746) |
| 0.1 | 1.8 | GO:0035563 | positive regulation of chromatin binding(GO:0035563) |
| 0.1 | 1.0 | GO:0045144 | meiotic sister chromatid segregation(GO:0045144) |
| 0.1 | 1.0 | GO:0060235 | lens induction in camera-type eye(GO:0060235) |
| 0.1 | 2.0 | GO:0003376 | sphingosine-1-phosphate signaling pathway(GO:0003376) |
| 0.1 | 1.3 | GO:0045059 | positive thymic T cell selection(GO:0045059) |
| 0.1 | 1.1 | GO:0016576 | histone dephosphorylation(GO:0016576) |
| 0.1 | 9.4 | GO:0006968 | cellular defense response(GO:0006968) |
| 0.1 | 1.9 | GO:1902260 | negative regulation of delayed rectifier potassium channel activity(GO:1902260) negative regulation of voltage-gated potassium channel activity(GO:1903817) |
| 0.1 | 1.0 | GO:2000271 | positive regulation of fibroblast apoptotic process(GO:2000271) |
| 0.1 | 0.3 | GO:0071335 | submandibular salivary gland formation(GO:0060661) hair follicle cell proliferation(GO:0071335) regulation of hair follicle cell proliferation(GO:0071336) positive regulation of hair follicle cell proliferation(GO:0071338) |
| 0.1 | 0.8 | GO:0010908 | regulation of heparan sulfate proteoglycan biosynthetic process(GO:0010908) positive regulation of heparan sulfate proteoglycan biosynthetic process(GO:0010909) canonical Wnt signaling pathway involved in positive regulation of epithelial to mesenchymal transition(GO:0044334) positive regulation of proteoglycan biosynthetic process(GO:1902730) |
| 0.1 | 11.2 | GO:0050911 | detection of chemical stimulus involved in sensory perception of smell(GO:0050911) |
| 0.1 | 3.0 | GO:0002027 | regulation of heart rate(GO:0002027) |
| 0.1 | 2.6 | GO:0090162 | establishment of epithelial cell polarity(GO:0090162) |
| 0.1 | 1.9 | GO:0001945 | lymph vessel development(GO:0001945) |
| 0.1 | 2.6 | GO:0010039 | response to iron ion(GO:0010039) |
| 0.1 | 0.9 | GO:0031936 | negative regulation of chromatin silencing(GO:0031936) |
| 0.1 | 3.4 | GO:0006506 | GPI anchor biosynthetic process(GO:0006506) |
| 0.1 | 2.5 | GO:0007339 | binding of sperm to zona pellucida(GO:0007339) |
| 0.1 | 2.6 | GO:0042462 | eye photoreceptor cell development(GO:0042462) |
| 0.1 | 1.0 | GO:0015727 | lactate transport(GO:0015727) lactate transmembrane transport(GO:0035873) |
| 0.1 | 1.1 | GO:0033189 | response to vitamin A(GO:0033189) |
| 0.1 | 1.5 | GO:0051353 | positive regulation of oxidoreductase activity(GO:0051353) |
| 0.1 | 7.3 | GO:0070268 | cornification(GO:0070268) |
| 0.1 | 2.3 | GO:0000188 | inactivation of MAPK activity(GO:0000188) |
| 0.1 | 3.2 | GO:0007099 | centriole replication(GO:0007099) |
| 0.1 | 4.7 | GO:0032024 | positive regulation of insulin secretion(GO:0032024) |
| 0.1 | 4.6 | GO:0043631 | mRNA polyadenylation(GO:0006378) RNA polyadenylation(GO:0043631) |
| 0.1 | 3.7 | GO:0042551 | neuron maturation(GO:0042551) |
| 0.1 | 1.4 | GO:0006895 | Golgi to endosome transport(GO:0006895) |
| 0.1 | 1.2 | GO:0043517 | positive regulation of DNA damage response, signal transduction by p53 class mediator(GO:0043517) |
| 0.1 | 3.3 | GO:1901998 | toxin transport(GO:1901998) |
| 0.1 | 1.0 | GO:0010801 | negative regulation of peptidyl-threonine phosphorylation(GO:0010801) |
| 0.1 | 0.8 | GO:0006108 | malate metabolic process(GO:0006108) |
| 0.1 | 1.7 | GO:0045332 | lipid translocation(GO:0034204) phospholipid translocation(GO:0045332) |
| 0.1 | 1.3 | GO:0070734 | histone H3-K27 methylation(GO:0070734) |
| 0.1 | 3.8 | GO:0006611 | protein export from nucleus(GO:0006611) |
| 0.1 | 1.7 | GO:0071425 | hematopoietic stem cell proliferation(GO:0071425) |
| 0.1 | 1.6 | GO:0060397 | JAK-STAT cascade involved in growth hormone signaling pathway(GO:0060397) |
| 0.1 | 1.7 | GO:0061014 | positive regulation of mRNA catabolic process(GO:0061014) |
| 0.1 | 2.6 | GO:0006409 | tRNA export from nucleus(GO:0006409) tRNA-containing ribonucleoprotein complex export from nucleus(GO:0071431) |
| 0.1 | 0.3 | GO:0045842 | positive regulation of mitotic metaphase/anaphase transition(GO:0045842) negative regulation of sister chromatid cohesion(GO:0045875) positive regulation of mitotic sister chromatid separation(GO:1901970) positive regulation of metaphase/anaphase transition of cell cycle(GO:1902101) |
| 0.1 | 1.4 | GO:0039694 | viral RNA genome replication(GO:0039694) RNA replication(GO:0039703) |
| 0.1 | 0.7 | GO:0000920 | cell separation after cytokinesis(GO:0000920) negative regulation of epidermal growth factor-activated receptor activity(GO:0007175) |
| 0.1 | 0.8 | GO:0045730 | respiratory burst(GO:0045730) |
| 0.1 | 0.2 | GO:0042362 | fat-soluble vitamin biosynthetic process(GO:0042362) |
| 0.1 | 2.4 | GO:0019228 | neuronal action potential(GO:0019228) |
| 0.1 | 0.7 | GO:1903358 | regulation of Golgi organization(GO:1903358) |
| 0.0 | 1.5 | GO:0033198 | response to ATP(GO:0033198) |
| 0.0 | 7.0 | GO:0061337 | cardiac conduction(GO:0061337) |
| 0.0 | 0.5 | GO:0071600 | otic vesicle morphogenesis(GO:0071600) |
| 0.0 | 2.5 | GO:0002687 | positive regulation of leukocyte migration(GO:0002687) |
| 0.0 | 0.6 | GO:0043508 | negative regulation of JUN kinase activity(GO:0043508) |
| 0.0 | 1.3 | GO:0032755 | positive regulation of interleukin-6 production(GO:0032755) |
| 0.0 | 2.2 | GO:0033275 | muscle filament sliding(GO:0030049) actin-myosin filament sliding(GO:0033275) |
| 0.0 | 1.4 | GO:0043928 | nuclear-transcribed mRNA catabolic process, exonucleolytic(GO:0000291) exonucleolytic nuclear-transcribed mRNA catabolic process involved in deadenylation-dependent decay(GO:0043928) |
| 0.0 | 0.1 | GO:0070857 | regulation of bile acid biosynthetic process(GO:0070857) |
| 0.0 | 1.3 | GO:0048146 | positive regulation of fibroblast proliferation(GO:0048146) |
| 0.0 | 1.5 | GO:0050715 | positive regulation of cytokine secretion(GO:0050715) |
| 0.0 | 2.0 | GO:0006501 | C-terminal protein lipidation(GO:0006501) |
| 0.0 | 0.1 | GO:0035461 | vitamin transmembrane transport(GO:0035461) |
| 0.0 | 0.3 | GO:0033004 | negative regulation of mast cell activation(GO:0033004) |
| 0.0 | 0.7 | GO:0051482 | positive regulation of cytosolic calcium ion concentration involved in phospholipase C-activating G-protein coupled signaling pathway(GO:0051482) |
| 0.0 | 0.6 | GO:0090312 | negative regulation of DNA damage response, signal transduction by p53 class mediator(GO:0043518) positive regulation of protein deacetylation(GO:0090312) |
| 0.0 | 2.1 | GO:0007631 | feeding behavior(GO:0007631) |
| 0.0 | 0.4 | GO:0033141 | positive regulation of peptidyl-serine phosphorylation of STAT protein(GO:0033141) |
| 0.0 | 0.4 | GO:0001580 | detection of chemical stimulus involved in sensory perception of bitter taste(GO:0001580) |
| 0.0 | 0.6 | GO:1900047 | negative regulation of blood coagulation(GO:0030195) negative regulation of hemostasis(GO:1900047) |
| 0.0 | 1.4 | GO:0050805 | negative regulation of synaptic transmission(GO:0050805) |
| 0.0 | 0.5 | GO:0006953 | acute-phase response(GO:0006953) |
| 0.0 | 0.7 | GO:0016486 | peptide hormone processing(GO:0016486) |
| 0.0 | 2.5 | GO:0008203 | cholesterol metabolic process(GO:0008203) |
| 0.0 | 0.6 | GO:0016339 | calcium-dependent cell-cell adhesion via plasma membrane cell adhesion molecules(GO:0016339) |
| 0.0 | 0.1 | GO:0019464 | glycine catabolic process(GO:0006546) glycine decarboxylation via glycine cleavage system(GO:0019464) |
| 0.0 | 0.7 | GO:0019233 | sensory perception of pain(GO:0019233) |
| 0.0 | 0.1 | GO:0042573 | retinoic acid metabolic process(GO:0042573) |
| 0.0 | 0.8 | GO:0043966 | histone H3 acetylation(GO:0043966) |
Gene overrepresentation in cellular component category:
| Log-likelihood per target | Total log-likelihood | Term | Description |
|---|---|---|---|
| 5.2 | 78.4 | GO:0005833 | hemoglobin complex(GO:0005833) |
| 5.0 | 19.9 | GO:0034365 | discoidal high-density lipoprotein particle(GO:0034365) |
| 3.1 | 18.6 | GO:1990584 | cardiac Troponin complex(GO:1990584) |
| 3.0 | 9.0 | GO:0036029 | protein C inhibitor-TMPRSS7 complex(GO:0036024) protein C inhibitor-TMPRSS11E complex(GO:0036025) protein C inhibitor-PLAT complex(GO:0036026) protein C inhibitor-PLAU complex(GO:0036027) protein C inhibitor-thrombin complex(GO:0036028) protein C inhibitor-KLK3 complex(GO:0036029) protein C inhibitor-plasma kallikrein complex(GO:0036030) serine protease inhibitor complex(GO:0097180) protein C inhibitor-coagulation factor V complex(GO:0097181) protein C inhibitor-coagulation factor Xa complex(GO:0097182) protein C inhibitor-coagulation factor XI complex(GO:0097183) |
| 2.6 | 15.4 | GO:0032437 | cuticular plate(GO:0032437) |
| 2.2 | 6.6 | GO:0097679 | other organism cytoplasm(GO:0097679) |
| 1.8 | 8.8 | GO:1902937 | inward rectifier potassium channel complex(GO:1902937) |
| 1.6 | 12.8 | GO:0061689 | tricellular tight junction(GO:0061689) |
| 1.5 | 19.3 | GO:0098647 | collagen type VI trimer(GO:0005589) collagen beaded filament(GO:0098647) |
| 1.4 | 5.8 | GO:0005863 | striated muscle myosin thick filament(GO:0005863) |
| 1.4 | 19.4 | GO:1990712 | HFE-transferrin receptor complex(GO:1990712) |
| 1.3 | 4.0 | GO:0071065 | alpha9-beta1 integrin-vascular cell adhesion molecule-1 complex(GO:0071065) |
| 1.3 | 24.4 | GO:0031089 | platelet dense granule lumen(GO:0031089) |
| 1.2 | 8.4 | GO:0008282 | ATP-sensitive potassium channel complex(GO:0008282) |
| 1.1 | 39.1 | GO:0080008 | Cul4-RING E3 ubiquitin ligase complex(GO:0080008) |
| 1.1 | 7.8 | GO:0097209 | epidermal lamellar body(GO:0097209) |
| 1.1 | 9.8 | GO:0070083 | clathrin-sculpted monoamine transport vesicle(GO:0070081) clathrin-sculpted monoamine transport vesicle membrane(GO:0070083) |
| 1.1 | 4.2 | GO:0038038 | G-protein coupled receptor homodimeric complex(GO:0038038) |
| 0.9 | 7.4 | GO:0045179 | apical cortex(GO:0045179) |
| 0.8 | 3.4 | GO:0005899 | insulin receptor complex(GO:0005899) |
| 0.8 | 3.3 | GO:0048179 | activin receptor complex(GO:0048179) |
| 0.8 | 4.6 | GO:0034673 | inhibin-betaglycan-ActRII complex(GO:0034673) |
| 0.7 | 2.2 | GO:0071750 | dimeric IgA immunoglobulin complex(GO:0071750) secretory dimeric IgA immunoglobulin complex(GO:0071752) IgM immunoglobulin complex(GO:0071753) IgM immunoglobulin complex, circulating(GO:0071754) pentameric IgM immunoglobulin complex(GO:0071756) |
| 0.7 | 5.5 | GO:0005593 | FACIT collagen trimer(GO:0005593) |
| 0.7 | 24.3 | GO:0031092 | platelet alpha granule membrane(GO:0031092) |
| 0.6 | 5.1 | GO:0030868 | smooth endoplasmic reticulum membrane(GO:0030868) smooth endoplasmic reticulum part(GO:0097425) |
| 0.6 | 15.2 | GO:0031362 | anchored component of external side of plasma membrane(GO:0031362) |
| 0.6 | 3.0 | GO:1990589 | ATF4-CREB1 transcription factor complex(GO:1990589) |
| 0.6 | 13.0 | GO:0014731 | spectrin-associated cytoskeleton(GO:0014731) |
| 0.6 | 8.7 | GO:0043020 | NADPH oxidase complex(GO:0043020) |
| 0.6 | 2.8 | GO:0071008 | U2-type post-mRNA release spliceosomal complex(GO:0071008) |
| 0.5 | 1.0 | GO:0097449 | astrocyte projection(GO:0097449) |
| 0.5 | 4.6 | GO:0042382 | paraspeckles(GO:0042382) |
| 0.5 | 3.6 | GO:0035867 | alphav-beta3 integrin-IGF-1-IGF1R complex(GO:0035867) |
| 0.5 | 1.0 | GO:0000939 | condensed chromosome inner kinetochore(GO:0000939) |
| 0.5 | 9.9 | GO:0033270 | paranode region of axon(GO:0033270) |
| 0.5 | 1.5 | GO:0090571 | RNA polymerase II transcription repressor complex(GO:0090571) |
| 0.5 | 17.8 | GO:0034451 | centriolar satellite(GO:0034451) |
| 0.5 | 2.3 | GO:0031314 | extrinsic component of mitochondrial inner membrane(GO:0031314) |
| 0.5 | 71.8 | GO:0030863 | cortical cytoskeleton(GO:0030863) |
| 0.4 | 2.1 | GO:0046696 | lipopolysaccharide receptor complex(GO:0046696) |
| 0.4 | 3.3 | GO:0016012 | sarcoglycan complex(GO:0016012) |
| 0.4 | 3.9 | GO:0097550 | transcriptional preinitiation complex(GO:0097550) |
| 0.4 | 2.7 | GO:0097486 | late endosome lumen(GO:0031906) multivesicular body lumen(GO:0097486) |
| 0.4 | 72.8 | GO:0032993 | protein-DNA complex(GO:0032993) |
| 0.4 | 2.6 | GO:0071439 | clathrin complex(GO:0071439) |
| 0.4 | 4.1 | GO:0030061 | mitochondrial crista(GO:0030061) |
| 0.3 | 65.7 | GO:0072562 | blood microparticle(GO:0072562) |
| 0.3 | 3.6 | GO:0030897 | HOPS complex(GO:0030897) |
| 0.3 | 12.9 | GO:1902711 | GABA-A receptor complex(GO:1902711) |
| 0.3 | 0.9 | GO:0017109 | glutamate-cysteine ligase complex(GO:0017109) |
| 0.3 | 6.8 | GO:0090533 | cation-transporting ATPase complex(GO:0090533) |
| 0.3 | 13.5 | GO:0005796 | Golgi lumen(GO:0005796) |
| 0.3 | 1.2 | GO:0031205 | endoplasmic reticulum Sec complex(GO:0031205) |
| 0.3 | 3.7 | GO:0033093 | Weibel-Palade body(GO:0033093) |
| 0.3 | 3.6 | GO:0031143 | pseudopodium(GO:0031143) |
| 0.3 | 1.9 | GO:1990635 | proximal dendrite(GO:1990635) |
| 0.3 | 31.0 | GO:0035578 | azurophil granule lumen(GO:0035578) |
| 0.2 | 3.0 | GO:0097539 | ciliary transition fiber(GO:0097539) |
| 0.2 | 9.7 | GO:0005902 | microvillus(GO:0005902) |
| 0.2 | 1.0 | GO:0034669 | integrin alpha4-beta7 complex(GO:0034669) |
| 0.2 | 2.5 | GO:0070449 | elongin complex(GO:0070449) |
| 0.2 | 15.9 | GO:0005581 | collagen trimer(GO:0005581) |
| 0.2 | 2.9 | GO:0042613 | MHC class II protein complex(GO:0042613) |
| 0.2 | 0.7 | GO:0071001 | U4/U6 snRNP(GO:0071001) |
| 0.2 | 2.6 | GO:0005922 | connexon complex(GO:0005922) |
| 0.2 | 3.8 | GO:0032982 | myosin filament(GO:0032982) |
| 0.2 | 0.8 | GO:1990393 | Cul7-RING ubiquitin ligase complex(GO:0031467) 3M complex(GO:1990393) |
| 0.2 | 2.9 | GO:0031235 | intrinsic component of the cytoplasmic side of the plasma membrane(GO:0031235) |
| 0.2 | 26.5 | GO:0005578 | proteinaceous extracellular matrix(GO:0005578) |
| 0.2 | 2.4 | GO:0001931 | uropod(GO:0001931) cell trailing edge(GO:0031254) |
| 0.2 | 2.0 | GO:0005862 | muscle thin filament tropomyosin(GO:0005862) |
| 0.2 | 4.5 | GO:0097381 | photoreceptor disc membrane(GO:0097381) |
| 0.2 | 4.2 | GO:0034045 | pre-autophagosomal structure membrane(GO:0034045) |
| 0.2 | 11.7 | GO:0035580 | specific granule lumen(GO:0035580) |
| 0.2 | 335.5 | GO:0005887 | integral component of plasma membrane(GO:0005887) |
| 0.2 | 4.4 | GO:0034364 | high-density lipoprotein particle(GO:0034364) |
| 0.2 | 4.0 | GO:0031526 | brush border membrane(GO:0031526) |
| 0.2 | 1.6 | GO:0008385 | IkappaB kinase complex(GO:0008385) |
| 0.2 | 13.9 | GO:0005758 | mitochondrial intermembrane space(GO:0005758) |
| 0.2 | 3.4 | GO:0097228 | sperm principal piece(GO:0097228) |
| 0.2 | 214.4 | GO:0005615 | extracellular space(GO:0005615) |
| 0.1 | 8.2 | GO:0005791 | rough endoplasmic reticulum(GO:0005791) |
| 0.1 | 4.4 | GO:0016235 | aggresome(GO:0016235) |
| 0.1 | 7.3 | GO:0001669 | acrosomal vesicle(GO:0001669) |
| 0.1 | 2.1 | GO:0001891 | phagocytic cup(GO:0001891) |
| 0.1 | 1.3 | GO:0035098 | ESC/E(Z) complex(GO:0035098) |
| 0.1 | 6.5 | GO:0016459 | myosin complex(GO:0016459) |
| 0.1 | 1.9 | GO:0034707 | chloride channel complex(GO:0034707) |
| 0.1 | 15.6 | GO:0055037 | recycling endosome(GO:0055037) |
| 0.1 | 5.2 | GO:0016323 | basolateral plasma membrane(GO:0016323) |
| 0.1 | 1.7 | GO:0000177 | cytoplasmic exosome (RNase complex)(GO:0000177) |
| 0.1 | 3.2 | GO:0000791 | euchromatin(GO:0000791) |
| 0.1 | 1.3 | GO:0016581 | NuRD complex(GO:0016581) CHD-type complex(GO:0090545) nuclear transcriptional repressor complex(GO:0090568) |
| 0.1 | 9.3 | GO:0042383 | sarcolemma(GO:0042383) |
| 0.1 | 3.9 | GO:0048786 | presynaptic active zone(GO:0048786) |
| 0.1 | 12.9 | GO:0090575 | RNA polymerase II transcription factor complex(GO:0090575) |
| 0.1 | 25.8 | GO:0000790 | nuclear chromatin(GO:0000790) |
| 0.1 | 3.3 | GO:0001533 | cornified envelope(GO:0001533) |
| 0.1 | 17.0 | GO:0045177 | apical part of cell(GO:0045177) |
| 0.1 | 3.7 | GO:0042645 | nucleoid(GO:0009295) mitochondrial nucleoid(GO:0042645) |
| 0.1 | 5.8 | GO:0031225 | anchored component of membrane(GO:0031225) |
| 0.1 | 1.6 | GO:0031904 | endosome lumen(GO:0031904) |
| 0.1 | 1.4 | GO:0005942 | phosphatidylinositol 3-kinase complex(GO:0005942) |
| 0.1 | 0.8 | GO:0033588 | Elongator holoenzyme complex(GO:0033588) |
| 0.1 | 2.7 | GO:0043202 | lysosomal lumen(GO:0043202) |
| 0.1 | 1.7 | GO:0005801 | cis-Golgi network(GO:0005801) |
| 0.1 | 2.0 | GO:0031228 | intrinsic component of Golgi membrane(GO:0031228) |
| 0.1 | 24.1 | GO:0005759 | mitochondrial matrix(GO:0005759) |
| 0.1 | 1.5 | GO:0036126 | sperm flagellum(GO:0036126) |
| 0.1 | 0.7 | GO:0000815 | ESCRT III complex(GO:0000815) |
| 0.0 | 4.9 | GO:1904813 | ficolin-1-rich granule(GO:0101002) ficolin-1-rich granule lumen(GO:1904813) |
| 0.0 | 0.8 | GO:0031080 | nuclear pore outer ring(GO:0031080) |
| 0.0 | 1.0 | GO:0001917 | photoreceptor inner segment(GO:0001917) |
| 0.0 | 2.6 | GO:0044217 | other organism(GO:0044215) other organism cell(GO:0044216) other organism part(GO:0044217) |
| 0.0 | 6.1 | GO:0009898 | cytoplasmic side of plasma membrane(GO:0009898) |
| 0.0 | 4.2 | GO:0071013 | catalytic step 2 spliceosome(GO:0071013) |
| 0.0 | 1.0 | GO:0005793 | endoplasmic reticulum-Golgi intermediate compartment(GO:0005793) |
| 0.0 | 0.7 | GO:0005689 | U12-type spliceosomal complex(GO:0005689) |
| 0.0 | 28.9 | GO:0044432 | endoplasmic reticulum part(GO:0044432) |
| 0.0 | 1.3 | GO:0015030 | Cajal body(GO:0015030) |
| 0.0 | 1.3 | GO:0030665 | clathrin-coated vesicle membrane(GO:0030665) |
| 0.0 | 1.0 | GO:0043195 | terminal bouton(GO:0043195) |
| 0.0 | 5.2 | GO:0005783 | endoplasmic reticulum(GO:0005783) |
| 0.0 | 3.0 | GO:0031965 | nuclear membrane(GO:0031965) |
| 0.0 | 0.8 | GO:0016363 | nuclear matrix(GO:0016363) |
Gene overrepresentation in molecular function category:
| Log-likelihood per target | Total log-likelihood | Term | Description |
|---|---|---|---|
| 9.4 | 66.1 | GO:0003810 | protein-glutamine gamma-glutamyltransferase activity(GO:0003810) |
| 7.2 | 28.9 | GO:0004341 | gluconolactonase activity(GO:0004341) |
| 6.5 | 19.4 | GO:0004998 | transferrin receptor activity(GO:0004998) |
| 6.1 | 18.3 | GO:0004418 | hydroxymethylbilane synthase activity(GO:0004418) |
| 5.5 | 16.4 | GO:0070643 | vitamin D3 25-hydroxylase activity(GO:0030343) vitamin D 25-hydroxylase activity(GO:0070643) |
| 5.2 | 188.3 | GO:0008519 | ammonium transmembrane transporter activity(GO:0008519) |
| 4.5 | 67.9 | GO:0005344 | oxygen transporter activity(GO:0005344) |
| 4.4 | 13.2 | GO:1902271 | D3 vitamins binding(GO:1902271) |
| 4.1 | 16.4 | GO:0030492 | hemoglobin binding(GO:0030492) |
| 4.0 | 19.9 | GO:0070653 | high-density lipoprotein particle receptor binding(GO:0070653) |
| 3.9 | 15.7 | GO:0004743 | pyruvate kinase activity(GO:0004743) |
| 3.5 | 17.3 | GO:0003870 | 5-aminolevulinate synthase activity(GO:0003870) N-succinyltransferase activity(GO:0016749) |
| 3.4 | 10.3 | GO:0015265 | urea channel activity(GO:0015265) |
| 3.4 | 27.3 | GO:0070892 | lipoteichoic acid receptor activity(GO:0070892) |
| 3.3 | 10.0 | GO:0004507 | steroid 11-beta-monooxygenase activity(GO:0004507) corticosterone 18-monooxygenase activity(GO:0047783) |
| 3.3 | 10.0 | GO:0002113 | interleukin-33 binding(GO:0002113) |
| 3.0 | 17.9 | GO:0030172 | troponin C binding(GO:0030172) |
| 2.6 | 7.9 | GO:0030171 | voltage-gated proton channel activity(GO:0030171) |
| 2.6 | 7.7 | GO:0052871 | tocopherol omega-hydroxylase activity(GO:0052870) alpha-tocopherol omega-hydroxylase activity(GO:0052871) 20-hydroxy-leukotriene B4 omega oxidase activity(GO:0097258) 20-aldehyde-leukotriene B4 20-monooxygenase activity(GO:0097259) |
| 2.5 | 7.4 | GO:0019959 | interleukin-8 binding(GO:0019959) |
| 2.4 | 62.7 | GO:0004806 | triglyceride lipase activity(GO:0004806) |
| 2.4 | 9.5 | GO:0004886 | 9-cis retinoic acid receptor activity(GO:0004886) |
| 2.3 | 9.2 | GO:0060230 | lipoprotein lipase activator activity(GO:0060230) |
| 2.2 | 13.3 | GO:0004882 | androgen receptor activity(GO:0004882) |
| 2.1 | 8.4 | GO:0042015 | interleukin-20 binding(GO:0042015) |
| 2.1 | 6.2 | GO:0004421 | hydroxymethylglutaryl-CoA synthase activity(GO:0004421) |
| 1.8 | 1.8 | GO:0034875 | oxidoreductase activity, acting on CH or CH2 groups, quinone or similar compound as acceptor(GO:0033695) caffeine oxidase activity(GO:0034875) |
| 1.8 | 10.5 | GO:0015057 | thrombin receptor activity(GO:0015057) |
| 1.7 | 16.7 | GO:0047498 | calcium-dependent phospholipase A2 activity(GO:0047498) |
| 1.6 | 24.3 | GO:0015643 | toxic substance binding(GO:0015643) |
| 1.5 | 7.7 | GO:0016936 | galactoside binding(GO:0016936) |
| 1.5 | 13.6 | GO:0015272 | ATP-activated inward rectifier potassium channel activity(GO:0015272) |
| 1.5 | 7.5 | GO:0048248 | CXCR3 chemokine receptor binding(GO:0048248) |
| 1.5 | 28.3 | GO:0070330 | aromatase activity(GO:0070330) |
| 1.4 | 5.8 | GO:0004771 | sterol esterase activity(GO:0004771) |
| 1.3 | 4.0 | GO:0036134 | thromboxane-A synthase activity(GO:0004796) 12-hydroxyheptadecatrienoic acid synthase activity(GO:0036134) |
| 1.3 | 4.0 | GO:0005128 | erythropoietin receptor binding(GO:0005128) |
| 1.3 | 19.1 | GO:0019957 | C-C chemokine binding(GO:0019957) |
| 1.3 | 20.3 | GO:0043522 | leucine zipper domain binding(GO:0043522) |
| 1.3 | 8.8 | GO:0000155 | phosphorelay sensor kinase activity(GO:0000155) |
| 1.2 | 6.2 | GO:0003956 | NAD(P)+-protein-arginine ADP-ribosyltransferase activity(GO:0003956) |
| 1.2 | 4.9 | GO:0042132 | fructose 1,6-bisphosphate 1-phosphatase activity(GO:0042132) |
| 1.2 | 14.7 | GO:0015174 | basic amino acid transmembrane transporter activity(GO:0015174) |
| 1.2 | 3.6 | GO:0001596 | angiotensin type I receptor activity(GO:0001596) |
| 1.2 | 8.3 | GO:0001517 | N-acetylglucosamine 6-O-sulfotransferase activity(GO:0001517) |
| 1.2 | 12.8 | GO:0051525 | NFAT protein binding(GO:0051525) |
| 1.2 | 16.2 | GO:0022820 | potassium:chloride symporter activity(GO:0015379) potassium ion symporter activity(GO:0022820) |
| 1.1 | 4.5 | GO:0097108 | hedgehog family protein binding(GO:0097108) |
| 1.1 | 3.3 | GO:0005026 | transforming growth factor beta receptor activity, type II(GO:0005026) |
| 1.1 | 13.9 | GO:0016634 | oxidoreductase activity, acting on the CH-CH group of donors, oxygen as acceptor(GO:0016634) |
| 1.1 | 7.4 | GO:0005324 | long-chain fatty acid transporter activity(GO:0005324) |
| 1.0 | 11.4 | GO:0042301 | phosphate ion binding(GO:0042301) |
| 1.0 | 5.1 | GO:0003854 | 3-beta-hydroxy-delta5-steroid dehydrogenase activity(GO:0003854) |
| 1.0 | 24.6 | GO:0042813 | Wnt-activated receptor activity(GO:0042813) |
| 1.0 | 48.6 | GO:0050699 | WW domain binding(GO:0050699) |
| 1.0 | 9.0 | GO:0032190 | acrosin binding(GO:0032190) |
| 0.9 | 50.5 | GO:0015485 | cholesterol binding(GO:0015485) |
| 0.9 | 3.7 | GO:0004087 | carbamoyl-phosphate synthase (ammonia) activity(GO:0004087) carbamoyl-phosphate synthase (glutamine-hydrolyzing) activity(GO:0004088) |
| 0.9 | 2.7 | GO:0004336 | galactosylceramidase activity(GO:0004336) |
| 0.9 | 4.5 | GO:0030197 | extracellular matrix constituent, lubricant activity(GO:0030197) |
| 0.9 | 7.9 | GO:0034711 | inhibin binding(GO:0034711) |
| 0.9 | 4.4 | GO:0034186 | apolipoprotein A-I binding(GO:0034186) |
| 0.8 | 8.4 | GO:0008131 | primary amine oxidase activity(GO:0008131) |
| 0.8 | 3.3 | GO:0042030 | ATPase inhibitor activity(GO:0042030) |
| 0.8 | 2.5 | GO:0005497 | androgen binding(GO:0005497) |
| 0.8 | 26.4 | GO:0004602 | glutathione peroxidase activity(GO:0004602) |
| 0.8 | 3.3 | GO:0004852 | uroporphyrinogen-III synthase activity(GO:0004852) |
| 0.8 | 1.6 | GO:0008511 | sodium:potassium:chloride symporter activity(GO:0008511) |
| 0.8 | 7.9 | GO:0001042 | RNA polymerase I core binding(GO:0001042) |
| 0.8 | 23.2 | GO:0004181 | metallocarboxypeptidase activity(GO:0004181) |
| 0.8 | 6.8 | GO:0004969 | histamine receptor activity(GO:0004969) |
| 0.7 | 3.7 | GO:0004803 | transposase activity(GO:0004803) |
| 0.7 | 3.5 | GO:0017018 | myosin phosphatase activity(GO:0017018) |
| 0.7 | 2.1 | GO:0004914 | interleukin-5 receptor activity(GO:0004914) |
| 0.7 | 8.7 | GO:0042975 | peroxisome proliferator activated receptor binding(GO:0042975) |
| 0.7 | 191.1 | GO:0004252 | serine-type endopeptidase activity(GO:0004252) |
| 0.7 | 3.3 | GO:0004105 | choline-phosphate cytidylyltransferase activity(GO:0004105) |
| 0.7 | 3.3 | GO:0044729 | hemi-methylated DNA-binding(GO:0044729) |
| 0.6 | 3.9 | GO:0038052 | RNA polymerase II transcription factor activity, estrogen-activated sequence-specific DNA binding(GO:0038052) |
| 0.6 | 7.1 | GO:0031433 | telethonin binding(GO:0031433) |
| 0.6 | 2.6 | GO:0052851 | cupric reductase activity(GO:0008823) ferric-chelate reductase (NADPH) activity(GO:0052851) |
| 0.6 | 2.5 | GO:0004687 | myosin light chain kinase activity(GO:0004687) |
| 0.6 | 6.9 | GO:0001758 | retinal dehydrogenase activity(GO:0001758) |
| 0.6 | 5.5 | GO:0003876 | AMP deaminase activity(GO:0003876) adenosine-phosphate deaminase activity(GO:0047623) |
| 0.6 | 17.0 | GO:0008093 | cytoskeletal adaptor activity(GO:0008093) |
| 0.6 | 10.4 | GO:0004089 | carbonate dehydratase activity(GO:0004089) |
| 0.6 | 2.3 | GO:0008508 | bile acid:sodium symporter activity(GO:0008508) |
| 0.6 | 4.6 | GO:0004024 | alcohol dehydrogenase activity, zinc-dependent(GO:0004024) |
| 0.6 | 5.6 | GO:0005237 | inhibitory extracellular ligand-gated ion channel activity(GO:0005237) |
| 0.6 | 2.8 | GO:0016841 | ammonia-lyase activity(GO:0016841) |
| 0.6 | 1.7 | GO:0090555 | phosphatidylethanolamine-translocating ATPase activity(GO:0090555) |
| 0.5 | 3.7 | GO:0004499 | N,N-dimethylaniline monooxygenase activity(GO:0004499) |
| 0.5 | 2.0 | GO:0003846 | 2-acylglycerol O-acyltransferase activity(GO:0003846) |
| 0.5 | 2.5 | GO:0016882 | cyclo-ligase activity(GO:0016882) |
| 0.5 | 5.1 | GO:0004791 | thioredoxin-disulfide reductase activity(GO:0004791) |
| 0.5 | 13.5 | GO:0004190 | aspartic-type endopeptidase activity(GO:0004190) aspartic-type peptidase activity(GO:0070001) |
| 0.5 | 14.5 | GO:0004364 | glutathione transferase activity(GO:0004364) |
| 0.5 | 2.5 | GO:0070051 | fibrinogen binding(GO:0070051) |
| 0.5 | 4.2 | GO:0099583 | neurotransmitter receptor activity involved in regulation of postsynaptic cytosolic calcium ion concentration(GO:0099583) |
| 0.5 | 2.3 | GO:0070740 | tubulin-glutamic acid ligase activity(GO:0070740) |
| 0.5 | 1.9 | GO:0004348 | glucosylceramidase activity(GO:0004348) |
| 0.5 | 9.3 | GO:0015037 | peptide disulfide oxidoreductase activity(GO:0015037) |
| 0.5 | 3.7 | GO:0015232 | heme transporter activity(GO:0015232) |
| 0.5 | 1.4 | GO:0003845 | 11-beta-hydroxysteroid dehydrogenase [NAD(P)] activity(GO:0003845) |
| 0.4 | 3.6 | GO:0005094 | Rho GDP-dissociation inhibitor activity(GO:0005094) |
| 0.4 | 2.2 | GO:0019862 | IgA binding(GO:0019862) |
| 0.4 | 1.7 | GO:0086089 | voltage-gated potassium channel activity involved in atrial cardiac muscle cell action potential repolarization(GO:0086089) |
| 0.4 | 1.2 | GO:0005260 | channel-conductance-controlling ATPase activity(GO:0005260) |
| 0.4 | 1.6 | GO:0005148 | prolactin receptor binding(GO:0005148) |
| 0.4 | 2.0 | GO:0031735 | CCR10 chemokine receptor binding(GO:0031735) |
| 0.4 | 13.2 | GO:0001972 | retinoic acid binding(GO:0001972) |
| 0.4 | 5.0 | GO:0008503 | benzodiazepine receptor activity(GO:0008503) |
| 0.4 | 3.0 | GO:0019958 | C-X-C chemokine binding(GO:0019958) |
| 0.4 | 3.4 | GO:0008865 | glucokinase activity(GO:0004340) hexokinase activity(GO:0004396) fructokinase activity(GO:0008865) mannokinase activity(GO:0019158) |
| 0.4 | 3.4 | GO:0016846 | carbon-sulfur lyase activity(GO:0016846) |
| 0.4 | 1.1 | GO:0003943 | N-acetylgalactosamine-4-sulfatase activity(GO:0003943) |
| 0.4 | 3.3 | GO:0001609 | G-protein coupled adenosine receptor activity(GO:0001609) |
| 0.4 | 2.1 | GO:0001875 | lipopolysaccharide receptor activity(GO:0001875) |
| 0.4 | 40.9 | GO:0005518 | collagen binding(GO:0005518) |
| 0.3 | 6.3 | GO:0008395 | steroid hydroxylase activity(GO:0008395) |
| 0.3 | 39.8 | GO:0001618 | virus receptor activity(GO:0001618) |
| 0.3 | 1.0 | GO:0015403 | thiamine transmembrane transporter activity(GO:0015234) thiamine uptake transmembrane transporter activity(GO:0015403) |
| 0.3 | 2.3 | GO:0030284 | estrogen receptor activity(GO:0030284) |
| 0.3 | 16.8 | GO:0005272 | sodium channel activity(GO:0005272) |
| 0.3 | 6.0 | GO:0097493 | structural molecule activity conferring elasticity(GO:0097493) |
| 0.3 | 15.5 | GO:0001103 | RNA polymerase II repressing transcription factor binding(GO:0001103) |
| 0.3 | 0.9 | GO:0004357 | glutamate-cysteine ligase activity(GO:0004357) |
| 0.3 | 1.9 | GO:0019531 | oxalate transmembrane transporter activity(GO:0019531) |
| 0.3 | 0.9 | GO:0008321 | Ral guanyl-nucleotide exchange factor activity(GO:0008321) |
| 0.3 | 5.1 | GO:0015467 | G-protein activated inward rectifier potassium channel activity(GO:0015467) |
| 0.3 | 2.6 | GO:0048495 | Roundabout binding(GO:0048495) |
| 0.3 | 2.0 | GO:0004514 | nicotinate-nucleotide diphosphorylase (carboxylating) activity(GO:0004514) |
| 0.3 | 2.1 | GO:0004875 | complement receptor activity(GO:0004875) |
| 0.3 | 3.4 | GO:0005391 | sodium:potassium-exchanging ATPase activity(GO:0005391) |
| 0.3 | 5.4 | GO:0005385 | zinc ion transmembrane transporter activity(GO:0005385) |
| 0.3 | 3.8 | GO:0005049 | nuclear export signal receptor activity(GO:0005049) |
| 0.2 | 1.0 | GO:0005499 | vitamin D binding(GO:0005499) |
| 0.2 | 6.5 | GO:0043325 | phosphatidylinositol-3,4-bisphosphate binding(GO:0043325) |
| 0.2 | 7.3 | GO:0008331 | high voltage-gated calcium channel activity(GO:0008331) |
| 0.2 | 1.8 | GO:0035727 | lysophosphatidic acid binding(GO:0035727) |
| 0.2 | 3.2 | GO:0005372 | water transmembrane transporter activity(GO:0005372) |
| 0.2 | 20.9 | GO:0004222 | metalloendopeptidase activity(GO:0004222) |
| 0.2 | 20.4 | GO:0004867 | serine-type endopeptidase inhibitor activity(GO:0004867) |
| 0.2 | 4.3 | GO:0008510 | sodium:bicarbonate symporter activity(GO:0008510) |
| 0.2 | 1.3 | GO:0004704 | NF-kappaB-inducing kinase activity(GO:0004704) |
| 0.2 | 1.5 | GO:0070891 | lipoteichoic acid binding(GO:0070891) |
| 0.2 | 6.2 | GO:0001221 | transcription cofactor binding(GO:0001221) |
| 0.2 | 1.0 | GO:0043208 | glycosphingolipid binding(GO:0043208) |
| 0.2 | 2.7 | GO:0005004 | GPI-linked ephrin receptor activity(GO:0005004) |
| 0.2 | 1.5 | GO:0045499 | chemorepellent activity(GO:0045499) |
| 0.2 | 3.4 | GO:0035259 | glucocorticoid receptor binding(GO:0035259) |
| 0.2 | 19.0 | GO:0004984 | olfactory receptor activity(GO:0004984) |
| 0.2 | 6.5 | GO:0005158 | insulin receptor binding(GO:0005158) |
| 0.2 | 6.4 | GO:0001784 | phosphotyrosine binding(GO:0001784) |
| 0.2 | 3.8 | GO:0008198 | ferrous iron binding(GO:0008198) |
| 0.2 | 2.6 | GO:0005243 | gap junction channel activity(GO:0005243) |
| 0.2 | 18.7 | GO:0004866 | endopeptidase inhibitor activity(GO:0004866) |
| 0.2 | 4.7 | GO:0004629 | phosphatidylinositol phospholipase C activity(GO:0004435) phospholipase C activity(GO:0004629) |
| 0.2 | 22.7 | GO:0005178 | integrin binding(GO:0005178) |
| 0.2 | 18.7 | GO:0000980 | RNA polymerase II distal enhancer sequence-specific DNA binding(GO:0000980) |
| 0.2 | 1.7 | GO:0022851 | GABA-gated chloride ion channel activity(GO:0022851) |
| 0.2 | 1.2 | GO:0001162 | RNA polymerase II intronic transcription regulatory region sequence-specific DNA binding(GO:0001162) |
| 0.2 | 8.2 | GO:0004385 | guanylate kinase activity(GO:0004385) |
| 0.2 | 4.1 | GO:0031489 | myosin V binding(GO:0031489) |
| 0.2 | 2.3 | GO:0017017 | MAP kinase tyrosine/serine/threonine phosphatase activity(GO:0017017) |
| 0.1 | 1.0 | GO:0055131 | C3HC4-type RING finger domain binding(GO:0055131) |
| 0.1 | 1.4 | GO:0035005 | 1-phosphatidylinositol-4-phosphate 3-kinase activity(GO:0035005) |
| 0.1 | 2.0 | GO:0038036 | sphingosine-1-phosphate receptor activity(GO:0038036) |
| 0.1 | 0.4 | GO:0008502 | melatonin receptor activity(GO:0008502) |
| 0.1 | 1.3 | GO:0004321 | fatty-acyl-CoA synthase activity(GO:0004321) |
| 0.1 | 4.2 | GO:0005001 | transmembrane receptor protein tyrosine phosphatase activity(GO:0005001) transmembrane receptor protein phosphatase activity(GO:0019198) |
| 0.1 | 3.8 | GO:0031698 | beta-2 adrenergic receptor binding(GO:0031698) |
| 0.1 | 0.8 | GO:0016176 | superoxide-generating NADPH oxidase activator activity(GO:0016176) |
| 0.1 | 15.6 | GO:0008170 | N-methyltransferase activity(GO:0008170) |
| 0.1 | 14.3 | GO:0008201 | heparin binding(GO:0008201) |
| 0.1 | 14.1 | GO:0004896 | cytokine receptor activity(GO:0004896) |
| 0.1 | 0.7 | GO:0031013 | troponin I binding(GO:0031013) |
| 0.1 | 1.5 | GO:0016175 | superoxide-generating NADPH oxidase activity(GO:0016175) |
| 0.1 | 0.3 | GO:0032427 | GBD domain binding(GO:0032427) |
| 0.1 | 2.2 | GO:0019865 | immunoglobulin binding(GO:0019865) |
| 0.1 | 2.6 | GO:0008483 | transaminase activity(GO:0008483) |
| 0.1 | 3.2 | GO:0003887 | DNA-directed DNA polymerase activity(GO:0003887) |
| 0.1 | 2.9 | GO:1990841 | promoter-specific chromatin binding(GO:1990841) |
| 0.1 | 8.1 | GO:0005201 | extracellular matrix structural constituent(GO:0005201) |
| 0.1 | 1.2 | GO:0030247 | pattern binding(GO:0001871) polysaccharide binding(GO:0030247) |
| 0.1 | 1.6 | GO:0031435 | mitogen-activated protein kinase kinase kinase binding(GO:0031435) |
| 0.1 | 6.0 | GO:0030971 | receptor tyrosine kinase binding(GO:0030971) |
| 0.1 | 44.9 | GO:0000987 | core promoter proximal region sequence-specific DNA binding(GO:0000987) |
| 0.1 | 6.4 | GO:0005249 | voltage-gated potassium channel activity(GO:0005249) |
| 0.1 | 1.0 | GO:0015129 | lactate transmembrane transporter activity(GO:0015129) |
| 0.1 | 2.9 | GO:0042605 | peptide antigen binding(GO:0042605) |
| 0.1 | 42.3 | GO:0000981 | RNA polymerase II transcription factor activity, sequence-specific DNA binding(GO:0000981) |
| 0.1 | 1.3 | GO:0042288 | MHC class I protein binding(GO:0042288) |
| 0.1 | 2.8 | GO:0015269 | calcium-activated potassium channel activity(GO:0015269) |
| 0.1 | 1.4 | GO:0019992 | diacylglycerol binding(GO:0019992) |
| 0.1 | 1.0 | GO:0032393 | MHC class I receptor activity(GO:0032393) |
| 0.1 | 0.7 | GO:0030621 | U4 snRNA binding(GO:0030621) |
| 0.1 | 1.3 | GO:0016018 | cyclosporin A binding(GO:0016018) |
| 0.1 | 1.7 | GO:0016702 | oxidoreductase activity, acting on single donors with incorporation of molecular oxygen, incorporation of two atoms of oxygen(GO:0016702) |
| 0.1 | 0.2 | GO:0000035 | acyl binding(GO:0000035) |
| 0.1 | 0.8 | GO:0008607 | phosphorylase kinase regulator activity(GO:0008607) |
| 0.1 | 10.6 | GO:0005200 | structural constituent of cytoskeleton(GO:0005200) |
| 0.1 | 1.1 | GO:0005044 | scavenger receptor activity(GO:0005044) |
| 0.1 | 1.4 | GO:0003746 | translation elongation factor activity(GO:0003746) |
| 0.0 | 0.6 | GO:0004890 | GABA-A receptor activity(GO:0004890) |
| 0.0 | 1.5 | GO:0031683 | G-protein beta/gamma-subunit complex binding(GO:0031683) |
| 0.0 | 0.4 | GO:0033038 | bitter taste receptor activity(GO:0033038) |
| 0.0 | 0.6 | GO:0048156 | tau protein binding(GO:0048156) |
| 0.0 | 0.9 | GO:0070577 | lysine-acetylated histone binding(GO:0070577) |
| 0.0 | 0.8 | GO:0005212 | structural constituent of eye lens(GO:0005212) |
| 0.0 | 0.1 | GO:0008523 | sodium-dependent multivitamin transmembrane transporter activity(GO:0008523) |
| 0.0 | 1.3 | GO:0030544 | Hsp70 protein binding(GO:0030544) |
| 0.0 | 0.4 | GO:0005537 | mannose binding(GO:0005537) |
| 0.0 | 5.0 | GO:0017137 | Rab GTPase binding(GO:0017137) |
| 0.0 | 0.4 | GO:0005132 | type I interferon receptor binding(GO:0005132) |
| 0.0 | 7.7 | GO:0004930 | G-protein coupled receptor activity(GO:0004930) |
| 0.0 | 1.4 | GO:0048365 | Rac GTPase binding(GO:0048365) |
| 0.0 | 0.2 | GO:0004865 | protein serine/threonine phosphatase inhibitor activity(GO:0004865) |
| 0.0 | 2.3 | GO:0004721 | phosphoprotein phosphatase activity(GO:0004721) |
| 0.0 | 0.1 | GO:0005161 | platelet-derived growth factor receptor binding(GO:0005161) vascular endothelial growth factor receptor binding(GO:0005172) |
| 0.0 | 2.7 | GO:0030246 | carbohydrate binding(GO:0030246) |
Gene overrepresentation in curated gene sets: canonical pathways category:
| Log-likelihood per target | Total log-likelihood | Term | Description |
|---|---|---|---|
| 0.9 | 43.3 | PID INTEGRIN2 PATHWAY | Beta2 integrin cell surface interactions |
| 0.8 | 60.9 | PID HNF3B PATHWAY | FOXA2 and FOXA3 transcription factor networks |
| 0.7 | 36.6 | NABA PROTEOGLYCANS | Genes encoding proteoglycans |
| 0.6 | 154.2 | NABA ECM REGULATORS | Genes encoding enzymes and their regulators involved in the remodeling of the extracellular matrix |
| 0.6 | 7.3 | ST PAC1 RECEPTOR PATHWAY | PAC1 Receptor Pathway |
| 0.5 | 7.5 | ST TYPE I INTERFERON PATHWAY | Type I Interferon (alpha/beta IFN) Pathway |
| 0.5 | 3.0 | PID ALK1 PATHWAY | ALK1 signaling events |
| 0.5 | 3.3 | PID ALK2 PATHWAY | ALK2 signaling events |
| 0.3 | 12.9 | PID IL23 PATHWAY | IL23-mediated signaling events |
| 0.3 | 8.7 | PID ERB GENOMIC PATHWAY | Validated nuclear estrogen receptor beta network |
| 0.3 | 19.5 | PID HES HEY PATHWAY | Notch-mediated HES/HEY network |
| 0.3 | 5.8 | SA PROGRAMMED CELL DEATH | Programmed cell death, or apoptosis, eliminates damaged or unneeded cells. |
| 0.3 | 2.1 | PID IL5 PATHWAY | IL5-mediated signaling events |
| 0.2 | 9.5 | PID RETINOIC ACID PATHWAY | Retinoic acid receptors-mediated signaling |
| 0.2 | 16.0 | PID DELTA NP63 PATHWAY | Validated transcriptional targets of deltaNp63 isoforms |
| 0.2 | 6.2 | PID IL2 PI3K PATHWAY | IL2 signaling events mediated by PI3K |
| 0.2 | 21.4 | PID REG GR PATHWAY | Glucocorticoid receptor regulatory network |
| 0.2 | 10.9 | PID EPO PATHWAY | EPO signaling pathway |
| 0.2 | 19.2 | PID ERA GENOMIC PATHWAY | Validated nuclear estrogen receptor alpha network |
| 0.2 | 40.1 | NABA ECM AFFILIATED | Genes encoding proteins affiliated structurally or functionally to extracellular matrix proteins |
| 0.2 | 1.8 | PID S1P S1P4 PATHWAY | S1P4 pathway |
| 0.2 | 3.2 | PID RET PATHWAY | Signaling events regulated by Ret tyrosine kinase |
| 0.2 | 5.0 | PID ER NONGENOMIC PATHWAY | Plasma membrane estrogen receptor signaling |
| 0.2 | 4.4 | PID ERBB NETWORK PATHWAY | ErbB receptor signaling network |
| 0.2 | 7.6 | PID ANGIOPOIETIN RECEPTOR PATHWAY | Angiopoietin receptor Tie2-mediated signaling |
| 0.2 | 4.5 | PID HEDGEHOG 2PATHWAY | Signaling events mediated by the Hedgehog family |
| 0.2 | 5.5 | PID UPA UPAR PATHWAY | Urokinase-type plasminogen activator (uPA) and uPAR-mediated signaling |
| 0.2 | 2.7 | PID EPHA FWDPATHWAY | EPHA forward signaling |
| 0.2 | 1.8 | PID LPA4 PATHWAY | LPA4-mediated signaling events |
| 0.1 | 6.6 | PID CXCR3 PATHWAY | CXCR3-mediated signaling events |
| 0.1 | 5.9 | PID PI3KCI PATHWAY | Class I PI3K signaling events |
| 0.1 | 5.6 | NABA COLLAGENS | Genes encoding collagen proteins |
| 0.1 | 3.5 | PID INTEGRIN CS PATHWAY | Integrin family cell surface interactions |
| 0.1 | 7.9 | PID RAC1 PATHWAY | RAC1 signaling pathway |
| 0.1 | 3.2 | PID DNA PK PATHWAY | DNA-PK pathway in nonhomologous end joining |
| 0.1 | 1.7 | PID IL2 STAT5 PATHWAY | IL2 signaling events mediated by STAT5 |
| 0.1 | 3.4 | SA MMP CYTOKINE CONNECTION | Cytokines can induce activation of matrix metalloproteinases, which degrade extracellular matrix. |
| 0.1 | 0.3 | PID AR NONGENOMIC PATHWAY | Nongenotropic Androgen signaling |
| 0.1 | 2.2 | PID INTEGRIN A9B1 PATHWAY | Alpha9 beta1 integrin signaling events |
| 0.1 | 5.5 | PID FCER1 PATHWAY | Fc-epsilon receptor I signaling in mast cells |
| 0.1 | 2.1 | PID TOLL ENDOGENOUS PATHWAY | Endogenous TLR signaling |
| 0.1 | 4.2 | ST T CELL SIGNAL TRANSDUCTION | T Cell Signal Transduction |
| 0.1 | 2.9 | PID RHODOPSIN PATHWAY | Visual signal transduction: Rods |
| 0.1 | 2.2 | PID FRA PATHWAY | Validated transcriptional targets of AP1 family members Fra1 and Fra2 |
| 0.1 | 24.3 | NABA SECRETED FACTORS | Genes encoding secreted soluble factors |
| 0.1 | 3.4 | SIG INSULIN RECEPTOR PATHWAY IN CARDIAC MYOCYTES | Genes related to the insulin receptor pathway |
| 0.1 | 2.5 | ST MYOCYTE AD PATHWAY | Myocyte Adrenergic Pathway is a specific case of the generalized Adrenergic Pathway. |
| 0.1 | 1.4 | PID BETA CATENIN DEG PATHWAY | Degradation of beta catenin |
| 0.1 | 6.3 | PID CMYB PATHWAY | C-MYB transcription factor network |
| 0.1 | 0.2 | PID THROMBIN PAR4 PATHWAY | PAR4-mediated thrombin signaling events |
| 0.1 | 1.6 | PID LIS1 PATHWAY | Lissencephaly gene (LIS1) in neuronal migration and development |
| 0.1 | 1.6 | ST JNK MAPK PATHWAY | JNK MAPK Pathway |
| 0.1 | 1.4 | ST DIFFERENTIATION PATHWAY IN PC12 CELLS | Differentiation Pathway in PC12 Cells; this is a specific case of PAC1 Receptor Pathway. |
| 0.0 | 0.4 | SA G2 AND M PHASES | Cdc25 activates the cdc2/cyclin B complex to induce the G2/M transition. |
| 0.0 | 1.1 | ST WNT BETA CATENIN PATHWAY | Wnt/beta-catenin Pathway |
| 0.0 | 3.6 | PID CASPASE PATHWAY | Caspase cascade in apoptosis |
| 0.0 | 1.7 | PID HEDGEHOG GLI PATHWAY | Hedgehog signaling events mediated by Gli proteins |
| 0.0 | 1.5 | PID HNF3A PATHWAY | FOXA1 transcription factor network |
| 0.0 | 2.9 | PID MYC ACTIV PATHWAY | Validated targets of C-MYC transcriptional activation |
| 0.0 | 0.9 | PID TELOMERASE PATHWAY | Regulation of Telomerase |
| 0.0 | 0.8 | PID NOTCH PATHWAY | Notch signaling pathway |
| 0.0 | 0.5 | PID BARD1 PATHWAY | BARD1 signaling events |
| 0.0 | 1.2 | PID E2F PATHWAY | E2F transcription factor network |
| 0.0 | 0.4 | PID ATF2 PATHWAY | ATF-2 transcription factor network |
| 0.0 | 0.4 | PID RXR VDR PATHWAY | RXR and RAR heterodimerization with other nuclear receptor |
Gene overrepresentation in curated gene sets: REACTOME pathways category:
| Log-likelihood per target | Total log-likelihood | Term | Description |
|---|---|---|---|
| 2.6 | 103.1 | REACTOME METABOLISM OF STEROID HORMONES AND VITAMINS A AND D | Genes involved in Metabolism of steroid hormones and vitamins A and D |
| 2.5 | 45.5 | REACTOME XENOBIOTICS | Genes involved in Xenobiotics |
| 2.4 | 55.9 | REACTOME HDL MEDIATED LIPID TRANSPORT | Genes involved in HDL-mediated lipid transport |
| 1.8 | 52.7 | REACTOME METABOLISM OF PORPHYRINS | Genes involved in Metabolism of porphyrins |
| 1.7 | 69.2 | REACTOME DEGRADATION OF THE EXTRACELLULAR MATRIX | Genes involved in Degradation of the extracellular matrix |
| 1.1 | 16.7 | REACTOME ACYL CHAIN REMODELLING OF PS | Genes involved in Acyl chain remodelling of PS |
| 1.1 | 18.5 | REACTOME PLATELET ADHESION TO EXPOSED COLLAGEN | Genes involved in Platelet Adhesion to exposed collagen |
| 1.0 | 34.7 | REACTOME GLUTATHIONE CONJUGATION | Genes involved in Glutathione conjugation |
| 1.0 | 16.0 | REACTOME YAP1 AND WWTR1 TAZ STIMULATED GENE EXPRESSION | Genes involved in YAP1- and WWTR1 (TAZ)-stimulated gene expression |
| 0.8 | 33.2 | REACTOME INTERACTION BETWEEN L1 AND ANKYRINS | Genes involved in Interaction between L1 and Ankyrins |
| 0.8 | 20.4 | REACTOME CS DS DEGRADATION | Genes involved in CS/DS degradation |
| 0.7 | 26.3 | REACTOME AMINE COMPOUND SLC TRANSPORTERS | Genes involved in Amine compound SLC transporters |
| 0.7 | 6.7 | REACTOME ETHANOL OXIDATION | Genes involved in Ethanol oxidation |
| 0.6 | 10.4 | REACTOME REVERSIBLE HYDRATION OF CARBON DIOXIDE | Genes involved in Reversible Hydration of Carbon Dioxide |
| 0.5 | 9.3 | REACTOME COMMON PATHWAY | Genes involved in Common Pathway |
| 0.5 | 31.4 | REACTOME REGULATION OF BETA CELL DEVELOPMENT | Genes involved in Regulation of beta-cell development |
| 0.5 | 11.5 | REACTOME GLUCURONIDATION | Genes involved in Glucuronidation |
| 0.4 | 21.3 | REACTOME INWARDLY RECTIFYING K CHANNELS | Genes involved in Inwardly rectifying K+ channels |
| 0.4 | 10.6 | REACTOME METAL ION SLC TRANSPORTERS | Genes involved in Metal ion SLC transporters |
| 0.4 | 26.7 | REACTOME STRIATED MUSCLE CONTRACTION | Genes involved in Striated Muscle Contraction |
| 0.4 | 14.7 | REACTOME AMINO ACID TRANSPORT ACROSS THE PLASMA MEMBRANE | Genes involved in Amino acid transport across the plasma membrane |
| 0.4 | 7.5 | REACTOME AMINE DERIVED HORMONES | Genes involved in Amine-derived hormones |
| 0.4 | 4.0 | REACTOME CREATION OF C4 AND C2 ACTIVATORS | Genes involved in Creation of C4 and C2 activators |
| 0.4 | 11.2 | REACTOME SIGNALING BY NODAL | Genes involved in Signaling by NODAL |
| 0.3 | 10.3 | REACTOME CYTOCHROME P450 ARRANGED BY SUBSTRATE TYPE | Genes involved in Cytochrome P450 - arranged by substrate type |
| 0.3 | 12.2 | REACTOME GABA A RECEPTOR ACTIVATION | Genes involved in GABA A receptor activation |
| 0.3 | 30.3 | REACTOME NUCLEAR RECEPTOR TRANSCRIPTION PATHWAY | Genes involved in Nuclear Receptor transcription pathway |
| 0.3 | 48.6 | REACTOME FACTORS INVOLVED IN MEGAKARYOCYTE DEVELOPMENT AND PLATELET PRODUCTION | Genes involved in Factors involved in megakaryocyte development and platelet production |
| 0.3 | 28.3 | REACTOME IMMUNOREGULATORY INTERACTIONS BETWEEN A LYMPHOID AND A NON LYMPHOID CELL | Genes involved in Immunoregulatory interactions between a Lymphoid and a non-Lymphoid cell |
| 0.3 | 4.4 | REACTOME PHOSPHORYLATION OF CD3 AND TCR ZETA CHAINS | Genes involved in Phosphorylation of CD3 and TCR zeta chains |
| 0.3 | 4.2 | REACTOME CLASS C 3 METABOTROPIC GLUTAMATE PHEROMONE RECEPTORS | Genes involved in Class C/3 (Metabotropic glutamate/pheromone receptors) |
| 0.2 | 3.2 | REACTOME PASSIVE TRANSPORT BY AQUAPORINS | Genes involved in Passive Transport by Aquaporins |
| 0.2 | 12.5 | REACTOME VOLTAGE GATED POTASSIUM CHANNELS | Genes involved in Voltage gated Potassium channels |
| 0.2 | 5.5 | REACTOME PURINE SALVAGE | Genes involved in Purine salvage |
| 0.2 | 3.7 | REACTOME PHASE1 FUNCTIONALIZATION OF COMPOUNDS | Genes involved in Phase 1 - Functionalization of compounds |
| 0.2 | 2.7 | REACTOME DOWNSTREAM TCR SIGNALING | Genes involved in Downstream TCR signaling |
| 0.2 | 21.1 | REACTOME TRANSPORT OF INORGANIC CATIONS ANIONS AND AMINO ACIDS OLIGOPEPTIDES | Genes involved in Transport of inorganic cations/anions and amino acids/oligopeptides |
| 0.2 | 3.0 | REACTOME ACTIVATION OF CHAPERONE GENES BY ATF6 ALPHA | Genes involved in Activation of Chaperone Genes by ATF6-alpha |
| 0.2 | 5.4 | REACTOME BASIGIN INTERACTIONS | Genes involved in Basigin interactions |
| 0.2 | 7.7 | REACTOME TIGHT JUNCTION INTERACTIONS | Genes involved in Tight junction interactions |
| 0.2 | 4.4 | REACTOME TERMINATION OF O GLYCAN BIOSYNTHESIS | Genes involved in Termination of O-glycan biosynthesis |
| 0.2 | 8.0 | REACTOME LATENT INFECTION OF HOMO SAPIENS WITH MYCOBACTERIUM TUBERCULOSIS | Genes involved in Latent infection of Homo sapiens with Mycobacterium tuberculosis |
| 0.2 | 5.4 | REACTOME DOWNREGULATION OF ERBB2 ERBB3 SIGNALING | Genes involved in Downregulation of ERBB2:ERBB3 signaling |
| 0.2 | 1.6 | REACTOME GLYCOPROTEIN HORMONES | Genes involved in Glycoprotein hormones |
| 0.2 | 4.6 | REACTOME SIGNALING BY FGFR1 FUSION MUTANTS | Genes involved in Signaling by FGFR1 fusion mutants |
| 0.2 | 2.3 | REACTOME SIGNALING BY CONSTITUTIVELY ACTIVE EGFR | Genes involved in Signaling by constitutively active EGFR |
| 0.2 | 2.1 | REACTOME NEF MEDIATED DOWNREGULATION OF MHC CLASS I COMPLEX CELL SURFACE EXPRESSION | Genes involved in Nef mediated downregulation of MHC class I complex cell surface expression |
| 0.2 | 2.5 | REACTOME PURINE RIBONUCLEOSIDE MONOPHOSPHATE BIOSYNTHESIS | Genes involved in Purine ribonucleoside monophosphate biosynthesis |
| 0.2 | 4.9 | REACTOME IL RECEPTOR SHC SIGNALING | Genes involved in Interleukin receptor SHC signaling |
| 0.2 | 2.1 | REACTOME ACTIVATION OF IRF3 IRF7 MEDIATED BY TBK1 IKK EPSILON | Genes involved in Activation of IRF3/IRF7 mediated by TBK1/IKK epsilon |
| 0.2 | 2.3 | REACTOME RECYCLING OF BILE ACIDS AND SALTS | Genes involved in Recycling of bile acids and salts |
| 0.2 | 3.7 | REACTOME SYNTHESIS OF PC | Genes involved in Synthesis of PC |
| 0.2 | 4.0 | REACTOME NUCLEOTIDE LIKE PURINERGIC RECEPTORS | Genes involved in Nucleotide-like (purinergic) receptors |
| 0.1 | 7.3 | REACTOME NCAM1 INTERACTIONS | Genes involved in NCAM1 interactions |
| 0.1 | 2.6 | REACTOME GAP JUNCTION ASSEMBLY | Genes involved in Gap junction assembly |
| 0.1 | 1.4 | REACTOME G BETA GAMMA SIGNALLING THROUGH PLC BETA | Genes involved in G beta:gamma signalling through PLC beta |
| 0.1 | 14.3 | REACTOME TRANSCRIPTIONAL REGULATION OF WHITE ADIPOCYTE DIFFERENTIATION | Genes involved in Transcriptional Regulation of White Adipocyte Differentiation |
| 0.1 | 3.4 | REACTOME SULFUR AMINO ACID METABOLISM | Genes involved in Sulfur amino acid metabolism |
| 0.1 | 1.4 | REACTOME TRAFFICKING AND PROCESSING OF ENDOSOMAL TLR | Genes involved in Trafficking and processing of endosomal TLR |
| 0.1 | 5.5 | REACTOME GLUCOSE TRANSPORT | Genes involved in Glucose transport |
| 0.1 | 9.8 | REACTOME OLFACTORY SIGNALING PATHWAY | Genes involved in Olfactory Signaling Pathway |
| 0.1 | 7.0 | REACTOME COLLAGEN FORMATION | Genes involved in Collagen formation |
| 0.1 | 1.9 | REACTOME NOREPINEPHRINE NEUROTRANSMITTER RELEASE CYCLE | Genes involved in Norepinephrine Neurotransmitter Release Cycle |
| 0.1 | 3.3 | REACTOME TIE2 SIGNALING | Genes involved in Tie2 Signaling |
| 0.1 | 4.0 | REACTOME REGULATION OF HYPOXIA INDUCIBLE FACTOR HIF BY OXYGEN | Genes involved in Regulation of Hypoxia-inducible Factor (HIF) by Oxygen |
| 0.1 | 6.6 | REACTOME CHEMOKINE RECEPTORS BIND CHEMOKINES | Genes involved in Chemokine receptors bind chemokines |
| 0.1 | 2.8 | REACTOME POTASSIUM CHANNELS | Genes involved in Potassium Channels |
| 0.1 | 4.1 | REACTOME GLYCOSPHINGOLIPID METABOLISM | Genes involved in Glycosphingolipid metabolism |
| 0.1 | 1.6 | REACTOME PROLACTIN RECEPTOR SIGNALING | Genes involved in Prolactin receptor signaling |
| 0.1 | 10.9 | REACTOME PEPTIDE LIGAND BINDING RECEPTORS | Genes involved in Peptide ligand-binding receptors |
| 0.1 | 2.1 | REACTOME G0 AND EARLY G1 | Genes involved in G0 and Early G1 |
| 0.1 | 1.5 | REACTOME REGULATION OF COMPLEMENT CASCADE | Genes involved in Regulation of Complement cascade |
| 0.1 | 1.4 | REACTOME SYNTHESIS OF PIPS AT THE GOLGI MEMBRANE | Genes involved in Synthesis of PIPs at the Golgi membrane |
| 0.1 | 1.6 | REACTOME L1CAM INTERACTIONS | Genes involved in L1CAM interactions |
| 0.1 | 1.4 | REACTOME KERATAN SULFATE BIOSYNTHESIS | Genes involved in Keratan sulfate biosynthesis |
| 0.1 | 2.9 | REACTOME GLUCONEOGENESIS | Genes involved in Gluconeogenesis |
| 0.0 | 1.4 | REACTOME RAP1 SIGNALLING | Genes involved in Rap1 signalling |
| 0.0 | 0.8 | REACTOME ACTIVATED NOTCH1 TRANSMITS SIGNAL TO THE NUCLEUS | Genes involved in Activated NOTCH1 Transmits Signal to the Nucleus |
| 0.0 | 1.3 | REACTOME PHASE II CONJUGATION | Genes involved in Phase II conjugation |
| 0.0 | 1.1 | REACTOME CELL SURFACE INTERACTIONS AT THE VASCULAR WALL | Genes involved in Cell surface interactions at the vascular wall |
| 0.0 | 1.2 | REACTOME LIPID DIGESTION MOBILIZATION AND TRANSPORT | Genes involved in Lipid digestion, mobilization, and transport |
| 0.0 | 0.7 | REACTOME ENDOSOMAL SORTING COMPLEX REQUIRED FOR TRANSPORT ESCRT | Genes involved in Endosomal Sorting Complex Required For Transport (ESCRT) |
| 0.0 | 3.6 | REACTOME CLASS A1 RHODOPSIN LIKE RECEPTORS | Genes involved in Class A/1 (Rhodopsin-like receptors) |
| 0.0 | 0.5 | REACTOME SYNTHESIS SECRETION AND INACTIVATION OF GIP | Genes involved in Synthesis, Secretion, and Inactivation of Glucose-dependent Insulinotropic Polypeptide (GIP) |
| 0.0 | 0.5 | REACTOME PROCESSING OF INTRONLESS PRE MRNAS | Genes involved in Processing of Intronless Pre-mRNAs |
| 0.0 | 0.5 | REACTOME REGULATION OF AMPK ACTIVITY VIA LKB1 | Genes involved in Regulation of AMPK activity via LKB1 |
| 0.0 | 3.6 | REACTOME GENERIC TRANSCRIPTION PATHWAY | Genes involved in Generic Transcription Pathway |
| 0.0 | 0.3 | REACTOME SIGNALING BY HIPPO | Genes involved in Signaling by Hippo |
| 0.0 | 0.4 | REACTOME SPHINGOLIPID DE NOVO BIOSYNTHESIS | Genes involved in Sphingolipid de novo biosynthesis |
| 0.0 | 0.2 | REACTOME G PROTEIN ACTIVATION | Genes involved in G-protein activation |
| 0.0 | 0.3 | REACTOME AMYLOIDS | Genes involved in Amyloids |