Project
GNF SymAtlas + NCI-60 cancer cell lines, human (Su, 2004; Ross, 2000)
Navigation
Downloads
Results for GATA2
Z-value: 1.16
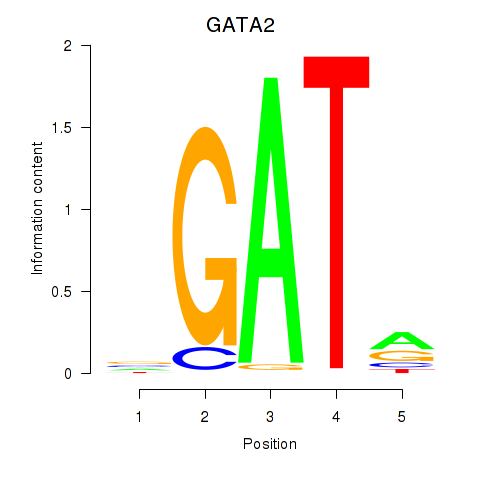
Motif logo
Transcription factors associated with GATA2
| Gene Symbol | Gene ID | Gene Info |
|---|---|---|
|
GATA2
|
ENSG00000179348.12 | GATA2 |
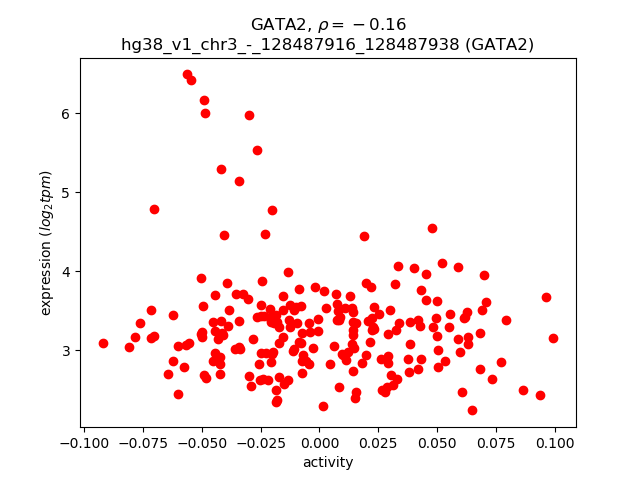
Activity-expression correlation:
| Gene | Promoter | Pearson corr. coef. | P-value | Plot |
|---|---|---|---|---|
| GATA2 | hg38_v1_chr3_-_128487916_128487938 | -0.16 | 1.9e-02 | Click! |
Activity profile of GATA2 motif
Sorted Z-values of GATA2 motif
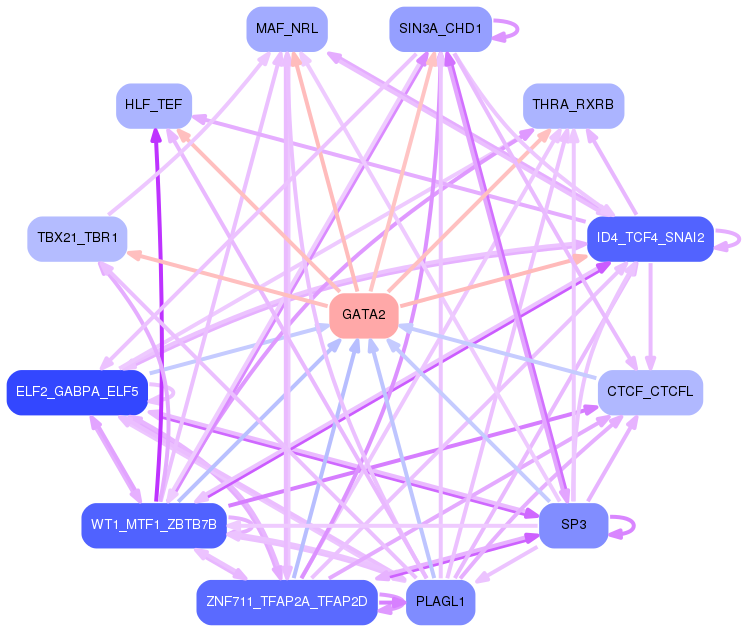
Network of associatons between targets according to the STRING database.

First level regulatory network of GATA2
Gene Ontology Analysis
Gene overrepresentation in biological process category:
| Log-likelihood per target | Total log-likelihood | Term | Description |
|---|---|---|---|
| 7.5 | 22.6 | GO:1900920 | regulation of amino acid uptake involved in synaptic transmission(GO:0051941) regulation of glutamate uptake involved in transmission of nerve impulse(GO:0051946) regulation of L-glutamate import(GO:1900920) |
| 5.3 | 69.2 | GO:1900747 | negative regulation of vascular endothelial growth factor signaling pathway(GO:1900747) |
| 5.1 | 15.2 | GO:0030185 | nitric oxide transport(GO:0030185) |
| 5.0 | 14.9 | GO:0042137 | sequestering of neurotransmitter(GO:0042137) |
| 4.6 | 22.8 | GO:1902847 | regulation of neuronal signal transduction(GO:1902847) positive regulation of neurofibrillary tangle assembly(GO:1902998) |
| 4.2 | 12.7 | GO:0098746 | fast, calcium ion-dependent exocytosis of neurotransmitter(GO:0098746) |
| 4.2 | 16.6 | GO:0006663 | platelet activating factor biosynthetic process(GO:0006663) |
| 4.1 | 69.6 | GO:0007021 | tubulin complex assembly(GO:0007021) |
| 3.6 | 10.8 | GO:0050760 | negative regulation of thymidylate synthase biosynthetic process(GO:0050760) |
| 3.3 | 13.3 | GO:1903296 | regulation of glutamate secretion, neurotransmission(GO:1903294) positive regulation of glutamate secretion, neurotransmission(GO:1903296) |
| 3.0 | 27.0 | GO:1902902 | negative regulation of autophagosome assembly(GO:1902902) |
| 3.0 | 9.0 | GO:0097156 | fasciculation of motor neuron axon(GO:0097156) |
| 2.8 | 28.5 | GO:0006537 | glutamate biosynthetic process(GO:0006537) gamma-aminobutyric acid biosynthetic process(GO:0009449) |
| 2.7 | 11.0 | GO:1900169 | regulation of glucocorticoid mediated signaling pathway(GO:1900169) |
| 2.6 | 31.5 | GO:0051611 | negative regulation of neurotransmitter uptake(GO:0051581) regulation of serotonin uptake(GO:0051611) negative regulation of serotonin uptake(GO:0051612) |
| 2.4 | 9.8 | GO:0051866 | general adaptation syndrome(GO:0051866) |
| 2.3 | 18.5 | GO:0060373 | regulation of ventricular cardiac muscle cell membrane depolarization(GO:0060373) |
| 2.2 | 33.4 | GO:0007258 | JUN phosphorylation(GO:0007258) |
| 1.9 | 5.6 | GO:1903487 | regulation of lactation(GO:1903487) |
| 1.8 | 5.3 | GO:0044565 | dendritic cell proliferation(GO:0044565) |
| 1.7 | 8.7 | GO:2000035 | regulation of stem cell division(GO:2000035) |
| 1.6 | 16.5 | GO:0003402 | planar cell polarity pathway involved in axis elongation(GO:0003402) |
| 1.6 | 14.6 | GO:0099566 | regulation of postsynaptic cytosolic calcium ion concentration(GO:0099566) |
| 1.6 | 3.2 | GO:0002317 | plasma cell differentiation(GO:0002317) |
| 1.6 | 4.7 | GO:0071676 | negative regulation of mononuclear cell migration(GO:0071676) |
| 1.6 | 12.4 | GO:0035524 | proline transmembrane transport(GO:0035524) |
| 1.5 | 4.6 | GO:0006982 | response to lipid hydroperoxide(GO:0006982) |
| 1.5 | 15.0 | GO:0036309 | protein localization to M-band(GO:0036309) protein localization to T-tubule(GO:0036371) |
| 1.5 | 7.3 | GO:0038170 | somatostatin receptor signaling pathway(GO:0038169) somatostatin signaling pathway(GO:0038170) |
| 1.4 | 4.2 | GO:1990168 | protein K33-linked deubiquitination(GO:1990168) |
| 1.3 | 8.0 | GO:0097338 | response to clozapine(GO:0097338) |
| 1.3 | 3.9 | GO:0061026 | cardiac muscle tissue regeneration(GO:0061026) |
| 1.3 | 5.2 | GO:0071418 | cellular response to amine stimulus(GO:0071418) |
| 1.2 | 5.0 | GO:0044828 | negative regulation by host of viral genome replication(GO:0044828) |
| 1.2 | 6.2 | GO:1903385 | regulation of homophilic cell adhesion(GO:1903385) |
| 1.2 | 6.1 | GO:0072144 | mesangial cell development(GO:0072143) glomerular mesangial cell development(GO:0072144) mesenchyme migration(GO:0090131) |
| 1.2 | 6.1 | GO:0030309 | poly-N-acetyllactosamine metabolic process(GO:0030309) poly-N-acetyllactosamine biosynthetic process(GO:0030311) |
| 1.2 | 4.8 | GO:1904428 | negative regulation of tubulin deacetylation(GO:1904428) |
| 1.2 | 2.4 | GO:0086053 | SA node cell to atrial cardiac muscle cell communication by electrical coupling(GO:0086021) AV node cell to bundle of His cell communication by electrical coupling(GO:0086053) |
| 1.2 | 8.2 | GO:0032100 | positive regulation of response to food(GO:0032097) positive regulation of appetite(GO:0032100) |
| 1.2 | 4.6 | GO:0072092 | ureteric bud invasion(GO:0072092) |
| 1.1 | 5.7 | GO:1904566 | response to 1-oleoyl-sn-glycerol 3-phosphate(GO:1904565) cellular response to 1-oleoyl-sn-glycerol 3-phosphate(GO:1904566) |
| 1.1 | 6.8 | GO:0016554 | cytidine to uridine editing(GO:0016554) |
| 1.1 | 5.7 | GO:0045872 | positive regulation of rhodopsin gene expression(GO:0045872) |
| 1.1 | 5.6 | GO:2001181 | positive regulation of interleukin-10 secretion(GO:2001181) |
| 1.1 | 6.6 | GO:0018343 | protein farnesylation(GO:0018343) |
| 1.1 | 13.9 | GO:0042738 | exogenous drug catabolic process(GO:0042738) |
| 1.1 | 4.2 | GO:0035900 | response to isolation stress(GO:0035900) |
| 1.0 | 10.3 | GO:0097646 | dimeric G-protein coupled receptor signaling pathway(GO:0038042) calcitonin family receptor signaling pathway(GO:0097646) amylin receptor signaling pathway(GO:0097647) |
| 1.0 | 3.0 | GO:1900377 | negative regulation of melanin biosynthetic process(GO:0048022) negative regulation of secondary metabolite biosynthetic process(GO:1900377) |
| 1.0 | 3.0 | GO:0010025 | wax biosynthetic process(GO:0010025) wax metabolic process(GO:0010166) |
| 1.0 | 2.0 | GO:0015808 | L-alanine transport(GO:0015808) |
| 1.0 | 2.9 | GO:1901674 | histone H3-K27 acetylation(GO:0043974) regulation of histone H3-K27 acetylation(GO:1901674) |
| 0.9 | 36.7 | GO:0048665 | neuron fate specification(GO:0048665) |
| 0.9 | 4.7 | GO:0006127 | glycerophosphate shuttle(GO:0006127) |
| 0.9 | 12.1 | GO:0098712 | L-glutamate import across plasma membrane(GO:0098712) |
| 0.9 | 9.0 | GO:2000807 | regulation of synaptic vesicle clustering(GO:2000807) |
| 0.9 | 3.6 | GO:0010636 | positive regulation of mitochondrial fusion(GO:0010636) |
| 0.9 | 3.6 | GO:0045763 | negative regulation of cellular amino acid metabolic process(GO:0045763) |
| 0.9 | 2.6 | GO:1901624 | negative regulation of lymphocyte chemotaxis(GO:1901624) |
| 0.9 | 6.0 | GO:1901509 | regulation of endothelial tube morphogenesis(GO:1901509) |
| 0.9 | 1.7 | GO:0002582 | positive regulation of antigen processing and presentation of peptide or polysaccharide antigen via MHC class II(GO:0002582) positive regulation of antigen processing and presentation of peptide antigen(GO:0002585) positive regulation of antigen processing and presentation of peptide antigen via MHC class II(GO:0002588) |
| 0.8 | 2.5 | GO:0050787 | antibiotic metabolic process(GO:0016999) detoxification of mercury ion(GO:0050787) |
| 0.8 | 6.5 | GO:0032790 | ribosome disassembly(GO:0032790) |
| 0.8 | 4.9 | GO:0003350 | pulmonary myocardium development(GO:0003350) |
| 0.8 | 5.6 | GO:0070560 | protein secretion by platelet(GO:0070560) |
| 0.8 | 5.5 | GO:0035021 | negative regulation of Rac protein signal transduction(GO:0035021) |
| 0.8 | 4.7 | GO:0071896 | protein localization to adherens junction(GO:0071896) |
| 0.8 | 5.4 | GO:0034587 | piRNA metabolic process(GO:0034587) |
| 0.8 | 2.3 | GO:1903348 | positive regulation of bicellular tight junction assembly(GO:1903348) |
| 0.8 | 3.8 | GO:1903588 | negative regulation of blood vessel endothelial cell proliferation involved in sprouting angiogenesis(GO:1903588) |
| 0.8 | 7.5 | GO:0042985 | negative regulation of amyloid precursor protein biosynthetic process(GO:0042985) |
| 0.7 | 4.4 | GO:0033133 | positive regulation of glucokinase activity(GO:0033133) |
| 0.7 | 11.0 | GO:0048172 | regulation of short-term neuronal synaptic plasticity(GO:0048172) |
| 0.7 | 7.2 | GO:0000463 | maturation of LSU-rRNA from tricistronic rRNA transcript (SSU-rRNA, 5.8S rRNA, LSU-rRNA)(GO:0000463) |
| 0.7 | 7.2 | GO:0021633 | optic nerve structural organization(GO:0021633) |
| 0.7 | 3.6 | GO:0071109 | superior temporal gyrus development(GO:0071109) |
| 0.7 | 4.2 | GO:0007000 | nucleolus organization(GO:0007000) |
| 0.7 | 1.4 | GO:0018963 | phthalate metabolic process(GO:0018963) |
| 0.7 | 3.4 | GO:0033058 | directional locomotion(GO:0033058) |
| 0.7 | 13.3 | GO:0033141 | positive regulation of peptidyl-serine phosphorylation of STAT protein(GO:0033141) |
| 0.7 | 5.9 | GO:0071492 | cellular response to UV-A(GO:0071492) |
| 0.6 | 3.9 | GO:0035603 | fibroblast growth factor receptor signaling pathway involved in negative regulation of apoptotic process in bone marrow(GO:0035602) fibroblast growth factor receptor signaling pathway involved in hemopoiesis(GO:0035603) fibroblast growth factor receptor signaling pathway involved in positive regulation of cell proliferation in bone marrow(GO:0035604) |
| 0.6 | 10.3 | GO:0036148 | phosphatidylglycerol acyl-chain remodeling(GO:0036148) |
| 0.6 | 3.2 | GO:2000860 | positive regulation of mineralocorticoid secretion(GO:2000857) positive regulation of aldosterone secretion(GO:2000860) |
| 0.6 | 6.3 | GO:0034058 | endosomal vesicle fusion(GO:0034058) |
| 0.6 | 5.6 | GO:2001106 | regulation of Rho guanyl-nucleotide exchange factor activity(GO:2001106) |
| 0.6 | 2.3 | GO:0060029 | convergent extension involved in organogenesis(GO:0060029) |
| 0.6 | 4.5 | GO:0019732 | antifungal humoral response(GO:0019732) |
| 0.6 | 8.8 | GO:0032060 | bleb assembly(GO:0032060) |
| 0.5 | 7.6 | GO:0006930 | substrate-dependent cell migration, cell extension(GO:0006930) |
| 0.5 | 2.2 | GO:2001034 | histone H3-K36 dimethylation(GO:0097676) positive regulation of double-strand break repair via nonhomologous end joining(GO:2001034) |
| 0.5 | 1.6 | GO:0000103 | sulfate assimilation(GO:0000103) |
| 0.5 | 7.0 | GO:1900028 | negative regulation of ruffle assembly(GO:1900028) |
| 0.5 | 3.7 | GO:0014050 | negative regulation of glutamate secretion(GO:0014050) |
| 0.5 | 1.6 | GO:0003408 | optic cup formation involved in camera-type eye development(GO:0003408) |
| 0.5 | 6.1 | GO:0042373 | vitamin K metabolic process(GO:0042373) |
| 0.5 | 1.5 | GO:0072717 | cellular response to actinomycin D(GO:0072717) |
| 0.5 | 16.5 | GO:1900273 | positive regulation of long-term synaptic potentiation(GO:1900273) |
| 0.5 | 3.5 | GO:0018095 | protein polyglutamylation(GO:0018095) |
| 0.5 | 1.5 | GO:0038155 | interleukin-23-mediated signaling pathway(GO:0038155) |
| 0.5 | 1.5 | GO:0003241 | growth involved in heart morphogenesis(GO:0003241) cardiac muscle tissue growth involved in heart morphogenesis(GO:0003245) |
| 0.5 | 2.4 | GO:0000101 | sulfur amino acid transport(GO:0000101) L-cystine transport(GO:0015811) |
| 0.5 | 5.7 | GO:0099612 | protein localization to axon(GO:0099612) |
| 0.5 | 7.1 | GO:0098870 | neuronal action potential propagation(GO:0019227) action potential propagation(GO:0098870) |
| 0.5 | 2.3 | GO:0035585 | calcium-mediated signaling using extracellular calcium source(GO:0035585) |
| 0.4 | 2.7 | GO:0033274 | response to vitamin B2(GO:0033274) heterochromatin maintenance(GO:0070829) |
| 0.4 | 17.8 | GO:0048791 | calcium ion-regulated exocytosis of neurotransmitter(GO:0048791) |
| 0.4 | 7.1 | GO:0071285 | cellular response to lithium ion(GO:0071285) |
| 0.4 | 2.2 | GO:0093001 | glycolysis from storage polysaccharide through glucose-1-phosphate(GO:0093001) |
| 0.4 | 1.3 | GO:0031959 | mineralocorticoid receptor signaling pathway(GO:0031959) regulation of cardiac vascular smooth muscle cell differentiation(GO:2000722) |
| 0.4 | 6.1 | GO:0036500 | ATF6-mediated unfolded protein response(GO:0036500) positive regulation of transcription from RNA polymerase II promoter in response to endoplasmic reticulum stress(GO:1990440) |
| 0.4 | 1.3 | GO:0070846 | misfolded protein transport(GO:0070843) polyubiquitinated protein transport(GO:0070844) polyubiquitinated misfolded protein transport(GO:0070845) Hsp90 deacetylation(GO:0070846) |
| 0.4 | 2.6 | GO:1901660 | calcium ion export(GO:1901660) calcium ion export from cell(GO:1990034) |
| 0.4 | 6.9 | GO:1902083 | negative regulation of peptidyl-cysteine S-nitrosylation(GO:1902083) |
| 0.4 | 4.7 | GO:1904262 | negative regulation of TORC1 signaling(GO:1904262) |
| 0.4 | 0.8 | GO:1900239 | phenotypic switching(GO:0036166) regulation of phenotypic switching(GO:1900239) |
| 0.4 | 1.7 | GO:0042360 | vitamin E metabolic process(GO:0042360) |
| 0.4 | 2.9 | GO:0038001 | paracrine signaling(GO:0038001) |
| 0.4 | 3.4 | GO:0015747 | urate transport(GO:0015747) |
| 0.4 | 7.5 | GO:0015671 | oxygen transport(GO:0015671) |
| 0.4 | 2.1 | GO:0048680 | positive regulation of axon regeneration(GO:0048680) |
| 0.4 | 2.0 | GO:1900738 | positive regulation of phospholipase C-activating G-protein coupled receptor signaling pathway(GO:1900738) |
| 0.4 | 12.2 | GO:0007398 | ectoderm development(GO:0007398) |
| 0.4 | 2.8 | GO:0052055 | modulation by symbiont of host molecular function(GO:0052055) modulation of catalytic activity in other organism involved in symbiotic interaction(GO:0052203) modulation by host of symbiont catalytic activity(GO:0052422) |
| 0.4 | 1.6 | GO:1903173 | phytol metabolic process(GO:0033306) fatty alcohol metabolic process(GO:1903173) |
| 0.4 | 2.8 | GO:0080009 | mRNA methylation(GO:0080009) |
| 0.4 | 13.3 | GO:0008038 | neuron recognition(GO:0008038) |
| 0.4 | 13.2 | GO:0008045 | motor neuron axon guidance(GO:0008045) |
| 0.4 | 1.9 | GO:0071287 | cellular response to manganese ion(GO:0071287) |
| 0.4 | 1.2 | GO:0038162 | erythropoietin-mediated signaling pathway(GO:0038162) |
| 0.4 | 5.5 | GO:0009128 | purine nucleoside monophosphate catabolic process(GO:0009128) |
| 0.4 | 1.8 | GO:0038016 | insulin receptor internalization(GO:0038016) |
| 0.4 | 1.1 | GO:1902283 | negative regulation of primary amine oxidase activity(GO:1902283) |
| 0.4 | 1.8 | GO:0021997 | neural plate development(GO:0001840) neural plate axis specification(GO:0021997) |
| 0.4 | 2.1 | GO:0046340 | diacylglycerol catabolic process(GO:0046340) |
| 0.4 | 10.2 | GO:0035235 | ionotropic glutamate receptor signaling pathway(GO:0035235) |
| 0.3 | 5.2 | GO:0014059 | dopamine secretion(GO:0014046) regulation of dopamine secretion(GO:0014059) |
| 0.3 | 2.1 | GO:0048840 | otolith development(GO:0048840) |
| 0.3 | 1.7 | GO:0090362 | positive regulation of platelet-derived growth factor production(GO:0090362) |
| 0.3 | 2.3 | GO:0031547 | brain-derived neurotrophic factor receptor signaling pathway(GO:0031547) |
| 0.3 | 3.3 | GO:0033089 | positive regulation of T cell differentiation in thymus(GO:0033089) positive regulation of thymocyte aggregation(GO:2000400) |
| 0.3 | 0.9 | GO:0036215 | response to stem cell factor(GO:0036215) cellular response to stem cell factor stimulus(GO:0036216) Kit signaling pathway(GO:0038109) |
| 0.3 | 0.9 | GO:0070837 | dehydroascorbic acid transport(GO:0070837) |
| 0.3 | 1.6 | GO:0001957 | intramembranous ossification(GO:0001957) direct ossification(GO:0036072) |
| 0.3 | 0.6 | GO:0014005 | microglia differentiation(GO:0014004) microglia development(GO:0014005) |
| 0.3 | 0.9 | GO:0043606 | histidine catabolic process to glutamate and formamide(GO:0019556) histidine catabolic process to glutamate and formate(GO:0019557) formamide metabolic process(GO:0043606) |
| 0.3 | 2.1 | GO:0021860 | pyramidal neuron differentiation(GO:0021859) pyramidal neuron development(GO:0021860) |
| 0.3 | 0.6 | GO:0032252 | secretory granule localization(GO:0032252) |
| 0.3 | 2.1 | GO:0030885 | regulation of myeloid dendritic cell activation(GO:0030885) |
| 0.3 | 1.2 | GO:0086097 | phospholipase C-activating angiotensin-activated signaling pathway(GO:0086097) |
| 0.3 | 2.0 | GO:0070294 | renal sodium ion absorption(GO:0070294) |
| 0.3 | 8.5 | GO:0045332 | lipid translocation(GO:0034204) phospholipid translocation(GO:0045332) |
| 0.3 | 8.8 | GO:0014047 | glutamate secretion(GO:0014047) |
| 0.3 | 4.1 | GO:0031987 | locomotion involved in locomotory behavior(GO:0031987) |
| 0.3 | 7.0 | GO:1902259 | regulation of delayed rectifier potassium channel activity(GO:1902259) |
| 0.3 | 1.2 | GO:1901165 | positive regulation of trophoblast cell migration(GO:1901165) |
| 0.3 | 28.9 | GO:0050911 | detection of chemical stimulus involved in sensory perception of smell(GO:0050911) |
| 0.3 | 2.6 | GO:0039663 | fusion of virus membrane with host plasma membrane(GO:0019064) membrane fusion involved in viral entry into host cell(GO:0039663) multi-organism membrane fusion(GO:0044800) |
| 0.3 | 0.3 | GO:0061368 | behavioral response to chemical pain(GO:0061366) behavioral response to formalin induced pain(GO:0061368) |
| 0.3 | 8.0 | GO:0032012 | regulation of ARF protein signal transduction(GO:0032012) |
| 0.3 | 5.3 | GO:0099517 | anterograde synaptic vesicle transport(GO:0048490) synaptic vesicle cytoskeletal transport(GO:0099514) synaptic vesicle transport along microtubule(GO:0099517) |
| 0.3 | 0.6 | GO:0048859 | formation of anatomical boundary(GO:0048859) |
| 0.3 | 1.7 | GO:0002760 | positive regulation of antimicrobial peptide production(GO:0002225) positive regulation of antimicrobial humoral response(GO:0002760) positive regulation of antibacterial peptide production(GO:0002803) |
| 0.3 | 42.4 | GO:0007156 | homophilic cell adhesion via plasma membrane adhesion molecules(GO:0007156) |
| 0.3 | 2.7 | GO:0015889 | cobalamin transport(GO:0015889) |
| 0.3 | 3.6 | GO:0021694 | cerebellar Purkinje cell layer formation(GO:0021694) cerebellar Purkinje cell differentiation(GO:0021702) |
| 0.3 | 0.8 | GO:1990451 | cellular stress response to acidic pH(GO:1990451) |
| 0.3 | 0.5 | GO:0021622 | oculomotor nerve morphogenesis(GO:0021622) oculomotor nerve formation(GO:0021623) |
| 0.3 | 3.3 | GO:0034380 | high-density lipoprotein particle assembly(GO:0034380) |
| 0.2 | 12.4 | GO:1901385 | regulation of voltage-gated calcium channel activity(GO:1901385) |
| 0.2 | 1.4 | GO:0070172 | positive regulation of tooth mineralization(GO:0070172) |
| 0.2 | 2.3 | GO:0001574 | ganglioside biosynthetic process(GO:0001574) |
| 0.2 | 1.2 | GO:0007042 | lysosomal lumen acidification(GO:0007042) |
| 0.2 | 0.7 | GO:2000320 | negative regulation of T-helper 17 type immune response(GO:2000317) negative regulation of T-helper 17 cell differentiation(GO:2000320) |
| 0.2 | 2.3 | GO:1900452 | regulation of long term synaptic depression(GO:1900452) |
| 0.2 | 1.1 | GO:0007497 | posterior midgut development(GO:0007497) enteric smooth muscle cell differentiation(GO:0035645) |
| 0.2 | 3.4 | GO:0051531 | NFAT protein import into nucleus(GO:0051531) |
| 0.2 | 1.8 | GO:2000660 | negative regulation of interleukin-1-mediated signaling pathway(GO:2000660) |
| 0.2 | 6.3 | GO:0098743 | cell aggregation(GO:0098743) |
| 0.2 | 15.4 | GO:0051965 | positive regulation of synapse assembly(GO:0051965) |
| 0.2 | 12.8 | GO:0045773 | positive regulation of axon extension(GO:0045773) |
| 0.2 | 3.2 | GO:0014029 | neural crest formation(GO:0014029) |
| 0.2 | 6.7 | GO:0009083 | branched-chain amino acid catabolic process(GO:0009083) |
| 0.2 | 1.3 | GO:0035617 | stress granule disassembly(GO:0035617) |
| 0.2 | 0.2 | GO:2000777 | positive regulation of proteasomal ubiquitin-dependent protein catabolic process involved in cellular response to hypoxia(GO:2000777) |
| 0.2 | 4.3 | GO:0016558 | protein import into peroxisome matrix(GO:0016558) |
| 0.2 | 6.8 | GO:0070987 | error-free translesion synthesis(GO:0070987) |
| 0.2 | 2.5 | GO:0007158 | neuron cell-cell adhesion(GO:0007158) |
| 0.2 | 4.1 | GO:0006488 | dolichol-linked oligosaccharide biosynthetic process(GO:0006488) |
| 0.2 | 1.4 | GO:0032534 | regulation of microvillus assembly(GO:0032534) |
| 0.2 | 5.5 | GO:0051131 | chaperone-mediated protein complex assembly(GO:0051131) |
| 0.2 | 10.5 | GO:0015701 | bicarbonate transport(GO:0015701) |
| 0.2 | 8.1 | GO:0046638 | positive regulation of alpha-beta T cell differentiation(GO:0046638) |
| 0.2 | 2.7 | GO:0061436 | establishment of skin barrier(GO:0061436) |
| 0.2 | 2.6 | GO:0070208 | protein heterotrimerization(GO:0070208) |
| 0.2 | 2.6 | GO:0019373 | epoxygenase P450 pathway(GO:0019373) |
| 0.2 | 5.1 | GO:0071420 | response to histamine(GO:0034776) cellular response to histamine(GO:0071420) |
| 0.2 | 2.8 | GO:0048240 | sperm capacitation(GO:0048240) |
| 0.2 | 0.9 | GO:2000389 | regulation of neutrophil extravasation(GO:2000389) |
| 0.2 | 2.5 | GO:0043653 | mitochondrial fragmentation involved in apoptotic process(GO:0043653) |
| 0.2 | 0.9 | GO:0031022 | nuclear migration along microfilament(GO:0031022) |
| 0.2 | 2.5 | GO:0090331 | negative regulation of platelet aggregation(GO:0090331) |
| 0.2 | 1.1 | GO:0007288 | sperm axoneme assembly(GO:0007288) |
| 0.2 | 0.7 | GO:0002879 | positive regulation of acute inflammatory response to non-antigenic stimulus(GO:0002879) |
| 0.2 | 1.4 | GO:0042904 | 9-cis-retinoic acid biosynthetic process(GO:0042904) 9-cis-retinoic acid metabolic process(GO:0042905) |
| 0.2 | 2.8 | GO:0010603 | regulation of cytoplasmic mRNA processing body assembly(GO:0010603) |
| 0.2 | 1.6 | GO:0015871 | choline transport(GO:0015871) |
| 0.2 | 0.9 | GO:0006701 | progesterone biosynthetic process(GO:0006701) |
| 0.2 | 1.4 | GO:0022417 | protein maturation by protein folding(GO:0022417) |
| 0.2 | 0.7 | GO:0035948 | positive regulation of gluconeogenesis by positive regulation of transcription from RNA polymerase II promoter(GO:0035948) |
| 0.2 | 0.3 | GO:0002876 | regulation of chronic inflammatory response to antigenic stimulus(GO:0002874) positive regulation of chronic inflammatory response to antigenic stimulus(GO:0002876) |
| 0.2 | 4.0 | GO:0070233 | negative regulation of T cell apoptotic process(GO:0070233) |
| 0.2 | 5.7 | GO:0018149 | peptide cross-linking(GO:0018149) |
| 0.2 | 2.0 | GO:0042364 | water-soluble vitamin biosynthetic process(GO:0042364) |
| 0.2 | 6.5 | GO:0010107 | potassium ion import(GO:0010107) |
| 0.2 | 0.5 | GO:0046603 | negative regulation of mitotic centrosome separation(GO:0046603) |
| 0.2 | 2.6 | GO:0030575 | nuclear body organization(GO:0030575) |
| 0.2 | 8.0 | GO:0050771 | negative regulation of axonogenesis(GO:0050771) |
| 0.2 | 2.7 | GO:0070493 | thrombin receptor signaling pathway(GO:0070493) |
| 0.1 | 4.2 | GO:0015695 | organic cation transport(GO:0015695) |
| 0.1 | 5.0 | GO:0003091 | renal water homeostasis(GO:0003091) |
| 0.1 | 3.3 | GO:0021904 | dorsal/ventral neural tube patterning(GO:0021904) |
| 0.1 | 4.4 | GO:0042982 | amyloid precursor protein metabolic process(GO:0042982) |
| 0.1 | 2.7 | GO:0030277 | maintenance of gastrointestinal epithelium(GO:0030277) |
| 0.1 | 5.6 | GO:1903959 | regulation of anion transmembrane transport(GO:1903959) |
| 0.1 | 2.1 | GO:0051974 | negative regulation of telomerase activity(GO:0051974) |
| 0.1 | 2.3 | GO:0034505 | tooth mineralization(GO:0034505) |
| 0.1 | 1.2 | GO:0007217 | tachykinin receptor signaling pathway(GO:0007217) |
| 0.1 | 0.7 | GO:0046007 | negative regulation of activated T cell proliferation(GO:0046007) |
| 0.1 | 0.8 | GO:0034196 | acylglycerol transport(GO:0034196) triglyceride transport(GO:0034197) |
| 0.1 | 0.4 | GO:0097021 | lymphocyte migration into lymphoid organs(GO:0097021) |
| 0.1 | 29.5 | GO:0043523 | regulation of neuron apoptotic process(GO:0043523) |
| 0.1 | 2.5 | GO:0071526 | semaphorin-plexin signaling pathway(GO:0071526) |
| 0.1 | 0.6 | GO:0055059 | asymmetric neuroblast division(GO:0055059) |
| 0.1 | 0.5 | GO:0019441 | tryptophan catabolic process to kynurenine(GO:0019441) quinolinate biosynthetic process(GO:0019805) |
| 0.1 | 0.6 | GO:0010816 | substance P catabolic process(GO:0010814) calcitonin catabolic process(GO:0010816) endothelin maturation(GO:0034959) |
| 0.1 | 1.7 | GO:0007220 | Notch receptor processing(GO:0007220) |
| 0.1 | 0.3 | GO:0003199 | endocardial cushion to mesenchymal transition involved in heart valve formation(GO:0003199) |
| 0.1 | 2.6 | GO:0050860 | negative regulation of T cell receptor signaling pathway(GO:0050860) |
| 0.1 | 0.4 | GO:0006880 | intracellular sequestering of iron ion(GO:0006880) sequestering of iron ion(GO:0097577) |
| 0.1 | 2.2 | GO:0097067 | cellular response to thyroid hormone stimulus(GO:0097067) |
| 0.1 | 6.4 | GO:0046847 | filopodium assembly(GO:0046847) |
| 0.1 | 4.9 | GO:1904590 | negative regulation of protein import into nucleus(GO:0042308) negative regulation of protein import(GO:1904590) |
| 0.1 | 1.6 | GO:0002828 | regulation of type 2 immune response(GO:0002828) |
| 0.1 | 2.7 | GO:0009299 | mRNA transcription(GO:0009299) |
| 0.1 | 4.9 | GO:0051220 | cytoplasmic sequestering of protein(GO:0051220) |
| 0.1 | 1.3 | GO:0032688 | negative regulation of interferon-beta production(GO:0032688) |
| 0.1 | 1.1 | GO:0021532 | neural tube patterning(GO:0021532) |
| 0.1 | 0.9 | GO:0002315 | marginal zone B cell differentiation(GO:0002315) |
| 0.1 | 2.1 | GO:0044241 | lipid digestion(GO:0044241) |
| 0.1 | 1.7 | GO:0003322 | pancreatic A cell development(GO:0003322) |
| 0.1 | 3.4 | GO:0043268 | positive regulation of potassium ion transport(GO:0043268) |
| 0.1 | 1.7 | GO:1902624 | positive regulation of neutrophil chemotaxis(GO:0090023) positive regulation of neutrophil migration(GO:1902624) |
| 0.1 | 0.3 | GO:0030241 | skeletal muscle myosin thick filament assembly(GO:0030241) sarcomerogenesis(GO:0048769) |
| 0.1 | 0.8 | GO:0070995 | NADPH oxidation(GO:0070995) |
| 0.1 | 0.7 | GO:0043950 | positive regulation of cAMP-mediated signaling(GO:0043950) |
| 0.1 | 0.3 | GO:0097498 | endothelial tube lumen extension(GO:0097498) |
| 0.1 | 2.0 | GO:1904886 | beta-catenin destruction complex disassembly(GO:1904886) |
| 0.1 | 2.8 | GO:0007271 | synaptic transmission, cholinergic(GO:0007271) |
| 0.1 | 1.3 | GO:0010919 | regulation of inositol phosphate biosynthetic process(GO:0010919) positive regulation of inositol phosphate biosynthetic process(GO:0060732) |
| 0.1 | 1.1 | GO:0002523 | leukocyte migration involved in inflammatory response(GO:0002523) |
| 0.1 | 1.2 | GO:0007638 | mechanosensory behavior(GO:0007638) |
| 0.1 | 4.4 | GO:0007212 | dopamine receptor signaling pathway(GO:0007212) |
| 0.1 | 0.2 | GO:1903281 | positive regulation of calcium:sodium antiporter activity(GO:1903281) |
| 0.1 | 1.4 | GO:0045725 | positive regulation of glycogen biosynthetic process(GO:0045725) |
| 0.1 | 1.0 | GO:0009642 | response to light intensity(GO:0009642) |
| 0.1 | 4.1 | GO:0072676 | lymphocyte migration(GO:0072676) |
| 0.1 | 6.1 | GO:0050672 | negative regulation of mononuclear cell proliferation(GO:0032945) negative regulation of lymphocyte proliferation(GO:0050672) |
| 0.1 | 0.5 | GO:0044266 | angiotensin catabolic process in blood(GO:0002005) multicellular organismal protein catabolic process(GO:0044254) protein digestion(GO:0044256) multicellular organismal macromolecule catabolic process(GO:0044266) |
| 0.1 | 1.3 | GO:0061049 | physiological muscle hypertrophy(GO:0003298) physiological cardiac muscle hypertrophy(GO:0003301) cell growth involved in cardiac muscle cell development(GO:0061049) |
| 0.1 | 1.0 | GO:1900181 | negative regulation of protein localization to nucleus(GO:1900181) |
| 0.1 | 1.5 | GO:0070932 | histone H3 deacetylation(GO:0070932) |
| 0.1 | 4.6 | GO:0035914 | skeletal muscle cell differentiation(GO:0035914) |
| 0.1 | 0.9 | GO:0035878 | nail development(GO:0035878) |
| 0.1 | 0.9 | GO:0033189 | response to vitamin A(GO:0033189) |
| 0.1 | 3.0 | GO:0001578 | microtubule bundle formation(GO:0001578) |
| 0.1 | 0.7 | GO:0010898 | positive regulation of triglyceride catabolic process(GO:0010898) |
| 0.1 | 1.7 | GO:0030220 | platelet formation(GO:0030220) |
| 0.1 | 2.1 | GO:0019433 | triglyceride catabolic process(GO:0019433) |
| 0.1 | 3.3 | GO:0043550 | regulation of lipid kinase activity(GO:0043550) |
| 0.1 | 3.2 | GO:0070098 | chemokine-mediated signaling pathway(GO:0070098) |
| 0.1 | 2.7 | GO:0034219 | carbohydrate transmembrane transport(GO:0034219) |
| 0.1 | 3.8 | GO:0042073 | intraciliary transport(GO:0042073) |
| 0.1 | 3.0 | GO:1904893 | negative regulation of JAK-STAT cascade(GO:0046426) negative regulation of STAT cascade(GO:1904893) |
| 0.1 | 0.9 | GO:0044872 | lipoprotein transport(GO:0042953) lipoprotein localization(GO:0044872) |
| 0.1 | 6.0 | GO:0006415 | translational termination(GO:0006415) |
| 0.1 | 3.2 | GO:0016266 | O-glycan processing(GO:0016266) |
| 0.1 | 0.3 | GO:0002399 | MHC protein complex assembly(GO:0002396) MHC class II protein complex assembly(GO:0002399) |
| 0.1 | 0.1 | GO:0005989 | lactose metabolic process(GO:0005988) lactose biosynthetic process(GO:0005989) |
| 0.1 | 1.6 | GO:0030261 | chromosome condensation(GO:0030261) |
| 0.1 | 1.8 | GO:0006825 | copper ion transport(GO:0006825) |
| 0.1 | 0.3 | GO:1901202 | negative regulation of extracellular matrix assembly(GO:1901202) |
| 0.1 | 5.8 | GO:0007286 | spermatid development(GO:0007286) |
| 0.1 | 1.3 | GO:2000036 | regulation of stem cell population maintenance(GO:2000036) |
| 0.1 | 4.9 | GO:0021987 | cerebral cortex development(GO:0021987) |
| 0.1 | 0.2 | GO:0001865 | NK T cell differentiation(GO:0001865) |
| 0.1 | 0.4 | GO:0016559 | peroxisome fission(GO:0016559) |
| 0.1 | 0.4 | GO:0006526 | arginine biosynthetic process(GO:0006526) |
| 0.1 | 0.5 | GO:1901898 | adrenergic receptor signaling pathway involved in positive regulation of heart rate(GO:0086024) negative regulation of relaxation of muscle(GO:1901078) negative regulation of relaxation of cardiac muscle(GO:1901898) |
| 0.1 | 4.1 | GO:0010923 | negative regulation of phosphatase activity(GO:0010923) |
| 0.1 | 0.6 | GO:0051601 | exocyst localization(GO:0051601) |
| 0.1 | 0.2 | GO:0019605 | benzoate metabolic process(GO:0018874) butyrate metabolic process(GO:0019605) |
| 0.1 | 1.6 | GO:0006836 | neurotransmitter transport(GO:0006836) |
| 0.1 | 1.2 | GO:0042462 | eye photoreceptor cell development(GO:0042462) |
| 0.1 | 1.2 | GO:0030947 | regulation of vascular endothelial growth factor receptor signaling pathway(GO:0030947) |
| 0.1 | 2.3 | GO:0036297 | interstrand cross-link repair(GO:0036297) |
| 0.0 | 0.6 | GO:1903846 | positive regulation of transforming growth factor beta receptor signaling pathway(GO:0030511) positive regulation of cellular response to transforming growth factor beta stimulus(GO:1903846) |
| 0.0 | 0.9 | GO:0050651 | dermatan sulfate proteoglycan biosynthetic process(GO:0050651) |
| 0.0 | 1.8 | GO:0035987 | endodermal cell differentiation(GO:0035987) |
| 0.0 | 2.4 | GO:0048384 | retinoic acid receptor signaling pathway(GO:0048384) |
| 0.0 | 0.5 | GO:1904259 | regulation of basement membrane assembly involved in embryonic body morphogenesis(GO:1904259) positive regulation of basement membrane assembly involved in embryonic body morphogenesis(GO:1904261) basement membrane assembly involved in embryonic body morphogenesis(GO:2001197) |
| 0.0 | 2.4 | GO:0071277 | cellular response to calcium ion(GO:0071277) |
| 0.0 | 8.2 | GO:0060271 | cilium morphogenesis(GO:0060271) |
| 0.0 | 1.3 | GO:0007190 | activation of adenylate cyclase activity(GO:0007190) |
| 0.0 | 2.1 | GO:1902108 | regulation of mitochondrial membrane permeability involved in apoptotic process(GO:1902108) |
| 0.0 | 3.8 | GO:0008277 | regulation of G-protein coupled receptor protein signaling pathway(GO:0008277) |
| 0.0 | 2.0 | GO:0006501 | C-terminal protein lipidation(GO:0006501) |
| 0.0 | 0.2 | GO:0007616 | long-term memory(GO:0007616) |
| 0.0 | 0.4 | GO:0015986 | energy coupled proton transport, down electrochemical gradient(GO:0015985) ATP synthesis coupled proton transport(GO:0015986) |
| 0.0 | 1.0 | GO:0007029 | endoplasmic reticulum organization(GO:0007029) |
| 0.0 | 0.3 | GO:0046940 | nucleoside monophosphate phosphorylation(GO:0046940) |
| 0.0 | 1.6 | GO:0001764 | neuron migration(GO:0001764) |
| 0.0 | 0.1 | GO:0071397 | cellular response to cholesterol(GO:0071397) |
| 0.0 | 0.9 | GO:0055010 | ventricular cardiac muscle tissue morphogenesis(GO:0055010) |
| 0.0 | 1.0 | GO:0001570 | vasculogenesis(GO:0001570) |
| 0.0 | 0.2 | GO:0030202 | heparin metabolic process(GO:0030202) heparin biosynthetic process(GO:0030210) |
| 0.0 | 3.0 | GO:0007601 | visual perception(GO:0007601) |
| 0.0 | 1.7 | GO:0030521 | androgen receptor signaling pathway(GO:0030521) |
| 0.0 | 0.9 | GO:0007612 | learning(GO:0007612) |
| 0.0 | 0.2 | GO:0051791 | medium-chain fatty acid metabolic process(GO:0051791) |
| 0.0 | 1.8 | GO:0019722 | calcium-mediated signaling(GO:0019722) |
| 0.0 | 6.9 | GO:0099537 | chemical synaptic transmission(GO:0007268) anterograde trans-synaptic signaling(GO:0098916) trans-synaptic signaling(GO:0099537) |
| 0.0 | 1.4 | GO:0007586 | digestion(GO:0007586) |
| 0.0 | 0.3 | GO:1903608 | protein localization to cytoplasmic stress granule(GO:1903608) |
| 0.0 | 0.6 | GO:0043928 | exonucleolytic nuclear-transcribed mRNA catabolic process involved in deadenylation-dependent decay(GO:0043928) |
| 0.0 | 0.4 | GO:0032543 | mitochondrial translation(GO:0032543) |
| 0.0 | 0.9 | GO:0045071 | negative regulation of viral genome replication(GO:0045071) |
Gene overrepresentation in cellular component category:
| Log-likelihood per target | Total log-likelihood | Term | Description |
|---|---|---|---|
| 5.5 | 88.4 | GO:0097512 | cardiac myofibril(GO:0097512) |
| 5.3 | 69.2 | GO:0098647 | collagen type VI trimer(GO:0005589) collagen beaded filament(GO:0098647) |
| 3.8 | 15.2 | GO:0031838 | haptoglobin-hemoglobin complex(GO:0031838) |
| 3.4 | 27.6 | GO:0060199 | clathrin-sculpted glutamate transport vesicle(GO:0060199) clathrin-sculpted glutamate transport vesicle membrane(GO:0060203) |
| 3.4 | 10.2 | GO:0098843 | postsynaptic endocytic zone(GO:0098843) |
| 2.3 | 4.7 | GO:0097025 | MPP7-DLG1-LIN7 complex(GO:0097025) |
| 2.2 | 17.8 | GO:0044327 | dendritic spine head(GO:0044327) |
| 2.2 | 13.3 | GO:0048787 | presynaptic active zone membrane(GO:0048787) |
| 2.0 | 6.1 | GO:0030485 | smooth muscle contractile fiber(GO:0030485) |
| 1.9 | 9.6 | GO:0044308 | axonal spine(GO:0044308) |
| 1.8 | 22.8 | GO:0042583 | chromaffin granule(GO:0042583) |
| 1.7 | 6.8 | GO:0030895 | apolipoprotein B mRNA editing enzyme complex(GO:0030895) |
| 1.4 | 7.1 | GO:0032807 | DNA-dependent protein kinase-DNA ligase 4 complex(GO:0005958) DNA ligase IV complex(GO:0032807) |
| 1.4 | 9.8 | GO:0032280 | symmetric synapse(GO:0032280) |
| 1.4 | 22.1 | GO:0005890 | sodium:potassium-exchanging ATPase complex(GO:0005890) |
| 1.4 | 5.4 | GO:0071546 | pi-body(GO:0071546) |
| 1.3 | 10.3 | GO:1903440 | calcitonin family receptor complex(GO:1903439) amylin receptor complex(GO:1903440) |
| 1.3 | 16.5 | GO:0036057 | filtration diaphragm(GO:0036056) slit diaphragm(GO:0036057) |
| 1.2 | 5.0 | GO:0002945 | cyclin K-CDK13 complex(GO:0002945) |
| 1.2 | 10.8 | GO:1990761 | growth cone lamellipodium(GO:1990761) |
| 1.1 | 2.2 | GO:0098984 | neuron to neuron synapse(GO:0098984) |
| 1.0 | 2.1 | GO:0043159 | acrosomal matrix(GO:0043159) |
| 1.0 | 5.2 | GO:0005947 | mitochondrial alpha-ketoglutarate dehydrogenase complex(GO:0005947) |
| 1.0 | 6.7 | GO:0045252 | dihydrolipoyl dehydrogenase complex(GO:0045240) oxoglutarate dehydrogenase complex(GO:0045252) |
| 0.9 | 5.6 | GO:1990769 | proximal neuron projection(GO:1990769) |
| 0.9 | 7.4 | GO:0005742 | mitochondrial outer membrane translocase complex(GO:0005742) |
| 0.9 | 21.8 | GO:0001518 | voltage-gated sodium channel complex(GO:0001518) |
| 0.8 | 3.4 | GO:1990578 | perinuclear endoplasmic reticulum membrane(GO:1990578) |
| 0.8 | 2.5 | GO:0044609 | DBIRD complex(GO:0044609) |
| 0.8 | 3.9 | GO:0044352 | pinosome(GO:0044352) macropinosome(GO:0044354) |
| 0.8 | 4.7 | GO:0009331 | glycerol-3-phosphate dehydrogenase complex(GO:0009331) |
| 0.8 | 6.0 | GO:0045179 | apical cortex(GO:0045179) |
| 0.7 | 2.1 | GO:0097441 | basilar dendrite(GO:0097441) |
| 0.7 | 4.7 | GO:1990130 | Iml1 complex(GO:1990130) |
| 0.6 | 3.2 | GO:0089701 | U2AF(GO:0089701) |
| 0.6 | 10.8 | GO:0033010 | paranodal junction(GO:0033010) |
| 0.6 | 7.5 | GO:0097539 | ciliary transition fiber(GO:0097539) |
| 0.6 | 17.9 | GO:0043218 | compact myelin(GO:0043218) |
| 0.6 | 2.3 | GO:0005965 | protein farnesyltransferase complex(GO:0005965) |
| 0.6 | 7.3 | GO:0005833 | hemoglobin complex(GO:0005833) |
| 0.6 | 2.8 | GO:0036128 | CatSper complex(GO:0036128) |
| 0.5 | 2.6 | GO:0005854 | nascent polypeptide-associated complex(GO:0005854) |
| 0.5 | 5.5 | GO:0030285 | integral component of synaptic vesicle membrane(GO:0030285) intrinsic component of synaptic vesicle membrane(GO:0098563) |
| 0.5 | 5.9 | GO:0030126 | COPI vesicle coat(GO:0030126) |
| 0.5 | 1.5 | GO:0072536 | interleukin-23 receptor complex(GO:0072536) |
| 0.5 | 4.2 | GO:0070652 | HAUS complex(GO:0070652) |
| 0.5 | 6.5 | GO:0043083 | synaptic cleft(GO:0043083) |
| 0.4 | 2.5 | GO:0097442 | CA3 pyramidal cell dendrite(GO:0097442) |
| 0.4 | 2.8 | GO:0060091 | kinocilium(GO:0060091) |
| 0.4 | 16.2 | GO:0034451 | centriolar satellite(GO:0034451) |
| 0.4 | 2.8 | GO:1990635 | proximal dendrite(GO:1990635) |
| 0.4 | 3.5 | GO:0033270 | paranode region of axon(GO:0033270) |
| 0.4 | 8.1 | GO:0005952 | cAMP-dependent protein kinase complex(GO:0005952) |
| 0.4 | 2.2 | GO:0005945 | 6-phosphofructokinase complex(GO:0005945) |
| 0.4 | 9.0 | GO:0044295 | axonal growth cone(GO:0044295) |
| 0.3 | 1.4 | GO:0005899 | insulin receptor complex(GO:0005899) |
| 0.3 | 15.0 | GO:0048786 | presynaptic active zone(GO:0048786) |
| 0.3 | 22.0 | GO:0030672 | synaptic vesicle membrane(GO:0030672) exocytic vesicle membrane(GO:0099501) |
| 0.3 | 3.6 | GO:0030061 | mitochondrial crista(GO:0030061) |
| 0.3 | 9.1 | GO:0030673 | axolemma(GO:0030673) |
| 0.3 | 6.6 | GO:0014731 | spectrin-associated cytoskeleton(GO:0014731) |
| 0.3 | 4.3 | GO:0030130 | clathrin coat of trans-Golgi network vesicle(GO:0030130) |
| 0.3 | 18.4 | GO:0043034 | costamere(GO:0043034) |
| 0.3 | 21.1 | GO:0043195 | terminal bouton(GO:0043195) |
| 0.3 | 3.4 | GO:0017146 | NMDA selective glutamate receptor complex(GO:0017146) |
| 0.3 | 1.1 | GO:0005879 | axonemal microtubule(GO:0005879) |
| 0.3 | 4.2 | GO:0030478 | actin cap(GO:0030478) |
| 0.3 | 1.1 | GO:0038038 | G-protein coupled receptor homodimeric complex(GO:0038038) |
| 0.3 | 7.3 | GO:0031231 | integral component of peroxisomal membrane(GO:0005779) intrinsic component of peroxisomal membrane(GO:0031231) |
| 0.3 | 2.1 | GO:0000110 | nucleotide-excision repair factor 1 complex(GO:0000110) ERCC4-ERCC1 complex(GO:0070522) |
| 0.2 | 2.5 | GO:0046581 | intercellular canaliculus(GO:0046581) |
| 0.2 | 2.9 | GO:0030015 | CCR4-NOT core complex(GO:0030015) |
| 0.2 | 2.6 | GO:0042589 | zymogen granule membrane(GO:0042589) |
| 0.2 | 1.7 | GO:0097209 | epidermal lamellar body(GO:0097209) |
| 0.2 | 15.2 | GO:0005891 | voltage-gated calcium channel complex(GO:0005891) |
| 0.2 | 1.4 | GO:0034751 | aryl hydrocarbon receptor complex(GO:0034751) |
| 0.2 | 1.7 | GO:0070765 | gamma-secretase complex(GO:0070765) |
| 0.2 | 6.3 | GO:0005892 | acetylcholine-gated channel complex(GO:0005892) |
| 0.2 | 1.5 | GO:0036021 | endolysosome lumen(GO:0036021) |
| 0.2 | 4.1 | GO:0016342 | catenin complex(GO:0016342) |
| 0.2 | 4.6 | GO:0043198 | dendritic shaft(GO:0043198) |
| 0.2 | 0.6 | GO:0005944 | phosphatidylinositol 3-kinase complex, class IB(GO:0005944) |
| 0.2 | 1.2 | GO:0070852 | cell body fiber(GO:0070852) |
| 0.2 | 2.3 | GO:0030897 | HOPS complex(GO:0030897) |
| 0.2 | 1.5 | GO:1905202 | 3-methylcrotonyl-CoA carboxylase complex, mitochondrial(GO:0002169) methylcrotonoyl-CoA carboxylase complex(GO:1905202) |
| 0.2 | 2.3 | GO:0043240 | Fanconi anaemia nuclear complex(GO:0043240) |
| 0.2 | 3.2 | GO:0031594 | neuromuscular junction(GO:0031594) |
| 0.2 | 3.3 | GO:0005922 | connexon complex(GO:0005922) |
| 0.2 | 1.1 | GO:0002177 | manchette(GO:0002177) |
| 0.2 | 2.4 | GO:0000124 | SAGA complex(GO:0000124) |
| 0.2 | 7.2 | GO:0001533 | cornified envelope(GO:0001533) |
| 0.2 | 2.9 | GO:0030992 | intraciliary transport particle B(GO:0030992) |
| 0.1 | 0.6 | GO:0098592 | cytoplasmic side of apical plasma membrane(GO:0098592) |
| 0.1 | 2.9 | GO:0016580 | Sin3 complex(GO:0016580) |
| 0.1 | 42.3 | GO:0060076 | excitatory synapse(GO:0060076) |
| 0.1 | 3.3 | GO:0097546 | ciliary base(GO:0097546) |
| 0.1 | 2.4 | GO:0036038 | MKS complex(GO:0036038) |
| 0.1 | 3.0 | GO:0097381 | photoreceptor disc membrane(GO:0097381) |
| 0.1 | 2.8 | GO:0032391 | photoreceptor connecting cilium(GO:0032391) |
| 0.1 | 0.6 | GO:0031302 | intrinsic component of endosome membrane(GO:0031302) |
| 0.1 | 1.2 | GO:0005614 | interstitial matrix(GO:0005614) |
| 0.1 | 0.4 | GO:0008043 | intracellular ferritin complex(GO:0008043) ferritin complex(GO:0070288) |
| 0.1 | 3.5 | GO:0036064 | ciliary basal body(GO:0036064) |
| 0.1 | 2.4 | GO:0001772 | immunological synapse(GO:0001772) |
| 0.1 | 3.1 | GO:0044322 | endoplasmic reticulum quality control compartment(GO:0044322) |
| 0.1 | 0.9 | GO:0030123 | AP-3 adaptor complex(GO:0030123) |
| 0.1 | 0.9 | GO:0034992 | microtubule organizing center attachment site(GO:0034992) LINC complex(GO:0034993) |
| 0.1 | 12.6 | GO:0000932 | cytoplasmic mRNA processing body(GO:0000932) |
| 0.1 | 1.6 | GO:0000786 | nucleosome(GO:0000786) |
| 0.1 | 13.6 | GO:0031225 | anchored component of membrane(GO:0031225) |
| 0.1 | 9.3 | GO:0034705 | voltage-gated potassium channel complex(GO:0008076) potassium channel complex(GO:0034705) |
| 0.1 | 7.7 | GO:0005814 | centriole(GO:0005814) |
| 0.1 | 2.9 | GO:1902711 | GABA-A receptor complex(GO:1902711) |
| 0.1 | 0.4 | GO:0060171 | stereocilium membrane(GO:0060171) |
| 0.1 | 2.3 | GO:0005901 | caveola(GO:0005901) |
| 0.1 | 8.2 | GO:0031256 | leading edge membrane(GO:0031256) |
| 0.1 | 4.7 | GO:0045334 | clathrin-coated endocytic vesicle(GO:0045334) |
| 0.1 | 0.7 | GO:0097524 | sperm plasma membrane(GO:0097524) |
| 0.1 | 2.2 | GO:0030131 | clathrin adaptor complex(GO:0030131) |
| 0.1 | 1.0 | GO:0042622 | photoreceptor outer segment membrane(GO:0042622) |
| 0.1 | 18.3 | GO:0016323 | basolateral plasma membrane(GO:0016323) |
| 0.1 | 10.0 | GO:0005795 | Golgi stack(GO:0005795) |
| 0.1 | 0.3 | GO:0031205 | endoplasmic reticulum Sec complex(GO:0031205) |
| 0.1 | 0.9 | GO:0005862 | muscle thin filament tropomyosin(GO:0005862) |
| 0.1 | 3.9 | GO:0005796 | Golgi lumen(GO:0005796) |
| 0.1 | 6.5 | GO:0005903 | brush border(GO:0005903) |
| 0.1 | 9.7 | GO:0032993 | protein-DNA complex(GO:0032993) |
| 0.1 | 0.8 | GO:0043020 | NADPH oxidase complex(GO:0043020) |
| 0.1 | 0.3 | GO:0097165 | nuclear stress granule(GO:0097165) |
| 0.1 | 0.5 | GO:0045180 | basal cortex(GO:0045180) |
| 0.0 | 4.5 | GO:0005604 | basement membrane(GO:0005604) |
| 0.0 | 0.2 | GO:0034274 | Atg12-Atg5-Atg16 complex(GO:0034274) |
| 0.0 | 1.4 | GO:0005581 | collagen trimer(GO:0005581) |
| 0.0 | 12.4 | GO:0005578 | proteinaceous extracellular matrix(GO:0005578) |
| 0.0 | 6.3 | GO:0030427 | site of polarized growth(GO:0030427) |
| 0.0 | 1.5 | GO:0071564 | SWI/SNF complex(GO:0016514) npBAF complex(GO:0071564) |
| 0.0 | 10.2 | GO:0005789 | endoplasmic reticulum membrane(GO:0005789) |
| 0.0 | 0.7 | GO:0001917 | photoreceptor inner segment(GO:0001917) |
| 0.0 | 154.2 | GO:0016021 | integral component of membrane(GO:0016021) |
| 0.0 | 0.5 | GO:0031235 | intrinsic component of the cytoplasmic side of the plasma membrane(GO:0031235) |
| 0.0 | 0.2 | GO:0097129 | cyclin D2-CDK4 complex(GO:0097129) |
| 0.0 | 0.8 | GO:0034364 | high-density lipoprotein particle(GO:0034364) |
| 0.0 | 1.1 | GO:0043204 | perikaryon(GO:0043204) |
| 0.0 | 1.4 | GO:0010494 | cytoplasmic stress granule(GO:0010494) |
| 0.0 | 1.5 | GO:0031514 | motile cilium(GO:0031514) |
| 0.0 | 0.2 | GO:0033588 | Elongator holoenzyme complex(GO:0033588) |
| 0.0 | 0.4 | GO:0000314 | organellar small ribosomal subunit(GO:0000314) mitochondrial small ribosomal subunit(GO:0005763) |
| 0.0 | 1.5 | GO:0031674 | I band(GO:0031674) |
| 0.0 | 0.4 | GO:0080008 | Cul4-RING E3 ubiquitin ligase complex(GO:0080008) |
Gene overrepresentation in molecular function category:
| Log-likelihood per target | Total log-likelihood | Term | Description |
|---|---|---|---|
| 6.7 | 26.9 | GO:0047192 | 1-alkylglycerophosphocholine O-acetyltransferase activity(GO:0047192) |
| 3.1 | 92.4 | GO:0005212 | structural constituent of eye lens(GO:0005212) |
| 3.0 | 14.9 | GO:0015319 | sodium:inorganic phosphate symporter activity(GO:0015319) |
| 2.7 | 8.1 | GO:0008321 | Ral guanyl-nucleotide exchange factor activity(GO:0008321) |
| 2.7 | 37.5 | GO:0015501 | glutamate:sodium symporter activity(GO:0015501) |
| 2.6 | 33.4 | GO:0004705 | JUN kinase activity(GO:0004705) SAP kinase activity(GO:0016909) |
| 2.5 | 12.7 | GO:0030348 | syntaxin-3 binding(GO:0030348) |
| 2.5 | 12.4 | GO:0005298 | proline:sodium symporter activity(GO:0005298) |
| 2.3 | 18.5 | GO:0086006 | voltage-gated sodium channel activity involved in cardiac muscle cell action potential(GO:0086006) |
| 2.3 | 11.4 | GO:0030109 | HLA-B specific inhibitory MHC class I receptor activity(GO:0030109) |
| 2.2 | 17.4 | GO:0004971 | AMPA glutamate receptor activity(GO:0004971) |
| 2.1 | 14.9 | GO:0030492 | hemoglobin binding(GO:0030492) |
| 2.1 | 16.5 | GO:0070699 | type II activin receptor binding(GO:0070699) |
| 2.0 | 25.5 | GO:1990239 | steroid hormone binding(GO:1990239) |
| 1.7 | 5.2 | GO:0003863 | alpha-ketoacid dehydrogenase activity(GO:0003826) 3-methyl-2-oxobutanoate dehydrogenase (2-methylpropanoyl-transferring) activity(GO:0003863) |
| 1.5 | 7.3 | GO:0004994 | somatostatin receptor activity(GO:0004994) |
| 1.4 | 4.2 | GO:1904455 | ubiquitin-specific protease activity involved in negative regulation of ERAD pathway(GO:1904455) |
| 1.4 | 9.8 | GO:0001515 | opioid peptide activity(GO:0001515) |
| 1.3 | 6.7 | GO:0004591 | oxoglutarate dehydrogenase (succinyl-transferring) activity(GO:0004591) |
| 1.3 | 5.2 | GO:0004852 | uroporphyrinogen-III synthase activity(GO:0004852) |
| 1.3 | 10.3 | GO:0097643 | amylin receptor activity(GO:0097643) |
| 1.3 | 6.3 | GO:0005152 | interleukin-1 receptor antagonist activity(GO:0005152) |
| 1.2 | 7.3 | GO:0099583 | neurotransmitter receptor activity involved in regulation of postsynaptic cytosolic calcium ion concentration(GO:0099583) |
| 1.2 | 6.1 | GO:0008532 | N-acetyllactosaminide beta-1,3-N-acetylglucosaminyltransferase activity(GO:0008532) |
| 1.2 | 4.7 | GO:0052590 | sn-glycerol-3-phosphate:ubiquinone oxidoreductase activity(GO:0052590) sn-glycerol-3-phosphate:ubiquinone-8 oxidoreductase activity(GO:0052591) |
| 1.1 | 4.6 | GO:0004886 | 9-cis retinoic acid receptor activity(GO:0004886) |
| 1.1 | 3.4 | GO:0070052 | collagen V binding(GO:0070052) |
| 1.1 | 7.9 | GO:0050291 | sphingosine N-acyltransferase activity(GO:0050291) |
| 1.1 | 4.2 | GO:0051538 | 3 iron, 4 sulfur cluster binding(GO:0051538) |
| 1.0 | 6.1 | GO:0047057 | oxidoreductase activity, acting on the CH-OH group of donors, disulfide as acceptor(GO:0016900) vitamin-K-epoxide reductase (warfarin-sensitive) activity(GO:0047057) |
| 1.0 | 3.0 | GO:0080019 | fatty-acyl-CoA reductase (alcohol-forming) activity(GO:0080019) |
| 1.0 | 9.6 | GO:0005549 | odorant binding(GO:0005549) |
| 0.9 | 34.9 | GO:0043015 | gamma-tubulin binding(GO:0043015) |
| 0.9 | 25.4 | GO:0043274 | phospholipase binding(GO:0043274) |
| 0.9 | 2.8 | GO:0016422 | mRNA (2'-O-methyladenosine-N6-)-methyltransferase activity(GO:0016422) |
| 0.9 | 13.3 | GO:0005132 | type I interferon receptor binding(GO:0005132) |
| 0.9 | 2.6 | GO:0070984 | SET domain binding(GO:0070984) |
| 0.9 | 8.8 | GO:0004064 | arylesterase activity(GO:0004064) |
| 0.9 | 16.6 | GO:0008391 | arachidonic acid monooxygenase activity(GO:0008391) arachidonic acid epoxygenase activity(GO:0008392) |
| 0.9 | 14.8 | GO:0019864 | IgG binding(GO:0019864) |
| 0.9 | 74.0 | GO:0050840 | extracellular matrix binding(GO:0050840) |
| 0.9 | 23.1 | GO:0070300 | phosphatidic acid binding(GO:0070300) |
| 0.8 | 22.8 | GO:0050750 | low-density lipoprotein particle receptor binding(GO:0050750) |
| 0.8 | 3.2 | GO:0001602 | pancreatic polypeptide receptor activity(GO:0001602) |
| 0.8 | 3.2 | GO:0030628 | pre-mRNA 3'-splice site binding(GO:0030628) |
| 0.7 | 4.4 | GO:0003873 | 6-phosphofructo-2-kinase activity(GO:0003873) |
| 0.7 | 7.4 | GO:0001042 | RNA polymerase I core binding(GO:0001042) |
| 0.7 | 7.4 | GO:0055131 | C3HC4-type RING finger domain binding(GO:0055131) |
| 0.7 | 2.1 | GO:0033878 | hormone-sensitive lipase activity(GO:0033878) |
| 0.7 | 7.1 | GO:0042731 | PH domain binding(GO:0042731) |
| 0.7 | 1.4 | GO:0046848 | hydroxyapatite binding(GO:0046848) |
| 0.7 | 11.2 | GO:0004691 | cAMP-dependent protein kinase activity(GO:0004691) |
| 0.7 | 6.3 | GO:0015272 | ATP-activated inward rectifier potassium channel activity(GO:0015272) |
| 0.7 | 3.5 | GO:0030197 | extracellular matrix constituent, lubricant activity(GO:0030197) |
| 0.7 | 2.1 | GO:0010521 | telomerase inhibitor activity(GO:0010521) |
| 0.7 | 3.5 | GO:0070740 | tubulin-glutamic acid ligase activity(GO:0070740) |
| 0.6 | 7.5 | GO:0005344 | oxygen transporter activity(GO:0005344) |
| 0.6 | 5.5 | GO:0015277 | kainate selective glutamate receptor activity(GO:0015277) |
| 0.6 | 12.1 | GO:0048156 | tau protein binding(GO:0048156) |
| 0.6 | 3.0 | GO:0015183 | L-aspartate transmembrane transporter activity(GO:0015183) |
| 0.6 | 2.4 | GO:0086077 | gap junction channel activity involved in SA node cell-atrial cardiac muscle cell electrical coupling(GO:0086020) gap junction channel activity involved in AV node cell-bundle of His cell electrical coupling(GO:0086077) |
| 0.6 | 2.3 | GO:0004660 | protein farnesyltransferase activity(GO:0004660) |
| 0.6 | 6.8 | GO:0030280 | structural constituent of epidermis(GO:0030280) |
| 0.5 | 2.2 | GO:0001588 | dopamine neurotransmitter receptor activity, coupled via Gs(GO:0001588) |
| 0.5 | 2.2 | GO:0070905 | serine binding(GO:0070905) |
| 0.5 | 1.6 | GO:0046577 | long-chain-alcohol oxidase activity(GO:0046577) |
| 0.5 | 4.6 | GO:0035727 | lysophosphatidic acid binding(GO:0035727) |
| 0.5 | 3.1 | GO:0030345 | extracellular matrix structural constituent conferring compression resistance(GO:0030021) structural constituent of tooth enamel(GO:0030345) |
| 0.5 | 2.0 | GO:0050119 | N-acetylglucosamine deacetylase activity(GO:0050119) |
| 0.5 | 2.5 | GO:0004690 | cyclic nucleotide-dependent protein kinase activity(GO:0004690) cGMP-dependent protein kinase activity(GO:0004692) |
| 0.5 | 10.4 | GO:0001087 | transcription factor activity, sequence-specific DNA binding, RNA polymerase recruiting(GO:0001011) transcription factor activity, TFIIB-class binding(GO:0001087) |
| 0.5 | 2.0 | GO:1901474 | L-alanine transmembrane transporter activity(GO:0015180) alanine transmembrane transporter activity(GO:0022858) azole transmembrane transporter activity(GO:1901474) |
| 0.5 | 1.5 | GO:0042020 | interleukin-23 binding(GO:0042019) interleukin-23 receptor activity(GO:0042020) |
| 0.5 | 2.4 | GO:0015184 | L-cystine transmembrane transporter activity(GO:0015184) |
| 0.5 | 1.4 | GO:0070290 | N-acylphosphatidylethanolamine-specific phospholipase D activity(GO:0070290) |
| 0.5 | 1.4 | GO:0003865 | 3-oxo-5-alpha-steroid 4-dehydrogenase activity(GO:0003865) steroid dehydrogenase activity, acting on the CH-CH group of donors(GO:0033765) cholestenone 5-alpha-reductase activity(GO:0047751) |
| 0.5 | 6.5 | GO:0031419 | cobalamin binding(GO:0031419) |
| 0.4 | 2.7 | GO:0015057 | thrombin receptor activity(GO:0015057) |
| 0.4 | 2.7 | GO:0004489 | methylenetetrahydrofolate reductase (NAD(P)H) activity(GO:0004489) |
| 0.4 | 11.4 | GO:0005251 | delayed rectifier potassium channel activity(GO:0005251) |
| 0.4 | 7.8 | GO:0008179 | adenylate cyclase binding(GO:0008179) |
| 0.4 | 13.8 | GO:0008331 | high voltage-gated calcium channel activity(GO:0008331) |
| 0.4 | 5.7 | GO:0043522 | leucine zipper domain binding(GO:0043522) |
| 0.4 | 1.2 | GO:0001596 | angiotensin type I receptor activity(GO:0001596) |
| 0.4 | 5.5 | GO:0008253 | 5'-nucleotidase activity(GO:0008253) |
| 0.4 | 5.8 | GO:0019957 | C-C chemokine binding(GO:0019957) |
| 0.4 | 1.5 | GO:0031728 | CCR3 chemokine receptor binding(GO:0031728) |
| 0.4 | 3.4 | GO:0005234 | extracellular-glutamate-gated ion channel activity(GO:0005234) |
| 0.4 | 4.6 | GO:0008430 | selenium binding(GO:0008430) |
| 0.4 | 6.1 | GO:0035497 | cAMP response element binding(GO:0035497) |
| 0.4 | 1.1 | GO:0031862 | prostanoid receptor binding(GO:0031862) |
| 0.4 | 3.4 | GO:0046935 | phosphatidylinositol 3-kinase regulatory subunit binding(GO:0036312) 1-phosphatidylinositol-3-kinase regulator activity(GO:0046935) |
| 0.4 | 3.4 | GO:1901702 | urate transmembrane transporter activity(GO:0015143) salt transmembrane transporter activity(GO:1901702) |
| 0.4 | 9.2 | GO:0001223 | transcription coactivator binding(GO:0001223) |
| 0.4 | 20.6 | GO:0030507 | spectrin binding(GO:0030507) |
| 0.4 | 2.6 | GO:0097322 | 7SK snRNA binding(GO:0097322) |
| 0.4 | 0.7 | GO:0022850 | serotonin-gated cation channel activity(GO:0022850) |
| 0.3 | 4.7 | GO:0015250 | water channel activity(GO:0015250) |
| 0.3 | 2.3 | GO:0003828 | alpha-N-acetylneuraminate alpha-2,8-sialyltransferase activity(GO:0003828) |
| 0.3 | 2.0 | GO:0005223 | intracellular cGMP activated cation channel activity(GO:0005223) |
| 0.3 | 3.9 | GO:0004716 | receptor signaling protein tyrosine kinase activity(GO:0004716) |
| 0.3 | 2.6 | GO:0004322 | ferroxidase activity(GO:0004322) oxidoreductase activity, oxidizing metal ions, oxygen as acceptor(GO:0016724) |
| 0.3 | 3.9 | GO:0005007 | fibroblast growth factor-activated receptor activity(GO:0005007) |
| 0.3 | 1.3 | GO:0047288 | monosialoganglioside sialyltransferase activity(GO:0047288) |
| 0.3 | 8.5 | GO:0004012 | phospholipid-translocating ATPase activity(GO:0004012) |
| 0.3 | 0.9 | GO:0033300 | dehydroascorbic acid transporter activity(GO:0033300) |
| 0.3 | 1.5 | GO:0032795 | heterotrimeric G-protein binding(GO:0032795) |
| 0.3 | 8.6 | GO:0005388 | calcium-transporting ATPase activity(GO:0005388) |
| 0.3 | 4.9 | GO:0030215 | semaphorin receptor binding(GO:0030215) |
| 0.3 | 1.5 | GO:0008526 | phosphatidylinositol transporter activity(GO:0008526) |
| 0.3 | 4.3 | GO:0048406 | nerve growth factor binding(GO:0048406) |
| 0.3 | 1.7 | GO:0004882 | androgen receptor activity(GO:0004882) |
| 0.3 | 2.2 | GO:0005087 | Ran guanyl-nucleotide exchange factor activity(GO:0005087) |
| 0.3 | 1.1 | GO:0052593 | tryptamine:oxygen oxidoreductase (deaminating) activity(GO:0052593) aminoacetone:oxygen oxidoreductase(deaminating) activity(GO:0052594) aliphatic-amine oxidase activity(GO:0052595) phenethylamine:oxygen oxidoreductase (deaminating) activity(GO:0052596) |
| 0.3 | 2.2 | GO:0044547 | DNA topoisomerase binding(GO:0044547) |
| 0.3 | 5.9 | GO:0002162 | dystroglycan binding(GO:0002162) |
| 0.3 | 0.8 | GO:0017129 | triglyceride binding(GO:0017129) |
| 0.3 | 5.6 | GO:0005247 | voltage-gated chloride channel activity(GO:0005247) |
| 0.3 | 9.2 | GO:0005104 | fibroblast growth factor receptor binding(GO:0005104) |
| 0.3 | 0.8 | GO:0050528 | acyloxyacyl hydrolase activity(GO:0050528) |
| 0.3 | 1.6 | GO:0039552 | RIG-I binding(GO:0039552) |
| 0.3 | 1.8 | GO:0003810 | protein-glutamine gamma-glutamyltransferase activity(GO:0003810) |
| 0.3 | 0.8 | GO:0030171 | voltage-gated proton channel activity(GO:0030171) |
| 0.3 | 1.3 | GO:0004991 | parathyroid hormone receptor activity(GO:0004991) |
| 0.3 | 11.1 | GO:0046875 | ephrin receptor binding(GO:0046875) |
| 0.3 | 2.5 | GO:0015386 | sodium:proton antiporter activity(GO:0015385) potassium:proton antiporter activity(GO:0015386) |
| 0.2 | 1.7 | GO:0070891 | lipoteichoic acid binding(GO:0070891) |
| 0.2 | 5.6 | GO:0043014 | alpha-tubulin binding(GO:0043014) |
| 0.2 | 6.3 | GO:0022848 | acetylcholine-gated cation channel activity(GO:0022848) acetylcholine binding(GO:0042166) |
| 0.2 | 0.9 | GO:0042954 | lipoprotein transporter activity(GO:0042954) |
| 0.2 | 5.0 | GO:0008353 | RNA polymerase II carboxy-terminal domain kinase activity(GO:0008353) |
| 0.2 | 4.2 | GO:0015101 | organic cation transmembrane transporter activity(GO:0015101) |
| 0.2 | 8.0 | GO:0005086 | ARF guanyl-nucleotide exchange factor activity(GO:0005086) |
| 0.2 | 15.5 | GO:0001540 | beta-amyloid binding(GO:0001540) |
| 0.2 | 3.8 | GO:0008503 | benzodiazepine receptor activity(GO:0008503) |
| 0.2 | 0.9 | GO:0015018 | galactosylgalactosylxylosylprotein 3-beta-glucuronosyltransferase activity(GO:0015018) |
| 0.2 | 7.6 | GO:0005184 | neuropeptide hormone activity(GO:0005184) |
| 0.2 | 4.1 | GO:0045294 | alpha-catenin binding(GO:0045294) |
| 0.2 | 6.3 | GO:0015248 | sterol transporter activity(GO:0015248) |
| 0.2 | 3.1 | GO:0043225 | anion transmembrane-transporting ATPase activity(GO:0043225) |
| 0.2 | 1.5 | GO:0019788 | NEDD8 transferase activity(GO:0019788) |
| 0.2 | 19.3 | GO:0004984 | olfactory receptor activity(GO:0004984) |
| 0.2 | 6.4 | GO:0030676 | Rac guanyl-nucleotide exchange factor activity(GO:0030676) |
| 0.2 | 1.3 | GO:0001517 | N-acetylglucosamine 6-O-sulfotransferase activity(GO:0001517) |
| 0.2 | 1.5 | GO:0004485 | methylcrotonoyl-CoA carboxylase activity(GO:0004485) |
| 0.2 | 3.8 | GO:0005522 | profilin binding(GO:0005522) |
| 0.2 | 1.1 | GO:0032038 | myosin II heavy chain binding(GO:0032038) |
| 0.2 | 0.9 | GO:0016841 | ammonia-lyase activity(GO:0016841) |
| 0.2 | 3.1 | GO:0016303 | 1-phosphatidylinositol-3-kinase activity(GO:0016303) |
| 0.2 | 3.5 | GO:0008093 | cytoskeletal adaptor activity(GO:0008093) |
| 0.2 | 2.5 | GO:0017154 | semaphorin receptor activity(GO:0017154) |
| 0.2 | 1.1 | GO:0004962 | endothelin receptor activity(GO:0004962) |
| 0.2 | 2.3 | GO:0042813 | Wnt-activated receptor activity(GO:0042813) |
| 0.1 | 7.3 | GO:0004864 | protein phosphatase inhibitor activity(GO:0004864) |
| 0.1 | 6.1 | GO:0017091 | AU-rich element binding(GO:0017091) |
| 0.1 | 1.5 | GO:0046625 | sphingolipid binding(GO:0046625) |
| 0.1 | 2.0 | GO:0099589 | G-protein coupled serotonin receptor activity(GO:0004993) serotonin receptor activity(GO:0099589) |
| 0.1 | 8.0 | GO:0005544 | calcium-dependent phospholipid binding(GO:0005544) |
| 0.1 | 26.7 | GO:0001078 | transcriptional repressor activity, RNA polymerase II core promoter proximal region sequence-specific binding(GO:0001078) |
| 0.1 | 10.7 | GO:0048306 | calcium-dependent protein binding(GO:0048306) |
| 0.1 | 0.4 | GO:0030290 | sphingolipid activator protein activity(GO:0030290) beta-N-acetylgalactosaminidase activity(GO:0032428) |
| 0.1 | 4.9 | GO:0004198 | calcium-dependent cysteine-type endopeptidase activity(GO:0004198) |
| 0.1 | 3.3 | GO:0005248 | voltage-gated sodium channel activity(GO:0005248) voltage-gated ion channel activity involved in regulation of postsynaptic membrane potential(GO:1905030) |
| 0.1 | 15.1 | GO:0004222 | metalloendopeptidase activity(GO:0004222) |
| 0.1 | 2.9 | GO:0070402 | NADPH binding(GO:0070402) |
| 0.1 | 0.8 | GO:0004499 | N,N-dimethylaniline monooxygenase activity(GO:0004499) |
| 0.1 | 1.4 | GO:0001758 | retinal dehydrogenase activity(GO:0001758) |
| 0.1 | 1.8 | GO:0033549 | MAP kinase phosphatase activity(GO:0033549) |
| 0.1 | 3.3 | GO:1990841 | promoter-specific chromatin binding(GO:1990841) |
| 0.1 | 5.3 | GO:0001102 | RNA polymerase II activating transcription factor binding(GO:0001102) |
| 0.1 | 1.7 | GO:0045236 | CXCR chemokine receptor binding(GO:0045236) |
| 0.1 | 3.0 | GO:0005031 | tumor necrosis factor-activated receptor activity(GO:0005031) death receptor activity(GO:0005035) |
| 0.1 | 1.5 | GO:0001968 | fibronectin binding(GO:0001968) |
| 0.1 | 2.6 | GO:0042288 | MHC class I protein binding(GO:0042288) |
| 0.1 | 2.0 | GO:0017081 | chloride channel regulator activity(GO:0017081) |
| 0.1 | 2.1 | GO:0008510 | sodium:bicarbonate symporter activity(GO:0008510) |
| 0.1 | 1.8 | GO:0098641 | cadherin binding involved in cell-cell adhesion(GO:0098641) |
| 0.1 | 0.7 | GO:0030169 | low-density lipoprotein particle binding(GO:0030169) |
| 0.1 | 7.2 | GO:0042626 | ATPase activity, coupled to transmembrane movement of substances(GO:0042626) |
| 0.1 | 1.3 | GO:0004089 | carbonate dehydratase activity(GO:0004089) |
| 0.1 | 3.9 | GO:0015144 | carbohydrate transmembrane transporter activity(GO:0015144) carbohydrate transporter activity(GO:1901476) |
| 0.1 | 2.2 | GO:0042605 | peptide antigen binding(GO:0042605) |
| 0.1 | 1.0 | GO:0008020 | G-protein coupled photoreceptor activity(GO:0008020) |
| 0.1 | 0.9 | GO:0005243 | gap junction channel activity(GO:0005243) |
| 0.1 | 3.6 | GO:0005546 | phosphatidylinositol-4,5-bisphosphate binding(GO:0005546) |
| 0.1 | 1.8 | GO:0031210 | phosphatidylcholine binding(GO:0031210) |
| 0.1 | 1.9 | GO:0005523 | tropomyosin binding(GO:0005523) |
| 0.1 | 2.7 | GO:0005109 | frizzled binding(GO:0005109) |
| 0.1 | 1.9 | GO:0071837 | HMG box domain binding(GO:0071837) |
| 0.1 | 3.8 | GO:0004683 | calmodulin-dependent protein kinase activity(GO:0004683) |
| 0.1 | 2.3 | GO:0008188 | neuropeptide receptor activity(GO:0008188) |
| 0.1 | 1.4 | GO:0000062 | fatty-acyl-CoA binding(GO:0000062) |
| 0.1 | 3.9 | GO:0043621 | protein self-association(GO:0043621) |
| 0.1 | 2.5 | GO:0048020 | CCR chemokine receptor binding(GO:0048020) |
| 0.1 | 1.0 | GO:0070061 | fructose binding(GO:0070061) |
| 0.1 | 0.9 | GO:0008157 | protein phosphatase 1 binding(GO:0008157) |
| 0.1 | 1.6 | GO:0003746 | translation elongation factor activity(GO:0003746) |
| 0.1 | 2.9 | GO:0019894 | kinesin binding(GO:0019894) |
| 0.1 | 0.6 | GO:0017034 | Rap guanyl-nucleotide exchange factor activity(GO:0017034) |
| 0.1 | 27.0 | GO:0004842 | ubiquitin-protein transferase activity(GO:0004842) |
| 0.1 | 1.8 | GO:0019198 | transmembrane receptor protein tyrosine phosphatase activity(GO:0005001) transmembrane receptor protein phosphatase activity(GO:0019198) |
| 0.1 | 0.9 | GO:0043495 | protein anchor(GO:0043495) |
| 0.1 | 0.3 | GO:0046899 | nucleoside triphosphate adenylate kinase activity(GO:0046899) |
| 0.1 | 6.8 | GO:0008201 | heparin binding(GO:0008201) |
| 0.1 | 13.1 | GO:0005543 | phospholipid binding(GO:0005543) |
| 0.1 | 0.2 | GO:0004771 | sterol esterase activity(GO:0004771) |
| 0.1 | 0.9 | GO:0005537 | mannose binding(GO:0005537) |
| 0.1 | 3.1 | GO:0004869 | cysteine-type endopeptidase inhibitor activity(GO:0004869) |
| 0.1 | 0.4 | GO:0000268 | peroxisome targeting sequence binding(GO:0000268) |
| 0.1 | 4.4 | GO:0031490 | chromatin DNA binding(GO:0031490) |
| 0.1 | 9.5 | GO:0051015 | actin filament binding(GO:0051015) |
| 0.0 | 0.2 | GO:0019776 | Atg8 ligase activity(GO:0019776) |
| 0.0 | 1.4 | GO:0005158 | insulin receptor binding(GO:0005158) |
| 0.0 | 2.1 | GO:0005160 | transforming growth factor beta receptor binding(GO:0005160) |
| 0.0 | 3.8 | GO:0005200 | structural constituent of cytoskeleton(GO:0005200) |
| 0.0 | 0.7 | GO:0015467 | G-protein activated inward rectifier potassium channel activity(GO:0015467) |
| 0.0 | 0.5 | GO:0016174 | NAD(P)H oxidase activity(GO:0016174) |
| 0.0 | 0.5 | GO:0004955 | prostaglandin receptor activity(GO:0004955) |
| 0.0 | 4.7 | GO:0001227 | transcriptional repressor activity, RNA polymerase II transcription regulatory region sequence-specific binding(GO:0001227) |
| 0.0 | 1.5 | GO:0001105 | RNA polymerase II transcription coactivator activity(GO:0001105) |
| 0.0 | 0.2 | GO:0008853 | exodeoxyribonuclease III activity(GO:0008853) |
| 0.0 | 0.5 | GO:0004806 | triglyceride lipase activity(GO:0004806) |
| 0.0 | 0.1 | GO:0004461 | lactose synthase activity(GO:0004461) |
| 0.0 | 2.9 | GO:0003725 | double-stranded RNA binding(GO:0003725) |
| 0.0 | 0.5 | GO:0008569 | ATP-dependent microtubule motor activity, minus-end-directed(GO:0008569) |
| 0.0 | 1.8 | GO:0004521 | endoribonuclease activity(GO:0004521) |
| 0.0 | 0.3 | GO:0035381 | extracellular ATP-gated cation channel activity(GO:0004931) ATP-gated ion channel activity(GO:0035381) |
| 0.0 | 1.0 | GO:0003950 | NAD+ ADP-ribosyltransferase activity(GO:0003950) |
| 0.0 | 0.7 | GO:0004602 | glutathione peroxidase activity(GO:0004602) |
| 0.0 | 0.5 | GO:0031698 | beta-2 adrenergic receptor binding(GO:0031698) |
| 0.0 | 0.2 | GO:0008607 | phosphorylase kinase regulator activity(GO:0008607) |
| 0.0 | 0.2 | GO:0004321 | fatty-acyl-CoA synthase activity(GO:0004321) |
| 0.0 | 6.8 | GO:0005509 | calcium ion binding(GO:0005509) |
| 0.0 | 0.6 | GO:0005249 | voltage-gated potassium channel activity(GO:0005249) |
Gene overrepresentation in curated gene sets: canonical pathways category:
| Log-likelihood per target | Total log-likelihood | Term | Description |
|---|---|---|---|
| 1.2 | 60.1 | NABA PROTEOGLYCANS | Genes encoding proteoglycans |
| 0.7 | 44.4 | PID NEPHRIN NEPH1 PATHWAY | Nephrin/Neph1 signaling in the kidney podocyte |
| 0.4 | 7.5 | SA REG CASCADE OF CYCLIN EXPR | Expression of cyclins regulates progression through the cell cycle by activating cyclin-dependent kinases. |
| 0.4 | 1.5 | PID IL23 PATHWAY | IL23-mediated signaling events |
| 0.3 | 27.0 | PID P75 NTR PATHWAY | p75(NTR)-mediated signaling |
| 0.3 | 15.2 | PID NCADHERIN PATHWAY | N-cadherin signaling events |
| 0.3 | 4.6 | PID ECADHERIN KERATINOCYTE PATHWAY | E-cadherin signaling in keratinocytes |
| 0.3 | 11.0 | SIG CD40PATHWAYMAP | Genes related to CD40 signaling |
| 0.2 | 7.1 | PID DNA PK PATHWAY | DNA-PK pathway in nonhomologous end joining |
| 0.2 | 1.8 | PID P38 MK2 PATHWAY | p38 signaling mediated by MAPKAP kinases |
| 0.2 | 7.4 | PID EPHB FWD PATHWAY | EPHB forward signaling |
| 0.2 | 8.7 | PID MYC PATHWAY | C-MYC pathway |
| 0.2 | 6.7 | PID EPHA FWDPATHWAY | EPHA forward signaling |
| 0.2 | 2.6 | ST TYPE I INTERFERON PATHWAY | Type I Interferon (alpha/beta IFN) Pathway |
| 0.2 | 9.3 | PID IL12 STAT4 PATHWAY | IL12 signaling mediated by STAT4 |
| 0.2 | 6.6 | PID ERBB4 PATHWAY | ErbB4 signaling events |
| 0.2 | 11.8 | PID FGF PATHWAY | FGF signaling pathway |
| 0.2 | 6.7 | PID ALPHA SYNUCLEIN PATHWAY | Alpha-synuclein signaling |
| 0.2 | 3.1 | PID PI3K PLC TRK PATHWAY | Trk receptor signaling mediated by PI3K and PLC-gamma |
| 0.2 | 1.5 | PID S1P S1P1 PATHWAY | S1P1 pathway |
| 0.2 | 10.6 | PID RAC1 REG PATHWAY | Regulation of RAC1 activity |
| 0.2 | 8.1 | PID FOXO PATHWAY | FoxO family signaling |
| 0.2 | 9.3 | PID A6B1 A6B4 INTEGRIN PATHWAY | a6b1 and a6b4 Integrin signaling |
| 0.1 | 0.4 | SA FAS SIGNALING | The TNF-type receptor Fas induces apoptosis on ligand binding. |
| 0.1 | 2.5 | PID MET PATHWAY | Signaling events mediated by Hepatocyte Growth Factor Receptor (c-Met) |
| 0.1 | 6.3 | PID PTP1B PATHWAY | Signaling events mediated by PTP1B |
| 0.1 | 8.7 | PID INTEGRIN A4B1 PATHWAY | Alpha4 beta1 integrin signaling events |
| 0.1 | 4.7 | PID GLYPICAN 1PATHWAY | Glypican 1 network |
| 0.1 | 2.5 | PID P38 ALPHA BETA PATHWAY | Regulation of p38-alpha and p38-beta |
| 0.1 | 0.7 | PID TXA2PATHWAY | Thromboxane A2 receptor signaling |
| 0.1 | 3.4 | PID REELIN PATHWAY | Reelin signaling pathway |
| 0.1 | 13.8 | PID MYC ACTIV PATHWAY | Validated targets of C-MYC transcriptional activation |
| 0.1 | 6.8 | ST FAS SIGNALING PATHWAY | Fas Signaling Pathway |
| 0.1 | 10.8 | PID ERA GENOMIC PATHWAY | Validated nuclear estrogen receptor alpha network |
| 0.1 | 2.2 | PID SYNDECAN 2 PATHWAY | Syndecan-2-mediated signaling events |
| 0.1 | 2.0 | PID INSULIN PATHWAY | Insulin Pathway |
| 0.1 | 3.3 | PID NFAT 3PATHWAY | Role of Calcineurin-dependent NFAT signaling in lymphocytes |
| 0.1 | 4.5 | PID CD8 TCR DOWNSTREAM PATHWAY | Downstream signaling in naïve CD8+ T cells |
| 0.1 | 1.2 | PID EPO PATHWAY | EPO signaling pathway |
| 0.1 | 3.0 | PID RHODOPSIN PATHWAY | Visual signal transduction: Rods |
| 0.1 | 2.3 | PID ERBB1 DOWNSTREAM PATHWAY | ErbB1 downstream signaling |
| 0.1 | 1.8 | PID IL1 PATHWAY | IL1-mediated signaling events |
| 0.1 | 1.4 | PID IL3 PATHWAY | IL3-mediated signaling events |
| 0.1 | 3.8 | PID LYSOPHOSPHOLIPID PATHWAY | LPA receptor mediated events |
| 0.1 | 2.9 | PID HEDGEHOG GLI PATHWAY | Hedgehog signaling events mediated by Gli proteins |
| 0.1 | 1.2 | PID ANGIOPOIETIN RECEPTOR PATHWAY | Angiopoietin receptor Tie2-mediated signaling |
| 0.1 | 0.8 | PID RAC1 PATHWAY | RAC1 signaling pathway |
| 0.1 | 4.6 | PID AP1 PATHWAY | AP-1 transcription factor network |
| 0.1 | 6.8 | PID BETA CATENIN NUC PATHWAY | Regulation of nuclear beta catenin signaling and target gene transcription |
| 0.1 | 2.7 | PID P38 ALPHA BETA DOWNSTREAM PATHWAY | Signaling mediated by p38-alpha and p38-beta |
| 0.1 | 2.5 | PID LKB1 PATHWAY | LKB1 signaling events |
| 0.1 | 1.1 | PID ENDOTHELIN PATHWAY | Endothelins |
| 0.1 | 1.7 | PID IL12 2PATHWAY | IL12-mediated signaling events |
| 0.0 | 0.9 | PID P38 MKK3 6PATHWAY | p38 MAPK signaling pathway |
| 0.0 | 7.8 | NABA ECM AFFILIATED | Genes encoding proteins affiliated structurally or functionally to extracellular matrix proteins |
| 0.0 | 0.3 | PID ANTHRAX PATHWAY | Cellular roles of Anthrax toxin |
| 0.0 | 2.1 | PID AR TF PATHWAY | Regulation of Androgen receptor activity |
| 0.0 | 0.9 | ST WNT BETA CATENIN PATHWAY | Wnt/beta-catenin Pathway |
| 0.0 | 1.3 | PID HDAC CLASSII PATHWAY | Signaling events mediated by HDAC Class II |
| 0.0 | 1.6 | SIG PIP3 SIGNALING IN CARDIAC MYOCTES | Genes related to PIP3 signaling in cardiac myocytes |
| 0.0 | 1.3 | PID AJDISS 2PATHWAY | Posttranslational regulation of adherens junction stability and dissassembly |
| 0.0 | 0.9 | PID FCER1 PATHWAY | Fc-epsilon receptor I signaling in mast cells |
| 0.0 | 0.2 | SA PROGRAMMED CELL DEATH | Programmed cell death, or apoptosis, eliminates damaged or unneeded cells. |
| 0.0 | 0.9 | WNT SIGNALING | Genes related to Wnt-mediated signal transduction |
| 0.0 | 1.2 | PID CASPASE PATHWAY | Caspase cascade in apoptosis |
| 0.0 | 0.5 | ST ADRENERGIC | Adrenergic Pathway |
| 0.0 | 2.8 | NABA ECM GLYCOPROTEINS | Genes encoding structural ECM glycoproteins |
| 0.0 | 0.1 | PID KIT PATHWAY | Signaling events mediated by Stem cell factor receptor (c-Kit) |
| 0.0 | 0.2 | PID IL2 1PATHWAY | IL2-mediated signaling events |
| 0.0 | 0.3 | SIG REGULATION OF THE ACTIN CYTOSKELETON BY RHO GTPASES | Genes related to regulation of the actin cytoskeleton |
Gene overrepresentation in curated gene sets: REACTOME pathways category:
| Log-likelihood per target | Total log-likelihood | Term | Description |
|---|---|---|---|
| 2.3 | 61.2 | REACTOME CS DS DEGRADATION | Genes involved in CS/DS degradation |
| 1.5 | 48.4 | REACTOME GLUTAMATE NEUROTRANSMITTER RELEASE CYCLE | Genes involved in Glutamate Neurotransmitter Release Cycle |
| 1.2 | 33.4 | REACTOME ACTIVATION OF THE AP1 FAMILY OF TRANSCRIPTION FACTORS | Genes involved in Activation of the AP-1 family of transcription factors |
| 1.1 | 26.9 | REACTOME ACYL CHAIN REMODELLING OF PC | Genes involved in Acyl chain remodelling of PC |
| 0.9 | 16.6 | REACTOME XENOBIOTICS | Genes involved in Xenobiotics |
| 0.7 | 38.1 | REACTOME ION TRANSPORT BY P TYPE ATPASES | Genes involved in Ion transport by P-type ATPases |
| 0.7 | 50.4 | REACTOME AMINO ACID AND OLIGOPEPTIDE SLC TRANSPORTERS | Genes involved in Amino acid and oligopeptide SLC transporters |
| 0.7 | 0.7 | REACTOME PROSTACYCLIN SIGNALLING THROUGH PROSTACYCLIN RECEPTOR | Genes involved in Prostacyclin signalling through prostacyclin receptor |
| 0.7 | 20.8 | REACTOME UNBLOCKING OF NMDA RECEPTOR GLUTAMATE BINDING AND ACTIVATION | Genes involved in Unblocking of NMDA receptor, glutamate binding and activation |
| 0.6 | 10.1 | REACTOME REVERSIBLE HYDRATION OF CARBON DIOXIDE | Genes involved in Reversible Hydration of Carbon Dioxide |
| 0.6 | 24.9 | REACTOME ADHERENS JUNCTIONS INTERACTIONS | Genes involved in Adherens junctions interactions |
| 0.5 | 12.6 | REACTOME ABCA TRANSPORTERS IN LIPID HOMEOSTASIS | Genes involved in ABCA transporters in lipid homeostasis |
| 0.5 | 19.9 | REACTOME NEPHRIN INTERACTIONS | Genes involved in Nephrin interactions |
| 0.5 | 19.5 | REACTOME INTERACTION BETWEEN L1 AND ANKYRINS | Genes involved in Interaction between L1 and Ankyrins |
| 0.4 | 2.6 | REACTOME BINDING AND ENTRY OF HIV VIRION | Genes involved in Binding and entry of HIV virion |
| 0.4 | 7.1 | REACTOME INTEGRATION OF PROVIRUS | Genes involved in Integration of provirus |
| 0.4 | 9.9 | REACTOME FGFR2C LIGAND BINDING AND ACTIVATION | Genes involved in FGFR2c ligand binding and activation |
| 0.4 | 19.5 | REACTOME SIGNALING BY ROBO RECEPTOR | Genes involved in Signaling by Robo receptor |
| 0.4 | 13.3 | REACTOME REGULATION OF IFNA SIGNALING | Genes involved in Regulation of IFNA signaling |
| 0.4 | 13.4 | REACTOME HORMONE SENSITIVE LIPASE HSL MEDIATED TRIACYLGLYCEROL HYDROLYSIS | Genes involved in Hormone-sensitive lipase (HSL)-mediated triacylglycerol hydrolysis |
| 0.4 | 5.5 | REACTOME PURINE CATABOLISM | Genes involved in Purine catabolism |
| 0.4 | 4.7 | REACTOME PASSIVE TRANSPORT BY AQUAPORINS | Genes involved in Passive Transport by Aquaporins |
| 0.3 | 2.1 | REACTOME SIGNALING BY EGFR IN CANCER | Genes involved in Signaling by EGFR in Cancer |
| 0.3 | 2.6 | REACTOME ERKS ARE INACTIVATED | Genes involved in ERKs are inactivated |
| 0.3 | 5.6 | REACTOME TGF BETA RECEPTOR SIGNALING IN EMT EPITHELIAL TO MESENCHYMAL TRANSITION | Genes involved in TGF-beta receptor signaling in EMT (epithelial to mesenchymal transition) |
| 0.3 | 5.5 | REACTOME NRIF SIGNALS CELL DEATH FROM THE NUCLEUS | Genes involved in NRIF signals cell death from the nucleus |
| 0.3 | 6.3 | REACTOME PRESYNAPTIC NICOTINIC ACETYLCHOLINE RECEPTORS | Genes involved in Presynaptic nicotinic acetylcholine receptors |
| 0.3 | 15.0 | REACTOME VOLTAGE GATED POTASSIUM CHANNELS | Genes involved in Voltage gated Potassium channels |
| 0.3 | 23.7 | REACTOME OLFACTORY SIGNALING PATHWAY | Genes involved in Olfactory Signaling Pathway |
| 0.3 | 7.9 | REACTOME SPHINGOLIPID DE NOVO BIOSYNTHESIS | Genes involved in Sphingolipid de novo biosynthesis |
| 0.2 | 6.0 | REACTOME REGULATION OF INSULIN LIKE GROWTH FACTOR IGF ACTIVITY BY INSULIN LIKE GROWTH FACTOR BINDING PROTEINS IGFBPS | Genes involved in Regulation of Insulin-like Growth Factor (IGF) Activity by Insulin-like Growth Factor Binding Proteins (IGFBPs) |
| 0.2 | 6.7 | REACTOME BRANCHED CHAIN AMINO ACID CATABOLISM | Genes involved in Branched-chain amino acid catabolism |
| 0.2 | 11.4 | REACTOME MYOGENESIS | Genes involved in Myogenesis |
| 0.2 | 3.1 | REACTOME ABC FAMILY PROTEINS MEDIATED TRANSPORT | Genes involved in ABC-family proteins mediated transport |
| 0.2 | 39.0 | REACTOME PEPTIDE LIGAND BINDING RECEPTORS | Genes involved in Peptide ligand-binding receptors |
| 0.2 | 3.3 | REACTOME GAP JUNCTION ASSEMBLY | Genes involved in Gap junction assembly |
| 0.2 | 2.2 | REACTOME TRANSLOCATION OF ZAP 70 TO IMMUNOLOGICAL SYNAPSE | Genes involved in Translocation of ZAP-70 to Immunological synapse |
| 0.2 | 7.0 | REACTOME INWARDLY RECTIFYING K CHANNELS | Genes involved in Inwardly rectifying K+ channels |
| 0.2 | 3.2 | REACTOME CLASS C 3 METABOTROPIC GLUTAMATE PHEROMONE RECEPTORS | Genes involved in Class C/3 (Metabotropic glutamate/pheromone receptors) |
| 0.2 | 4.2 | REACTOME CITRIC ACID CYCLE TCA CYCLE | Genes involved in Citric acid cycle (TCA cycle) |
| 0.2 | 12.1 | REACTOME NCAM1 INTERACTIONS | Genes involved in NCAM1 interactions |
| 0.2 | 1.4 | REACTOME ANDROGEN BIOSYNTHESIS | Genes involved in Androgen biosynthesis |
| 0.2 | 4.1 | REACTOME BIOSYNTHESIS OF THE N GLYCAN PRECURSOR DOLICHOL LIPID LINKED OLIGOSACCHARIDE LLO AND TRANSFER TO A NASCENT PROTEIN | Genes involved in Biosynthesis of the N-glycan precursor (dolichol lipid-linked oligosaccharide, LLO) and transfer to a nascent protein |
| 0.2 | 5.3 | REACTOME IONOTROPIC ACTIVITY OF KAINATE RECEPTORS | Genes involved in Ionotropic activity of Kainate Receptors |
| 0.1 | 2.1 | REACTOME SPRY REGULATION OF FGF SIGNALING | Genes involved in Spry regulation of FGF signaling |
| 0.1 | 2.5 | REACTOME HDL MEDIATED LIPID TRANSPORT | Genes involved in HDL-mediated lipid transport |
| 0.1 | 2.0 | REACTOME SEROTONIN RECEPTORS | Genes involved in Serotonin receptors |
| 0.1 | 13.7 | REACTOME P75 NTR RECEPTOR MEDIATED SIGNALLING | Genes involved in p75 NTR receptor-mediated signalling |
| 0.1 | 3.1 | REACTOME SIGNALING BY CONSTITUTIVELY ACTIVE EGFR | Genes involved in Signaling by constitutively active EGFR |
| 0.1 | 6.2 | REACTOME SMOOTH MUSCLE CONTRACTION | Genes involved in Smooth Muscle Contraction |
| 0.1 | 1.3 | REACTOME INHIBITION OF REPLICATION INITIATION OF DAMAGED DNA BY RB1 E2F1 | Genes involved in Inhibition of replication initiation of damaged DNA by RB1/E2F1 |
| 0.1 | 9.2 | REACTOME ACTIVATION OF CHAPERONE GENES BY XBP1S | Genes involved in Activation of Chaperone Genes by XBP1(S) |
| 0.1 | 11.6 | REACTOME IMMUNOREGULATORY INTERACTIONS BETWEEN A LYMPHOID AND A NON LYMPHOID CELL | Genes involved in Immunoregulatory interactions between a Lymphoid and a non-Lymphoid cell |
| 0.1 | 14.1 | REACTOME SIGNALING BY RHO GTPASES | Genes involved in Signaling by Rho GTPases |
| 0.1 | 3.8 | REACTOME GABA A RECEPTOR ACTIVATION | Genes involved in GABA A receptor activation |
| 0.1 | 2.1 | REACTOME LIPID DIGESTION MOBILIZATION AND TRANSPORT | Genes involved in Lipid digestion, mobilization, and transport |
| 0.1 | 11.8 | REACTOME CLASS B 2 SECRETIN FAMILY RECEPTORS | Genes involved in Class B/2 (Secretin family receptors) |
| 0.1 | 2.6 | REACTOME OTHER SEMAPHORIN INTERACTIONS | Genes involved in Other semaphorin interactions |
| 0.1 | 3.3 | REACTOME G0 AND EARLY G1 | Genes involved in G0 and Early G1 |
| 0.1 | 0.7 | REACTOME HYALURONAN UPTAKE AND DEGRADATION | Genes involved in Hyaluronan uptake and degradation |
| 0.1 | 3.7 | REACTOME AMYLOIDS | Genes involved in Amyloids |
| 0.1 | 9.1 | REACTOME G ALPHA I SIGNALLING EVENTS | Genes involved in G alpha (i) signalling events |
| 0.1 | 1.6 | REACTOME CYTOSOLIC SULFONATION OF SMALL MOLECULES | Genes involved in Cytosolic sulfonation of small molecules |
| 0.1 | 2.1 | REACTOME FORMATION OF INCISION COMPLEX IN GG NER | Genes involved in Formation of incision complex in GG-NER |
| 0.1 | 0.2 | REACTOME GENERATION OF SECOND MESSENGER MOLECULES | Genes involved in Generation of second messenger molecules |
| 0.1 | 3.2 | REACTOME TIGHT JUNCTION INTERACTIONS | Genes involved in Tight junction interactions |
| 0.1 | 2.9 | REACTOME DEADENYLATION OF MRNA | Genes involved in Deadenylation of mRNA |
| 0.1 | 1.4 | REACTOME DARPP 32 EVENTS | Genes involved in DARPP-32 events |
| 0.1 | 2.7 | REACTOME DEGRADATION OF THE EXTRACELLULAR MATRIX | Genes involved in Degradation of the extracellular matrix |
| 0.1 | 1.0 | REACTOME TRAFFICKING AND PROCESSING OF ENDOSOMAL TLR | Genes involved in Trafficking and processing of endosomal TLR |
| 0.1 | 0.5 | REACTOME TRYPTOPHAN CATABOLISM | Genes involved in Tryptophan catabolism |
| 0.1 | 2.6 | REACTOME RNA POL I TRANSCRIPTION INITIATION | Genes involved in RNA Polymerase I Transcription Initiation |
| 0.1 | 0.8 | REACTOME GLYCOPROTEIN HORMONES | Genes involved in Glycoprotein hormones |
| 0.1 | 5.1 | REACTOME REGULATION OF INSULIN SECRETION | Genes involved in Regulation of Insulin Secretion |
| 0.1 | 7.2 | REACTOME RESPONSE TO ELEVATED PLATELET CYTOSOLIC CA2 | Genes involved in Response to elevated platelet cytosolic Ca2+ |
| 0.1 | 8.2 | REACTOME FACTORS INVOLVED IN MEGAKARYOCYTE DEVELOPMENT AND PLATELET PRODUCTION | Genes involved in Factors involved in megakaryocyte development and platelet production |
| 0.1 | 1.0 | REACTOME N GLYCAN ANTENNAE ELONGATION IN THE MEDIAL TRANS GOLGI | Genes involved in N-glycan antennae elongation in the medial/trans-Golgi |
| 0.1 | 2.6 | REACTOME IRON UPTAKE AND TRANSPORT | Genes involved in Iron uptake and transport |
| 0.1 | 1.3 | REACTOME TERMINATION OF O GLYCAN BIOSYNTHESIS | Genes involved in Termination of O-glycan biosynthesis |
| 0.1 | 0.4 | REACTOME PLATELET ADHESION TO EXPOSED COLLAGEN | Genes involved in Platelet Adhesion to exposed collagen |
| 0.1 | 0.6 | REACTOME G BETA GAMMA SIGNALLING THROUGH PI3KGAMMA | Genes involved in G beta:gamma signalling through PI3Kgamma |
| 0.0 | 0.9 | REACTOME SIGNALING BY SCF KIT | Genes involved in Signaling by SCF-KIT |
| 0.0 | 0.9 | REACTOME FACILITATIVE NA INDEPENDENT GLUCOSE TRANSPORTERS | Genes involved in Facilitative Na+-independent glucose transporters |
| 0.0 | 0.5 | REACTOME RETROGRADE NEUROTROPHIN SIGNALLING | Genes involved in Retrograde neurotrophin signalling |
| 0.0 | 1.7 | REACTOME STRIATED MUSCLE CONTRACTION | Genes involved in Striated Muscle Contraction |
| 0.0 | 1.3 | REACTOME NOTCH1 INTRACELLULAR DOMAIN REGULATES TRANSCRIPTION | Genes involved in NOTCH1 Intracellular Domain Regulates Transcription |
| 0.0 | 1.5 | REACTOME CELL SURFACE INTERACTIONS AT THE VASCULAR WALL | Genes involved in Cell surface interactions at the vascular wall |
| 0.0 | 1.5 | REACTOME NUCLEAR SIGNALING BY ERBB4 | Genes involved in Nuclear signaling by ERBB4 |
| 0.0 | 0.6 | REACTOME TRAFFICKING OF AMPA RECEPTORS | Genes involved in Trafficking of AMPA receptors |
| 0.0 | 0.9 | REACTOME MEIOTIC SYNAPSIS | Genes involved in Meiotic Synapsis |
| 0.0 | 1.2 | REACTOME TRANSPORT OF INORGANIC CATIONS ANIONS AND AMINO ACIDS OLIGOPEPTIDES | Genes involved in Transport of inorganic cations/anions and amino acids/oligopeptides |
| 0.0 | 1.2 | REACTOME NUCLEAR RECEPTOR TRANSCRIPTION PATHWAY | Genes involved in Nuclear Receptor transcription pathway |
| 0.0 | 0.6 | REACTOME CGMP EFFECTS | Genes involved in cGMP effects |
| 0.0 | 0.2 | REACTOME G1 PHASE | Genes involved in G1 Phase |