Project
GNF SymAtlas + NCI-60 cancer cell lines, human (Su, 2004; Ross, 2000)
Navigation
Downloads
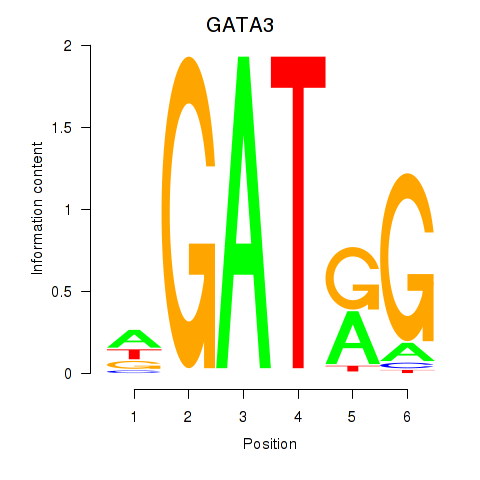
Results for GATA3
Z-value: 1.57
Motif logo
Transcription factors associated with GATA3
| Gene Symbol | Gene ID | Gene Info |
|---|---|---|
|
GATA3
|
ENSG00000107485.18 | GATA3 |
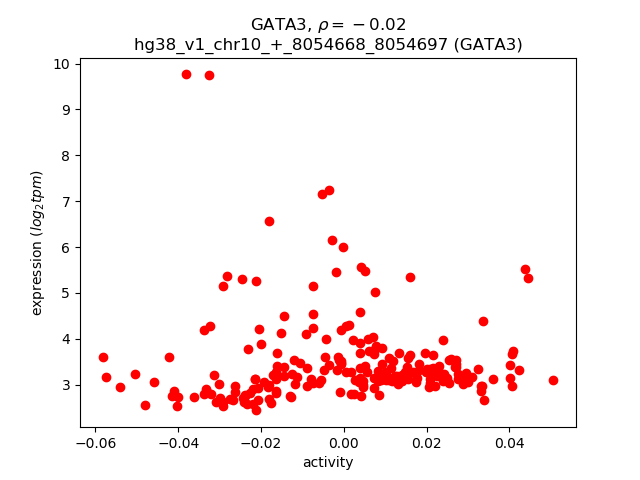
Activity-expression correlation:
| Gene | Promoter | Pearson corr. coef. | P-value | Plot |
|---|---|---|---|---|
| GATA3 | hg38_v1_chr10_+_8054668_8054697 | -0.02 | 7.2e-01 | Click! |
Activity profile of GATA3 motif
Sorted Z-values of GATA3 motif
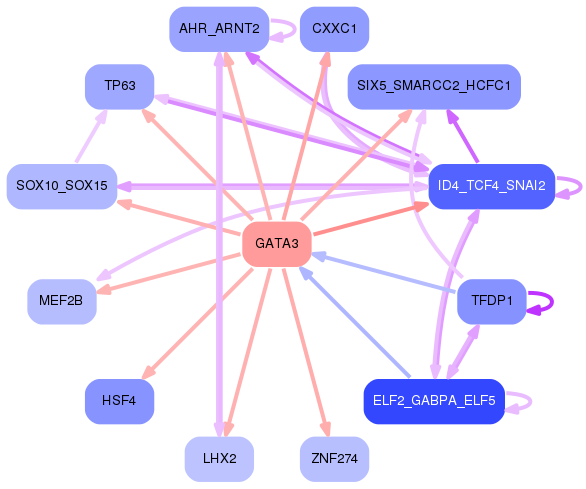
Network of associatons between targets according to the STRING database.

First level regulatory network of GATA3
Gene Ontology Analysis
Gene overrepresentation in biological process category:
| Log-likelihood per target | Total log-likelihood | Term | Description |
|---|---|---|---|
| 8.1 | 24.2 | GO:0006982 | response to lipid hydroperoxide(GO:0006982) |
| 7.9 | 23.7 | GO:1904395 | retinal rod cell differentiation(GO:0060221) positive regulation of skeletal muscle acetylcholine-gated channel clustering(GO:1904395) negative regulation of neuromuscular junction development(GO:1904397) |
| 7.8 | 38.9 | GO:1902847 | regulation of neuronal signal transduction(GO:1902847) positive regulation of neurofibrillary tangle assembly(GO:1902998) |
| 7.6 | 22.8 | GO:0016185 | synaptic vesicle budding from presynaptic endocytic zone membrane(GO:0016185) |
| 6.3 | 25.1 | GO:0090301 | fibroblast growth factor receptor signaling pathway involved in neural plate anterior/posterior pattern formation(GO:0060825) regulation of neural crest formation(GO:0090299) negative regulation of neural crest formation(GO:0090301) regulation of fibroblast growth factor receptor signaling pathway involved in neural plate anterior/posterior pattern formation(GO:2000313) negative regulation of fibroblast growth factor receptor signaling pathway involved in neural plate anterior/posterior pattern formation(GO:2000314) |
| 6.1 | 18.3 | GO:0001869 | regulation of complement activation, lectin pathway(GO:0001868) negative regulation of complement activation, lectin pathway(GO:0001869) |
| 5.9 | 23.7 | GO:0033693 | neurofilament bundle assembly(GO:0033693) |
| 5.3 | 15.9 | GO:0042137 | sequestering of neurotransmitter(GO:0042137) |
| 5.2 | 67.6 | GO:1900747 | negative regulation of vascular endothelial growth factor signaling pathway(GO:1900747) |
| 4.6 | 18.5 | GO:0099558 | maintenance of synapse structure(GO:0099558) |
| 4.5 | 13.4 | GO:0051939 | gamma-aminobutyric acid import(GO:0051939) |
| 4.5 | 13.4 | GO:0030185 | nitric oxide transport(GO:0030185) |
| 4.3 | 12.9 | GO:2000097 | regulation of smooth muscle cell-matrix adhesion(GO:2000097) |
| 4.2 | 12.6 | GO:0042412 | taurine biosynthetic process(GO:0042412) |
| 4.0 | 12.1 | GO:0098746 | fast, calcium ion-dependent exocytosis of neurotransmitter(GO:0098746) |
| 3.9 | 19.4 | GO:1990262 | regulation of anti-Mullerian hormone signaling pathway(GO:1902612) negative regulation of anti-Mullerian hormone signaling pathway(GO:1902613) anti-Mullerian hormone signaling pathway(GO:1990262) |
| 3.7 | 18.7 | GO:1904209 | regulation of chemokine (C-C motif) ligand 2 secretion(GO:1904207) positive regulation of chemokine (C-C motif) ligand 2 secretion(GO:1904209) |
| 3.7 | 11.1 | GO:0051946 | regulation of amino acid uptake involved in synaptic transmission(GO:0051941) regulation of glutamate uptake involved in transmission of nerve impulse(GO:0051946) regulation of L-glutamate import(GO:1900920) |
| 3.7 | 14.7 | GO:0010645 | regulation of cell communication by chemical coupling(GO:0010645) positive regulation of cell communication by chemical coupling(GO:0010652) |
| 3.6 | 14.3 | GO:0071418 | cellular response to amine stimulus(GO:0071418) |
| 3.6 | 14.3 | GO:0050758 | thymidylate synthase biosynthetic process(GO:0050757) regulation of thymidylate synthase biosynthetic process(GO:0050758) |
| 3.5 | 14.2 | GO:0018231 | peptidyl-L-cysteine S-palmitoylation(GO:0018230) peptidyl-S-diacylglycerol-L-cysteine biosynthetic process from peptidyl-cysteine(GO:0018231) |
| 3.5 | 14.1 | GO:1904020 | regulation of G-protein coupled receptor internalization(GO:1904020) negative regulation of G-protein coupled receptor internalization(GO:1904021) |
| 3.5 | 10.5 | GO:0019046 | release from viral latency(GO:0019046) |
| 3.5 | 13.9 | GO:0003330 | regulation of extracellular matrix constituent secretion(GO:0003330) positive regulation of extracellular matrix constituent secretion(GO:0003331) |
| 3.4 | 41.1 | GO:0060371 | regulation of atrial cardiac muscle cell membrane depolarization(GO:0060371) |
| 3.4 | 40.8 | GO:0051612 | negative regulation of neurotransmitter uptake(GO:0051581) regulation of serotonin uptake(GO:0051611) negative regulation of serotonin uptake(GO:0051612) |
| 3.2 | 22.7 | GO:1900736 | regulation of phospholipase C-activating G-protein coupled receptor signaling pathway(GO:1900736) |
| 3.2 | 9.6 | GO:0072275 | metanephric glomerulus morphogenesis(GO:0072275) metanephric glomerulus vasculature morphogenesis(GO:0072276) metanephric glomerular capillary formation(GO:0072277) |
| 3.2 | 16.1 | GO:0007412 | axon target recognition(GO:0007412) |
| 3.2 | 22.2 | GO:0034587 | piRNA metabolic process(GO:0034587) |
| 3.1 | 6.2 | GO:1900166 | glial cell-derived neurotrophic factor secretion(GO:0044467) regulation of glial cell-derived neurotrophic factor secretion(GO:1900166) positive regulation of glial cell-derived neurotrophic factor secretion(GO:1900168) |
| 3.0 | 9.0 | GO:0035759 | mesangial cell-matrix adhesion(GO:0035759) |
| 2.9 | 32.4 | GO:2000427 | positive regulation of apoptotic cell clearance(GO:2000427) |
| 2.9 | 8.8 | GO:0002884 | negative regulation of hypersensitivity(GO:0002884) |
| 2.9 | 49.5 | GO:0007021 | tubulin complex assembly(GO:0007021) |
| 2.9 | 8.6 | GO:0097477 | spinal cord motor neuron migration(GO:0097476) lateral motor column neuron migration(GO:0097477) |
| 2.9 | 11.5 | GO:0010900 | negative regulation of phosphatidylcholine catabolic process(GO:0010900) |
| 2.8 | 14.2 | GO:1901911 | diadenosine polyphosphate catabolic process(GO:0015961) diphosphoinositol polyphosphate metabolic process(GO:0071543) diadenosine pentaphosphate metabolic process(GO:1901906) diadenosine pentaphosphate catabolic process(GO:1901907) diadenosine hexaphosphate metabolic process(GO:1901908) diadenosine hexaphosphate catabolic process(GO:1901909) adenosine 5'-(hexahydrogen pentaphosphate) metabolic process(GO:1901910) adenosine 5'-(hexahydrogen pentaphosphate) catabolic process(GO:1901911) |
| 2.8 | 5.6 | GO:0044333 | Wnt signaling pathway involved in digestive tract morphogenesis(GO:0044333) |
| 2.7 | 30.0 | GO:0097116 | gephyrin clustering involved in postsynaptic density assembly(GO:0097116) |
| 2.5 | 335.7 | GO:0006958 | complement activation, classical pathway(GO:0006958) |
| 2.5 | 22.4 | GO:1902902 | negative regulation of autophagosome assembly(GO:1902902) |
| 2.4 | 11.9 | GO:0050861 | positive regulation of B cell receptor signaling pathway(GO:0050861) |
| 2.4 | 9.5 | GO:1902283 | negative regulation of primary amine oxidase activity(GO:1902283) |
| 2.3 | 2.3 | GO:1904970 | brush border assembly(GO:1904970) |
| 2.3 | 16.2 | GO:0070560 | protein secretion by platelet(GO:0070560) |
| 2.3 | 7.0 | GO:0008065 | establishment of blood-nerve barrier(GO:0008065) |
| 2.3 | 23.1 | GO:0006537 | glutamate biosynthetic process(GO:0006537) |
| 2.3 | 6.9 | GO:1905246 | regulation of choline O-acetyltransferase activity(GO:1902769) positive regulation of choline O-acetyltransferase activity(GO:1902771) negative regulation of tau-protein kinase activity(GO:1902948) positive regulation of early endosome to recycling endosome transport(GO:1902955) negative regulation of aspartic-type endopeptidase activity involved in amyloid precursor protein catabolic process(GO:1902960) regulation of neurofibrillary tangle assembly(GO:1902996) negative regulation of neurofibrillary tangle assembly(GO:1902997) negative regulation of aspartic-type peptidase activity(GO:1905246) |
| 2.3 | 6.9 | GO:0009720 | detection of hormone stimulus(GO:0009720) |
| 2.3 | 20.6 | GO:0002175 | protein localization to paranode region of axon(GO:0002175) |
| 2.3 | 6.9 | GO:0019075 | virus maturation(GO:0019075) |
| 2.2 | 13.4 | GO:0060313 | negative regulation of blood vessel remodeling(GO:0060313) |
| 2.2 | 6.6 | GO:0044828 | negative regulation by host of viral genome replication(GO:0044828) |
| 2.2 | 15.2 | GO:0051388 | positive regulation of neurotrophin TRK receptor signaling pathway(GO:0051388) |
| 2.2 | 6.5 | GO:2000296 | negative regulation of hydrogen peroxide catabolic process(GO:2000296) |
| 2.1 | 36.3 | GO:0090361 | platelet-derived growth factor production(GO:0090360) regulation of platelet-derived growth factor production(GO:0090361) |
| 2.1 | 17.0 | GO:0098814 | spontaneous neurotransmitter secretion(GO:0061669) spontaneous synaptic transmission(GO:0098814) |
| 2.1 | 2.1 | GO:0061517 | macrophage proliferation(GO:0061517) microglial cell proliferation(GO:0061518) |
| 2.1 | 42.1 | GO:0019371 | cyclooxygenase pathway(GO:0019371) |
| 2.1 | 20.9 | GO:0098870 | neuronal action potential propagation(GO:0019227) action potential propagation(GO:0098870) |
| 2.1 | 8.3 | GO:0046113 | nucleobase catabolic process(GO:0046113) |
| 2.1 | 6.2 | GO:0036292 | DNA rewinding(GO:0036292) |
| 2.0 | 8.2 | GO:2000173 | negative regulation of dendrite extension(GO:1903860) regulation of neuron remodeling(GO:1904799) negative regulation of neuron remodeling(GO:1904800) negative regulation of branching morphogenesis of a nerve(GO:2000173) |
| 2.0 | 8.2 | GO:0002370 | natural killer cell cytokine production(GO:0002370) regulation of natural killer cell cytokine production(GO:0002727) |
| 2.0 | 2.0 | GO:0051610 | negative regulation of synaptic transmission, dopaminergic(GO:0032227) serotonin uptake(GO:0051610) |
| 2.0 | 10.0 | GO:0002386 | immune response in mucosal-associated lymphoid tissue(GO:0002386) |
| 2.0 | 8.0 | GO:1903070 | negative regulation of ER-associated ubiquitin-dependent protein catabolic process(GO:1903070) |
| 2.0 | 7.9 | GO:0007499 | ectoderm and mesoderm interaction(GO:0007499) |
| 1.9 | 53.8 | GO:0032012 | regulation of ARF protein signal transduction(GO:0032012) |
| 1.9 | 5.7 | GO:0072312 | metanephric glomerular epithelium development(GO:0072244) metanephric glomerular visceral epithelial cell differentiation(GO:0072248) metanephric glomerular visceral epithelial cell development(GO:0072249) metanephric glomerular epithelial cell differentiation(GO:0072312) metanephric glomerular epithelial cell development(GO:0072313) |
| 1.9 | 5.7 | GO:0034085 | establishment of sister chromatid cohesion(GO:0034085) cohesin loading(GO:0071921) regulation of cohesin loading(GO:0071922) |
| 1.9 | 5.7 | GO:0021678 | fourth ventricle development(GO:0021592) third ventricle development(GO:0021678) |
| 1.9 | 7.5 | GO:0031117 | positive regulation of microtubule depolymerization(GO:0031117) |
| 1.9 | 11.3 | GO:1900004 | negative regulation of serine-type endopeptidase activity(GO:1900004) negative regulation of serine-type peptidase activity(GO:1902572) |
| 1.9 | 1.9 | GO:1902949 | positive regulation of tau-protein kinase activity(GO:1902949) |
| 1.9 | 3.7 | GO:1903348 | positive regulation of bicellular tight junction assembly(GO:1903348) |
| 1.8 | 7.3 | GO:0036159 | inner dynein arm assembly(GO:0036159) |
| 1.8 | 5.4 | GO:0071393 | cellular response to progesterone stimulus(GO:0071393) |
| 1.8 | 9.0 | GO:1903385 | regulation of homophilic cell adhesion(GO:1903385) |
| 1.8 | 5.4 | GO:1902988 | neurofibrillary tangle assembly(GO:1902988) |
| 1.8 | 5.3 | GO:0099526 | presynaptic signal transduction(GO:0098928) presynapse to nucleus signaling pathway(GO:0099526) |
| 1.8 | 7.1 | GO:0006663 | platelet activating factor biosynthetic process(GO:0006663) |
| 1.8 | 3.5 | GO:0035469 | determination of pancreatic left/right asymmetry(GO:0035469) |
| 1.8 | 8.8 | GO:1903935 | response to sodium arsenite(GO:1903935) cellular response to sodium arsenite(GO:1903936) |
| 1.7 | 1.7 | GO:0021530 | spinal cord oligodendrocyte cell differentiation(GO:0021529) spinal cord oligodendrocyte cell fate specification(GO:0021530) oligodendrocyte cell fate specification(GO:0021778) oligodendrocyte cell fate commitment(GO:0021779) glial cell fate specification(GO:0021780) |
| 1.7 | 5.2 | GO:0060392 | negative regulation of SMAD protein import into nucleus(GO:0060392) |
| 1.7 | 5.2 | GO:0045897 | positive regulation of transcription during mitosis(GO:0045897) |
| 1.7 | 12.0 | GO:2000324 | positive regulation of glucocorticoid receptor signaling pathway(GO:2000324) |
| 1.7 | 1.7 | GO:0070100 | negative regulation of chemokine-mediated signaling pathway(GO:0070100) |
| 1.7 | 23.2 | GO:0032291 | central nervous system myelination(GO:0022010) axon ensheathment in central nervous system(GO:0032291) |
| 1.7 | 8.3 | GO:0001555 | oocyte growth(GO:0001555) |
| 1.6 | 14.7 | GO:1901552 | positive regulation of endothelial cell development(GO:1901552) positive regulation of establishment of endothelial barrier(GO:1903142) |
| 1.6 | 3.1 | GO:1900425 | negative regulation of defense response to bacterium(GO:1900425) |
| 1.6 | 6.2 | GO:2000297 | negative regulation of synapse maturation(GO:2000297) |
| 1.6 | 12.4 | GO:0052405 | negative regulation by host of symbiont molecular function(GO:0052405) |
| 1.5 | 4.6 | GO:1905053 | regulation of base-excision repair(GO:1905051) positive regulation of base-excision repair(GO:1905053) |
| 1.5 | 12.2 | GO:0001887 | selenium compound metabolic process(GO:0001887) |
| 1.5 | 9.1 | GO:1903587 | regulation of blood vessel endothelial cell proliferation involved in sprouting angiogenesis(GO:1903587) |
| 1.5 | 52.5 | GO:0048791 | calcium ion-regulated exocytosis of neurotransmitter(GO:0048791) |
| 1.5 | 10.4 | GO:0060770 | negative regulation of epithelial cell proliferation involved in prostate gland development(GO:0060770) |
| 1.5 | 4.4 | GO:0045110 | intermediate filament bundle assembly(GO:0045110) |
| 1.5 | 14.7 | GO:0071786 | endoplasmic reticulum tubular network organization(GO:0071786) |
| 1.5 | 4.4 | GO:0035822 | meiotic gene conversion(GO:0006311) gene conversion(GO:0035822) |
| 1.5 | 5.8 | GO:0051866 | general adaptation syndrome(GO:0051866) |
| 1.5 | 2.9 | GO:0002215 | defense response to nematode(GO:0002215) |
| 1.5 | 7.3 | GO:0036072 | intramembranous ossification(GO:0001957) direct ossification(GO:0036072) |
| 1.4 | 14.5 | GO:0042985 | negative regulation of amyloid precursor protein biosynthetic process(GO:0042985) |
| 1.4 | 10.0 | GO:0032100 | positive regulation of response to food(GO:0032097) positive regulation of appetite(GO:0032100) |
| 1.4 | 15.8 | GO:0006030 | chitin metabolic process(GO:0006030) chitin catabolic process(GO:0006032) |
| 1.4 | 4.3 | GO:0052047 | interaction with other organism via secreted substance involved in symbiotic interaction(GO:0052047) |
| 1.4 | 7.1 | GO:1904304 | regulation of gastro-intestinal system smooth muscle contraction(GO:1904304) positive regulation of gastro-intestinal system smooth muscle contraction(GO:1904306) |
| 1.4 | 12.7 | GO:0060075 | regulation of resting membrane potential(GO:0060075) |
| 1.4 | 5.6 | GO:1903423 | regulation of synaptic vesicle endocytosis(GO:1900242) positive regulation of synaptic vesicle endocytosis(GO:1900244) positive regulation of synaptic vesicle recycling(GO:1903423) |
| 1.4 | 9.7 | GO:0045007 | depurination(GO:0045007) |
| 1.4 | 9.6 | GO:0099612 | protein localization to axon(GO:0099612) |
| 1.4 | 5.5 | GO:0021759 | globus pallidus development(GO:0021759) |
| 1.4 | 16.5 | GO:0051967 | negative regulation of synaptic transmission, glutamatergic(GO:0051967) |
| 1.4 | 23.3 | GO:1903830 | magnesium ion transmembrane transport(GO:1903830) |
| 1.4 | 4.1 | GO:2000661 | positive regulation of interleukin-1-mediated signaling pathway(GO:2000661) |
| 1.3 | 4.0 | GO:1904616 | regulation of actin filament binding(GO:1904529) regulation of actin binding(GO:1904616) |
| 1.3 | 5.3 | GO:0038170 | somatostatin receptor signaling pathway(GO:0038169) somatostatin signaling pathway(GO:0038170) |
| 1.3 | 6.6 | GO:0038016 | insulin receptor internalization(GO:0038016) |
| 1.3 | 4.0 | GO:0061588 | calcium activated phospholipid scrambling(GO:0061588) calcium activated phosphatidylcholine scrambling(GO:0061590) calcium activated galactosylceramide scrambling(GO:0061591) |
| 1.3 | 5.3 | GO:0005986 | sucrose biosynthetic process(GO:0005986) |
| 1.3 | 3.9 | GO:0086097 | phospholipase C-activating angiotensin-activated signaling pathway(GO:0086097) |
| 1.3 | 34.9 | GO:0071420 | cellular response to histamine(GO:0071420) |
| 1.3 | 3.9 | GO:0035441 | cell migration involved in vasculogenesis(GO:0035441) |
| 1.3 | 5.1 | GO:0031580 | membrane raft polarization(GO:0001766) membrane raft distribution(GO:0031580) |
| 1.3 | 12.7 | GO:0036309 | protein localization to M-band(GO:0036309) protein localization to T-tubule(GO:0036371) |
| 1.3 | 3.8 | GO:0071140 | resolution of recombination intermediates(GO:0071139) resolution of mitotic recombination intermediates(GO:0071140) |
| 1.3 | 1.3 | GO:1903690 | negative regulation of wound healing, spreading of epidermal cells(GO:1903690) |
| 1.3 | 3.8 | GO:0015888 | thiamine transport(GO:0015888) thiamine transmembrane transport(GO:0071934) |
| 1.2 | 3.7 | GO:0010847 | regulation of chromatin assembly(GO:0010847) |
| 1.2 | 3.7 | GO:0045645 | regulation of eosinophil differentiation(GO:0045643) positive regulation of eosinophil differentiation(GO:0045645) |
| 1.2 | 8.7 | GO:0006940 | regulation of smooth muscle contraction(GO:0006940) |
| 1.2 | 5.0 | GO:0052251 | induction by symbiont of host defense response(GO:0044416) induction of host immune response by virus(GO:0046730) active induction of host immune response by virus(GO:0046732) modulation by symbiont of host defense response(GO:0052031) induction by organism of defense response of other organism involved in symbiotic interaction(GO:0052251) modulation by organism of defense response of other organism involved in symbiotic interaction(GO:0052255) positive regulation by symbiont of host defense response(GO:0052509) positive regulation by organism of defense response of other organism involved in symbiotic interaction(GO:0052510) modulation by organism of immune response of other organism involved in symbiotic interaction(GO:0052552) modulation by symbiont of host immune response(GO:0052553) modulation by virus of host immune response(GO:0075528) |
| 1.2 | 4.9 | GO:0070940 | dephosphorylation of RNA polymerase II C-terminal domain(GO:0070940) |
| 1.2 | 4.9 | GO:2000638 | regulation of SREBP signaling pathway(GO:2000638) negative regulation of SREBP signaling pathway(GO:2000639) |
| 1.2 | 12.2 | GO:0033227 | dsRNA transport(GO:0033227) |
| 1.2 | 18.1 | GO:0070445 | oligodendrocyte progenitor proliferation(GO:0070444) regulation of oligodendrocyte progenitor proliferation(GO:0070445) |
| 1.2 | 13.3 | GO:0048003 | antigen processing and presentation of lipid antigen via MHC class Ib(GO:0048003) antigen processing and presentation, exogenous lipid antigen via MHC class Ib(GO:0048007) |
| 1.2 | 6.0 | GO:0010814 | substance P catabolic process(GO:0010814) calcitonin catabolic process(GO:0010816) endothelin maturation(GO:0034959) |
| 1.2 | 12.1 | GO:0042373 | vitamin K metabolic process(GO:0042373) |
| 1.2 | 10.8 | GO:2000124 | regulation of endocannabinoid signaling pathway(GO:2000124) |
| 1.2 | 3.6 | GO:0098758 | response to interleukin-8(GO:0098758) cellular response to interleukin-8(GO:0098759) |
| 1.2 | 5.9 | GO:0071442 | positive regulation of histone H3-K14 acetylation(GO:0071442) regulation of stem cell division(GO:2000035) |
| 1.2 | 5.9 | GO:0030311 | poly-N-acetyllactosamine metabolic process(GO:0030309) poly-N-acetyllactosamine biosynthetic process(GO:0030311) |
| 1.2 | 8.2 | GO:0061370 | testosterone biosynthetic process(GO:0061370) |
| 1.2 | 12.9 | GO:0060137 | maternal process involved in parturition(GO:0060137) |
| 1.2 | 8.1 | GO:0010961 | cellular magnesium ion homeostasis(GO:0010961) |
| 1.1 | 2.3 | GO:0050802 | circadian sleep/wake cycle, sleep(GO:0050802) |
| 1.1 | 5.7 | GO:0047484 | regulation of response to osmotic stress(GO:0047484) |
| 1.1 | 5.7 | GO:0045906 | negative regulation of vasoconstriction(GO:0045906) |
| 1.1 | 6.8 | GO:0033274 | response to vitamin B2(GO:0033274) heterochromatin maintenance(GO:0070829) |
| 1.1 | 3.4 | GO:1903487 | regulation of lactation(GO:1903487) |
| 1.1 | 1.1 | GO:0019532 | oxalate transport(GO:0019532) |
| 1.1 | 4.5 | GO:0030035 | microspike assembly(GO:0030035) |
| 1.1 | 3.4 | GO:0002503 | peptide antigen assembly with MHC class II protein complex(GO:0002503) |
| 1.1 | 3.3 | GO:0032849 | regulation of cellular pH reduction(GO:0032847) positive regulation of cellular pH reduction(GO:0032849) |
| 1.1 | 4.4 | GO:0002329 | pre-B cell differentiation(GO:0002329) pre-B cell allelic exclusion(GO:0002331) |
| 1.1 | 19.9 | GO:0015671 | oxygen transport(GO:0015671) |
| 1.1 | 1.1 | GO:0046668 | regulation of retinal cell programmed cell death(GO:0046668) |
| 1.1 | 4.4 | GO:0038108 | negative regulation of appetite by leptin-mediated signaling pathway(GO:0038108) |
| 1.1 | 6.6 | GO:0003011 | involuntary skeletal muscle contraction(GO:0003011) |
| 1.1 | 2.2 | GO:0036123 | histone H3-K9 dimethylation(GO:0036123) |
| 1.1 | 10.8 | GO:0006957 | complement activation, alternative pathway(GO:0006957) |
| 1.1 | 4.3 | GO:0099590 | neurotransmitter receptor internalization(GO:0099590) |
| 1.1 | 13.0 | GO:0043031 | negative regulation of macrophage activation(GO:0043031) |
| 1.1 | 3.2 | GO:0003245 | cardiac muscle tissue growth involved in heart morphogenesis(GO:0003245) |
| 1.1 | 6.4 | GO:0002760 | positive regulation of antimicrobial peptide production(GO:0002225) positive regulation of antimicrobial humoral response(GO:0002760) regulation of antimicrobial peptide production(GO:0002784) regulation of antibacterial peptide production(GO:0002786) positive regulation of antibacterial peptide production(GO:0002803) |
| 1.1 | 8.6 | GO:0035524 | proline transmembrane transport(GO:0035524) |
| 1.1 | 1.1 | GO:0002590 | regulation of antigen processing and presentation of peptide antigen via MHC class I(GO:0002589) negative regulation of antigen processing and presentation of peptide antigen via MHC class I(GO:0002590) |
| 1.1 | 17.0 | GO:0036148 | phosphatidylglycerol acyl-chain remodeling(GO:0036148) |
| 1.1 | 5.3 | GO:0003219 | cardiac right ventricle formation(GO:0003219) |
| 1.1 | 6.4 | GO:0051694 | pointed-end actin filament capping(GO:0051694) |
| 1.1 | 1.1 | GO:1900109 | regulation of histone H3-K9 dimethylation(GO:1900109) |
| 1.0 | 5.2 | GO:0033058 | directional locomotion(GO:0033058) |
| 1.0 | 5.2 | GO:0046013 | regulation of T cell homeostatic proliferation(GO:0046013) |
| 1.0 | 14.6 | GO:0036158 | outer dynein arm assembly(GO:0036158) |
| 1.0 | 4.2 | GO:2000569 | T-helper 2 cell activation(GO:0035712) regulation of T-helper 2 cell activation(GO:2000569) positive regulation of T-helper 2 cell activation(GO:2000570) |
| 1.0 | 8.3 | GO:0042905 | 9-cis-retinoic acid biosynthetic process(GO:0042904) 9-cis-retinoic acid metabolic process(GO:0042905) |
| 1.0 | 2.1 | GO:1901624 | negative regulation of lymphocyte chemotaxis(GO:1901624) |
| 1.0 | 5.1 | GO:0042360 | vitamin E metabolic process(GO:0042360) |
| 1.0 | 3.1 | GO:1904692 | positive regulation of type B pancreatic cell proliferation(GO:1904692) |
| 1.0 | 1.0 | GO:0010644 | cell communication by electrical coupling(GO:0010644) |
| 1.0 | 3.0 | GO:0015746 | tricarboxylic acid transport(GO:0006842) citrate transport(GO:0015746) |
| 1.0 | 10.1 | GO:0034058 | endosomal vesicle fusion(GO:0034058) |
| 1.0 | 2.0 | GO:0014063 | negative regulation of serotonin secretion(GO:0014063) |
| 1.0 | 6.0 | GO:0051902 | negative regulation of mitochondrial depolarization(GO:0051902) |
| 1.0 | 8.0 | GO:1903593 | regulation of histamine secretion by mast cell(GO:1903593) |
| 1.0 | 4.0 | GO:0032431 | activation of phospholipase A2 activity(GO:0032431) |
| 1.0 | 2.0 | GO:0030223 | neutrophil differentiation(GO:0030223) |
| 1.0 | 7.0 | GO:0032510 | endosome to lysosome transport via multivesicular body sorting pathway(GO:0032510) |
| 1.0 | 5.9 | GO:1903237 | negative regulation of leukocyte tethering or rolling(GO:1903237) |
| 1.0 | 11.9 | GO:0070779 | D-aspartate transport(GO:0070777) D-aspartate import(GO:0070779) |
| 1.0 | 3.0 | GO:0072144 | mesangial cell development(GO:0072143) glomerular mesangial cell development(GO:0072144) |
| 1.0 | 1.0 | GO:1902548 | negative regulation of cellular response to vascular endothelial growth factor stimulus(GO:1902548) |
| 1.0 | 2.0 | GO:0002339 | B cell selection(GO:0002339) |
| 1.0 | 5.9 | GO:0001661 | conditioned taste aversion(GO:0001661) |
| 1.0 | 3.9 | GO:0097167 | circadian regulation of translation(GO:0097167) |
| 1.0 | 1.0 | GO:1903006 | regulation of protein K63-linked deubiquitination(GO:1903004) positive regulation of protein K63-linked deubiquitination(GO:1903006) |
| 1.0 | 2.9 | GO:0007538 | primary sex determination(GO:0007538) |
| 1.0 | 2.9 | GO:0099404 | negative regulation of maintenance of sister chromatid cohesion(GO:0034092) negative regulation of maintenance of mitotic sister chromatid cohesion(GO:0034183) maintenance of mitotic sister chromatid cohesion, telomeric(GO:0099403) mitotic sister chromatid cohesion, telomeric(GO:0099404) regulation of maintenance of mitotic sister chromatid cohesion, telomeric(GO:1904907) negative regulation of maintenance of mitotic sister chromatid cohesion, telomeric(GO:1904908) |
| 1.0 | 7.6 | GO:0045602 | negative regulation of endothelial cell differentiation(GO:0045602) |
| 0.9 | 5.7 | GO:0035617 | stress granule disassembly(GO:0035617) |
| 0.9 | 5.7 | GO:1901509 | regulation of endothelial tube morphogenesis(GO:1901509) |
| 0.9 | 3.8 | GO:0032290 | peripheral nervous system myelin formation(GO:0032290) |
| 0.9 | 12.3 | GO:0045059 | positive thymic T cell selection(GO:0045059) |
| 0.9 | 12.3 | GO:0097091 | synaptic vesicle clustering(GO:0097091) |
| 0.9 | 3.8 | GO:0002881 | negative regulation of chronic inflammatory response to non-antigenic stimulus(GO:0002881) |
| 0.9 | 2.8 | GO:0090598 | male genitalia morphogenesis(GO:0048808) male anatomical structure morphogenesis(GO:0090598) |
| 0.9 | 1.9 | GO:0035881 | amacrine cell differentiation(GO:0035881) |
| 0.9 | 2.8 | GO:1903281 | regulation of the force of heart contraction by cardiac conduction(GO:0086092) positive regulation of calcium:sodium antiporter activity(GO:1903281) |
| 0.9 | 0.9 | GO:1904844 | response to L-glutamine(GO:1904844) cellular response to L-glutamine(GO:1904845) |
| 0.9 | 5.6 | GO:0002118 | aggressive behavior(GO:0002118) |
| 0.9 | 1.9 | GO:0010587 | miRNA catabolic process(GO:0010587) |
| 0.9 | 14.7 | GO:0033235 | positive regulation of protein sumoylation(GO:0033235) |
| 0.9 | 1.8 | GO:0043449 | cellular alkene metabolic process(GO:0043449) |
| 0.9 | 3.7 | GO:2000346 | negative regulation of hepatocyte proliferation(GO:2000346) |
| 0.9 | 2.8 | GO:1903892 | negative regulation of ATF6-mediated unfolded protein response(GO:1903892) |
| 0.9 | 9.2 | GO:0021633 | optic nerve structural organization(GO:0021633) |
| 0.9 | 2.8 | GO:1990166 | protein localization to site of double-strand break(GO:1990166) |
| 0.9 | 9.2 | GO:2000348 | regulation of CD40 signaling pathway(GO:2000348) |
| 0.9 | 4.6 | GO:0070945 | neutrophil mediated killing of gram-negative bacterium(GO:0070945) |
| 0.9 | 3.7 | GO:0072262 | metanephric glomerular mesangial cell proliferation involved in metanephros development(GO:0072262) |
| 0.9 | 4.6 | GO:0033133 | positive regulation of glucokinase activity(GO:0033133) |
| 0.9 | 0.9 | GO:0046601 | positive regulation of centrosome duplication(GO:0010825) positive regulation of centriole replication(GO:0046601) |
| 0.9 | 1.8 | GO:0021800 | cerebral cortex tangential migration(GO:0021800) |
| 0.9 | 5.4 | GO:0060414 | aorta smooth muscle tissue morphogenesis(GO:0060414) |
| 0.9 | 1.8 | GO:1903413 | cellular response to bile acid(GO:1903413) |
| 0.9 | 7.2 | GO:0001554 | luteolysis(GO:0001554) |
| 0.9 | 10.8 | GO:1900112 | regulation of histone H3-K9 trimethylation(GO:1900112) |
| 0.9 | 2.7 | GO:0032713 | negative regulation of interleukin-4 production(GO:0032713) |
| 0.9 | 8.9 | GO:0097688 | AMPA glutamate receptor clustering(GO:0097113) glutamate receptor clustering(GO:0097688) |
| 0.9 | 2.7 | GO:1900239 | phenotypic switching(GO:0036166) regulation of phenotypic switching(GO:1900239) |
| 0.9 | 3.5 | GO:1902938 | regulation of intracellular calcium activated chloride channel activity(GO:1902938) |
| 0.9 | 3.5 | GO:0050916 | sensory perception of sweet taste(GO:0050916) |
| 0.9 | 12.3 | GO:1900273 | positive regulation of long-term synaptic potentiation(GO:1900273) |
| 0.9 | 2.6 | GO:1903033 | regulation of microtubule plus-end binding(GO:1903031) positive regulation of microtubule plus-end binding(GO:1903033) positive regulation of microtubule binding(GO:1904528) |
| 0.9 | 1.7 | GO:0001300 | chronological cell aging(GO:0001300) |
| 0.9 | 29.4 | GO:0015695 | organic cation transport(GO:0015695) |
| 0.9 | 5.2 | GO:0006540 | glutamate decarboxylation to succinate(GO:0006540) |
| 0.9 | 3.4 | GO:0031443 | fast-twitch skeletal muscle fiber contraction(GO:0031443) |
| 0.9 | 42.7 | GO:0008038 | neuron recognition(GO:0008038) |
| 0.9 | 9.4 | GO:0051344 | negative regulation of cyclic-nucleotide phosphodiesterase activity(GO:0051344) |
| 0.9 | 7.7 | GO:0034983 | peptidyl-lysine deacetylation(GO:0034983) |
| 0.9 | 1.7 | GO:0045085 | negative regulation of interleukin-2 biosynthetic process(GO:0045085) |
| 0.8 | 3.4 | GO:0035106 | operant conditioning(GO:0035106) |
| 0.8 | 5.1 | GO:0031284 | positive regulation of guanylate cyclase activity(GO:0031284) |
| 0.8 | 11.0 | GO:0006554 | lysine catabolic process(GO:0006554) |
| 0.8 | 5.9 | GO:0048280 | vesicle fusion with Golgi apparatus(GO:0048280) |
| 0.8 | 3.4 | GO:0002357 | defense response to tumor cell(GO:0002357) |
| 0.8 | 5.0 | GO:0002725 | negative regulation of T cell cytokine production(GO:0002725) |
| 0.8 | 1.7 | GO:0090238 | positive regulation of arachidonic acid secretion(GO:0090238) |
| 0.8 | 2.5 | GO:0090197 | chemokine secretion(GO:0090195) regulation of chemokine secretion(GO:0090196) positive regulation of chemokine secretion(GO:0090197) |
| 0.8 | 2.5 | GO:0071557 | histone H3-K27 demethylation(GO:0071557) |
| 0.8 | 4.2 | GO:0035582 | sequestering of BMP in extracellular matrix(GO:0035582) |
| 0.8 | 3.3 | GO:1900454 | positive regulation of long term synaptic depression(GO:1900454) |
| 0.8 | 4.9 | GO:0006987 | activation of signaling protein activity involved in unfolded protein response(GO:0006987) |
| 0.8 | 9.8 | GO:1900028 | negative regulation of ruffle assembly(GO:1900028) |
| 0.8 | 4.1 | GO:0060385 | axonogenesis involved in innervation(GO:0060385) |
| 0.8 | 2.4 | GO:1902723 | negative regulation of skeletal muscle cell proliferation(GO:0014859) negative regulation of skeletal muscle satellite cell proliferation(GO:1902723) |
| 0.8 | 4.1 | GO:0035585 | calcium-mediated signaling using extracellular calcium source(GO:0035585) |
| 0.8 | 1.6 | GO:0070309 | lens fiber cell morphogenesis(GO:0070309) |
| 0.8 | 9.7 | GO:0045919 | positive regulation of cytolysis(GO:0045919) |
| 0.8 | 2.4 | GO:0039007 | pronephric nephron morphogenesis(GO:0039007) pronephric nephron tubule morphogenesis(GO:0039008) pronephric duct development(GO:0039022) pronephric duct morphogenesis(GO:0039023) Kupffer's vesicle development(GO:0070121) |
| 0.8 | 4.0 | GO:0006432 | phenylalanyl-tRNA aminoacylation(GO:0006432) |
| 0.8 | 2.4 | GO:0021819 | layer formation in cerebral cortex(GO:0021819) |
| 0.8 | 6.3 | GO:0019367 | fatty acid elongation, saturated fatty acid(GO:0019367) fatty acid elongation, unsaturated fatty acid(GO:0019368) fatty acid elongation, monounsaturated fatty acid(GO:0034625) fatty acid elongation, polyunsaturated fatty acid(GO:0034626) |
| 0.8 | 6.3 | GO:1904262 | negative regulation of TORC1 signaling(GO:1904262) |
| 0.8 | 4.7 | GO:0002826 | negative regulation of T-helper 1 type immune response(GO:0002826) |
| 0.8 | 3.9 | GO:0071233 | cellular response to leucine(GO:0071233) |
| 0.8 | 2.4 | GO:1904383 | response to sodium phosphate(GO:1904383) |
| 0.8 | 9.4 | GO:0008627 | intrinsic apoptotic signaling pathway in response to osmotic stress(GO:0008627) |
| 0.8 | 4.7 | GO:0098912 | membrane depolarization during atrial cardiac muscle cell action potential(GO:0098912) |
| 0.8 | 3.1 | GO:0030472 | mitotic spindle organization in nucleus(GO:0030472) |
| 0.8 | 0.8 | GO:1903802 | L-glutamate import(GO:0051938) L-glutamate(1-) import into cell(GO:1903802) L-glutamate import into cell(GO:1990123) |
| 0.8 | 7.0 | GO:0042758 | long-chain fatty acid catabolic process(GO:0042758) |
| 0.8 | 6.2 | GO:0051121 | hepoxilin metabolic process(GO:0051121) hepoxilin biosynthetic process(GO:0051122) |
| 0.8 | 7.0 | GO:0050966 | detection of mechanical stimulus involved in sensory perception of pain(GO:0050966) |
| 0.8 | 3.1 | GO:1990928 | response to amino acid starvation(GO:1990928) |
| 0.8 | 1.5 | GO:0002584 | negative regulation of antigen processing and presentation of peptide antigen(GO:0002584) |
| 0.8 | 3.1 | GO:1904640 | response to methionine(GO:1904640) |
| 0.8 | 1.5 | GO:0070842 | aggresome assembly(GO:0070842) |
| 0.8 | 0.8 | GO:0014062 | regulation of serotonin secretion(GO:0014062) |
| 0.8 | 12.1 | GO:0090527 | actin filament reorganization(GO:0090527) |
| 0.8 | 3.0 | GO:0032098 | regulation of appetite(GO:0032098) |
| 0.8 | 2.3 | GO:0034553 | respiratory chain complex II assembly(GO:0034552) mitochondrial respiratory chain complex II assembly(GO:0034553) mitochondrial respiratory chain complex II biogenesis(GO:0097032) |
| 0.8 | 3.8 | GO:0031119 | tRNA pseudouridine synthesis(GO:0031119) |
| 0.7 | 11.2 | GO:1904714 | regulation of chaperone-mediated autophagy(GO:1904714) |
| 0.7 | 1.5 | GO:0042940 | D-amino acid transport(GO:0042940) |
| 0.7 | 8.9 | GO:0006069 | ethanol oxidation(GO:0006069) |
| 0.7 | 1.5 | GO:2000437 | monocyte extravasation(GO:0035696) regulation of monocyte extravasation(GO:2000437) |
| 0.7 | 7.4 | GO:0043578 | nuclear matrix organization(GO:0043578) nuclear matrix anchoring at nuclear membrane(GO:0090292) |
| 0.7 | 2.2 | GO:0021558 | trochlear nerve development(GO:0021558) |
| 0.7 | 6.6 | GO:0048243 | norepinephrine secretion(GO:0048243) |
| 0.7 | 2.2 | GO:0071461 | cellular response to redox state(GO:0071461) |
| 0.7 | 5.8 | GO:0043379 | memory T cell differentiation(GO:0043379) |
| 0.7 | 2.9 | GO:0044314 | protein K27-linked ubiquitination(GO:0044314) |
| 0.7 | 2.9 | GO:0060155 | platelet dense granule organization(GO:0060155) |
| 0.7 | 27.5 | GO:0018149 | peptide cross-linking(GO:0018149) |
| 0.7 | 2.9 | GO:0097104 | postsynaptic membrane assembly(GO:0097104) |
| 0.7 | 2.9 | GO:0071725 | toll-like receptor TLR1:TLR2 signaling pathway(GO:0038123) response to triacyl bacterial lipopeptide(GO:0071725) cellular response to triacyl bacterial lipopeptide(GO:0071727) |
| 0.7 | 2.1 | GO:1904491 | protein localization to ciliary transition zone(GO:1904491) |
| 0.7 | 2.1 | GO:0046271 | phenylpropanoid catabolic process(GO:0046271) |
| 0.7 | 1.4 | GO:1902263 | apoptotic process involved in embryonic digit morphogenesis(GO:1902263) |
| 0.7 | 2.1 | GO:0043653 | mitochondrial fragmentation involved in apoptotic process(GO:0043653) |
| 0.7 | 3.5 | GO:0008628 | hormone-mediated apoptotic signaling pathway(GO:0008628) |
| 0.7 | 3.5 | GO:0048104 | establishment of body hair or bristle planar orientation(GO:0048104) establishment of body hair planar orientation(GO:0048105) |
| 0.7 | 2.8 | GO:0006669 | sphinganine-1-phosphate biosynthetic process(GO:0006669) |
| 0.7 | 2.8 | GO:2000670 | positive regulation of dendritic cell apoptotic process(GO:2000670) |
| 0.7 | 12.7 | GO:0090073 | positive regulation of protein homodimerization activity(GO:0090073) |
| 0.7 | 4.2 | GO:0097428 | protein maturation by iron-sulfur cluster transfer(GO:0097428) |
| 0.7 | 7.0 | GO:0036500 | ATF6-mediated unfolded protein response(GO:0036500) |
| 0.7 | 2.1 | GO:0034769 | basement membrane disassembly(GO:0034769) |
| 0.7 | 2.8 | GO:0006701 | progesterone biosynthetic process(GO:0006701) |
| 0.7 | 0.7 | GO:0002475 | antigen processing and presentation via MHC class Ib(GO:0002475) |
| 0.7 | 3.5 | GO:1902474 | regulation of protein localization to synapse(GO:1902473) positive regulation of protein localization to synapse(GO:1902474) |
| 0.7 | 1.4 | GO:0021891 | olfactory bulb interneuron development(GO:0021891) |
| 0.7 | 3.5 | GO:0035672 | oligopeptide transmembrane transport(GO:0035672) |
| 0.7 | 2.1 | GO:1901842 | negative regulation of high voltage-gated calcium channel activity(GO:1901842) |
| 0.7 | 13.1 | GO:0035235 | ionotropic glutamate receptor signaling pathway(GO:0035235) |
| 0.7 | 20.0 | GO:0019731 | antibacterial humoral response(GO:0019731) |
| 0.7 | 2.7 | GO:0036060 | filtration diaphragm assembly(GO:0036058) slit diaphragm assembly(GO:0036060) negative regulation of retinal ganglion cell axon guidance(GO:0090260) |
| 0.7 | 11.6 | GO:0048490 | anterograde synaptic vesicle transport(GO:0048490) synaptic vesicle cytoskeletal transport(GO:0099514) synaptic vesicle transport along microtubule(GO:0099517) |
| 0.7 | 3.4 | GO:0038044 | transforming growth factor-beta secretion(GO:0038044) |
| 0.7 | 4.8 | GO:0048630 | skeletal muscle tissue growth(GO:0048630) |
| 0.7 | 3.4 | GO:0046007 | negative regulation of activated T cell proliferation(GO:0046007) |
| 0.7 | 1.4 | GO:0045448 | regulation of mitotic cell cycle, embryonic(GO:0009794) mitotic cell cycle, embryonic(GO:0045448) |
| 0.7 | 8.1 | GO:0031665 | negative regulation of lipopolysaccharide-mediated signaling pathway(GO:0031665) |
| 0.7 | 3.4 | GO:0061762 | CAMKK-AMPK signaling cascade(GO:0061762) |
| 0.7 | 5.4 | GO:0070236 | regulation of activation-induced cell death of T cells(GO:0070235) negative regulation of activation-induced cell death of T cells(GO:0070236) |
| 0.7 | 2.0 | GO:0031959 | mineralocorticoid receptor signaling pathway(GO:0031959) |
| 0.7 | 1.3 | GO:0051659 | hemolysis by symbiont of host erythrocytes(GO:0019836) hemolysis in other organism(GO:0044179) maintenance of mitochondrion location(GO:0051659) hemolysis in other organism involved in symbiotic interaction(GO:0052331) |
| 0.7 | 10.6 | GO:0033169 | histone H3-K9 demethylation(GO:0033169) |
| 0.7 | 2.6 | GO:0071896 | protein localization to adherens junction(GO:0071896) |
| 0.7 | 2.0 | GO:0051414 | response to cortisol(GO:0051414) |
| 0.7 | 34.3 | GO:0015701 | bicarbonate transport(GO:0015701) |
| 0.7 | 0.7 | GO:1902174 | positive regulation of keratinocyte apoptotic process(GO:1902174) |
| 0.7 | 2.0 | GO:0045658 | regulation of neutrophil differentiation(GO:0045658) negative regulation of neutrophil differentiation(GO:0045659) |
| 0.7 | 5.2 | GO:0007190 | activation of adenylate cyclase activity(GO:0007190) |
| 0.7 | 3.3 | GO:1904565 | response to 1-oleoyl-sn-glycerol 3-phosphate(GO:1904565) cellular response to 1-oleoyl-sn-glycerol 3-phosphate(GO:1904566) |
| 0.6 | 4.5 | GO:0090315 | negative regulation of protein targeting to membrane(GO:0090315) |
| 0.6 | 1.9 | GO:0071409 | cellular response to cycloheximide(GO:0071409) |
| 0.6 | 1.3 | GO:0090298 | negative regulation of mitochondrial DNA replication(GO:0090298) negative regulation of mitochondrial DNA metabolic process(GO:1901859) |
| 0.6 | 7.7 | GO:0060992 | response to fungicide(GO:0060992) |
| 0.6 | 2.6 | GO:0071673 | positive regulation of smooth muscle cell chemotaxis(GO:0071673) |
| 0.6 | 9.7 | GO:0021702 | cerebellar Purkinje cell layer formation(GO:0021694) cerebellar Purkinje cell differentiation(GO:0021702) |
| 0.6 | 3.2 | GO:0042753 | positive regulation of circadian rhythm(GO:0042753) |
| 0.6 | 1.3 | GO:0097210 | response to gonadotropin-releasing hormone(GO:0097210) cellular response to gonadotropin-releasing hormone(GO:0097211) |
| 0.6 | 1.9 | GO:0001920 | negative regulation of receptor recycling(GO:0001920) |
| 0.6 | 3.8 | GO:0018343 | protein farnesylation(GO:0018343) |
| 0.6 | 12.1 | GO:0034389 | lipid particle organization(GO:0034389) |
| 0.6 | 3.8 | GO:0010732 | protein glutathionylation(GO:0010731) regulation of protein glutathionylation(GO:0010732) negative regulation of protein glutathionylation(GO:0010734) |
| 0.6 | 3.8 | GO:0046092 | deoxycytidine metabolic process(GO:0046092) |
| 0.6 | 1.9 | GO:0030860 | regulation of polarized epithelial cell differentiation(GO:0030860) |
| 0.6 | 24.3 | GO:0048665 | neuron fate specification(GO:0048665) |
| 0.6 | 1.9 | GO:0051684 | maintenance of Golgi location(GO:0051684) |
| 0.6 | 1.2 | GO:0048859 | formation of anatomical boundary(GO:0048859) |
| 0.6 | 6.8 | GO:0048251 | elastic fiber assembly(GO:0048251) |
| 0.6 | 3.1 | GO:0015811 | L-cystine transport(GO:0015811) |
| 0.6 | 1.2 | GO:0060734 | regulation of endoplasmic reticulum stress-induced eIF2 alpha phosphorylation(GO:0060734) |
| 0.6 | 3.7 | GO:0097338 | response to clozapine(GO:0097338) |
| 0.6 | 10.5 | GO:0006646 | phosphatidylethanolamine biosynthetic process(GO:0006646) |
| 0.6 | 3.1 | GO:0006154 | adenosine catabolic process(GO:0006154) inosine biosynthetic process(GO:0046103) |
| 0.6 | 10.5 | GO:0003322 | pancreatic A cell development(GO:0003322) |
| 0.6 | 1.8 | GO:1903526 | negative regulation of membrane tubulation(GO:1903526) |
| 0.6 | 2.4 | GO:0008272 | sulfate transport(GO:0008272) |
| 0.6 | 5.4 | GO:0032119 | sequestering of zinc ion(GO:0032119) |
| 0.6 | 2.4 | GO:0036269 | swimming behavior(GO:0036269) |
| 0.6 | 1.2 | GO:1901491 | negative regulation of lymphangiogenesis(GO:1901491) |
| 0.6 | 19.3 | GO:0097352 | autophagosome maturation(GO:0097352) |
| 0.6 | 11.4 | GO:0031069 | hair follicle morphogenesis(GO:0031069) |
| 0.6 | 4.2 | GO:0006702 | androgen biosynthetic process(GO:0006702) |
| 0.6 | 5.4 | GO:0097646 | calcitonin family receptor signaling pathway(GO:0097646) amylin receptor signaling pathway(GO:0097647) |
| 0.6 | 1.8 | GO:0070837 | dehydroascorbic acid transport(GO:0070837) |
| 0.6 | 1.8 | GO:0060988 | lipid tube assembly(GO:0060988) |
| 0.6 | 2.4 | GO:0009305 | protein biotinylation(GO:0009305) histone biotinylation(GO:0071110) |
| 0.6 | 4.2 | GO:0050882 | voluntary musculoskeletal movement(GO:0050882) |
| 0.6 | 13.0 | GO:0021542 | dentate gyrus development(GO:0021542) |
| 0.6 | 1.8 | GO:0060029 | convergent extension involved in organogenesis(GO:0060029) |
| 0.6 | 1.2 | GO:0018879 | biphenyl metabolic process(GO:0018879) |
| 0.6 | 1.8 | GO:0001978 | regulation of systemic arterial blood pressure by carotid sinus baroreceptor feedback(GO:0001978) baroreceptor response to increased systemic arterial blood pressure(GO:0001983) |
| 0.6 | 2.3 | GO:1990414 | replication-born double-strand break repair via sister chromatid exchange(GO:1990414) |
| 0.6 | 1.8 | GO:1900194 | negative regulation of oocyte maturation(GO:1900194) |
| 0.6 | 0.6 | GO:0009624 | response to nematode(GO:0009624) |
| 0.6 | 3.5 | GO:0048712 | negative regulation of astrocyte differentiation(GO:0048712) |
| 0.6 | 1.2 | GO:0060050 | positive regulation of protein glycosylation(GO:0060050) |
| 0.6 | 6.9 | GO:0060134 | prepulse inhibition(GO:0060134) |
| 0.6 | 24.8 | GO:0050829 | defense response to Gram-negative bacterium(GO:0050829) |
| 0.6 | 7.5 | GO:0015813 | L-glutamate transport(GO:0015813) |
| 0.6 | 2.3 | GO:0018125 | peptidyl-cysteine methylation(GO:0018125) |
| 0.6 | 4.0 | GO:0080009 | mRNA methylation(GO:0080009) |
| 0.6 | 1.7 | GO:1902617 | response to fluoride(GO:1902617) |
| 0.6 | 1.7 | GO:0097676 | histone H3-K36 dimethylation(GO:0097676) positive regulation of double-strand break repair via nonhomologous end joining(GO:2001034) |
| 0.6 | 8.5 | GO:0001829 | trophectodermal cell differentiation(GO:0001829) |
| 0.6 | 1.7 | GO:0051232 | meiotic spindle elongation(GO:0051232) meiotic cell cycle process involved in oocyte maturation(GO:1903537) regulation of meiotic cell cycle process involved in oocyte maturation(GO:1903538) |
| 0.6 | 12.3 | GO:0045494 | photoreceptor cell maintenance(GO:0045494) |
| 0.6 | 1.1 | GO:0015793 | glycerol transport(GO:0015793) |
| 0.6 | 3.9 | GO:0090043 | tubulin deacetylation(GO:0090042) regulation of tubulin deacetylation(GO:0090043) |
| 0.6 | 1.7 | GO:0070458 | detoxification of nitrogen compound(GO:0051410) cellular detoxification of nitrogen compound(GO:0070458) |
| 0.6 | 1.7 | GO:0060332 | positive regulation of response to interferon-gamma(GO:0060332) positive regulation of interferon-gamma-mediated signaling pathway(GO:0060335) |
| 0.6 | 4.4 | GO:0002430 | complement receptor mediated signaling pathway(GO:0002430) |
| 0.6 | 1.7 | GO:0071848 | regulation of fever generation by regulation of prostaglandin secretion(GO:0071810) positive regulation of fever generation by positive regulation of prostaglandin secretion(GO:0071812) positive regulation of ERK1 and ERK2 cascade via TNFSF11-mediated signaling(GO:0071848) regulation of fever generation by prostaglandin secretion(GO:0100009) |
| 0.6 | 1.7 | GO:0071529 | cementum mineralization(GO:0071529) |
| 0.5 | 2.2 | GO:0000451 | rRNA 2'-O-methylation(GO:0000451) |
| 0.5 | 8.2 | GO:0007258 | JUN phosphorylation(GO:0007258) |
| 0.5 | 1.6 | GO:0002019 | regulation of renal output by angiotensin(GO:0002019) |
| 0.5 | 6.5 | GO:0009125 | nucleoside monophosphate catabolic process(GO:0009125) |
| 0.5 | 4.3 | GO:0000160 | phosphorelay signal transduction system(GO:0000160) |
| 0.5 | 7.0 | GO:1901750 | leukotriene D4 metabolic process(GO:1901748) leukotriene D4 biosynthetic process(GO:1901750) |
| 0.5 | 1.6 | GO:0006683 | galactosylceramide catabolic process(GO:0006683) |
| 0.5 | 6.4 | GO:1990118 | sodium ion import across plasma membrane(GO:0098719) sodium ion import into cell(GO:1990118) |
| 0.5 | 0.5 | GO:0070350 | white fat cell proliferation(GO:0070343) regulation of white fat cell proliferation(GO:0070350) |
| 0.5 | 3.8 | GO:0045779 | negative regulation of bone resorption(GO:0045779) |
| 0.5 | 2.1 | GO:0001973 | adenosine receptor signaling pathway(GO:0001973) |
| 0.5 | 3.7 | GO:0046604 | positive regulation of mitotic centrosome separation(GO:0046604) |
| 0.5 | 0.5 | GO:0097374 | sensory neuron axon guidance(GO:0097374) |
| 0.5 | 5.3 | GO:0045879 | negative regulation of smoothened signaling pathway(GO:0045879) |
| 0.5 | 52.8 | GO:0050911 | detection of chemical stimulus involved in sensory perception of smell(GO:0050911) |
| 0.5 | 4.2 | GO:0006477 | protein sulfation(GO:0006477) |
| 0.5 | 8.9 | GO:0009312 | oligosaccharide biosynthetic process(GO:0009312) |
| 0.5 | 5.8 | GO:0045721 | negative regulation of gluconeogenesis(GO:0045721) |
| 0.5 | 7.8 | GO:0007158 | neuron cell-cell adhesion(GO:0007158) |
| 0.5 | 4.2 | GO:0010623 | programmed cell death involved in cell development(GO:0010623) |
| 0.5 | 4.7 | GO:0072592 | oxygen metabolic process(GO:0072592) |
| 0.5 | 1.6 | GO:0014813 | skeletal muscle satellite cell commitment(GO:0014813) |
| 0.5 | 1.6 | GO:0036048 | protein demalonylation(GO:0036046) peptidyl-lysine demalonylation(GO:0036047) protein desuccinylation(GO:0036048) peptidyl-lysine desuccinylation(GO:0036049) protein deglutarylation(GO:0061698) peptidyl-lysine deglutarylation(GO:0061699) |
| 0.5 | 2.1 | GO:0072137 | condensed mesenchymal cell proliferation(GO:0072137) |
| 0.5 | 6.2 | GO:0050908 | detection of light stimulus involved in visual perception(GO:0050908) detection of light stimulus involved in sensory perception(GO:0050962) |
| 0.5 | 4.6 | GO:0016127 | cholesterol catabolic process(GO:0006707) sterol catabolic process(GO:0016127) |
| 0.5 | 8.2 | GO:0090051 | negative regulation of cell migration involved in sprouting angiogenesis(GO:0090051) |
| 0.5 | 33.6 | GO:0016525 | negative regulation of angiogenesis(GO:0016525) negative regulation of blood vessel morphogenesis(GO:2000181) |
| 0.5 | 1.0 | GO:0002874 | regulation of chronic inflammatory response to antigenic stimulus(GO:0002874) positive regulation of chronic inflammatory response to antigenic stimulus(GO:0002876) |
| 0.5 | 1.5 | GO:0070625 | zymogen granule exocytosis(GO:0070625) |
| 0.5 | 3.0 | GO:0051013 | microtubule severing(GO:0051013) |
| 0.5 | 1.5 | GO:0048680 | positive regulation of axon regeneration(GO:0048680) |
| 0.5 | 1.5 | GO:0032792 | negative regulation of CREB transcription factor activity(GO:0032792) |
| 0.5 | 1.5 | GO:0018094 | protein polyglycylation(GO:0018094) |
| 0.5 | 7.4 | GO:0002726 | positive regulation of T cell cytokine production(GO:0002726) |
| 0.5 | 2.5 | GO:0043126 | regulation of 1-phosphatidylinositol 4-kinase activity(GO:0043126) positive regulation of 1-phosphatidylinositol 4-kinase activity(GO:0043128) |
| 0.5 | 3.0 | GO:0045343 | MHC class I biosynthetic process(GO:0045341) regulation of MHC class I biosynthetic process(GO:0045343) |
| 0.5 | 14.3 | GO:0014072 | response to isoquinoline alkaloid(GO:0014072) response to morphine(GO:0043278) |
| 0.5 | 0.5 | GO:1903015 | regulation of exo-alpha-sialidase activity(GO:1903015) |
| 0.5 | 2.9 | GO:0072710 | response to hydroxyurea(GO:0072710) |
| 0.5 | 9.8 | GO:0034204 | lipid translocation(GO:0034204) phospholipid translocation(GO:0045332) |
| 0.5 | 0.5 | GO:1900271 | regulation of long-term synaptic potentiation(GO:1900271) |
| 0.5 | 3.4 | GO:2001300 | lipoxin metabolic process(GO:2001300) |
| 0.5 | 3.8 | GO:0033089 | positive regulation of T cell differentiation in thymus(GO:0033089) positive regulation of thymocyte aggregation(GO:2000400) |
| 0.5 | 1.0 | GO:0044805 | late nucleophagy(GO:0044805) |
| 0.5 | 1.4 | GO:0072675 | multinuclear osteoclast differentiation(GO:0072674) osteoclast fusion(GO:0072675) |
| 0.5 | 2.4 | GO:0038163 | thrombopoietin-mediated signaling pathway(GO:0038163) |
| 0.5 | 1.9 | GO:0009449 | gamma-aminobutyric acid biosynthetic process(GO:0009449) |
| 0.5 | 3.8 | GO:1904781 | positive regulation of protein localization to centrosome(GO:1904781) |
| 0.5 | 12.2 | GO:0014047 | glutamate secretion(GO:0014047) |
| 0.5 | 5.6 | GO:1901898 | negative regulation of relaxation of cardiac muscle(GO:1901898) |
| 0.5 | 3.7 | GO:2000463 | positive regulation of excitatory postsynaptic potential(GO:2000463) |
| 0.5 | 1.4 | GO:0000023 | maltose metabolic process(GO:0000023) |
| 0.5 | 0.5 | GO:0099601 | regulation of neurotransmitter receptor activity(GO:0099601) |
| 0.5 | 12.6 | GO:0008045 | motor neuron axon guidance(GO:0008045) |
| 0.5 | 3.3 | GO:2000660 | negative regulation of interleukin-1-mediated signaling pathway(GO:2000660) |
| 0.5 | 9.3 | GO:0006895 | Golgi to endosome transport(GO:0006895) |
| 0.5 | 1.4 | GO:0035048 | splicing factor protein import into nucleus(GO:0035048) |
| 0.5 | 0.9 | GO:0002025 | vasodilation by norepinephrine-epinephrine involved in regulation of systemic arterial blood pressure(GO:0002025) |
| 0.5 | 12.5 | GO:0036465 | synaptic vesicle recycling(GO:0036465) |
| 0.5 | 13.0 | GO:0042417 | dopamine metabolic process(GO:0042417) |
| 0.5 | 5.5 | GO:1902803 | regulation of synaptic vesicle transport(GO:1902803) |
| 0.5 | 0.5 | GO:0070781 | response to biotin(GO:0070781) |
| 0.5 | 0.9 | GO:0071360 | cellular response to exogenous dsRNA(GO:0071360) |
| 0.5 | 0.9 | GO:0046416 | D-amino acid metabolic process(GO:0046416) |
| 0.5 | 4.1 | GO:0051127 | positive regulation of actin nucleation(GO:0051127) |
| 0.5 | 2.7 | GO:0006565 | L-serine catabolic process(GO:0006565) |
| 0.5 | 0.9 | GO:0045590 | negative regulation of regulatory T cell differentiation(GO:0045590) |
| 0.5 | 2.7 | GO:0008218 | bioluminescence(GO:0008218) |
| 0.5 | 5.0 | GO:0045008 | depyrimidination(GO:0045008) |
| 0.5 | 1.4 | GO:0018874 | benzoate metabolic process(GO:0018874) butyrate metabolic process(GO:0019605) |
| 0.5 | 1.8 | GO:0016322 | neuron remodeling(GO:0016322) |
| 0.5 | 0.9 | GO:0035962 | response to interleukin-13(GO:0035962) |
| 0.5 | 4.1 | GO:0048096 | chromatin-mediated maintenance of transcription(GO:0048096) |
| 0.4 | 1.8 | GO:0010897 | negative regulation of triglyceride catabolic process(GO:0010897) |
| 0.4 | 1.8 | GO:0031999 | negative regulation of fatty acid beta-oxidation(GO:0031999) |
| 0.4 | 1.8 | GO:0061107 | seminal vesicle development(GO:0061107) |
| 0.4 | 1.8 | GO:0019732 | antifungal humoral response(GO:0019732) |
| 0.4 | 1.8 | GO:0060454 | positive regulation of gastric acid secretion(GO:0060454) |
| 0.4 | 1.8 | GO:0030828 | positive regulation of cGMP biosynthetic process(GO:0030828) |
| 0.4 | 3.9 | GO:0031987 | locomotion involved in locomotory behavior(GO:0031987) |
| 0.4 | 4.8 | GO:1902083 | negative regulation of peptidyl-cysteine S-nitrosylation(GO:1902083) regulation of peptidyl-cysteine S-nitrosylation(GO:2000169) |
| 0.4 | 1.3 | GO:0016476 | regulation of embryonic cell shape(GO:0016476) |
| 0.4 | 0.4 | GO:0071288 | cellular response to mercury ion(GO:0071288) |
| 0.4 | 1.7 | GO:0001992 | regulation of systemic arterial blood pressure by vasopressin(GO:0001992) |
| 0.4 | 5.2 | GO:0051931 | regulation of sensory perception of pain(GO:0051930) regulation of sensory perception(GO:0051931) |
| 0.4 | 1.7 | GO:0060054 | positive regulation of epithelial cell proliferation involved in wound healing(GO:0060054) |
| 0.4 | 0.9 | GO:0086021 | SA node cell to atrial cardiac muscle cell communication by electrical coupling(GO:0086021) AV node cell to bundle of His cell communication by electrical coupling(GO:0086053) |
| 0.4 | 0.9 | GO:0071838 | cell proliferation in bone marrow(GO:0071838) |
| 0.4 | 6.0 | GO:0090141 | positive regulation of mitochondrial fission(GO:0090141) |
| 0.4 | 1.3 | GO:0038193 | thromboxane A2 signaling pathway(GO:0038193) |
| 0.4 | 0.4 | GO:1901529 | positive regulation of anion channel activity(GO:1901529) |
| 0.4 | 1.3 | GO:1904417 | regulation of xenophagy(GO:1904415) positive regulation of xenophagy(GO:1904417) |
| 0.4 | 1.3 | GO:0051039 | histone displacement(GO:0001207) positive regulation of transcription involved in meiotic cell cycle(GO:0051039) |
| 0.4 | 0.4 | GO:0003408 | optic cup formation involved in camera-type eye development(GO:0003408) |
| 0.4 | 6.4 | GO:0021772 | olfactory bulb development(GO:0021772) |
| 0.4 | 3.0 | GO:0070166 | enamel mineralization(GO:0070166) |
| 0.4 | 3.0 | GO:0034382 | chylomicron remnant clearance(GO:0034382) triglyceride-rich lipoprotein particle clearance(GO:0071830) |
| 0.4 | 2.1 | GO:1904783 | regulation of unidimensional cell growth(GO:0051510) negative regulation of unidimensional cell growth(GO:0051511) establishment of cell polarity regulating cell shape(GO:0071964) negative regulation of dendritic spine maintenance(GO:1902951) positive regulation of NMDA glutamate receptor activity(GO:1904783) regulation of establishment or maintenance of cell polarity regulating cell shape(GO:2000769) positive regulation of establishment or maintenance of cell polarity regulating cell shape(GO:2000771) regulation of establishment of cell polarity regulating cell shape(GO:2000782) positive regulation of establishment of cell polarity regulating cell shape(GO:2000784) positive regulation of barbed-end actin filament capping(GO:2000814) |
| 0.4 | 2.1 | GO:0036149 | phosphatidylinositol acyl-chain remodeling(GO:0036149) |
| 0.4 | 4.6 | GO:0030202 | heparin metabolic process(GO:0030202) heparin biosynthetic process(GO:0030210) |
| 0.4 | 3.3 | GO:0006776 | vitamin A metabolic process(GO:0006776) |
| 0.4 | 2.9 | GO:0086100 | endothelin receptor signaling pathway(GO:0086100) |
| 0.4 | 2.1 | GO:0007197 | adenylate cyclase-inhibiting G-protein coupled acetylcholine receptor signaling pathway(GO:0007197) |
| 0.4 | 7.0 | GO:0010882 | regulation of cardiac muscle contraction by calcium ion signaling(GO:0010882) |
| 0.4 | 1.6 | GO:0010966 | regulation of phosphate transport(GO:0010966) |
| 0.4 | 2.5 | GO:1902261 | positive regulation of delayed rectifier potassium channel activity(GO:1902261) |
| 0.4 | 3.7 | GO:0005981 | regulation of glycogen catabolic process(GO:0005981) |
| 0.4 | 6.9 | GO:0070262 | peptidyl-serine dephosphorylation(GO:0070262) |
| 0.4 | 8.1 | GO:0046069 | cGMP catabolic process(GO:0046069) |
| 0.4 | 7.7 | GO:1900449 | regulation of glutamate receptor signaling pathway(GO:1900449) |
| 0.4 | 0.4 | GO:2000389 | regulation of neutrophil extravasation(GO:2000389) |
| 0.4 | 2.8 | GO:0070995 | NADPH oxidation(GO:0070995) |
| 0.4 | 6.8 | GO:0051703 | social behavior(GO:0035176) intraspecies interaction between organisms(GO:0051703) |
| 0.4 | 4.0 | GO:0006451 | selenocysteine incorporation(GO:0001514) translational readthrough(GO:0006451) |
| 0.4 | 4.4 | GO:0007616 | long-term memory(GO:0007616) |
| 0.4 | 2.0 | GO:0010615 | positive regulation of cardiac muscle adaptation(GO:0010615) positive regulation of cardiac muscle hypertrophy in response to stress(GO:1903244) |
| 0.4 | 1.6 | GO:0045925 | positive regulation of female receptivity(GO:0045925) |
| 0.4 | 15.4 | GO:0043268 | positive regulation of potassium ion transport(GO:0043268) |
| 0.4 | 3.1 | GO:0098914 | membrane repolarization during atrial cardiac muscle cell action potential(GO:0098914) |
| 0.4 | 2.0 | GO:0008626 | granzyme-mediated apoptotic signaling pathway(GO:0008626) |
| 0.4 | 6.3 | GO:2000052 | positive regulation of non-canonical Wnt signaling pathway(GO:2000052) |
| 0.4 | 1.6 | GO:0010936 | negative regulation of macrophage cytokine production(GO:0010936) |
| 0.4 | 6.6 | GO:0035249 | synaptic transmission, glutamatergic(GO:0035249) |
| 0.4 | 1.2 | GO:0071400 | carbamoyl phosphate metabolic process(GO:0070408) carbamoyl phosphate biosynthetic process(GO:0070409) cellular response to oleic acid(GO:0071400) response to ammonia(GO:1903717) cellular response to ammonia(GO:1903718) |
| 0.4 | 1.2 | GO:0032971 | regulation of muscle filament sliding(GO:0032971) |
| 0.4 | 1.9 | GO:0043950 | positive regulation of cAMP-mediated signaling(GO:0043950) |
| 0.4 | 9.3 | GO:0050435 | beta-amyloid metabolic process(GO:0050435) |
| 0.4 | 2.3 | GO:0090650 | response to oxygen-glucose deprivation(GO:0090649) cellular response to oxygen-glucose deprivation(GO:0090650) |
| 0.4 | 1.1 | GO:0000103 | sulfate assimilation(GO:0000103) |
| 0.4 | 1.5 | GO:0044791 | viral genome packaging(GO:0019072) viral RNA genome packaging(GO:0019074) modulation by host of viral release from host cell(GO:0044789) positive regulation by host of viral release from host cell(GO:0044791) |
| 0.4 | 1.5 | GO:0003366 | cell-matrix adhesion involved in ameboidal cell migration(GO:0003366) |
| 0.4 | 22.6 | GO:0007218 | neuropeptide signaling pathway(GO:0007218) |
| 0.4 | 3.0 | GO:0006384 | transcription initiation from RNA polymerase III promoter(GO:0006384) |
| 0.4 | 1.5 | GO:2000773 | negative regulation of cellular senescence(GO:2000773) |
| 0.4 | 1.1 | GO:0060974 | neural crest cell migration involved in heart formation(GO:0003147) cell migration involved in heart formation(GO:0060974) anterior neural tube closure(GO:0061713) cellular response to folic acid(GO:0071231) |
| 0.4 | 0.4 | GO:2000523 | regulation of T cell costimulation(GO:2000523) positive regulation of T cell costimulation(GO:2000525) |
| 0.4 | 2.2 | GO:0008343 | adult feeding behavior(GO:0008343) |
| 0.4 | 0.7 | GO:0097272 | ammonia homeostasis(GO:0097272) |
| 0.4 | 2.2 | GO:0009713 | catechol-containing compound biosynthetic process(GO:0009713) catecholamine biosynthetic process(GO:0042423) |
| 0.4 | 3.3 | GO:2001106 | regulation of Rho guanyl-nucleotide exchange factor activity(GO:2001106) |
| 0.4 | 4.0 | GO:0035878 | nail development(GO:0035878) |
| 0.4 | 2.6 | GO:0070294 | renal sodium ion absorption(GO:0070294) |
| 0.4 | 1.5 | GO:1904469 | positive regulation of tumor necrosis factor secretion(GO:1904469) |
| 0.4 | 14.9 | GO:1901385 | regulation of voltage-gated calcium channel activity(GO:1901385) |
| 0.4 | 4.3 | GO:0006516 | glycoprotein catabolic process(GO:0006516) |
| 0.4 | 3.3 | GO:0007598 | blood coagulation, extrinsic pathway(GO:0007598) |
| 0.4 | 7.9 | GO:0007398 | ectoderm development(GO:0007398) |
| 0.4 | 0.7 | GO:0021612 | rhombomere 5 development(GO:0021571) facial nerve structural organization(GO:0021612) |
| 0.4 | 2.1 | GO:0016554 | cytidine to uridine editing(GO:0016554) |
| 0.4 | 4.3 | GO:0032688 | negative regulation of interferon-beta production(GO:0032688) |
| 0.4 | 12.1 | GO:0048247 | lymphocyte chemotaxis(GO:0048247) |
| 0.4 | 1.4 | GO:0072102 | glomerulus morphogenesis(GO:0072102) |
| 0.4 | 0.7 | GO:0010046 | response to mycotoxin(GO:0010046) |
| 0.4 | 2.5 | GO:0006498 | N-terminal protein lipidation(GO:0006498) |
| 0.4 | 5.6 | GO:0030575 | nuclear body organization(GO:0030575) |
| 0.3 | 7.7 | GO:0022400 | regulation of rhodopsin mediated signaling pathway(GO:0022400) |
| 0.3 | 4.9 | GO:0006004 | fucose metabolic process(GO:0006004) |
| 0.3 | 1.4 | GO:0006651 | diacylglycerol biosynthetic process(GO:0006651) |
| 0.3 | 2.0 | GO:0002933 | lipid hydroxylation(GO:0002933) |
| 0.3 | 2.0 | GO:0045723 | positive regulation of fatty acid biosynthetic process(GO:0045723) |
| 0.3 | 5.1 | GO:0051895 | negative regulation of focal adhesion assembly(GO:0051895) |
| 0.3 | 1.3 | GO:0072658 | maintenance of protein location in membrane(GO:0072658) maintenance of protein location in plasma membrane(GO:0072660) positive regulation of membrane depolarization during cardiac muscle cell action potential(GO:1900827) |
| 0.3 | 1.0 | GO:0002523 | leukocyte migration involved in inflammatory response(GO:0002523) |
| 0.3 | 2.6 | GO:0051026 | chiasma assembly(GO:0051026) |
| 0.3 | 15.3 | GO:0032728 | positive regulation of interferon-beta production(GO:0032728) |
| 0.3 | 1.3 | GO:0044254 | angiotensin catabolic process in blood(GO:0002005) multicellular organismal protein catabolic process(GO:0044254) protein digestion(GO:0044256) multicellular organismal macromolecule catabolic process(GO:0044266) |
| 0.3 | 2.3 | GO:0006531 | aspartate metabolic process(GO:0006531) |
| 0.3 | 2.3 | GO:0046950 | cellular ketone body metabolic process(GO:0046950) |
| 0.3 | 1.3 | GO:0003430 | growth plate cartilage chondrocyte growth(GO:0003430) growth plate cartilage chondrocyte development(GO:0003431) Harderian gland development(GO:0070384) |
| 0.3 | 1.3 | GO:1900104 | hyaluranon cable assembly(GO:0036118) regulation of hyaluranon cable assembly(GO:1900104) positive regulation of hyaluranon cable assembly(GO:1900106) |
| 0.3 | 4.5 | GO:0019433 | triglyceride catabolic process(GO:0019433) |
| 0.3 | 5.8 | GO:0021904 | dorsal/ventral neural tube patterning(GO:0021904) |
| 0.3 | 1.0 | GO:0030186 | melatonin metabolic process(GO:0030186) melatonin biosynthetic process(GO:0030187) |
| 0.3 | 2.2 | GO:0043569 | negative regulation of insulin-like growth factor receptor signaling pathway(GO:0043569) |
| 0.3 | 1.6 | GO:1900165 | negative regulation of interleukin-6 secretion(GO:1900165) |
| 0.3 | 8.6 | GO:0086010 | membrane depolarization during action potential(GO:0086010) |
| 0.3 | 1.0 | GO:0070105 | regulation of interleukin-6-mediated signaling pathway(GO:0070103) positive regulation of interleukin-6-mediated signaling pathway(GO:0070105) |
| 0.3 | 0.9 | GO:0061536 | glycine secretion(GO:0061536) glycine secretion, neurotransmission(GO:0061537) |
| 0.3 | 1.3 | GO:0015855 | pyrimidine nucleobase transport(GO:0015855) purine nucleobase transmembrane transport(GO:1904823) |
| 0.3 | 1.6 | GO:1901626 | regulation of postsynaptic membrane organization(GO:1901626) |
| 0.3 | 4.1 | GO:0070493 | thrombin receptor signaling pathway(GO:0070493) |
| 0.3 | 4.4 | GO:0019373 | epoxygenase P450 pathway(GO:0019373) |
| 0.3 | 3.1 | GO:0001574 | ganglioside biosynthetic process(GO:0001574) |
| 0.3 | 3.4 | GO:0006704 | glucocorticoid biosynthetic process(GO:0006704) |
| 0.3 | 1.6 | GO:0032648 | regulation of interferon-beta production(GO:0032648) |
| 0.3 | 1.8 | GO:0072520 | seminiferous tubule development(GO:0072520) |
| 0.3 | 0.9 | GO:0036150 | phosphatidylserine acyl-chain remodeling(GO:0036150) |
| 0.3 | 3.0 | GO:0060346 | bone trabecula formation(GO:0060346) |
| 0.3 | 2.1 | GO:0015747 | urate transport(GO:0015747) |
| 0.3 | 5.6 | GO:0097120 | receptor localization to synapse(GO:0097120) |
| 0.3 | 1.8 | GO:0061302 | smooth muscle cell-matrix adhesion(GO:0061302) |
| 0.3 | 0.6 | GO:1900186 | negative regulation of clathrin-mediated endocytosis(GO:1900186) |
| 0.3 | 0.6 | GO:0060018 | astrocyte fate commitment(GO:0060018) |
| 0.3 | 4.4 | GO:0042572 | retinol metabolic process(GO:0042572) |
| 0.3 | 5.3 | GO:0010719 | negative regulation of epithelial to mesenchymal transition(GO:0010719) |
| 0.3 | 1.5 | GO:0045654 | positive regulation of megakaryocyte differentiation(GO:0045654) |
| 0.3 | 0.6 | GO:0060474 | positive regulation of sperm motility involved in capacitation(GO:0060474) |
| 0.3 | 0.9 | GO:0061027 | umbilical cord morphogenesis(GO:0036304) umbilical cord development(GO:0061027) negative regulation of transcription from RNA polymerase II promoter involved in smooth muscle cell differentiation(GO:2000820) |
| 0.3 | 1.7 | GO:0010044 | response to aluminum ion(GO:0010044) |
| 0.3 | 1.1 | GO:0045837 | negative regulation of mitochondrial membrane potential(GO:0010917) negative regulation of membrane potential(GO:0045837) |
| 0.3 | 2.6 | GO:0031269 | pseudopodium assembly(GO:0031269) |
| 0.3 | 3.7 | GO:0042982 | amyloid precursor protein metabolic process(GO:0042982) |
| 0.3 | 4.0 | GO:2000479 | regulation of cAMP-dependent protein kinase activity(GO:2000479) |
| 0.3 | 3.1 | GO:0050901 | leukocyte tethering or rolling(GO:0050901) |
| 0.3 | 3.9 | GO:0010763 | positive regulation of fibroblast migration(GO:0010763) |
| 0.3 | 1.7 | GO:0072386 | plus-end-directed vesicle transport along microtubule(GO:0072383) plus-end-directed organelle transport along microtubule(GO:0072386) |
| 0.3 | 1.1 | GO:0060455 | negative regulation of gastric acid secretion(GO:0060455) |
| 0.3 | 0.6 | GO:0036215 | response to stem cell factor(GO:0036215) cellular response to stem cell factor stimulus(GO:0036216) Kit signaling pathway(GO:0038109) |
| 0.3 | 4.5 | GO:0033539 | fatty acid beta-oxidation using acyl-CoA dehydrogenase(GO:0033539) |
| 0.3 | 1.1 | GO:0030240 | skeletal muscle thin filament assembly(GO:0030240) |
| 0.3 | 1.4 | GO:0019464 | glycine catabolic process(GO:0006546) glycine decarboxylation via glycine cleavage system(GO:0019464) |
| 0.3 | 2.2 | GO:0007506 | gonadal mesoderm development(GO:0007506) |
| 0.3 | 1.1 | GO:0015874 | norepinephrine transport(GO:0015874) |
| 0.3 | 1.3 | GO:0090245 | axis elongation involved in somitogenesis(GO:0090245) |
| 0.3 | 0.8 | GO:1900042 | positive regulation of interleukin-2 secretion(GO:1900042) |
| 0.3 | 1.9 | GO:0030321 | transepithelial chloride transport(GO:0030321) |
| 0.3 | 0.5 | GO:0045603 | positive regulation of endothelial cell differentiation(GO:0045603) |
| 0.3 | 3.2 | GO:0046628 | positive regulation of insulin receptor signaling pathway(GO:0046628) |
| 0.3 | 4.0 | GO:0070070 | proton-transporting V-type ATPase complex assembly(GO:0070070) vacuolar proton-transporting V-type ATPase complex assembly(GO:0070072) |
| 0.3 | 0.5 | GO:1901877 | regulation of calcium ion binding(GO:1901876) negative regulation of calcium ion binding(GO:1901877) |
| 0.3 | 1.3 | GO:0035871 | protein K11-linked deubiquitination(GO:0035871) |
| 0.3 | 0.8 | GO:0002143 | tRNA wobble position uridine thiolation(GO:0002143) |
| 0.3 | 1.6 | GO:0034199 | activation of protein kinase A activity(GO:0034199) |
| 0.3 | 1.8 | GO:0070862 | negative regulation of protein exit from endoplasmic reticulum(GO:0070862) negative regulation of retrograde protein transport, ER to cytosol(GO:1904153) |
| 0.3 | 1.5 | GO:0032534 | regulation of microvillus assembly(GO:0032534) |
| 0.3 | 1.0 | GO:0031998 | regulation of fatty acid beta-oxidation(GO:0031998) |
| 0.3 | 1.8 | GO:0045987 | positive regulation of smooth muscle contraction(GO:0045987) |
| 0.3 | 3.6 | GO:0018298 | protein-chromophore linkage(GO:0018298) |
| 0.3 | 0.5 | GO:0060448 | dichotomous subdivision of terminal units involved in lung branching(GO:0060448) |
| 0.3 | 1.3 | GO:2000672 | regulation of motor neuron apoptotic process(GO:2000671) negative regulation of motor neuron apoptotic process(GO:2000672) |
| 0.3 | 3.5 | GO:2001275 | positive regulation of glucose import in response to insulin stimulus(GO:2001275) |
| 0.3 | 5.0 | GO:0021952 | central nervous system projection neuron axonogenesis(GO:0021952) |
| 0.2 | 1.7 | GO:0098703 | calcium ion import across plasma membrane(GO:0098703) calcium ion import into cell(GO:1990035) |
| 0.2 | 0.7 | GO:0007198 | adenylate cyclase-inhibiting serotonin receptor signaling pathway(GO:0007198) |
| 0.2 | 1.7 | GO:1902260 | negative regulation of delayed rectifier potassium channel activity(GO:1902260) |
| 0.2 | 1.2 | GO:0060754 | positive regulation of mast cell chemotaxis(GO:0060754) |
| 0.2 | 0.7 | GO:0086023 | adrenergic receptor signaling pathway involved in heart process(GO:0086023) |
| 0.2 | 0.7 | GO:0038030 | non-canonical Wnt signaling pathway via MAPK cascade(GO:0038030) non-canonical Wnt signaling pathway via JNK cascade(GO:0038031) |
| 0.2 | 1.4 | GO:1900122 | positive regulation of receptor binding(GO:1900122) |
| 0.2 | 33.3 | GO:0007156 | homophilic cell adhesion via plasma membrane adhesion molecules(GO:0007156) |
| 0.2 | 1.7 | GO:0007288 | sperm axoneme assembly(GO:0007288) |
| 0.2 | 0.5 | GO:0072023 | thick ascending limb development(GO:0072023) metanephric thick ascending limb development(GO:0072233) |
| 0.2 | 1.2 | GO:0072501 | cellular phosphate ion homeostasis(GO:0030643) cellular divalent inorganic anion homeostasis(GO:0072501) cellular trivalent inorganic anion homeostasis(GO:0072502) |
| 0.2 | 1.6 | GO:0006777 | Mo-molybdopterin cofactor biosynthetic process(GO:0006777) Mo-molybdopterin cofactor metabolic process(GO:0019720) molybdopterin cofactor biosynthetic process(GO:0032324) molybdopterin cofactor metabolic process(GO:0043545) prosthetic group metabolic process(GO:0051189) |
| 0.2 | 0.5 | GO:0098700 | neurotransmitter loading into synaptic vesicle(GO:0098700) |
| 0.2 | 4.1 | GO:0055090 | acylglycerol homeostasis(GO:0055090) triglyceride homeostasis(GO:0070328) |
| 0.2 | 1.1 | GO:0042737 | drug catabolic process(GO:0042737) |
| 0.2 | 0.9 | GO:1905225 | response to glycoprotein(GO:1904587) cellular response to glycoprotein(GO:1904588) response to thyrotropin-releasing hormone(GO:1905225) cellular response to thyrotropin-releasing hormone(GO:1905229) |
| 0.2 | 0.9 | GO:1904259 | regulation of basement membrane assembly involved in embryonic body morphogenesis(GO:1904259) positive regulation of basement membrane assembly involved in embryonic body morphogenesis(GO:1904261) basement membrane assembly involved in embryonic body morphogenesis(GO:2001197) |
| 0.2 | 1.1 | GO:0045872 | positive regulation of rhodopsin gene expression(GO:0045872) |
| 0.2 | 1.5 | GO:0015886 | heme transport(GO:0015886) |
| 0.2 | 2.5 | GO:0031293 | membrane protein intracellular domain proteolysis(GO:0031293) |
| 0.2 | 0.4 | GO:0018027 | peptidyl-lysine dimethylation(GO:0018027) |
| 0.2 | 1.5 | GO:0060484 | lung-associated mesenchyme development(GO:0060484) |
| 0.2 | 1.0 | GO:1902894 | negative regulation of pri-miRNA transcription from RNA polymerase II promoter(GO:1902894) |
| 0.2 | 7.9 | GO:0008277 | regulation of G-protein coupled receptor protein signaling pathway(GO:0008277) |
| 0.2 | 4.1 | GO:0007214 | gamma-aminobutyric acid signaling pathway(GO:0007214) |
| 0.2 | 1.9 | GO:0044804 | nucleophagy(GO:0044804) |
| 0.2 | 1.4 | GO:0042118 | endothelial cell activation(GO:0042118) |
| 0.2 | 0.4 | GO:0090080 | positive regulation of MAPKKK cascade by fibroblast growth factor receptor signaling pathway(GO:0090080) |
| 0.2 | 3.9 | GO:0045746 | negative regulation of Notch signaling pathway(GO:0045746) |
| 0.2 | 1.2 | GO:0001759 | organ induction(GO:0001759) |
| 0.2 | 0.8 | GO:0048050 | post-embryonic eye morphogenesis(GO:0048050) |
| 0.2 | 1.2 | GO:0032466 | negative regulation of cytokinesis(GO:0032466) |
| 0.2 | 2.4 | GO:0001542 | ovulation from ovarian follicle(GO:0001542) |
| 0.2 | 0.6 | GO:0050910 | detection of mechanical stimulus involved in sensory perception of sound(GO:0050910) |
| 0.2 | 1.8 | GO:0060083 | smooth muscle contraction involved in micturition(GO:0060083) |
| 0.2 | 0.2 | GO:0010956 | negative regulation of calcidiol 1-monooxygenase activity(GO:0010956) |
| 0.2 | 1.4 | GO:0006011 | UDP-glucose metabolic process(GO:0006011) |
| 0.2 | 0.8 | GO:0007350 | blastoderm segmentation(GO:0007350) tripartite regional subdivision(GO:0007351) anterior/posterior axis specification, embryo(GO:0008595) |
| 0.2 | 5.1 | GO:0035428 | hexose transmembrane transport(GO:0035428) glucose transmembrane transport(GO:1904659) |
| 0.2 | 0.8 | GO:0050665 | hydrogen peroxide biosynthetic process(GO:0050665) |
| 0.2 | 5.1 | GO:0042461 | photoreceptor cell development(GO:0042461) |
| 0.2 | 8.6 | GO:0034260 | negative regulation of GTPase activity(GO:0034260) |
| 0.2 | 1.2 | GO:0001865 | NK T cell differentiation(GO:0001865) |
| 0.2 | 0.8 | GO:0045656 | negative regulation of monocyte differentiation(GO:0045656) |
| 0.2 | 1.0 | GO:0006772 | thiamine metabolic process(GO:0006772) |
| 0.2 | 1.0 | GO:0060836 | lymphatic endothelial cell differentiation(GO:0060836) |
| 0.2 | 1.7 | GO:0015871 | choline transport(GO:0015871) |
| 0.2 | 1.7 | GO:0046460 | neutral lipid biosynthetic process(GO:0046460) acylglycerol biosynthetic process(GO:0046463) |
| 0.2 | 0.4 | GO:0007352 | zygotic specification of dorsal/ventral axis(GO:0007352) |
| 0.2 | 11.8 | GO:0006968 | cellular defense response(GO:0006968) |
| 0.2 | 1.5 | GO:0033127 | regulation of histone phosphorylation(GO:0033127) |
| 0.2 | 3.6 | GO:2000785 | regulation of autophagosome assembly(GO:2000785) |
| 0.2 | 1.3 | GO:0007625 | grooming behavior(GO:0007625) |
| 0.2 | 1.7 | GO:0050858 | negative regulation of antigen receptor-mediated signaling pathway(GO:0050858) negative regulation of T cell receptor signaling pathway(GO:0050860) |
| 0.2 | 1.5 | GO:0043030 | regulation of macrophage activation(GO:0043030) |
| 0.2 | 1.8 | GO:0006824 | cobalt ion transport(GO:0006824) |
| 0.2 | 1.3 | GO:1904100 | regulation of protein O-linked glycosylation(GO:1904098) positive regulation of protein O-linked glycosylation(GO:1904100) |
| 0.2 | 10.4 | GO:0006501 | C-terminal protein lipidation(GO:0006501) |
| 0.2 | 2.4 | GO:0006835 | dicarboxylic acid transport(GO:0006835) |
| 0.2 | 1.8 | GO:0060707 | trophoblast giant cell differentiation(GO:0060707) |
| 0.2 | 0.9 | GO:0000414 | regulation of histone H3-K36 methylation(GO:0000414) |
| 0.2 | 1.1 | GO:0031666 | positive regulation of lipopolysaccharide-mediated signaling pathway(GO:0031666) |
| 0.2 | 3.7 | GO:0097503 | sialylation(GO:0097503) |
| 0.2 | 1.9 | GO:0045161 | neuronal ion channel clustering(GO:0045161) |
| 0.2 | 1.6 | GO:0097242 | beta-amyloid clearance(GO:0097242) |
| 0.2 | 2.3 | GO:0060662 | tube lumen cavitation(GO:0060605) salivary gland cavitation(GO:0060662) |
| 0.2 | 0.5 | GO:0038043 | interleukin-5-mediated signaling pathway(GO:0038043) |
| 0.2 | 0.3 | GO:0090335 | regulation of brown fat cell differentiation(GO:0090335) |
| 0.2 | 0.7 | GO:0060746 | maternal behavior(GO:0042711) parental behavior(GO:0060746) |
| 0.2 | 0.7 | GO:1901142 | insulin metabolic process(GO:1901142) |
| 0.2 | 1.0 | GO:0032468 | Golgi calcium ion homeostasis(GO:0032468) |
| 0.2 | 0.8 | GO:0071468 | cellular response to acidic pH(GO:0071468) |
| 0.2 | 1.0 | GO:0047496 | vesicle transport along microtubule(GO:0047496) |
| 0.2 | 0.2 | GO:0001927 | exocyst assembly(GO:0001927) |
| 0.2 | 0.7 | GO:0010159 | specification of organ position(GO:0010159) glossopharyngeal nerve morphogenesis(GO:0021615) parathyroid gland development(GO:0060017) |
| 0.2 | 0.7 | GO:0006880 | intracellular sequestering of iron ion(GO:0006880) sequestering of iron ion(GO:0097577) |
| 0.2 | 0.3 | GO:0010643 | cell communication by chemical coupling(GO:0010643) |
| 0.2 | 1.0 | GO:0046689 | response to mercury ion(GO:0046689) |
| 0.2 | 1.3 | GO:0007512 | adult heart development(GO:0007512) |
| 0.2 | 3.6 | GO:0001881 | receptor recycling(GO:0001881) |
| 0.2 | 2.2 | GO:0019835 | cytolysis(GO:0019835) |
| 0.2 | 1.9 | GO:0030277 | maintenance of gastrointestinal epithelium(GO:0030277) |
| 0.2 | 1.7 | GO:0006552 | leucine catabolic process(GO:0006552) |
| 0.2 | 0.8 | GO:0071625 | vocalization behavior(GO:0071625) |
| 0.2 | 0.9 | GO:0043117 | positive regulation of vascular permeability(GO:0043117) |
| 0.2 | 1.2 | GO:0060122 | inner ear receptor stereocilium organization(GO:0060122) |
| 0.2 | 0.6 | GO:0009298 | GDP-mannose biosynthetic process(GO:0009298) |
| 0.2 | 1.7 | GO:0051256 | mitotic spindle midzone assembly(GO:0051256) |
| 0.2 | 0.9 | GO:0032695 | negative regulation of interleukin-12 production(GO:0032695) |
| 0.2 | 1.5 | GO:0038092 | nodal signaling pathway(GO:0038092) |
| 0.2 | 0.6 | GO:0032815 | negative regulation of natural killer cell activation(GO:0032815) |
| 0.2 | 0.8 | GO:0033353 | S-adenosylmethionine cycle(GO:0033353) |
| 0.2 | 1.7 | GO:0046475 | glycerophospholipid catabolic process(GO:0046475) |
| 0.2 | 0.5 | GO:0060151 | peroxisome localization(GO:0060151) microtubule-based peroxisome localization(GO:0060152) |
| 0.2 | 1.7 | GO:0006693 | prostanoid metabolic process(GO:0006692) prostaglandin metabolic process(GO:0006693) |
| 0.1 | 0.6 | GO:0072366 | positive regulation of gluconeogenesis by positive regulation of transcription from RNA polymerase II promoter(GO:0035948) regulation of cellular ketone metabolic process by positive regulation of transcription from RNA polymerase II promoter(GO:0072366) |
| 0.1 | 0.7 | GO:0046208 | spermine catabolic process(GO:0046208) |
| 0.1 | 2.1 | GO:0032196 | transposition(GO:0032196) |
| 0.1 | 0.4 | GO:0033499 | galactose catabolic process via UDP-galactose(GO:0033499) |
| 0.1 | 3.7 | GO:0009251 | polysaccharide catabolic process(GO:0000272) glycogen catabolic process(GO:0005980) glucan catabolic process(GO:0009251) cellular polysaccharide catabolic process(GO:0044247) |
| 0.1 | 5.0 | GO:0050672 | negative regulation of mononuclear cell proliferation(GO:0032945) negative regulation of lymphocyte proliferation(GO:0050672) |
| 0.1 | 1.3 | GO:0072540 | T-helper 17 cell lineage commitment(GO:0072540) |
| 0.1 | 1.2 | GO:0009437 | carnitine metabolic process(GO:0009437) |
| 0.1 | 0.6 | GO:1902255 | positive regulation of intrinsic apoptotic signaling pathway by p53 class mediator(GO:1902255) |
| 0.1 | 1.0 | GO:0009583 | detection of light stimulus(GO:0009583) |
| 0.1 | 1.8 | GO:0030517 | negative regulation of axon extension(GO:0030517) |
| 0.1 | 1.1 | GO:0010457 | centriole-centriole cohesion(GO:0010457) |
| 0.1 | 0.7 | GO:0086013 | membrane repolarization during cardiac muscle cell action potential(GO:0086013) |
| 0.1 | 2.0 | GO:0010633 | negative regulation of epithelial cell migration(GO:0010633) |
| 0.1 | 3.1 | GO:0015721 | bile acid and bile salt transport(GO:0015721) |
| 0.1 | 0.6 | GO:0060087 | relaxation of smooth muscle(GO:0044557) relaxation of vascular smooth muscle(GO:0060087) |
| 0.1 | 1.1 | GO:0070571 | negative regulation of axon regeneration(GO:0048681) negative regulation of neuron projection regeneration(GO:0070571) |
| 0.1 | 2.2 | GO:0007035 | vacuolar acidification(GO:0007035) |
| 0.1 | 1.9 | GO:0034505 | tooth mineralization(GO:0034505) |
| 0.1 | 0.7 | GO:0090037 | positive regulation of protein kinase C signaling(GO:0090037) |
| 0.1 | 0.3 | GO:0070459 | prolactin secretion(GO:0070459) |
| 0.1 | 0.1 | GO:0003072 | regulation of blood vessel size by renin-angiotensin(GO:0002034) renal control of peripheral vascular resistance involved in regulation of systemic arterial blood pressure(GO:0003072) |
| 0.1 | 3.4 | GO:0071108 | protein K48-linked deubiquitination(GO:0071108) |
| 0.1 | 0.5 | GO:0009138 | pyrimidine nucleoside diphosphate metabolic process(GO:0009138) ribonucleoside diphosphate catabolic process(GO:0009191) |
| 0.1 | 2.1 | GO:0045744 | negative regulation of G-protein coupled receptor protein signaling pathway(GO:0045744) |
| 0.1 | 3.1 | GO:0050771 | negative regulation of axonogenesis(GO:0050771) |
| 0.1 | 0.5 | GO:0002291 | T cell activation via T cell receptor contact with antigen bound to MHC molecule on antigen presenting cell(GO:0002291) |
| 0.1 | 0.4 | GO:0097350 | neutrophil clearance(GO:0097350) |
| 0.1 | 0.9 | GO:0035860 | glial cell-derived neurotrophic factor receptor signaling pathway(GO:0035860) |
| 0.1 | 0.8 | GO:0008090 | retrograde axonal transport(GO:0008090) |
| 0.1 | 1.2 | GO:0090140 | regulation of mitochondrial fission(GO:0090140) |
| 0.1 | 3.0 | GO:0043550 | regulation of lipid kinase activity(GO:0043550) |
| 0.1 | 0.3 | GO:0009106 | lipoate metabolic process(GO:0009106) |
| 0.1 | 2.1 | GO:0046928 | regulation of neurotransmitter secretion(GO:0046928) |
| 0.1 | 0.3 | GO:1901490 | regulation of lymphangiogenesis(GO:1901490) |
| 0.1 | 0.9 | GO:0032218 | riboflavin transport(GO:0032218) |
| 0.1 | 0.6 | GO:0044806 | G-quadruplex DNA unwinding(GO:0044806) |
| 0.1 | 0.3 | GO:0072538 | T-helper 17 type immune response(GO:0072538) T-helper 17 cell differentiation(GO:0072539) |
| 0.1 | 0.4 | GO:0034729 | histone H3-K79 methylation(GO:0034729) |
| 0.1 | 2.1 | GO:0021954 | central nervous system neuron development(GO:0021954) |
| 0.1 | 0.6 | GO:0035630 | trophectodermal cell proliferation(GO:0001834) negative regulation of smooth muscle cell apoptotic process(GO:0034392) bone mineralization involved in bone maturation(GO:0035630) negative regulation of oocyte development(GO:0060283) regulation of trophectodermal cell proliferation(GO:1904073) positive regulation of trophectodermal cell proliferation(GO:1904075) |
| 0.1 | 1.1 | GO:1902018 | negative regulation of cilium assembly(GO:1902018) |
| 0.1 | 0.1 | GO:0061056 | sclerotome development(GO:0061056) |
| 0.1 | 0.5 | GO:0048318 | protein O-linked glycosylation via serine(GO:0018242) axial mesoderm development(GO:0048318) |
| 0.1 | 0.5 | GO:0016048 | detection of temperature stimulus(GO:0016048) |
| 0.1 | 0.7 | GO:0038063 | collagen-activated tyrosine kinase receptor signaling pathway(GO:0038063) |
| 0.1 | 1.0 | GO:0016226 | iron-sulfur cluster assembly(GO:0016226) metallo-sulfur cluster assembly(GO:0031163) |
| 0.1 | 1.1 | GO:0010756 | positive regulation of plasminogen activation(GO:0010756) |
| 0.1 | 1.8 | GO:0048854 | brain morphogenesis(GO:0048854) |
| 0.1 | 1.2 | GO:0018026 | peptidyl-lysine monomethylation(GO:0018026) |
| 0.1 | 0.3 | GO:0035864 | response to potassium ion(GO:0035864) |
| 0.1 | 0.6 | GO:0006013 | mannose metabolic process(GO:0006013) |
| 0.1 | 0.9 | GO:0016557 | peroxisome membrane biogenesis(GO:0016557) |
| 0.1 | 0.6 | GO:0001867 | complement activation, lectin pathway(GO:0001867) |
| 0.1 | 0.3 | GO:0090230 | regulation of centromere complex assembly(GO:0090230) regulation of kinetochore assembly(GO:0090234) |
| 0.1 | 0.6 | GO:0035457 | cellular response to interferon-alpha(GO:0035457) |
| 0.1 | 7.2 | GO:0044243 | multicellular organism catabolic process(GO:0044243) |
| 0.1 | 1.1 | GO:0045662 | negative regulation of myoblast differentiation(GO:0045662) |
| 0.1 | 1.1 | GO:0048240 | sperm capacitation(GO:0048240) |
| 0.1 | 2.3 | GO:0008535 | respiratory chain complex IV assembly(GO:0008535) |
| 0.1 | 3.6 | GO:0050918 | positive chemotaxis(GO:0050918) |
| 0.1 | 4.1 | GO:0019933 | cAMP-mediated signaling(GO:0019933) |
| 0.1 | 2.7 | GO:0010107 | potassium ion import(GO:0010107) |
| 0.1 | 2.7 | GO:0098743 | cell aggregation(GO:0098743) |
| 0.1 | 0.6 | GO:0006050 | mannosamine metabolic process(GO:0006050) N-acetylmannosamine metabolic process(GO:0006051) |
| 0.1 | 0.2 | GO:0060287 | epithelial cilium movement involved in determination of left/right asymmetry(GO:0060287) |
| 0.1 | 0.6 | GO:0007000 | nucleolus organization(GO:0007000) |
| 0.1 | 0.8 | GO:0007175 | negative regulation of epidermal growth factor-activated receptor activity(GO:0007175) |
| 0.1 | 0.6 | GO:0035095 | behavioral response to nicotine(GO:0035095) |
| 0.1 | 1.1 | GO:0051683 | establishment of Golgi localization(GO:0051683) |
| 0.1 | 3.1 | GO:0051965 | positive regulation of synapse assembly(GO:0051965) |
| 0.1 | 0.1 | GO:0002326 | B cell lineage commitment(GO:0002326) |
| 0.1 | 0.3 | GO:0045077 | negative regulation of interferon-gamma biosynthetic process(GO:0045077) |
| 0.1 | 1.6 | GO:0061049 | physiological muscle hypertrophy(GO:0003298) physiological cardiac muscle hypertrophy(GO:0003301) cell growth involved in cardiac muscle cell development(GO:0061049) |
| 0.1 | 0.5 | GO:0097461 | ferric iron import(GO:0033216) ferric iron import into cell(GO:0097461) ferric iron import across plasma membrane(GO:0098706) |
| 0.1 | 0.4 | GO:0071107 | response to parathyroid hormone(GO:0071107) |
| 0.1 | 0.7 | GO:0048821 | erythrocyte development(GO:0048821) |
| 0.1 | 0.9 | GO:0005513 | detection of calcium ion(GO:0005513) |
| 0.1 | 0.4 | GO:0055059 | asymmetric neuroblast division(GO:0055059) |
| 0.1 | 1.7 | GO:0019233 | sensory perception of pain(GO:0019233) |
| 0.1 | 0.7 | GO:1901223 | negative regulation of NIK/NF-kappaB signaling(GO:1901223) |
| 0.1 | 0.2 | GO:1901318 | negative regulation of sperm motility(GO:1901318) |
| 0.1 | 0.7 | GO:0007194 | negative regulation of adenylate cyclase activity(GO:0007194) |
| 0.1 | 0.3 | GO:0043931 | ossification involved in bone maturation(GO:0043931) |
| 0.1 | 0.2 | GO:0018101 | protein citrullination(GO:0018101) histone citrullination(GO:0036414) |
| 0.1 | 0.5 | GO:2000251 | positive regulation of actin cytoskeleton reorganization(GO:2000251) |
| 0.1 | 0.2 | GO:1901053 | sarcosine metabolic process(GO:1901052) sarcosine catabolic process(GO:1901053) |
| 0.1 | 3.3 | GO:1903779 | regulation of cardiac conduction(GO:1903779) |
| 0.1 | 0.3 | GO:0060010 | Sertoli cell fate commitment(GO:0060010) |
| 0.1 | 1.4 | GO:0060976 | coronary vasculature development(GO:0060976) |
| 0.1 | 2.2 | GO:0050853 | B cell receptor signaling pathway(GO:0050853) |
| 0.1 | 0.5 | GO:0015812 | gamma-aminobutyric acid transport(GO:0015812) |
| 0.1 | 1.4 | GO:0042501 | serine phosphorylation of STAT protein(GO:0042501) |
| 0.1 | 0.4 | GO:0033623 | regulation of integrin activation(GO:0033623) |
| 0.1 | 0.4 | GO:0010842 | retina layer formation(GO:0010842) |
| 0.1 | 0.4 | GO:0036315 | cellular response to sterol(GO:0036315) |
| 0.1 | 3.9 | GO:0035305 | negative regulation of dephosphorylation(GO:0035305) negative regulation of protein dephosphorylation(GO:0035308) |
| 0.1 | 1.0 | GO:0008214 | protein demethylation(GO:0006482) protein dealkylation(GO:0008214) |
| 0.1 | 1.2 | GO:0018146 | keratan sulfate biosynthetic process(GO:0018146) |
| 0.1 | 0.3 | GO:0002644 | negative regulation of tolerance induction(GO:0002644) |
| 0.1 | 0.5 | GO:0046640 | regulation of alpha-beta T cell proliferation(GO:0046640) |
| 0.1 | 0.3 | GO:0001912 | positive regulation of leukocyte mediated cytotoxicity(GO:0001912) |
| 0.1 | 0.5 | GO:0035640 | exploration behavior(GO:0035640) |
| 0.1 | 1.3 | GO:0045670 | regulation of osteoclast differentiation(GO:0045670) |
| 0.1 | 0.8 | GO:0032958 | inositol phosphate biosynthetic process(GO:0032958) |
| 0.1 | 3.1 | GO:0007188 | adenylate cyclase-modulating G-protein coupled receptor signaling pathway(GO:0007188) |
| 0.1 | 1.6 | GO:0048041 | cell-substrate adherens junction assembly(GO:0007045) focal adhesion assembly(GO:0048041) |
| 0.1 | 0.3 | GO:0035855 | megakaryocyte development(GO:0035855) |
| 0.0 | 0.4 | GO:0060856 | establishment of blood-brain barrier(GO:0060856) |
| 0.0 | 0.1 | GO:0032769 | negative regulation of monooxygenase activity(GO:0032769) negative regulation of nitric-oxide synthase activity(GO:0051001) |
| 0.0 | 0.4 | GO:0035331 | negative regulation of hippo signaling(GO:0035331) |
| 0.0 | 0.9 | GO:0009083 | branched-chain amino acid catabolic process(GO:0009083) |
| 0.0 | 0.2 | GO:0034088 | maintenance of sister chromatid cohesion(GO:0034086) maintenance of mitotic sister chromatid cohesion(GO:0034088) |
| 0.0 | 0.6 | GO:0016558 | protein import into peroxisome matrix(GO:0016558) |
| 0.0 | 4.9 | GO:0035023 | regulation of Rho protein signal transduction(GO:0035023) |
| 0.0 | 1.5 | GO:0002088 | lens development in camera-type eye(GO:0002088) |
| 0.0 | 0.4 | GO:0034379 | very-low-density lipoprotein particle assembly(GO:0034379) |
| 0.0 | 3.2 | GO:0090630 | activation of GTPase activity(GO:0090630) |
| 0.0 | 0.2 | GO:0003360 | brainstem development(GO:0003360) |
| 0.0 | 0.2 | GO:0060292 | long term synaptic depression(GO:0060292) |
| 0.0 | 0.7 | GO:0039703 | viral RNA genome replication(GO:0039694) RNA replication(GO:0039703) |
| 0.0 | 0.2 | GO:0006657 | CDP-choline pathway(GO:0006657) |
| 0.0 | 0.0 | GO:0019249 | lactate biosynthetic process(GO:0019249) |
| 0.0 | 0.8 | GO:0050919 | negative chemotaxis(GO:0050919) |
| 0.0 | 0.1 | GO:0032331 | negative regulation of chondrocyte differentiation(GO:0032331) |
| 0.0 | 0.3 | GO:0046135 | pyrimidine nucleoside catabolic process(GO:0046135) |
| 0.0 | 0.3 | GO:0098868 | endochondral bone growth(GO:0003416) bone growth(GO:0098868) |
| 0.0 | 0.4 | GO:0090084 | negative regulation of inclusion body assembly(GO:0090084) |
| 0.0 | 0.3 | GO:0042104 | positive regulation of activated T cell proliferation(GO:0042104) |
| 0.0 | 0.1 | GO:0030157 | pancreatic juice secretion(GO:0030157) |
| 0.0 | 0.1 | GO:0035093 | spermatogenesis, exchange of chromosomal proteins(GO:0035093) |
| 0.0 | 0.1 | GO:0015820 | branched-chain amino acid transport(GO:0015803) leucine transport(GO:0015820) |
| 0.0 | 0.0 | GO:0016999 | antibiotic metabolic process(GO:0016999) |
| 0.0 | 0.1 | GO:1900078 | positive regulation of cellular response to insulin stimulus(GO:1900078) |
| 0.0 | 0.2 | GO:1902001 | fatty acid transmembrane transport(GO:1902001) |
| 0.0 | 0.1 | GO:0006681 | galactosylceramide metabolic process(GO:0006681) |
| 0.0 | 0.3 | GO:0007274 | neuromuscular synaptic transmission(GO:0007274) |
| 0.0 | 0.1 | GO:0007187 | G-protein coupled receptor signaling pathway, coupled to cyclic nucleotide second messenger(GO:0007187) |
| 0.0 | 0.1 | GO:0042136 | neurotransmitter biosynthetic process(GO:0042136) |
| 0.0 | 0.1 | GO:0090383 | phagosome acidification(GO:0090383) |
Gene overrepresentation in cellular component category:
| Log-likelihood per target | Total log-likelihood | Term | Description |
|---|---|---|---|
| 6.7 | 20.1 | GO:0098843 | postsynaptic endocytic zone(GO:0098843) |
| 5.5 | 44.2 | GO:0060199 | clathrin-sculpted glutamate transport vesicle(GO:0060199) clathrin-sculpted glutamate transport vesicle membrane(GO:0060203) |
| 5.5 | 5.5 | GO:0019034 | viral replication complex(GO:0019034) |
| 5.3 | 69.5 | GO:0098647 | collagen type VI trimer(GO:0005589) collagen beaded filament(GO:0098647) |
| 4.4 | 66.3 | GO:0097418 | neurofibrillary tangle(GO:0097418) |
| 4.0 | 8.0 | GO:0070032 | synaptobrevin 2-SNAP-25-syntaxin-1a-complexin I complex(GO:0070032) |
| 3.8 | 15.4 | GO:0031838 | haptoglobin-hemoglobin complex(GO:0031838) |
| 3.7 | 11.2 | GO:0070931 | Golgi-associated vesicle lumen(GO:0070931) |
| 3.7 | 58.6 | GO:0097512 | cardiac myofibril(GO:0097512) |
| 3.1 | 18.7 | GO:0033269 | internode region of axon(GO:0033269) |
| 3.1 | 24.7 | GO:0044327 | dendritic spine head(GO:0044327) |
| 2.9 | 5.8 | GO:0071748 | IgA immunoglobulin complex(GO:0071745) IgA immunoglobulin complex, circulating(GO:0071746) monomeric IgA immunoglobulin complex(GO:0071748) polymeric IgA immunoglobulin complex(GO:0071749) dimeric IgA immunoglobulin complex(GO:0071750) secretory IgA immunoglobulin complex(GO:0071751) secretory dimeric IgA immunoglobulin complex(GO:0071752) |
| 2.8 | 8.4 | GO:0090571 | RNA polymerase II transcription repressor complex(GO:0090571) |
| 2.7 | 8.2 | GO:0071754 | IgM immunoglobulin complex(GO:0071753) IgM immunoglobulin complex, circulating(GO:0071754) pentameric IgM immunoglobulin complex(GO:0071756) |
| 2.7 | 127.7 | GO:0042571 | immunoglobulin complex, circulating(GO:0042571) |
| 2.5 | 12.5 | GO:0097454 | Schwann cell microvillus(GO:0097454) |
| 2.5 | 61.5 | GO:0001518 | voltage-gated sodium channel complex(GO:0001518) |
| 2.2 | 6.7 | GO:0045298 | tubulin complex(GO:0045298) |
| 2.1 | 10.6 | GO:0001652 | granular component(GO:0001652) |
| 2.1 | 10.5 | GO:0048787 | presynaptic active zone membrane(GO:0048787) |
| 2.1 | 10.4 | GO:0005947 | mitochondrial alpha-ketoglutarate dehydrogenase complex(GO:0005947) |
| 2.0 | 8.0 | GO:0005602 | complement component C1 complex(GO:0005602) |
| 1.8 | 23.9 | GO:0005833 | hemoglobin complex(GO:0005833) |
| 1.8 | 7.1 | GO:0071546 | pi-body(GO:0071546) |
| 1.8 | 5.3 | GO:0099569 | cytoskeleton of presynaptic active zone(GO:0048788) presynaptic active zone cytoplasmic component(GO:0098831) presynaptic cytoskeleton(GO:0099569) |
| 1.8 | 12.4 | GO:0045240 | dihydrolipoyl dehydrogenase complex(GO:0045240) |
| 1.7 | 8.7 | GO:0072534 | perineuronal net(GO:0072534) |
| 1.7 | 9.9 | GO:0005879 | axonemal microtubule(GO:0005879) |
| 1.6 | 6.6 | GO:0002945 | cyclin K-CDK13 complex(GO:0002945) |
| 1.6 | 4.9 | GO:1990597 | AIP1-IRE1 complex(GO:1990597) |
| 1.6 | 19.5 | GO:0005858 | axonemal dynein complex(GO:0005858) |
| 1.6 | 17.1 | GO:0033010 | paranodal junction(GO:0033010) |
| 1.5 | 20.4 | GO:0043083 | synaptic cleft(GO:0043083) |
| 1.4 | 20.2 | GO:0048188 | Set1C/COMPASS complex(GO:0048188) |
| 1.4 | 2.8 | GO:0061200 | clathrin-sculpted gamma-aminobutyric acid transport vesicle(GO:0061200) clathrin-sculpted gamma-aminobutyric acid transport vesicle membrane(GO:0061202) |
| 1.4 | 7.0 | GO:0071458 | integral component of cytoplasmic side of endoplasmic reticulum membrane(GO:0071458) |
| 1.4 | 21.0 | GO:0033270 | paranode region of axon(GO:0033270) |
| 1.4 | 5.5 | GO:0000801 | central element(GO:0000801) |
| 1.4 | 9.5 | GO:1990130 | Iml1 complex(GO:1990130) |
| 1.3 | 8.0 | GO:0032437 | cuticular plate(GO:0032437) |
| 1.3 | 4.0 | GO:0009328 | phenylalanine-tRNA ligase complex(GO:0009328) |
| 1.3 | 2.6 | GO:0097025 | MPP7-DLG1-LIN7 complex(GO:0097025) |
| 1.3 | 3.9 | GO:0014802 | terminal cisterna(GO:0014802) |
| 1.3 | 3.9 | GO:0016938 | kinesin I complex(GO:0016938) |
| 1.3 | 11.7 | GO:1990761 | growth cone lamellipodium(GO:1990761) |
| 1.3 | 2.6 | GO:0043159 | acrosomal matrix(GO:0043159) |
| 1.2 | 6.0 | GO:0031302 | intrinsic component of endosome membrane(GO:0031302) |
| 1.2 | 3.6 | GO:0045323 | interleukin-1 receptor complex(GO:0045323) |
| 1.2 | 7.1 | GO:1990769 | proximal neuron projection(GO:1990769) |
| 1.2 | 52.9 | GO:0048786 | presynaptic active zone(GO:0048786) |
| 1.2 | 5.8 | GO:0032280 | symmetric synapse(GO:0032280) |
| 1.1 | 1.1 | GO:0034666 | integrin alpha2-beta1 complex(GO:0034666) |
| 1.1 | 12.1 | GO:0042105 | alpha-beta T cell receptor complex(GO:0042105) |
| 1.1 | 19.3 | GO:0005922 | connexon complex(GO:0005922) |
| 1.1 | 8.5 | GO:1903439 | calcitonin family receptor complex(GO:1903439) amylin receptor complex(GO:1903440) |
| 1.0 | 16.4 | GO:0005890 | sodium:potassium-exchanging ATPase complex(GO:0005890) |
| 1.0 | 18.1 | GO:0031089 | platelet dense granule lumen(GO:0031089) |
| 1.0 | 3.0 | GO:0030485 | smooth muscle contractile fiber(GO:0030485) |
| 1.0 | 2.9 | GO:0070701 | mucus layer(GO:0070701) |
| 1.0 | 3.8 | GO:0005965 | protein farnesyltransferase complex(GO:0005965) |
| 1.0 | 12.4 | GO:0030897 | HOPS complex(GO:0030897) |
| 0.9 | 8.5 | GO:0071953 | elastic fiber(GO:0071953) |
| 0.9 | 1.9 | GO:0044214 | spanning component of plasma membrane(GO:0044214) spanning component of membrane(GO:0089717) |
| 0.9 | 6.5 | GO:1990452 | Parkin-FBXW7-Cul1 ubiquitin ligase complex(GO:1990452) |
| 0.9 | 13.7 | GO:0008328 | ionotropic glutamate receptor complex(GO:0008328) neurotransmitter receptor complex(GO:0098878) |
| 0.9 | 4.6 | GO:0036128 | CatSper complex(GO:0036128) |
| 0.9 | 4.5 | GO:0002080 | acrosomal membrane(GO:0002080) |
| 0.9 | 1.8 | GO:0036024 | protein C inhibitor-TMPRSS7 complex(GO:0036024) protein C inhibitor-TMPRSS11E complex(GO:0036025) protein C inhibitor-PLAT complex(GO:0036026) protein C inhibitor-PLAU complex(GO:0036027) protein C inhibitor-thrombin complex(GO:0036028) protein C inhibitor-KLK3 complex(GO:0036029) protein C inhibitor-plasma kallikrein complex(GO:0036030) serine protease inhibitor complex(GO:0097180) protein C inhibitor-coagulation factor V complex(GO:0097181) protein C inhibitor-coagulation factor Xa complex(GO:0097182) protein C inhibitor-coagulation factor XI complex(GO:0097183) |
| 0.9 | 5.3 | GO:0034751 | aryl hydrocarbon receptor complex(GO:0034751) |
| 0.9 | 2.6 | GO:0005944 | phosphatidylinositol 3-kinase complex, class IB(GO:0005944) |
| 0.9 | 3.5 | GO:0016600 | flotillin complex(GO:0016600) |
| 0.9 | 24.2 | GO:0034364 | high-density lipoprotein particle(GO:0034364) |
| 0.9 | 34.3 | GO:1902711 | GABA-A receptor complex(GO:1902711) |
| 0.9 | 3.4 | GO:0034685 | integrin alphav-beta6 complex(GO:0034685) |
| 0.8 | 2.5 | GO:0031933 | telomeric heterochromatin(GO:0031933) |
| 0.8 | 10.9 | GO:0099634 | postsynaptic specialization membrane(GO:0099634) |
| 0.8 | 11.5 | GO:0097433 | dense body(GO:0097433) |
| 0.8 | 5.6 | GO:0042406 | extrinsic component of endoplasmic reticulum membrane(GO:0042406) |
| 0.8 | 16.0 | GO:0032809 | neuronal cell body membrane(GO:0032809) cell body membrane(GO:0044298) |
| 0.8 | 4.8 | GO:0005594 | collagen type IX trimer(GO:0005594) |
| 0.8 | 5.5 | GO:0097209 | epidermal lamellar body(GO:0097209) |
| 0.8 | 11.9 | GO:0031083 | BLOC-1 complex(GO:0031083) |
| 0.8 | 3.1 | GO:0030895 | apolipoprotein B mRNA editing enzyme complex(GO:0030895) |
| 0.8 | 3.9 | GO:0000836 | ER ubiquitin ligase complex(GO:0000835) Hrd1p ubiquitin ligase complex(GO:0000836) |
| 0.8 | 17.0 | GO:0014731 | spectrin-associated cytoskeleton(GO:0014731) |
| 0.8 | 1.5 | GO:0001939 | female pronucleus(GO:0001939) |
| 0.7 | 13.7 | GO:0001931 | uropod(GO:0001931) cell trailing edge(GO:0031254) |
| 0.7 | 2.1 | GO:0044609 | DBIRD complex(GO:0044609) |
| 0.7 | 107.9 | GO:0072562 | blood microparticle(GO:0072562) |
| 0.7 | 3.5 | GO:0089701 | U2AF(GO:0089701) |
| 0.7 | 6.2 | GO:0000813 | ESCRT I complex(GO:0000813) |
| 0.7 | 4.8 | GO:0097425 | smooth endoplasmic reticulum membrane(GO:0030868) smooth endoplasmic reticulum part(GO:0097425) |
| 0.7 | 5.5 | GO:0034464 | BBSome(GO:0034464) |
| 0.7 | 13.6 | GO:0016342 | catenin complex(GO:0016342) |
| 0.7 | 2.0 | GO:0097165 | nuclear stress granule(GO:0097165) |
| 0.7 | 5.3 | GO:0035976 | AP1 complex(GO:0035976) |
| 0.7 | 45.8 | GO:0030672 | synaptic vesicle membrane(GO:0030672) exocytic vesicle membrane(GO:0099501) |
| 0.7 | 7.2 | GO:0098651 | basement membrane collagen trimer(GO:0098651) |
| 0.6 | 46.0 | GO:0005834 | heterotrimeric G-protein complex(GO:0005834) |
| 0.6 | 5.1 | GO:0030478 | actin cap(GO:0030478) |
| 0.6 | 1.3 | GO:0030981 | cortical microtubule cytoskeleton(GO:0030981) |
| 0.6 | 11.7 | GO:0042613 | MHC class II protein complex(GO:0042613) |
| 0.6 | 9.6 | GO:0045277 | respiratory chain complex IV(GO:0045277) |
| 0.6 | 1.8 | GO:0060987 | lipid tube(GO:0060987) |
| 0.6 | 2.4 | GO:1990393 | 3M complex(GO:1990393) |
| 0.6 | 1.7 | GO:0016939 | kinesin II complex(GO:0016939) |
| 0.5 | 2.7 | GO:1990031 | pinceau fiber(GO:1990031) |
| 0.5 | 34.4 | GO:0005891 | voltage-gated calcium channel complex(GO:0005891) |
| 0.5 | 6.5 | GO:0032591 | dendritic spine membrane(GO:0032591) |
| 0.5 | 41.1 | GO:0042734 | presynaptic membrane(GO:0042734) |
| 0.5 | 22.5 | GO:0001917 | photoreceptor inner segment(GO:0001917) |
| 0.5 | 9.4 | GO:0005801 | cis-Golgi network(GO:0005801) |
| 0.5 | 4.6 | GO:0005672 | transcription factor TFIIA complex(GO:0005672) |
| 0.5 | 11.6 | GO:0030673 | axolemma(GO:0030673) |
| 0.5 | 6.0 | GO:0097427 | microtubule bundle(GO:0097427) |
| 0.5 | 5.5 | GO:0000786 | nucleosome(GO:0000786) |
| 0.5 | 43.5 | GO:0005604 | basement membrane(GO:0005604) |
| 0.5 | 2.5 | GO:0014701 | junctional sarcoplasmic reticulum membrane(GO:0014701) |
| 0.5 | 3.5 | GO:0032010 | phagolysosome(GO:0032010) |
| 0.5 | 4.4 | GO:0097413 | Lewy body(GO:0097413) |
| 0.5 | 4.4 | GO:0042788 | polysomal ribosome(GO:0042788) |
| 0.5 | 1.4 | GO:0000333 | telomerase catalytic core complex(GO:0000333) |
| 0.5 | 1.9 | GO:0032144 | 4-aminobutyrate transaminase complex(GO:0032144) |
| 0.5 | 6.1 | GO:0044853 | plasma membrane raft(GO:0044853) |
| 0.5 | 2.3 | GO:0031673 | H zone(GO:0031673) |
| 0.5 | 5.9 | GO:0031209 | SCAR complex(GO:0031209) |
| 0.4 | 20.1 | GO:0001533 | cornified envelope(GO:0001533) |
| 0.4 | 4.9 | GO:0031045 | dense core granule(GO:0031045) |
| 0.4 | 124.2 | GO:0060076 | excitatory synapse(GO:0060076) |
| 0.4 | 1.3 | GO:0044447 | axoneme part(GO:0044447) |
| 0.4 | 3.0 | GO:1990635 | proximal dendrite(GO:1990635) |
| 0.4 | 4.3 | GO:0005581 | collagen trimer(GO:0005581) |
| 0.4 | 6.3 | GO:0031235 | intrinsic component of the cytoplasmic side of the plasma membrane(GO:0031235) |
| 0.4 | 3.8 | GO:0035253 | ciliary rootlet(GO:0035253) |
| 0.4 | 4.1 | GO:0030123 | AP-3 adaptor complex(GO:0030123) |
| 0.4 | 1.6 | GO:0000818 | nuclear MIS12/MIND complex(GO:0000818) |
| 0.4 | 4.9 | GO:0042622 | photoreceptor outer segment membrane(GO:0042622) |
| 0.4 | 8.1 | GO:0016471 | vacuolar proton-transporting V-type ATPase complex(GO:0016471) |
| 0.4 | 1.6 | GO:0097513 | myosin II filament(GO:0097513) |
| 0.4 | 2.3 | GO:0070852 | cell body fiber(GO:0070852) |
| 0.4 | 8.5 | GO:0034704 | calcium channel complex(GO:0034704) |
| 0.4 | 1.5 | GO:0034669 | integrin alpha4-beta7 complex(GO:0034669) |
| 0.4 | 1.5 | GO:1990356 | sumoylated E2 ligase complex(GO:1990356) |
| 0.4 | 12.0 | GO:0042629 | mast cell granule(GO:0042629) |
| 0.4 | 7.1 | GO:0036038 | MKS complex(GO:0036038) |
| 0.4 | 0.7 | GO:0000506 | glycosylphosphatidylinositol-N-acetylglucosaminyltransferase (GPI-GnT) complex(GO:0000506) |
| 0.4 | 13.3 | GO:0031228 | intrinsic component of Golgi membrane(GO:0031228) |
| 0.4 | 3.6 | GO:0005964 | phosphorylase kinase complex(GO:0005964) |
| 0.4 | 23.5 | GO:0005796 | Golgi lumen(GO:0005796) |
| 0.4 | 8.6 | GO:0034358 | plasma lipoprotein particle(GO:0034358) lipoprotein particle(GO:1990777) |
| 0.3 | 4.2 | GO:0030126 | COPI vesicle coat(GO:0030126) |
| 0.3 | 1.4 | GO:0044322 | endoplasmic reticulum quality control compartment(GO:0044322) |
| 0.3 | 2.0 | GO:0070545 | PeBoW complex(GO:0070545) |
| 0.3 | 4.1 | GO:0036454 | insulin-like growth factor binding protein complex(GO:0016942) growth factor complex(GO:0036454) |
| 0.3 | 1.4 | GO:0033596 | TSC1-TSC2 complex(GO:0033596) |
| 0.3 | 2.7 | GO:0043194 | axon initial segment(GO:0043194) |
| 0.3 | 2.0 | GO:0033553 | rDNA heterochromatin(GO:0033553) |
| 0.3 | 4.9 | GO:0008074 | guanylate cyclase complex, soluble(GO:0008074) |
| 0.3 | 3.3 | GO:0043198 | dendritic shaft(GO:0043198) |
| 0.3 | 5.4 | GO:0030992 | intraciliary transport particle B(GO:0030992) |
| 0.3 | 1.3 | GO:0032777 | Piccolo NuA4 histone acetyltransferase complex(GO:0032777) |
| 0.3 | 2.2 | GO:0060091 | kinocilium(GO:0060091) |
| 0.3 | 1.2 | GO:0005968 | Rab-protein geranylgeranyltransferase complex(GO:0005968) |
| 0.3 | 0.9 | GO:0098536 | deuterosome(GO:0098536) |
| 0.3 | 4.7 | GO:0030914 | STAGA complex(GO:0030914) |
| 0.3 | 43.6 | GO:0030427 | site of polarized growth(GO:0030427) |
| 0.3 | 0.9 | GO:0072536 | interleukin-23 receptor complex(GO:0072536) |
| 0.3 | 77.2 | GO:0005578 | proteinaceous extracellular matrix(GO:0005578) |
| 0.3 | 9.7 | GO:0009925 | basal plasma membrane(GO:0009925) |
| 0.3 | 6.8 | GO:0097546 | ciliary base(GO:0097546) |
| 0.3 | 1.7 | GO:0005967 | mitochondrial pyruvate dehydrogenase complex(GO:0005967) |
| 0.3 | 12.5 | GO:0014704 | intercalated disc(GO:0014704) |
| 0.3 | 1.1 | GO:1990879 | CST complex(GO:1990879) |
| 0.3 | 3.0 | GO:0042101 | T cell receptor complex(GO:0042101) |
| 0.3 | 2.9 | GO:0042587 | glycogen granule(GO:0042587) |
| 0.3 | 4.8 | GO:0032391 | photoreceptor connecting cilium(GO:0032391) |
| 0.3 | 1.8 | GO:0031588 | nucleotide-activated protein kinase complex(GO:0031588) |
| 0.3 | 1.8 | GO:1990745 | EARP complex(GO:1990745) |
| 0.3 | 1.8 | GO:0036021 | endolysosome lumen(GO:0036021) |
| 0.2 | 6.4 | GO:0032420 | stereocilium(GO:0032420) |
| 0.2 | 4.4 | GO:0005952 | cAMP-dependent protein kinase complex(GO:0005952) |
| 0.2 | 2.9 | GO:0097539 | ciliary transition fiber(GO:0097539) |
| 0.2 | 1.2 | GO:0031205 | endoplasmic reticulum Sec complex(GO:0031205) |
| 0.2 | 3.0 | GO:0097225 | sperm midpiece(GO:0097225) |
| 0.2 | 2.6 | GO:0097440 | apical dendrite(GO:0097440) |
| 0.2 | 0.7 | GO:0000805 | X chromosome(GO:0000805) |
| 0.2 | 26.1 | GO:0032587 | ruffle membrane(GO:0032587) |
| 0.2 | 0.9 | GO:0045180 | basal cortex(GO:0045180) |
| 0.2 | 0.6 | GO:0005760 | gamma DNA polymerase complex(GO:0005760) |
| 0.2 | 1.3 | GO:0033391 | chromatoid body(GO:0033391) |
| 0.2 | 0.2 | GO:0042612 | MHC class I protein complex(GO:0042612) |
| 0.2 | 1.2 | GO:0002177 | manchette(GO:0002177) |
| 0.2 | 0.4 | GO:1990682 | CSF1-CSF1R complex(GO:1990682) |
| 0.2 | 27.6 | GO:0031225 | anchored component of membrane(GO:0031225) |
| 0.2 | 0.8 | GO:1990578 | perinuclear endoplasmic reticulum membrane(GO:1990578) |
| 0.2 | 1.4 | GO:0044666 | MLL3/4 complex(GO:0044666) |
| 0.2 | 21.0 | GO:0005923 | bicellular tight junction(GO:0005923) |
| 0.2 | 1.8 | GO:0001741 | XY body(GO:0001741) |
| 0.2 | 0.8 | GO:0030061 | mitochondrial crista(GO:0030061) |
| 0.2 | 2.3 | GO:0043240 | Fanconi anaemia nuclear complex(GO:0043240) |
| 0.2 | 5.4 | GO:0031093 | platelet alpha granule lumen(GO:0031093) |
| 0.2 | 36.9 | GO:0030424 | axon(GO:0030424) |
| 0.2 | 1.5 | GO:0030870 | Mre11 complex(GO:0030870) |
| 0.2 | 2.6 | GO:0031906 | late endosome lumen(GO:0031906) |
| 0.2 | 7.0 | GO:0001772 | immunological synapse(GO:0001772) |
| 0.2 | 8.0 | GO:0019005 | SCF ubiquitin ligase complex(GO:0019005) |
| 0.2 | 0.5 | GO:0097637 | intrinsic component of autophagosome membrane(GO:0097636) integral component of autophagosome membrane(GO:0097637) |
| 0.2 | 3.2 | GO:0032839 | dendrite cytoplasm(GO:0032839) |
| 0.2 | 0.5 | GO:0030121 | AP-1 adaptor complex(GO:0030121) |
| 0.2 | 1.1 | GO:0060077 | inhibitory synapse(GO:0060077) |
| 0.2 | 1.9 | GO:0070449 | elongin complex(GO:0070449) |
| 0.2 | 1.7 | GO:0005845 | mRNA cap binding complex(GO:0005845) |
| 0.2 | 3.9 | GO:0031904 | endosome lumen(GO:0031904) |
| 0.2 | 1.7 | GO:0016328 | lateral plasma membrane(GO:0016328) |
| 0.2 | 192.6 | GO:0005615 | extracellular space(GO:0005615) |
| 0.2 | 1.2 | GO:0000137 | Golgi cis cisterna(GO:0000137) |
| 0.2 | 0.7 | GO:0070288 | intracellular ferritin complex(GO:0008043) ferritin complex(GO:0070288) |
| 0.2 | 2.3 | GO:0097381 | photoreceptor disc membrane(GO:0097381) |
| 0.2 | 2.6 | GO:0031229 | integral component of nuclear inner membrane(GO:0005639) intrinsic component of nuclear inner membrane(GO:0031229) nuclear membrane part(GO:0044453) |
| 0.2 | 0.5 | GO:0070081 | clathrin-sculpted monoamine transport vesicle(GO:0070081) clathrin-sculpted monoamine transport vesicle membrane(GO:0070083) |
| 0.1 | 21.3 | GO:0098793 | presynapse(GO:0098793) |
| 0.1 | 0.7 | GO:0042825 | MHC class I peptide loading complex(GO:0042824) TAP complex(GO:0042825) |
| 0.1 | 1.1 | GO:0070652 | HAUS complex(GO:0070652) |
| 0.1 | 3.3 | GO:0071565 | nBAF complex(GO:0071565) |
| 0.1 | 15.6 | GO:0055037 | recycling endosome(GO:0055037) |
| 0.1 | 4.5 | GO:0005902 | microvillus(GO:0005902) |
| 0.1 | 0.3 | GO:0035517 | PR-DUB complex(GO:0035517) |
| 0.1 | 1.0 | GO:0043020 | NADPH oxidase complex(GO:0043020) |
| 0.1 | 0.9 | GO:0032045 | guanyl-nucleotide exchange factor complex(GO:0032045) |
| 0.1 | 0.5 | GO:0000791 | euchromatin(GO:0000791) |
| 0.1 | 9.0 | GO:0045211 | postsynaptic membrane(GO:0045211) |
| 0.1 | 0.4 | GO:0032449 | CBM complex(GO:0032449) |
| 0.1 | 15.6 | GO:0016323 | basolateral plasma membrane(GO:0016323) |
| 0.1 | 0.9 | GO:0043190 | ATP-binding cassette (ABC) transporter complex(GO:0043190) |
| 0.1 | 0.5 | GO:0034687 | integrin alphaL-beta2 complex(GO:0034687) |
| 0.1 | 1.3 | GO:0000800 | lateral element(GO:0000800) |
| 0.1 | 0.5 | GO:0008282 | ATP-sensitive potassium channel complex(GO:0008282) |
| 0.1 | 1.0 | GO:0000242 | pericentriolar material(GO:0000242) |
| 0.1 | 0.2 | GO:0036398 | TCR signalosome(GO:0036398) |
| 0.1 | 0.1 | GO:0016514 | SWI/SNF complex(GO:0016514) |
| 0.1 | 300.8 | GO:0031224 | intrinsic component of membrane(GO:0031224) |
| 0.1 | 22.0 | GO:0000790 | nuclear chromatin(GO:0000790) |
| 0.1 | 0.7 | GO:1990907 | beta-catenin-TCF complex(GO:1990907) |
| 0.1 | 0.2 | GO:0001520 | outer dense fiber(GO:0001520) |
| 0.0 | 1.0 | GO:0000407 | pre-autophagosomal structure(GO:0000407) |
| 0.0 | 0.1 | GO:0042272 | nuclear RNA export factor complex(GO:0042272) |
| 0.0 | 1.0 | GO:0016234 | inclusion body(GO:0016234) |
| 0.0 | 0.2 | GO:0005942 | phosphatidylinositol 3-kinase complex(GO:0005942) |
| 0.0 | 0.1 | GO:0005683 | U7 snRNP(GO:0005683) |
Gene overrepresentation in molecular function category:
| Log-likelihood per target | Total log-likelihood | Term | Description |
|---|---|---|---|
| 10.9 | 43.8 | GO:0004667 | prostaglandin-D synthase activity(GO:0004667) |
| 5.9 | 17.8 | GO:0031687 | A2A adenosine receptor binding(GO:0031687) |
| 5.9 | 23.7 | GO:0035373 | chondroitin sulfate proteoglycan binding(GO:0035373) |
| 5.6 | 16.7 | GO:0070290 | N-acylphosphatidylethanolamine-specific phospholipase D activity(GO:0070290) |
| 4.9 | 19.7 | GO:0047192 | 1-alkylglycerophosphocholine O-acetyltransferase activity(GO:0047192) |
| 4.4 | 52.4 | GO:0008430 | selenium binding(GO:0008430) |
| 4.3 | 12.9 | GO:0005150 | interleukin-1, Type I receptor binding(GO:0005150) |
| 4.0 | 12.1 | GO:0019959 | interleukin-8 binding(GO:0019959) |
| 3.9 | 46.9 | GO:0019911 | structural constituent of myelin sheath(GO:0019911) |
| 3.8 | 11.3 | GO:0045322 | unmethylated CpG binding(GO:0045322) |
| 3.6 | 14.3 | GO:0004852 | uroporphyrinogen-III synthase activity(GO:0004852) |
| 3.5 | 14.2 | GO:0097001 | ceramide binding(GO:0097001) |
| 3.4 | 23.9 | GO:0030492 | hemoglobin binding(GO:0030492) |
| 3.2 | 15.9 | GO:0015319 | sodium:inorganic phosphate symporter activity(GO:0015319) |
| 3.0 | 9.0 | GO:0003863 | alpha-ketoacid dehydrogenase activity(GO:0003826) 3-methyl-2-oxobutanoate dehydrogenase (2-methylpropanoyl-transferring) activity(GO:0003863) |
| 2.9 | 11.5 | GO:0016639 | oxidoreductase activity, acting on the CH-NH2 group of donors, NAD or NADP as acceptor(GO:0016639) |
| 2.8 | 14.2 | GO:0000298 | endopolyphosphatase activity(GO:0000298) diphosphoinositol-polyphosphate diphosphatase activity(GO:0008486) bis(5'-adenosyl)-hexaphosphatase activity(GO:0034431) bis(5'-adenosyl)-pentaphosphatase activity(GO:0034432) inositol diphosphate tetrakisphosphate diphosphatase activity(GO:0052840) inositol bisdiphosphate tetrakisphosphate diphosphatase activity(GO:0052841) inositol diphosphate pentakisphosphate diphosphatase activity(GO:0052842) inositol-1-diphosphate-2,3,4,5,6-pentakisphosphate diphosphatase activity(GO:0052843) inositol-3-diphosphate-1,2,4,5,6-pentakisphosphate diphosphatase activity(GO:0052844) inositol-5-diphosphate-1,2,3,4,6-pentakisphosphate diphosphatase activity(GO:0052845) inositol-1,5-bisdiphosphate-2,3,4,6-tetrakisphosphate 1-diphosphatase activity(GO:0052846) inositol-1,5-bisdiphosphate-2,3,4,6-tetrakisphosphate 5-diphosphatase activity(GO:0052847) inositol-3,5-bisdiphosphate-2,3,4,6-tetrakisphosphate 5-diphosphatase activity(GO:0052848) |
| 2.8 | 22.4 | GO:0086006 | voltage-gated sodium channel activity involved in cardiac muscle cell action potential(GO:0086006) |
| 2.8 | 11.2 | GO:0008798 | beta-aspartyl-peptidase activity(GO:0008798) |
| 2.7 | 8.1 | GO:0005017 | platelet-derived growth factor-activated receptor activity(GO:0005017) |
| 2.7 | 2.7 | GO:0019834 | phospholipase A2 inhibitor activity(GO:0019834) |
| 2.7 | 40.2 | GO:1903136 | cuprous ion binding(GO:1903136) |
| 2.6 | 15.6 | GO:0086075 | gap junction channel activity involved in cardiac conduction electrical coupling(GO:0086075) |
| 2.5 | 52.8 | GO:0001011 | transcription factor activity, sequence-specific DNA binding, RNA polymerase recruiting(GO:0001011) transcription factor activity, TFIIB-class binding(GO:0001087) |
| 2.5 | 12.4 | GO:0004591 | oxoglutarate dehydrogenase (succinyl-transferring) activity(GO:0004591) |
| 2.3 | 138.7 | GO:0034987 | immunoglobulin receptor binding(GO:0034987) |
| 2.3 | 13.8 | GO:0005219 | ryanodine-sensitive calcium-release channel activity(GO:0005219) |
| 2.3 | 9.0 | GO:0000702 | oxidized base lesion DNA N-glycosylase activity(GO:0000702) |
| 2.1 | 2.1 | GO:0004031 | aldehyde oxidase activity(GO:0004031) |
| 2.1 | 29.8 | GO:0015501 | glutamate:sodium symporter activity(GO:0015501) |
| 2.1 | 10.5 | GO:0008889 | glycerophosphodiester phosphodiesterase activity(GO:0008889) |
| 2.1 | 6.3 | GO:0017153 | sodium:dicarboxylate symporter activity(GO:0017153) |
| 2.1 | 4.2 | GO:0015440 | peptide-transporting ATPase activity(GO:0015440) |
| 2.1 | 6.2 | GO:0035662 | Toll-like receptor 4 binding(GO:0035662) |
| 2.0 | 14.2 | GO:0050291 | sphingosine N-acyltransferase activity(GO:0050291) |
| 2.0 | 26.1 | GO:1990239 | steroid hormone binding(GO:1990239) |
| 2.0 | 59.1 | GO:0005212 | structural constituent of eye lens(GO:0005212) |
| 1.9 | 5.8 | GO:0033878 | hormone-sensitive lipase activity(GO:0033878) |
| 1.9 | 15.6 | GO:0004971 | AMPA glutamate receptor activity(GO:0004971) |
| 1.9 | 7.8 | GO:0004698 | calcium-dependent protein kinase C activity(GO:0004698) |
| 1.9 | 5.8 | GO:0016838 | carbon-oxygen lyase activity, acting on phosphates(GO:0016838) |
| 1.8 | 7.3 | GO:0052594 | tryptamine:oxygen oxidoreductase (deaminating) activity(GO:0052593) aminoacetone:oxygen oxidoreductase(deaminating) activity(GO:0052594) aliphatic-amine oxidase activity(GO:0052595) phenethylamine:oxygen oxidoreductase (deaminating) activity(GO:0052596) |
| 1.8 | 5.4 | GO:0032093 | SAM domain binding(GO:0032093) |
| 1.7 | 7.0 | GO:0015057 | thrombin receptor activity(GO:0015057) |
| 1.7 | 13.9 | GO:0015185 | gamma-aminobutyric acid:sodium symporter activity(GO:0005332) gamma-aminobutyric acid transmembrane transporter activity(GO:0015185) |
| 1.7 | 10.3 | GO:0047057 | oxidoreductase activity, acting on the CH-OH group of donors, disulfide as acceptor(GO:0016900) vitamin-K-epoxide reductase (warfarin-sensitive) activity(GO:0047057) |
| 1.7 | 39.3 | GO:0051787 | misfolded protein binding(GO:0051787) |
| 1.7 | 5.1 | GO:0016422 | rRNA (adenine-N6-)-methyltransferase activity(GO:0008988) mRNA (2'-O-methyladenosine-N6-)-methyltransferase activity(GO:0016422) |
| 1.7 | 5.0 | GO:0098519 | nucleotide phosphatase activity, acting on free nucleotides(GO:0098519) |
| 1.7 | 6.7 | GO:0070326 | very-low-density lipoprotein particle receptor binding(GO:0070326) |
| 1.6 | 54.9 | GO:0005086 | ARF guanyl-nucleotide exchange factor activity(GO:0005086) |
| 1.6 | 6.4 | GO:0061714 | folic acid receptor activity(GO:0061714) |
| 1.6 | 19.1 | GO:0005344 | oxygen transporter activity(GO:0005344) |
| 1.6 | 7.9 | GO:0042289 | MHC class II protein binding(GO:0042289) |
| 1.6 | 37.8 | GO:0033130 | acetylcholine receptor binding(GO:0033130) |
| 1.5 | 4.6 | GO:0030305 | heparanase activity(GO:0030305) |
| 1.5 | 6.1 | GO:0034041 | sterol-transporting ATPase activity(GO:0034041) |
| 1.5 | 38.5 | GO:0005248 | voltage-gated sodium channel activity(GO:0005248) voltage-gated ion channel activity involved in regulation of postsynaptic membrane potential(GO:1905030) |
| 1.5 | 13.3 | GO:0030882 | lipid antigen binding(GO:0030882) endogenous lipid antigen binding(GO:0030883) exogenous lipid antigen binding(GO:0030884) |
| 1.5 | 26.2 | GO:0004089 | carbonate dehydratase activity(GO:0004089) |
| 1.4 | 7.2 | GO:0005298 | proline:sodium symporter activity(GO:0005298) |
| 1.4 | 15.8 | GO:0004568 | chitinase activity(GO:0004568) chitin binding(GO:0008061) |
| 1.4 | 1.4 | GO:0047787 | delta4-3-oxosteroid 5beta-reductase activity(GO:0047787) |
| 1.4 | 5.7 | GO:0032408 | MutLbeta complex binding(GO:0032406) MutSbeta complex binding(GO:0032408) |
| 1.4 | 49.7 | GO:0017075 | syntaxin-1 binding(GO:0017075) |
| 1.4 | 18.3 | GO:0031681 | G-protein beta-subunit binding(GO:0031681) |
| 1.4 | 8.5 | GO:0003998 | acylphosphatase activity(GO:0003998) |
| 1.4 | 5.6 | GO:0019976 | interleukin-2 receptor activity(GO:0004911) interleukin-2 binding(GO:0019976) |
| 1.4 | 9.7 | GO:0001515 | opioid peptide activity(GO:0001515) |
| 1.4 | 6.9 | GO:0051120 | hepoxilin A3 synthase activity(GO:0051120) |
| 1.4 | 5.5 | GO:0070095 | fructose-6-phosphate binding(GO:0070095) |
| 1.4 | 5.5 | GO:0050119 | N-acetylglucosamine deacetylase activity(GO:0050119) |
| 1.4 | 23.3 | GO:0015095 | magnesium ion transmembrane transporter activity(GO:0015095) |
| 1.4 | 5.4 | GO:0031716 | calcitonin receptor binding(GO:0031716) |
| 1.4 | 1.4 | GO:0032794 | GTPase activating protein binding(GO:0032794) |
| 1.3 | 8.1 | GO:0030172 | troponin C binding(GO:0030172) |
| 1.3 | 6.6 | GO:0030109 | HLA-B specific inhibitory MHC class I receptor activity(GO:0030109) |
| 1.3 | 5.3 | GO:0042132 | fructose 1,6-bisphosphate 1-phosphatase activity(GO:0042132) |
| 1.3 | 3.9 | GO:0001596 | angiotensin type I receptor activity(GO:0001596) |
| 1.3 | 2.6 | GO:0042806 | fucose binding(GO:0042806) |
| 1.3 | 8.9 | GO:0042500 | aspartic endopeptidase activity, intramembrane cleaving(GO:0042500) |
| 1.3 | 3.8 | GO:0015234 | thiamine transmembrane transporter activity(GO:0015234) thiamine uptake transmembrane transporter activity(GO:0015403) |
| 1.2 | 3.7 | GO:0005137 | interleukin-5 receptor binding(GO:0005137) |
| 1.2 | 1.2 | GO:0050613 | delta14-sterol reductase activity(GO:0050613) |
| 1.2 | 218.8 | GO:0003823 | antigen binding(GO:0003823) |
| 1.2 | 7.4 | GO:0031708 | endothelin B receptor binding(GO:0031708) |
| 1.2 | 4.8 | GO:0016019 | peptidoglycan receptor activity(GO:0016019) |
| 1.2 | 4.8 | GO:0004769 | steroid delta-isomerase activity(GO:0004769) |
| 1.2 | 8.5 | GO:0030250 | cyclase activator activity(GO:0010853) guanylate cyclase activator activity(GO:0030250) |
| 1.2 | 1.2 | GO:0001016 | RNA polymerase III regulatory region DNA binding(GO:0001016) |
| 1.2 | 3.6 | GO:0004157 | dihydropyrimidinase activity(GO:0004157) |
| 1.2 | 8.3 | GO:0031802 | type 5 metabotropic glutamate receptor binding(GO:0031802) |
| 1.2 | 5.9 | GO:0008532 | N-acetyllactosaminide beta-1,3-N-acetylglucosaminyltransferase activity(GO:0008532) |
| 1.2 | 4.7 | GO:0004909 | interleukin-1, Type I, activating receptor activity(GO:0004909) |
| 1.2 | 4.7 | GO:0004741 | [pyruvate dehydrogenase (lipoamide)] phosphatase activity(GO:0004741) |
| 1.2 | 5.8 | GO:0044729 | hemi-methylated DNA-binding(GO:0044729) |
| 1.2 | 10.4 | GO:0046974 | histone methyltransferase activity (H3-K9 specific)(GO:0046974) |
| 1.1 | 8.0 | GO:1904288 | BAT3 complex binding(GO:1904288) |
| 1.1 | 6.8 | GO:0004489 | methylenetetrahydrofolate reductase (NAD(P)H) activity(GO:0004489) |
| 1.1 | 3.4 | GO:0016497 | substance K receptor activity(GO:0016497) |
| 1.1 | 9.0 | GO:0060228 | phosphatidylcholine-sterol O-acyltransferase activator activity(GO:0060228) |
| 1.1 | 4.4 | GO:0055131 | C3HC4-type RING finger domain binding(GO:0055131) |
| 1.1 | 17.1 | GO:0031821 | G-protein coupled serotonin receptor binding(GO:0031821) |
| 1.1 | 3.2 | GO:0002113 | interleukin-33 binding(GO:0002113) |
| 1.1 | 14.7 | GO:0086080 | protein binding involved in heterotypic cell-cell adhesion(GO:0086080) |
| 1.0 | 6.3 | GO:0031735 | CCR10 chemokine receptor binding(GO:0031735) |
| 1.0 | 7.3 | GO:0003810 | protein-glutamine gamma-glutamyltransferase activity(GO:0003810) |
| 1.0 | 6.3 | GO:0004882 | androgen receptor activity(GO:0004882) |
| 1.0 | 9.4 | GO:0015277 | kainate selective glutamate receptor activity(GO:0015277) |
| 1.0 | 5.1 | GO:0008422 | beta-glucosidase activity(GO:0008422) |
| 1.0 | 6.2 | GO:0031694 | alpha-2A adrenergic receptor binding(GO:0031694) |
| 1.0 | 3.1 | GO:0052798 | beta-galactoside alpha-2,3-sialyltransferase activity(GO:0052798) |
| 1.0 | 1.0 | GO:1903763 | gap junction channel activity involved in cell communication by electrical coupling(GO:1903763) |
| 1.0 | 4.0 | GO:0099609 | microtubule lateral binding(GO:0099609) |
| 1.0 | 3.0 | GO:0000992 | polymerase III regulatory region sequence-specific DNA binding(GO:0000992) RNA polymerase III type 1 promoter sequence-specific DNA binding(GO:0001002) RNA polymerase III type 2 promoter sequence-specific DNA binding(GO:0001003) |
| 1.0 | 15.1 | GO:0017162 | aryl hydrocarbon receptor binding(GO:0017162) |
| 1.0 | 3.0 | GO:0031862 | prostanoid receptor binding(GO:0031862) |
| 1.0 | 3.0 | GO:0051377 | mannose-ethanolamine phosphotransferase activity(GO:0051377) |
| 1.0 | 8.9 | GO:0005234 | extracellular-glutamate-gated ion channel activity(GO:0005234) |
| 1.0 | 3.0 | GO:0001665 | alpha-N-acetylgalactosaminide alpha-2,6-sialyltransferase activity(GO:0001665) |
| 1.0 | 17.7 | GO:0038191 | neuropilin binding(GO:0038191) |
| 1.0 | 8.8 | GO:0042608 | T cell receptor binding(GO:0042608) |
| 1.0 | 3.9 | GO:0070728 | leucine binding(GO:0070728) |
| 1.0 | 4.9 | GO:0045504 | dynein heavy chain binding(GO:0045504) |
| 1.0 | 13.7 | GO:0005078 | MAP-kinase scaffold activity(GO:0005078) |
| 1.0 | 2.9 | GO:0003845 | 11-beta-hydroxysteroid dehydrogenase [NAD(P)] activity(GO:0003845) |
| 1.0 | 5.8 | GO:0051032 | nucleic acid transmembrane transporter activity(GO:0051032) RNA transmembrane transporter activity(GO:0051033) |
| 1.0 | 13.4 | GO:0015101 | organic cation transmembrane transporter activity(GO:0015101) |
| 1.0 | 3.8 | GO:0004660 | protein farnesyltransferase activity(GO:0004660) |
| 0.9 | 11.3 | GO:0008020 | G-protein coupled photoreceptor activity(GO:0008020) |
| 0.9 | 3.8 | GO:0016495 | C-X3-C chemokine receptor activity(GO:0016495) |
| 0.9 | 30.0 | GO:0008331 | high voltage-gated calcium channel activity(GO:0008331) |
| 0.9 | 0.9 | GO:0051380 | beta-adrenergic receptor activity(GO:0004939) norepinephrine binding(GO:0051380) |
| 0.9 | 9.3 | GO:0015386 | sodium:proton antiporter activity(GO:0015385) potassium:proton antiporter activity(GO:0015386) |
| 0.9 | 10.0 | GO:0033691 | sialic acid binding(GO:0033691) |
| 0.9 | 5.4 | GO:0004359 | glutaminase activity(GO:0004359) |
| 0.9 | 2.7 | GO:0017129 | triglyceride binding(GO:0017129) |
| 0.9 | 3.6 | GO:0000182 | rDNA binding(GO:0000182) |
| 0.9 | 32.6 | GO:0043015 | gamma-tubulin binding(GO:0043015) |
| 0.9 | 3.5 | GO:0010385 | double-stranded methylated DNA binding(GO:0010385) |
| 0.9 | 3.5 | GO:0030628 | pre-mRNA 3'-splice site binding(GO:0030628) |
| 0.9 | 23.4 | GO:0004012 | phospholipid-translocating ATPase activity(GO:0004012) |
| 0.9 | 5.2 | GO:0004430 | 1-phosphatidylinositol 4-kinase activity(GO:0004430) |
| 0.9 | 17.0 | GO:0043014 | alpha-tubulin binding(GO:0043014) |
| 0.8 | 3.4 | GO:0031728 | CCR3 chemokine receptor binding(GO:0031728) |
| 0.8 | 3.4 | GO:0019862 | IgA binding(GO:0019862) |
| 0.8 | 3.4 | GO:0004771 | sterol esterase activity(GO:0004771) |
| 0.8 | 2.5 | GO:0008294 | calcium- and calmodulin-responsive adenylate cyclase activity(GO:0008294) |
| 0.8 | 2.5 | GO:0004345 | glucose-6-phosphate dehydrogenase activity(GO:0004345) |
| 0.8 | 34.3 | GO:0004890 | GABA-A receptor activity(GO:0004890) |
| 0.8 | 12.5 | GO:0019957 | C-C chemokine binding(GO:0019957) |
| 0.8 | 2.5 | GO:0035375 | zymogen binding(GO:0035375) |
| 0.8 | 6.6 | GO:0015235 | cobalamin transporter activity(GO:0015235) |
| 0.8 | 2.5 | GO:0016833 | oxo-acid-lyase activity(GO:0016833) |
| 0.8 | 1.6 | GO:0031711 | bradykinin receptor binding(GO:0031711) |
| 0.8 | 22.7 | GO:0005251 | delayed rectifier potassium channel activity(GO:0005251) |
| 0.8 | 3.2 | GO:0034353 | RNA pyrophosphohydrolase activity(GO:0034353) |
| 0.8 | 4.8 | GO:0097643 | amylin receptor activity(GO:0097643) |
| 0.8 | 4.0 | GO:0004826 | phenylalanine-tRNA ligase activity(GO:0004826) |
| 0.8 | 5.6 | GO:0001517 | N-acetylglucosamine 6-O-sulfotransferase activity(GO:0001517) |
| 0.8 | 19.8 | GO:0008519 | ammonium transmembrane transporter activity(GO:0008519) |
| 0.8 | 3.2 | GO:0019763 | immunoglobulin receptor activity(GO:0019763) |
| 0.8 | 1.6 | GO:0047223 | beta-1,3-galactosyl-O-glycosyl-glycoprotein beta-1,3-N-acetylglucosaminyltransferase activity(GO:0047223) |
| 0.8 | 5.4 | GO:0001591 | dopamine neurotransmitter receptor activity, coupled via Gi/Go(GO:0001591) |
| 0.8 | 20.9 | GO:0008093 | cytoskeletal adaptor activity(GO:0008093) |
| 0.8 | 3.8 | GO:0032795 | heterotrimeric G-protein binding(GO:0032795) |
| 0.7 | 6.7 | GO:0043533 | inositol 1,3,4,5 tetrakisphosphate binding(GO:0043533) |
| 0.7 | 4.5 | GO:0008420 | CTD phosphatase activity(GO:0008420) |
| 0.7 | 5.2 | GO:0047045 | testosterone 17-beta-dehydrogenase (NADP+) activity(GO:0047045) |
| 0.7 | 3.0 | GO:0008568 | microtubule-severing ATPase activity(GO:0008568) |
| 0.7 | 12.6 | GO:0045294 | alpha-catenin binding(GO:0045294) |
| 0.7 | 49.2 | GO:0001540 | beta-amyloid binding(GO:0001540) |
| 0.7 | 2.2 | GO:0070039 | rRNA (guanosine-2'-O-)-methyltransferase activity(GO:0070039) |
| 0.7 | 8.8 | GO:0004065 | arylsulfatase activity(GO:0004065) |
| 0.7 | 5.8 | GO:0046972 | histone acetyltransferase activity (H4-K5 specific)(GO:0043995) histone acetyltransferase activity (H4-K8 specific)(GO:0043996) histone acetyltransferase activity (H4-K16 specific)(GO:0046972) |
| 0.7 | 2.9 | GO:0004687 | myosin light chain kinase activity(GO:0004687) |
| 0.7 | 3.6 | GO:0004803 | transposase activity(GO:0004803) |
| 0.7 | 2.1 | GO:0003829 | beta-1,3-galactosyl-O-glycosyl-glycoprotein beta-1,6-N-acetylglucosaminyltransferase activity(GO:0003829) |
| 0.7 | 23.3 | GO:0005184 | neuropeptide hormone activity(GO:0005184) |
| 0.7 | 2.1 | GO:0031727 | CCR2 chemokine receptor binding(GO:0031727) |
| 0.7 | 4.2 | GO:0099583 | postsynaptic neurotransmitter receptor activity(GO:0098960) neurotransmitter receptor activity involved in regulation of postsynaptic cytosolic calcium ion concentration(GO:0099583) |
| 0.7 | 10.4 | GO:0047372 | acylglycerol lipase activity(GO:0047372) |
| 0.7 | 9.7 | GO:0051864 | histone demethylase activity (H3-K36 specific)(GO:0051864) |
| 0.7 | 7.5 | GO:0097109 | neuroligin family protein binding(GO:0097109) |
| 0.7 | 3.4 | GO:0004994 | somatostatin receptor activity(GO:0004994) |
| 0.7 | 2.1 | GO:0015389 | pyrimidine- and adenine-specific:sodium symporter activity(GO:0015389) |
| 0.7 | 4.8 | GO:0030020 | extracellular matrix structural constituent conferring tensile strength(GO:0030020) |
| 0.7 | 6.8 | GO:0005549 | odorant binding(GO:0005549) |
| 0.7 | 4.0 | GO:0004468 | lysine N-acetyltransferase activity, acting on acetyl phosphate as donor(GO:0004468) |
| 0.7 | 9.4 | GO:0017034 | Rap guanyl-nucleotide exchange factor activity(GO:0017034) |
| 0.7 | 2.0 | GO:0080130 | L-phenylalanine:2-oxoglutarate aminotransferase activity(GO:0080130) |
| 0.7 | 2.0 | GO:0033188 | sphingomyelin synthase activity(GO:0033188) ceramide cholinephosphotransferase activity(GO:0047493) |
| 0.7 | 13.3 | GO:0005522 | profilin binding(GO:0005522) |
| 0.7 | 7.3 | GO:0070324 | thyroid hormone binding(GO:0070324) |
| 0.7 | 10.6 | GO:0008252 | nucleotidase activity(GO:0008252) |
| 0.7 | 3.9 | GO:0016807 | cysteine-type carboxypeptidase activity(GO:0016807) cysteine-type exopeptidase activity(GO:0070004) |
| 0.7 | 2.0 | GO:0016314 | phosphatidylinositol-3,4,5-trisphosphate 3-phosphatase activity(GO:0016314) |
| 0.7 | 2.0 | GO:0070984 | SET domain binding(GO:0070984) |
| 0.6 | 3.9 | GO:0004035 | alkaline phosphatase activity(GO:0004035) |
| 0.6 | 5.2 | GO:0004351 | glutamate decarboxylase activity(GO:0004351) |
| 0.6 | 5.8 | GO:0046935 | 1-phosphatidylinositol-3-kinase regulator activity(GO:0046935) |
| 0.6 | 4.5 | GO:0001849 | complement component C1q binding(GO:0001849) |
| 0.6 | 5.8 | GO:0097322 | 7SK snRNA binding(GO:0097322) |
| 0.6 | 3.8 | GO:0016176 | superoxide-generating NADPH oxidase activator activity(GO:0016176) |
| 0.6 | 3.2 | GO:0005105 | type 1 fibroblast growth factor receptor binding(GO:0005105) |
| 0.6 | 3.2 | GO:0047273 | galactosylgalactosylglucosylceramide beta-D-acetylgalactosaminyltransferase activity(GO:0047273) |
| 0.6 | 9.5 | GO:0005229 | intracellular calcium activated chloride channel activity(GO:0005229) |
| 0.6 | 10.7 | GO:0045503 | dynein light chain binding(GO:0045503) |
| 0.6 | 1.9 | GO:1990430 | extracellular matrix protein binding(GO:1990430) |
| 0.6 | 8.2 | GO:0004705 | JUN kinase activity(GO:0004705) SAP kinase activity(GO:0016909) |
| 0.6 | 19.5 | GO:0005001 | transmembrane receptor protein tyrosine phosphatase activity(GO:0005001) transmembrane receptor protein phosphatase activity(GO:0019198) |
| 0.6 | 2.5 | GO:0008467 | [heparan sulfate]-glucosamine 3-sulfotransferase 1 activity(GO:0008467) |
| 0.6 | 2.5 | GO:0071558 | histone demethylase activity (H3-K27 specific)(GO:0071558) |
| 0.6 | 2.5 | GO:0004802 | transketolase activity(GO:0004802) |
| 0.6 | 1.9 | GO:0004677 | DNA-dependent protein kinase activity(GO:0004677) |
| 0.6 | 17.5 | GO:0005521 | lamin binding(GO:0005521) |
| 0.6 | 6.2 | GO:0001042 | RNA polymerase I core binding(GO:0001042) |
| 0.6 | 3.1 | GO:0008160 | protein tyrosine phosphatase activator activity(GO:0008160) |
| 0.6 | 3.1 | GO:0047696 | beta-adrenergic receptor kinase activity(GO:0047696) |
| 0.6 | 9.8 | GO:0038036 | sphingosine-1-phosphate receptor activity(GO:0038036) |
| 0.6 | 4.9 | GO:0050816 | phosphothreonine binding(GO:0050816) |
| 0.6 | 1.8 | GO:0047322 | [hydroxymethylglutaryl-CoA reductase (NADPH)] kinase activity(GO:0047322) [acetyl-CoA carboxylase] kinase activity(GO:0050405) |
| 0.6 | 2.4 | GO:0008508 | bile acid:sodium symporter activity(GO:0008508) |
| 0.6 | 3.7 | GO:0016714 | oxidoreductase activity, acting on paired donors, with incorporation or reduction of molecular oxygen, reduced pteridine as one donor, and incorporation of one atom of oxygen(GO:0016714) |
| 0.6 | 1.2 | GO:0004618 | phosphoglycerate kinase activity(GO:0004618) |
| 0.6 | 7.3 | GO:0003996 | acyl-CoA ligase activity(GO:0003996) |
| 0.6 | 1.8 | GO:0033300 | dehydroascorbic acid transporter activity(GO:0033300) |
| 0.6 | 7.8 | GO:0097371 | MDM2/MDM4 family protein binding(GO:0097371) |
| 0.6 | 2.4 | GO:0018271 | biotin-[acetyl-CoA-carboxylase] ligase activity(GO:0004077) biotin-[methylcrotonoyl-CoA-carboxylase] ligase activity(GO:0004078) biotin-[methylmalonyl-CoA-carboxytransferase] ligase activity(GO:0004079) biotin-[propionyl-CoA-carboxylase (ATP-hydrolyzing)] ligase activity(GO:0004080) biotin-protein ligase activity(GO:0018271) |
| 0.6 | 11.8 | GO:0017136 | NAD-dependent histone deacetylase activity(GO:0017136) |
| 0.6 | 1.8 | GO:0005152 | interleukin-1 receptor antagonist activity(GO:0005152) |
| 0.6 | 4.1 | GO:0004983 | neuropeptide Y receptor activity(GO:0004983) |
| 0.6 | 1.8 | GO:0004993 | G-protein coupled serotonin receptor activity(GO:0004993) |
| 0.6 | 6.5 | GO:0004022 | alcohol dehydrogenase (NAD) activity(GO:0004022) |
| 0.6 | 2.3 | GO:0016434 | rRNA (cytosine) methyltransferase activity(GO:0016434) |
| 0.6 | 1.8 | GO:0061752 | telomeric repeat-containing RNA binding(GO:0061752) |
| 0.6 | 1.7 | GO:0047783 | steroid 11-beta-monooxygenase activity(GO:0004507) corticosterone 18-monooxygenase activity(GO:0047783) |
| 0.6 | 2.3 | GO:0070053 | thrombospondin receptor activity(GO:0070053) |
| 0.6 | 2.3 | GO:0032450 | maltose alpha-glucosidase activity(GO:0032450) |
| 0.6 | 60.1 | GO:0004867 | serine-type endopeptidase inhibitor activity(GO:0004867) |
| 0.6 | 4.5 | GO:0030345 | extracellular matrix structural constituent conferring compression resistance(GO:0030021) structural constituent of tooth enamel(GO:0030345) |
| 0.6 | 3.4 | GO:0008499 | UDP-galactose:beta-N-acetylglucosamine beta-1,3-galactosyltransferase activity(GO:0008499) |
| 0.6 | 29.8 | GO:0005544 | calcium-dependent phospholipid binding(GO:0005544) |
| 0.6 | 10.6 | GO:0043425 | bHLH transcription factor binding(GO:0043425) |
| 0.6 | 3.4 | GO:0031685 | adenosine receptor binding(GO:0031685) |
| 0.6 | 6.6 | GO:0051378 | amine binding(GO:0043176) serotonin binding(GO:0051378) |
| 0.6 | 12.1 | GO:0008198 | ferrous iron binding(GO:0008198) |
| 0.5 | 4.9 | GO:0001758 | retinal dehydrogenase activity(GO:0001758) |
| 0.5 | 2.7 | GO:0070051 | fibrinogen binding(GO:0070051) |
| 0.5 | 3.8 | GO:0004797 | deoxycytidine kinase activity(GO:0004137) thymidine kinase activity(GO:0004797) |
| 0.5 | 7.0 | GO:0036374 | glutathione hydrolase activity(GO:0036374) |
| 0.5 | 4.8 | GO:0043426 | MRF binding(GO:0043426) |
| 0.5 | 1.6 | GO:0004336 | galactosylceramidase activity(GO:0004336) |
| 0.5 | 17.1 | GO:0030742 | GTP-dependent protein binding(GO:0030742) |
| 0.5 | 0.5 | GO:0016713 | oxidoreductase activity, acting on paired donors, with incorporation or reduction of molecular oxygen, reduced iron-sulfur protein as one donor, and incorporation of one atom of oxygen(GO:0016713) |
| 0.5 | 10.0 | GO:0043548 | phosphatidylinositol 3-kinase binding(GO:0043548) |
| 0.5 | 5.2 | GO:0005161 | platelet-derived growth factor receptor binding(GO:0005161) |
| 0.5 | 1.6 | GO:0061697 | protein-malonyllysine demalonylase activity(GO:0036054) protein-succinyllysine desuccinylase activity(GO:0036055) protein-glutaryllysine deglutarylase activity(GO:0061697) |
| 0.5 | 2.1 | GO:0016917 | GABA receptor activity(GO:0016917) |
| 0.5 | 3.6 | GO:0004499 | N,N-dimethylaniline monooxygenase activity(GO:0004499) |
| 0.5 | 1.5 | GO:0035241 | protein-arginine omega-N monomethyltransferase activity(GO:0035241) |
| 0.5 | 1.5 | GO:0036134 | thromboxane-A synthase activity(GO:0004796) 12-hydroxyheptadecatrienoic acid synthase activity(GO:0036134) |
| 0.5 | 3.0 | GO:0005220 | inositol 1,4,5-trisphosphate-sensitive calcium-release channel activity(GO:0005220) |
| 0.5 | 4.5 | GO:0035727 | lysophosphatidic acid binding(GO:0035727) |
| 0.5 | 4.0 | GO:1904264 | ubiquitin protein ligase activity involved in ERAD pathway(GO:1904264) |
| 0.5 | 46.2 | GO:0004984 | olfactory receptor activity(GO:0004984) |
| 0.5 | 2.0 | GO:0004886 | 9-cis retinoic acid receptor activity(GO:0004886) |
| 0.5 | 1.5 | GO:0070735 | protein-glycine ligase activity(GO:0070735) |
| 0.5 | 4.5 | GO:0043855 | intracellular cyclic nucleotide activated cation channel activity(GO:0005221) cyclic nucleotide-gated ion channel activity(GO:0043855) |
| 0.5 | 1.5 | GO:0005502 | 11-cis retinal binding(GO:0005502) |
| 0.5 | 3.0 | GO:0016416 | O-palmitoyltransferase activity(GO:0016416) |
| 0.5 | 2.5 | GO:0016841 | ammonia-lyase activity(GO:0016841) |
| 0.5 | 1.5 | GO:0060422 | peptidyl-dipeptidase inhibitor activity(GO:0060422) |
| 0.5 | 15.7 | GO:0071837 | HMG box domain binding(GO:0071837) |
| 0.5 | 38.6 | GO:0050840 | extracellular matrix binding(GO:0050840) |
| 0.5 | 2.4 | GO:0005119 | smoothened binding(GO:0005119) |
| 0.5 | 2.8 | GO:0031697 | beta-1 adrenergic receptor binding(GO:0031697) |
| 0.5 | 1.9 | GO:0032145 | 4-aminobutyrate transaminase activity(GO:0003867) succinate-semialdehyde dehydrogenase binding(GO:0032145) (S)-3-amino-2-methylpropionate transaminase activity(GO:0047298) |
| 0.5 | 1.4 | GO:0097677 | STAT family protein binding(GO:0097677) |
| 0.5 | 1.4 | GO:0005128 | erythropoietin receptor binding(GO:0005128) |
| 0.5 | 3.2 | GO:0030160 | GKAP/Homer scaffold activity(GO:0030160) |
| 0.5 | 1.4 | GO:0015193 | L-proline transmembrane transporter activity(GO:0015193) |
| 0.5 | 9.5 | GO:0070742 | C2H2 zinc finger domain binding(GO:0070742) |
| 0.5 | 1.8 | GO:0004341 | gluconolactonase activity(GO:0004341) |
| 0.5 | 12.6 | GO:0030676 | Rac guanyl-nucleotide exchange factor activity(GO:0030676) |
| 0.4 | 1.3 | GO:0004047 | aminomethyltransferase activity(GO:0004047) |
| 0.4 | 25.5 | GO:0030507 | spectrin binding(GO:0030507) |
| 0.4 | 1.3 | GO:0052794 | exo-alpha-(2->3)-sialidase activity(GO:0052794) exo-alpha-(2->6)-sialidase activity(GO:0052795) exo-alpha-(2->8)-sialidase activity(GO:0052796) |
| 0.4 | 1.8 | GO:0001626 | nociceptin receptor activity(GO:0001626) |
| 0.4 | 1.8 | GO:0070404 | NADH binding(GO:0070404) |
| 0.4 | 0.4 | GO:0042813 | Wnt-activated receptor activity(GO:0042813) |
| 0.4 | 15.7 | GO:0008009 | chemokine activity(GO:0008009) |
| 0.4 | 6.9 | GO:0019865 | immunoglobulin binding(GO:0019865) |
| 0.4 | 1.3 | GO:0004584 | dolichyl-phosphate-mannose-glycolipid alpha-mannosyltransferase activity(GO:0004584) |
| 0.4 | 3.9 | GO:0047499 | calcium-independent phospholipase A2 activity(GO:0047499) |
| 0.4 | 3.4 | GO:0015232 | heme transporter activity(GO:0015232) |
| 0.4 | 1.3 | GO:0004960 | thromboxane receptor activity(GO:0004960) thromboxane A2 receptor activity(GO:0004961) |
| 0.4 | 3.0 | GO:0003910 | DNA ligase (ATP) activity(GO:0003910) |
| 0.4 | 3.0 | GO:0030169 | low-density lipoprotein particle binding(GO:0030169) |
| 0.4 | 8.0 | GO:0008391 | arachidonic acid monooxygenase activity(GO:0008391) arachidonic acid epoxygenase activity(GO:0008392) |
| 0.4 | 7.6 | GO:0035497 | cAMP response element binding(GO:0035497) |
| 0.4 | 2.9 | GO:0004457 | lactate dehydrogenase activity(GO:0004457) L-lactate dehydrogenase activity(GO:0004459) |
| 0.4 | 2.9 | GO:0044323 | retinoic acid-responsive element binding(GO:0044323) |
| 0.4 | 2.1 | GO:0047144 | 2-acylglycerol-3-phosphate O-acyltransferase activity(GO:0047144) |
| 0.4 | 2.9 | GO:0036310 | annealing helicase activity(GO:0036310) |
| 0.4 | 2.9 | GO:0004962 | endothelin receptor activity(GO:0004962) |
| 0.4 | 2.1 | GO:0016907 | G-protein coupled acetylcholine receptor activity(GO:0016907) |
| 0.4 | 11.4 | GO:0005104 | fibroblast growth factor receptor binding(GO:0005104) |
| 0.4 | 1.2 | GO:0004663 | Rab geranylgeranyltransferase activity(GO:0004663) |
| 0.4 | 2.4 | GO:0030023 | extracellular matrix constituent conferring elasticity(GO:0030023) |
| 0.4 | 1.2 | GO:0052815 | medium-chain acyl-CoA hydrolase activity(GO:0052815) long-chain acyl-CoA hydrolase activity(GO:0052816) |
| 0.4 | 4.4 | GO:0005328 | neurotransmitter:sodium symporter activity(GO:0005328) |
| 0.4 | 33.3 | GO:0005089 | Rho guanyl-nucleotide exchange factor activity(GO:0005089) |
| 0.4 | 3.9 | GO:0031995 | insulin-like growth factor II binding(GO:0031995) |
| 0.4 | 2.3 | GO:0009378 | four-way junction helicase activity(GO:0009378) |
| 0.4 | 1.2 | GO:0005260 | channel-conductance-controlling ATPase activity(GO:0005260) |
| 0.4 | 1.5 | GO:0017159 | pantetheine hydrolase activity(GO:0017159) |
| 0.4 | 9.6 | GO:0005527 | macrolide binding(GO:0005527) FK506 binding(GO:0005528) |
| 0.4 | 1.5 | GO:0004773 | steryl-sulfatase activity(GO:0004773) |
| 0.4 | 3.4 | GO:0046920 | alpha-(1->3)-fucosyltransferase activity(GO:0046920) |
| 0.4 | 1.5 | GO:0043398 | HLH domain binding(GO:0043398) |
| 0.4 | 1.1 | GO:0061629 | RNA polymerase II sequence-specific DNA binding transcription factor binding(GO:0061629) |
| 0.4 | 4.4 | GO:0004875 | complement receptor activity(GO:0004875) |
| 0.4 | 2.6 | GO:0048407 | platelet-derived growth factor binding(GO:0048407) |
| 0.4 | 3.6 | GO:0004689 | phosphorylase kinase activity(GO:0004689) |
| 0.4 | 0.7 | GO:0015018 | galactosylgalactosylxylosylprotein 3-beta-glucuronosyltransferase activity(GO:0015018) |
| 0.4 | 2.9 | GO:0098821 | BMP receptor activity(GO:0098821) |
| 0.4 | 1.8 | GO:0003989 | acetyl-CoA carboxylase activity(GO:0003989) |
| 0.4 | 79.2 | GO:0004252 | serine-type endopeptidase activity(GO:0004252) |
| 0.4 | 24.1 | GO:0070412 | R-SMAD binding(GO:0070412) |
| 0.4 | 2.8 | GO:0003696 | satellite DNA binding(GO:0003696) |
| 0.4 | 3.2 | GO:0008865 | glucokinase activity(GO:0004340) hexokinase activity(GO:0004396) fructokinase activity(GO:0008865) mannokinase activity(GO:0019158) |
| 0.4 | 6.3 | GO:0070513 | death domain binding(GO:0070513) |
| 0.4 | 1.8 | GO:0003886 | DNA (cytosine-5-)-methyltransferase activity(GO:0003886) |
| 0.4 | 3.9 | GO:0036122 | BMP binding(GO:0036122) |
| 0.4 | 11.2 | GO:0005452 | inorganic anion exchanger activity(GO:0005452) |
| 0.4 | 1.8 | GO:0016941 | natriuretic peptide receptor activity(GO:0016941) |
| 0.3 | 2.8 | GO:0004969 | histamine receptor activity(GO:0004969) |
| 0.3 | 0.7 | GO:0010851 | cyclase regulator activity(GO:0010851) |
| 0.3 | 4.8 | GO:0015250 | water channel activity(GO:0015250) |
| 0.3 | 1.7 | GO:0005143 | interleukin-12 receptor binding(GO:0005143) |
| 0.3 | 1.4 | GO:0003846 | 2-acylglycerol O-acyltransferase activity(GO:0003846) |
| 0.3 | 3.1 | GO:0008526 | phosphatidylinositol transporter activity(GO:0008526) |
| 0.3 | 1.7 | GO:0005314 | high-affinity glutamate transmembrane transporter activity(GO:0005314) |
| 0.3 | 3.7 | GO:0004691 | cAMP-dependent protein kinase activity(GO:0004691) |
| 0.3 | 3.4 | GO:0016286 | small conductance calcium-activated potassium channel activity(GO:0016286) |
| 0.3 | 1.7 | GO:0070891 | lipoteichoic acid binding(GO:0070891) |
| 0.3 | 1.3 | GO:0008035 | high-density lipoprotein particle binding(GO:0008035) |
| 0.3 | 1.7 | GO:0032296 | ribonuclease III activity(GO:0004525) double-stranded RNA-specific ribonuclease activity(GO:0032296) |
| 0.3 | 9.5 | GO:0004129 | cytochrome-c oxidase activity(GO:0004129) heme-copper terminal oxidase activity(GO:0015002) oxidoreductase activity, acting on a heme group of donors, oxygen as acceptor(GO:0016676) |
| 0.3 | 1.0 | GO:0034875 | vitamin D3 25-hydroxylase activity(GO:0030343) oxidoreductase activity, acting on CH or CH2 groups, quinone or similar compound as acceptor(GO:0033695) caffeine oxidase activity(GO:0034875) vitamin D 25-hydroxylase activity(GO:0070643) |
| 0.3 | 1.3 | GO:0003708 | retinoic acid receptor activity(GO:0003708) |
| 0.3 | 1.0 | GO:0008900 | hydrogen:potassium-exchanging ATPase activity(GO:0008900) |
| 0.3 | 2.5 | GO:0031419 | cobalamin binding(GO:0031419) |
| 0.3 | 3.5 | GO:0030247 | pattern binding(GO:0001871) polysaccharide binding(GO:0030247) |
| 0.3 | 1.9 | GO:0004614 | phosphoglucomutase activity(GO:0004614) |
| 0.3 | 4.8 | GO:0042800 | histone methyltransferase activity (H3-K4 specific)(GO:0042800) |
| 0.3 | 1.3 | GO:0060230 | lipoprotein lipase activator activity(GO:0060230) |
| 0.3 | 12.9 | GO:0017091 | AU-rich element binding(GO:0017091) |
| 0.3 | 1.3 | GO:0043515 | kinetochore binding(GO:0043515) |
| 0.3 | 4.7 | GO:0005132 | type I interferon receptor binding(GO:0005132) |
| 0.3 | 1.2 | GO:0003873 | 6-phosphofructo-2-kinase activity(GO:0003873) |
| 0.3 | 2.2 | GO:0035368 | selenocysteine insertion sequence binding(GO:0035368) |
| 0.3 | 2.8 | GO:0050682 | AF-2 domain binding(GO:0050682) |
| 0.3 | 1.6 | GO:0097603 | temperature-gated ion channel activity(GO:0097603) |
| 0.3 | 2.2 | GO:0046976 | histone methyltransferase activity (H3-K27 specific)(GO:0046976) |
| 0.3 | 4.0 | GO:0004622 | lysophospholipase activity(GO:0004622) |
| 0.3 | 1.8 | GO:0008131 | primary amine oxidase activity(GO:0008131) |
| 0.3 | 6.4 | GO:0004623 | phospholipase A2 activity(GO:0004623) |
| 0.3 | 3.0 | GO:0043325 | phosphatidylinositol-3,4-bisphosphate binding(GO:0043325) |
| 0.3 | 5.1 | GO:0008179 | adenylate cyclase binding(GO:0008179) |
| 0.3 | 0.9 | GO:0052739 | phosphatidylserine 1-acylhydrolase activity(GO:0052739) |
| 0.3 | 51.5 | GO:0001078 | transcriptional repressor activity, RNA polymerase II core promoter proximal region sequence-specific binding(GO:0001078) |
| 0.3 | 3.9 | GO:0046870 | cadmium ion binding(GO:0046870) |
| 0.3 | 1.8 | GO:0038062 | protein tyrosine kinase collagen receptor activity(GO:0038062) |
| 0.3 | 6.8 | GO:0080025 | phosphatidylinositol-3,5-bisphosphate binding(GO:0080025) |
| 0.3 | 1.2 | GO:0015184 | L-cystine transmembrane transporter activity(GO:0015184) |
| 0.3 | 3.5 | GO:0050811 | GABA receptor binding(GO:0050811) |
| 0.3 | 9.1 | GO:0004114 | 3',5'-cyclic-nucleotide phosphodiesterase activity(GO:0004114) |
| 0.3 | 0.9 | GO:0030171 | voltage-gated proton channel activity(GO:0030171) |
| 0.3 | 4.6 | GO:0019707 | protein-cysteine S-palmitoyltransferase activity(GO:0019706) protein-cysteine S-acyltransferase activity(GO:0019707) |
| 0.3 | 3.2 | GO:0032454 | histone demethylase activity (H3-K9 specific)(GO:0032454) |
| 0.3 | 2.0 | GO:0070679 | inositol 1,4,5 trisphosphate binding(GO:0070679) |
| 0.3 | 1.7 | GO:0008271 | secondary active sulfate transmembrane transporter activity(GO:0008271) |
| 0.3 | 12.6 | GO:0030552 | cAMP binding(GO:0030552) |
| 0.3 | 1.7 | GO:0004740 | pyruvate dehydrogenase (acetyl-transferring) kinase activity(GO:0004740) |
| 0.3 | 0.6 | GO:0015275 | stretch-activated, cation-selective, calcium channel activity(GO:0015275) |
| 0.3 | 0.6 | GO:0018685 | alkane 1-monooxygenase activity(GO:0018685) |
| 0.3 | 2.2 | GO:0005094 | Rho GDP-dissociation inhibitor activity(GO:0005094) |
| 0.3 | 1.6 | GO:0070568 | guanylyltransferase activity(GO:0070568) |
| 0.3 | 23.6 | GO:0005249 | voltage-gated potassium channel activity(GO:0005249) |
| 0.3 | 5.1 | GO:0031005 | filamin binding(GO:0031005) |
| 0.3 | 2.9 | GO:0004645 | phosphorylase activity(GO:0004645) |
| 0.3 | 1.6 | GO:0004735 | pyrroline-5-carboxylate reductase activity(GO:0004735) |
| 0.3 | 3.6 | GO:0004190 | aspartic-type endopeptidase activity(GO:0004190) aspartic-type peptidase activity(GO:0070001) |
| 0.3 | 7.3 | GO:0005035 | tumor necrosis factor-activated receptor activity(GO:0005031) death receptor activity(GO:0005035) |
| 0.3 | 1.8 | GO:0043812 | phosphatidylinositol-4-phosphate phosphatase activity(GO:0043812) |
| 0.2 | 0.7 | GO:0008241 | peptidyl-dipeptidase activity(GO:0008241) |
| 0.2 | 1.2 | GO:0061676 | importin-alpha family protein binding(GO:0061676) |
| 0.2 | 18.4 | GO:0003707 | steroid hormone receptor activity(GO:0003707) |
| 0.2 | 1.7 | GO:0015065 | uridine nucleotide receptor activity(GO:0015065) G-protein coupled pyrimidinergic nucleotide receptor activity(GO:0071553) |
| 0.2 | 4.8 | GO:0008188 | neuropeptide receptor activity(GO:0008188) |
| 0.2 | 0.5 | GO:0031731 | CCR6 chemokine receptor binding(GO:0031731) |
| 0.2 | 0.7 | GO:0008336 | gamma-butyrobetaine dioxygenase activity(GO:0008336) |
| 0.2 | 1.6 | GO:0004652 | polynucleotide adenylyltransferase activity(GO:0004652) |
| 0.2 | 3.5 | GO:0008395 | steroid hydroxylase activity(GO:0008395) |
| 0.2 | 4.0 | GO:0016722 | oxidoreductase activity, oxidizing metal ions(GO:0016722) |
| 0.2 | 0.7 | GO:0035671 | enone reductase activity(GO:0035671) |
| 0.2 | 2.5 | GO:0017160 | Ral GTPase binding(GO:0017160) |
| 0.2 | 0.4 | GO:0016406 | carnitine O-acyltransferase activity(GO:0016406) |
| 0.2 | 0.7 | GO:0032395 | MHC class II receptor activity(GO:0032395) |
| 0.2 | 0.7 | GO:0004060 | arylamine N-acetyltransferase activity(GO:0004060) |
| 0.2 | 1.8 | GO:0016493 | C-C chemokine receptor activity(GO:0016493) |
| 0.2 | 0.9 | GO:0010861 | thyroid hormone receptor activator activity(GO:0010861) thyroid hormone receptor coactivator activity(GO:0030375) |
| 0.2 | 5.5 | GO:0005355 | glucose transmembrane transporter activity(GO:0005355) |
| 0.2 | 1.8 | GO:0005000 | vasopressin receptor activity(GO:0005000) |
| 0.2 | 1.1 | GO:0008199 | ferric iron binding(GO:0008199) |
| 0.2 | 0.6 | GO:0061609 | fructose-1-phosphate aldolase activity(GO:0061609) |
| 0.2 | 3.4 | GO:0032183 | SUMO binding(GO:0032183) |
| 0.2 | 1.9 | GO:0004767 | sphingomyelin phosphodiesterase activity(GO:0004767) |
| 0.2 | 1.9 | GO:0015643 | toxic substance binding(GO:0015643) |
| 0.2 | 0.8 | GO:0005006 | epidermal growth factor-activated receptor activity(GO:0005006) |
| 0.2 | 1.6 | GO:0005436 | sodium:phosphate symporter activity(GO:0005436) |
| 0.2 | 1.4 | GO:0048495 | Roundabout binding(GO:0048495) |
| 0.2 | 1.4 | GO:0008417 | fucosyltransferase activity(GO:0008417) |
| 0.2 | 11.7 | GO:0005201 | extracellular matrix structural constituent(GO:0005201) |
| 0.2 | 2.9 | GO:0008195 | phosphatidate phosphatase activity(GO:0008195) |
| 0.2 | 46.3 | GO:0005096 | GTPase activator activity(GO:0005096) |
| 0.2 | 0.9 | GO:0045295 | gamma-catenin binding(GO:0045295) |
| 0.2 | 3.6 | GO:0070300 | phosphatidic acid binding(GO:0070300) |
| 0.2 | 5.2 | GO:0019894 | kinesin binding(GO:0019894) |
| 0.2 | 0.9 | GO:0004464 | leukotriene-C4 synthase activity(GO:0004464) |
| 0.2 | 0.7 | GO:0046592 | polyamine oxidase activity(GO:0046592) spermine:oxygen oxidoreductase (spermidine-forming) activity(GO:0052901) |
| 0.2 | 6.7 | GO:0017112 | Rab guanyl-nucleotide exchange factor activity(GO:0017112) |
| 0.2 | 2.0 | GO:0004862 | cAMP-dependent protein kinase inhibitor activity(GO:0004862) |
| 0.2 | 0.9 | GO:0008410 | CoA-transferase activity(GO:0008410) |
| 0.2 | 1.1 | GO:0004169 | dolichyl-phosphate-mannose-protein mannosyltransferase activity(GO:0004169) |
| 0.2 | 6.4 | GO:0043539 | protein serine/threonine kinase activator activity(GO:0043539) |
| 0.2 | 1.5 | GO:0003997 | acyl-CoA oxidase activity(GO:0003997) |
| 0.2 | 0.5 | GO:0008502 | melatonin receptor activity(GO:0008502) |
| 0.2 | 0.9 | GO:0003835 | beta-galactoside alpha-2,6-sialyltransferase activity(GO:0003835) |
| 0.2 | 0.9 | GO:0004045 | aminoacyl-tRNA hydrolase activity(GO:0004045) |
| 0.2 | 0.9 | GO:0046975 | histone methyltransferase activity (H3-K36 specific)(GO:0046975) |
| 0.2 | 1.4 | GO:0004111 | creatine kinase activity(GO:0004111) |
| 0.2 | 27.1 | GO:0017137 | Rab GTPase binding(GO:0017137) |
| 0.2 | 0.5 | GO:0004914 | interleukin-5 receptor activity(GO:0004914) |
| 0.2 | 2.1 | GO:0005007 | fibroblast growth factor-activated receptor activity(GO:0005007) |
| 0.2 | 2.7 | GO:0015269 | calcium-activated potassium channel activity(GO:0015269) |
| 0.2 | 0.8 | GO:0033857 | diphosphoinositol-pentakisphosphate kinase activity(GO:0033857) |
| 0.2 | 0.5 | GO:0030158 | protein xylosyltransferase activity(GO:0030158) |
| 0.2 | 6.7 | GO:0016298 | lipase activity(GO:0016298) |
| 0.2 | 0.6 | GO:0031994 | insulin-like growth factor I binding(GO:0031994) |
| 0.2 | 3.0 | GO:0008353 | RNA polymerase II carboxy-terminal domain kinase activity(GO:0008353) |
| 0.2 | 4.2 | GO:0005388 | calcium-transporting ATPase activity(GO:0005388) |
| 0.2 | 3.0 | GO:0002162 | dystroglycan binding(GO:0002162) |
| 0.1 | 0.3 | GO:0009008 | DNA-methyltransferase activity(GO:0009008) |
| 0.1 | 0.4 | GO:0050698 | proteoglycan sulfotransferase activity(GO:0050698) |
| 0.1 | 0.4 | GO:0008476 | protein-tyrosine sulfotransferase activity(GO:0008476) |
| 0.1 | 1.7 | GO:0016174 | NAD(P)H oxidase activity(GO:0016174) |
| 0.1 | 0.4 | GO:0004421 | hydroxymethylglutaryl-CoA synthase activity(GO:0004421) |
| 0.1 | 0.7 | GO:0004977 | melanocortin receptor activity(GO:0004977) |
| 0.1 | 0.8 | GO:0030215 | semaphorin receptor binding(GO:0030215) |
| 0.1 | 0.9 | GO:0016167 | glial cell-derived neurotrophic factor receptor activity(GO:0016167) |
| 0.1 | 0.4 | GO:0005011 | macrophage colony-stimulating factor receptor activity(GO:0005011) |
| 0.1 | 0.4 | GO:0004963 | follicle-stimulating hormone receptor activity(GO:0004963) |
| 0.1 | 0.9 | GO:0016641 | oxidoreductase activity, acting on the CH-NH2 group of donors, oxygen as acceptor(GO:0016641) |
| 0.1 | 3.7 | GO:0031683 | G-protein beta/gamma-subunit complex binding(GO:0031683) |
| 0.1 | 0.5 | GO:0042954 | lipoprotein transporter activity(GO:0042954) |
| 0.1 | 0.9 | GO:0032217 | riboflavin transporter activity(GO:0032217) |
| 0.1 | 8.2 | GO:0016820 | hydrolase activity, acting on acid anhydrides, catalyzing transmembrane movement of substances(GO:0016820) |
| 0.1 | 1.5 | GO:0017049 | GTP-Rho binding(GO:0017049) |
| 0.1 | 0.3 | GO:0004307 | ethanolaminephosphotransferase activity(GO:0004307) |
| 0.1 | 2.8 | GO:0003950 | NAD+ ADP-ribosyltransferase activity(GO:0003950) |
| 0.1 | 1.1 | GO:0004745 | retinol dehydrogenase activity(GO:0004745) |
| 0.1 | 0.6 | GO:0008948 | malate dehydrogenase (decarboxylating) (NAD+) activity(GO:0004471) malate dehydrogenase (decarboxylating) (NADP+) activity(GO:0004473) oxaloacetate decarboxylase activity(GO:0008948) |
| 0.1 | 0.4 | GO:0005499 | vitamin D binding(GO:0005499) |
| 0.1 | 0.6 | GO:0004690 | cyclic nucleotide-dependent protein kinase activity(GO:0004690) |
| 0.1 | 2.8 | GO:1990841 | promoter-specific chromatin binding(GO:1990841) |
| 0.1 | 0.8 | GO:0001165 | RNA polymerase I upstream control element sequence-specific DNA binding(GO:0001165) |
| 0.1 | 1.5 | GO:0042287 | MHC protein binding(GO:0042287) |
| 0.1 | 1.3 | GO:0047429 | nucleoside-triphosphate diphosphatase activity(GO:0047429) |
| 0.1 | 1.2 | GO:0015125 | bile acid transmembrane transporter activity(GO:0015125) |
| 0.1 | 0.8 | GO:0035612 | AP-2 adaptor complex binding(GO:0035612) |
| 0.1 | 0.8 | GO:0004075 | biotin carboxylase activity(GO:0004075) |
| 0.1 | 1.3 | GO:0008574 | ATP-dependent microtubule motor activity, plus-end-directed(GO:0008574) |
| 0.1 | 0.7 | GO:0032052 | bile acid binding(GO:0032052) |
| 0.1 | 0.3 | GO:0034618 | arginine binding(GO:0034618) |
| 0.1 | 1.9 | GO:0070016 | armadillo repeat domain binding(GO:0070016) |
| 0.1 | 0.3 | GO:0051525 | NFAT protein binding(GO:0051525) |
| 0.1 | 1.6 | GO:0045502 | dynein binding(GO:0045502) |
| 0.1 | 0.4 | GO:0051021 | GDP-dissociation inhibitor binding(GO:0051021) Rho GDP-dissociation inhibitor binding(GO:0051022) |
| 0.1 | 1.2 | GO:0019992 | diacylglycerol binding(GO:0019992) |
| 0.1 | 2.8 | GO:0017147 | Wnt-protein binding(GO:0017147) |
| 0.1 | 0.5 | GO:0005227 | calcium activated cation channel activity(GO:0005227) |
| 0.1 | 1.0 | GO:0050664 | oxidoreductase activity, acting on NAD(P)H, oxygen as acceptor(GO:0050664) |
| 0.1 | 0.7 | GO:0008440 | inositol-1,4,5-trisphosphate 3-kinase activity(GO:0008440) |
| 0.1 | 3.8 | GO:0017080 | sodium channel regulator activity(GO:0017080) |
| 0.1 | 0.5 | GO:0030369 | ICAM-3 receptor activity(GO:0030369) |
| 0.1 | 0.4 | GO:0043395 | heparan sulfate proteoglycan binding(GO:0043395) |
| 0.1 | 6.6 | GO:0005179 | hormone activity(GO:0005179) |
| 0.1 | 0.3 | GO:0030976 | thiamine pyrophosphate binding(GO:0030976) |
| 0.1 | 0.3 | GO:0042328 | heparan sulfate N-acetylglucosaminyltransferase activity(GO:0042328) |
| 0.1 | 0.2 | GO:0035374 | chondroitin sulfate binding(GO:0035374) |
| 0.1 | 4.6 | GO:0004714 | transmembrane receptor protein tyrosine kinase activity(GO:0004714) |
| 0.1 | 0.3 | GO:0046573 | lactonohydrolase activity(GO:0046573) acyl-L-homoserine-lactone lactonohydrolase activity(GO:0102007) |
| 0.1 | 1.1 | GO:0042043 | neurexin family protein binding(GO:0042043) |
| 0.1 | 0.2 | GO:0008142 | oxysterol binding(GO:0008142) |
| 0.1 | 0.6 | GO:0004383 | guanylate cyclase activity(GO:0004383) |
| 0.1 | 0.2 | GO:0008480 | sarcosine dehydrogenase activity(GO:0008480) oxidoreductase activity, acting on the CH-NH group of donors, flavin as acceptor(GO:0046997) |
| 0.1 | 0.3 | GO:0001632 | leukotriene B4 receptor activity(GO:0001632) |
| 0.1 | 1.6 | GO:0004708 | MAP kinase kinase activity(GO:0004708) |
| 0.1 | 0.4 | GO:0050693 | LBD domain binding(GO:0050693) |
| 0.1 | 0.6 | GO:0070087 | chromo shadow domain binding(GO:0070087) |
| 0.1 | 1.0 | GO:0022820 | potassium:chloride symporter activity(GO:0015379) potassium ion symporter activity(GO:0022820) |
| 0.1 | 1.8 | GO:0022848 | acetylcholine-gated cation channel activity(GO:0022848) |
| 0.1 | 0.5 | GO:0016494 | C-X-C chemokine receptor activity(GO:0016494) |
| 0.1 | 1.2 | GO:0016805 | dipeptidase activity(GO:0016805) |
| 0.1 | 0.3 | GO:0008172 | S-methyltransferase activity(GO:0008172) |
| 0.1 | 0.3 | GO:0032393 | MHC class I receptor activity(GO:0032393) |
| 0.1 | 0.3 | GO:0003680 | AT DNA binding(GO:0003680) |
| 0.1 | 0.5 | GO:0005138 | interleukin-6 receptor binding(GO:0005138) |
| 0.1 | 4.6 | GO:0008201 | heparin binding(GO:0008201) |
| 0.0 | 0.5 | GO:0035381 | extracellular ATP-gated cation channel activity(GO:0004931) ATP-gated ion channel activity(GO:0035381) |
| 0.0 | 0.1 | GO:0004716 | receptor signaling protein tyrosine kinase activity(GO:0004716) |
| 0.0 | 0.7 | GO:0004029 | aldehyde dehydrogenase (NAD) activity(GO:0004029) |
| 0.0 | 0.2 | GO:0005052 | peroxisome matrix targeting signal-1 binding(GO:0005052) |
| 0.0 | 0.2 | GO:0004991 | parathyroid hormone receptor activity(GO:0004991) |
| 0.0 | 0.2 | GO:0046538 | bisphosphoglycerate mutase activity(GO:0004082) phosphoglycerate mutase activity(GO:0004619) 2,3-bisphosphoglycerate-dependent phosphoglycerate mutase activity(GO:0046538) |
| 0.0 | 0.2 | GO:0004105 | choline-phosphate cytidylyltransferase activity(GO:0004105) |
| 0.0 | 0.7 | GO:0005095 | GTPase inhibitor activity(GO:0005095) |
| 0.0 | 0.2 | GO:0030306 | ADP-ribosylation factor binding(GO:0030306) |
| 0.0 | 0.3 | GO:0089720 | caspase binding(GO:0089720) |
| 0.0 | 0.2 | GO:0004140 | dephospho-CoA kinase activity(GO:0004140) |
| 0.0 | 0.4 | GO:0016500 | protein-hormone receptor activity(GO:0016500) |
| 0.0 | 0.2 | GO:0031433 | telethonin binding(GO:0031433) |
| 0.0 | 0.1 | GO:0070700 | receptor serine/threonine kinase binding(GO:0033612) BMP receptor binding(GO:0070700) |
| 0.0 | 0.1 | GO:0070740 | tubulin-glutamic acid ligase activity(GO:0070740) |
| 0.0 | 0.2 | GO:0005044 | scavenger receptor activity(GO:0005044) |
| 0.0 | 0.2 | GO:1990380 | Lys48-specific deubiquitinase activity(GO:1990380) |
| 0.0 | 0.1 | GO:0004447 | iodide peroxidase activity(GO:0004447) |
| 0.0 | 4.3 | GO:0004930 | G-protein coupled receptor activity(GO:0004930) |
| 0.0 | 0.2 | GO:0043274 | phospholipase binding(GO:0043274) |
| 0.0 | 0.1 | GO:0004102 | choline O-acetyltransferase activity(GO:0004102) |
| 0.0 | 0.2 | GO:0019789 | SUMO transferase activity(GO:0019789) |
| 0.0 | 0.1 | GO:0001733 | galactosylceramide sulfotransferase activity(GO:0001733) galactose 3-O-sulfotransferase activity(GO:0050694) |
| 0.0 | 0.0 | GO:0016638 | oxidoreductase activity, acting on the CH-NH2 group of donors(GO:0016638) |
| 0.0 | 1.5 | GO:0005200 | structural constituent of cytoskeleton(GO:0005200) |
Gene overrepresentation in curated gene sets: canonical pathways category:
| Log-likelihood per target | Total log-likelihood | Term | Description |
|---|---|---|---|
| 2.1 | 8.3 | ST PHOSPHOINOSITIDE 3 KINASE PATHWAY | PI3K Pathway |
| 1.7 | 1.7 | ST B CELL ANTIGEN RECEPTOR | B Cell Antigen Receptor |
| 1.3 | 65.2 | NABA PROTEOGLYCANS | Genes encoding proteoglycans |
| 0.9 | 3.7 | PID WNT CANONICAL PATHWAY | Canonical Wnt signaling pathway |
| 0.9 | 7.1 | ST INTEGRIN SIGNALING PATHWAY | Integrin Signaling Pathway |
| 0.8 | 22.4 | PID S1P S1P4 PATHWAY | S1P4 pathway |
| 0.8 | 3.1 | SA PTEN PATHWAY | PTEN is a tumor suppressor that dephosphorylates the lipid messenger phosphatidylinositol triphosphate. |
| 0.8 | 24.1 | PID IL8 CXCR1 PATHWAY | IL8- and CXCR1-mediated signaling events |
| 0.7 | 6.6 | PID FAS PATHWAY | FAS (CD95) signaling pathway |
| 0.7 | 40.4 | PID NCADHERIN PATHWAY | N-cadherin signaling events |
| 0.7 | 8.6 | ST PAC1 RECEPTOR PATHWAY | PAC1 Receptor Pathway |
| 0.6 | 5.2 | PID THROMBIN PAR4 PATHWAY | PAR4-mediated thrombin signaling events |
| 0.6 | 13.5 | PID S1P S1P3 PATHWAY | S1P3 pathway |
| 0.6 | 36.0 | PID IL12 STAT4 PATHWAY | IL12 signaling mediated by STAT4 |
| 0.6 | 3.7 | PID ALK1 PATHWAY | ALK1 signaling events |
| 0.6 | 1.2 | PID TXA2PATHWAY | Thromboxane A2 receptor signaling |
| 0.6 | 15.6 | PID SYNDECAN 3 PATHWAY | Syndecan-3-mediated signaling events |
| 0.6 | 20.2 | ST GA12 PATHWAY | G alpha 12 Pathway |
| 0.6 | 0.6 | SA G2 AND M PHASES | Cdc25 activates the cdc2/cyclin B complex to induce the G2/M transition. |
| 0.6 | 11.2 | SA REG CASCADE OF CYCLIN EXPR | Expression of cyclins regulates progression through the cell cycle by activating cyclin-dependent kinases. |
| 0.5 | 2.6 | PID CXCR4 PATHWAY | CXCR4-mediated signaling events |
| 0.5 | 3.6 | SA FAS SIGNALING | The TNF-type receptor Fas induces apoptosis on ligand binding. |
| 0.5 | 26.4 | SIG CD40PATHWAYMAP | Genes related to CD40 signaling |
| 0.5 | 8.2 | ST JNK MAPK PATHWAY | JNK MAPK Pathway |
| 0.5 | 11.5 | PID CONE PATHWAY | Visual signal transduction: Cones |
| 0.5 | 11.2 | ST WNT BETA CATENIN PATHWAY | Wnt/beta-catenin Pathway |
| 0.5 | 3.2 | PID TCR RAS PATHWAY | Ras signaling in the CD4+ TCR pathway |
| 0.4 | 7.6 | PID HDAC CLASSIII PATHWAY | Signaling events mediated by HDAC Class III |
| 0.4 | 3.8 | SA TRKA RECEPTOR | The TrkA receptor binds nerve growth factor to activate MAP kinase pathways and promote cell growth. |
| 0.4 | 10.8 | ST ADRENERGIC | Adrenergic Pathway |
| 0.4 | 19.6 | PID ENDOTHELIN PATHWAY | Endothelins |
| 0.4 | 12.7 | PID REELIN PATHWAY | Reelin signaling pathway |
| 0.4 | 16.2 | NABA COLLAGENS | Genes encoding collagen proteins |
| 0.3 | 6.3 | PID CIRCADIAN PATHWAY | Circadian rhythm pathway |
| 0.3 | 23.7 | PID RAC1 REG PATHWAY | Regulation of RAC1 activity |
| 0.3 | 4.8 | SA PROGRAMMED CELL DEATH | Programmed cell death, or apoptosis, eliminates damaged or unneeded cells. |
| 0.3 | 4.1 | PID RAC1 PATHWAY | RAC1 signaling pathway |
| 0.3 | 2.5 | ST STAT3 PATHWAY | STAT3 Pathway |
| 0.3 | 4.9 | PID IL1 PATHWAY | IL1-mediated signaling events |
| 0.3 | 3.0 | PID A6B1 A6B4 INTEGRIN PATHWAY | a6b1 and a6b4 Integrin signaling |
| 0.3 | 1.5 | PID BARD1 PATHWAY | BARD1 signaling events |
| 0.3 | 18.8 | PID RHOA REG PATHWAY | Regulation of RhoA activity |
| 0.3 | 3.9 | PID PI3K PLC TRK PATHWAY | Trk receptor signaling mediated by PI3K and PLC-gamma |
| 0.3 | 7.5 | PID FCER1 PATHWAY | Fc-epsilon receptor I signaling in mast cells |
| 0.3 | 7.8 | PID INTEGRIN2 PATHWAY | Beta2 integrin cell surface interactions |
| 0.3 | 2.2 | ST G ALPHA I PATHWAY | G alpha i Pathway |
| 0.3 | 8.0 | PID SYNDECAN 2 PATHWAY | Syndecan-2-mediated signaling events |
| 0.3 | 16.6 | PID INTEGRIN A4B1 PATHWAY | Alpha4 beta1 integrin signaling events |
| 0.3 | 3.5 | PID ECADHERIN KERATINOCYTE PATHWAY | E-cadherin signaling in keratinocytes |
| 0.3 | 3.7 | ST TYPE I INTERFERON PATHWAY | Type I Interferon (alpha/beta IFN) Pathway |
| 0.3 | 0.5 | PID IL5 PATHWAY | IL5-mediated signaling events |
| 0.3 | 1.3 | ST INTERFERON GAMMA PATHWAY | Interferon gamma pathway. |
| 0.2 | 9.9 | PID ALPHA SYNUCLEIN PATHWAY | Alpha-synuclein signaling |
| 0.2 | 10.3 | PID P75 NTR PATHWAY | p75(NTR)-mediated signaling |
| 0.2 | 4.1 | PID EPHRINB REV PATHWAY | Ephrin B reverse signaling |
| 0.2 | 64.5 | NABA ECM REGULATORS | Genes encoding enzymes and their regulators involved in the remodeling of the extracellular matrix |
| 0.2 | 3.0 | PID GMCSF PATHWAY | GMCSF-mediated signaling events |
| 0.2 | 6.3 | PID P38 MKK3 6PATHWAY | p38 MAPK signaling pathway |
| 0.2 | 7.3 | ST T CELL SIGNAL TRANSDUCTION | T Cell Signal Transduction |
| 0.2 | 0.4 | PID PDGFRA PATHWAY | PDGFR-alpha signaling pathway |
| 0.2 | 5.7 | PID P38 ALPHA BETA PATHWAY | Regulation of p38-alpha and p38-beta |
| 0.2 | 3.8 | PID INTEGRIN5 PATHWAY | Beta5 beta6 beta7 and beta8 integrin cell surface interactions |
| 0.2 | 19.2 | PID IL4 2PATHWAY | IL4-mediated signaling events |
| 0.2 | 1.4 | ST MYOCYTE AD PATHWAY | Myocyte Adrenergic Pathway is a specific case of the generalized Adrenergic Pathway. |
| 0.2 | 14.2 | PID AR TF PATHWAY | Regulation of Androgen receptor activity |
| 0.2 | 34.8 | NABA ECM AFFILIATED | Genes encoding proteins affiliated structurally or functionally to extracellular matrix proteins |
| 0.2 | 2.2 | PID AVB3 INTEGRIN PATHWAY | Integrins in angiogenesis |
| 0.2 | 10.2 | PID CERAMIDE PATHWAY | Ceramide signaling pathway |
| 0.2 | 1.7 | ST GA13 PATHWAY | G alpha 13 Pathway |
| 0.2 | 5.3 | SIG CHEMOTAXIS | Genes related to chemotaxis |
| 0.2 | 2.4 | PID ERBB2 ERBB3 PATHWAY | ErbB2/ErbB3 signaling events |
| 0.2 | 2.0 | ST G ALPHA S PATHWAY | G alpha s Pathway |
| 0.2 | 5.0 | PID INSULIN GLUCOSE PATHWAY | Insulin-mediated glucose transport |
| 0.2 | 7.5 | PID PI3KCI PATHWAY | Class I PI3K signaling events |
| 0.2 | 17.7 | PID AR PATHWAY | Coregulation of Androgen receptor activity |
| 0.2 | 35.2 | NABA CORE MATRISOME | Ensemble of genes encoding core extracellular matrix including ECM glycoproteins, collagens and proteoglycans |
| 0.2 | 2.2 | PID UPA UPAR PATHWAY | Urokinase-type plasminogen activator (uPA) and uPAR-mediated signaling |
| 0.2 | 4.1 | PID FGF PATHWAY | FGF signaling pathway |
| 0.2 | 4.6 | PID ANGIOPOIETIN RECEPTOR PATHWAY | Angiopoietin receptor Tie2-mediated signaling |
| 0.2 | 6.4 | PID HDAC CLASSI PATHWAY | Signaling events mediated by HDAC Class I |
| 0.2 | 18.8 | PID MYC REPRESS PATHWAY | Validated targets of C-MYC transcriptional repression |
| 0.2 | 52.2 | NABA MATRISOME | Ensemble of genes encoding extracellular matrix and extracellular matrix-associated proteins |
| 0.2 | 3.7 | PID GLYPICAN 1PATHWAY | Glypican 1 network |
| 0.2 | 2.7 | PID RHODOPSIN PATHWAY | Visual signal transduction: Rods |
| 0.2 | 3.9 | SIG PIP3 SIGNALING IN CARDIAC MYOCTES | Genes related to PIP3 signaling in cardiac myocytes |
| 0.2 | 1.7 | PID IFNG PATHWAY | IFN-gamma pathway |
| 0.1 | 7.1 | PID REG GR PATHWAY | Glucocorticoid receptor regulatory network |
| 0.1 | 1.6 | PID INTEGRIN A9B1 PATHWAY | Alpha9 beta1 integrin signaling events |
| 0.1 | 6.6 | PID ATR PATHWAY | ATR signaling pathway |
| 0.1 | 2.2 | PID BCR 5PATHWAY | BCR signaling pathway |
| 0.1 | 1.8 | PID LYSOPHOSPHOLIPID PATHWAY | LPA receptor mediated events |
| 0.1 | 6.0 | PID LKB1 PATHWAY | LKB1 signaling events |
| 0.1 | 4.3 | PID HDAC CLASSII PATHWAY | Signaling events mediated by HDAC Class II |
| 0.1 | 0.9 | PID IL27 PATHWAY | IL27-mediated signaling events |
| 0.1 | 0.9 | PID NECTIN PATHWAY | Nectin adhesion pathway |
| 0.1 | 0.3 | PID IL2 STAT5 PATHWAY | IL2 signaling events mediated by STAT5 |
| 0.1 | 0.3 | PID LYMPH ANGIOGENESIS PATHWAY | VEGFR3 signaling in lymphatic endothelium |
| 0.1 | 3.5 | PID HEDGEHOG GLI PATHWAY | Hedgehog signaling events mediated by Gli proteins |
| 0.1 | 1.3 | PID TGFBR PATHWAY | TGF-beta receptor signaling |
| 0.1 | 3.7 | PID HNF3A PATHWAY | FOXA1 transcription factor network |
| 0.1 | 1.4 | PID FRA PATHWAY | Validated transcriptional targets of AP1 family members Fra1 and Fra2 |
| 0.1 | 2.1 | PID NFAT 3PATHWAY | Role of Calcineurin-dependent NFAT signaling in lymphocytes |
| 0.1 | 0.8 | PID RET PATHWAY | Signaling events regulated by Ret tyrosine kinase |
| 0.1 | 1.3 | PID MET PATHWAY | Signaling events mediated by Hepatocyte Growth Factor Receptor (c-Met) |
| 0.1 | 0.7 | PID BETA CATENIN DEG PATHWAY | Degradation of beta catenin |
| 0.1 | 1.9 | PID RXR VDR PATHWAY | RXR and RAR heterodimerization with other nuclear receptor |
| 0.1 | 1.0 | PID P38 MK2 PATHWAY | p38 signaling mediated by MAPKAP kinases |
| 0.0 | 1.2 | PID KIT PATHWAY | Signaling events mediated by Stem cell factor receptor (c-Kit) |
| 0.0 | 0.1 | PID AR NONGENOMIC PATHWAY | Nongenotropic Androgen signaling |
| 0.0 | 0.5 | PID TCR PATHWAY | TCR signaling in naïve CD4+ T cells |
| 0.0 | 0.7 | PID ARF6 TRAFFICKING PATHWAY | Arf6 trafficking events |
| 0.0 | 0.4 | PID CDC42 REG PATHWAY | Regulation of CDC42 activity |
Gene overrepresentation in curated gene sets: REACTOME pathways category:
| Log-likelihood per target | Total log-likelihood | Term | Description |
|---|---|---|---|
| 2.9 | 66.3 | REACTOME DOPAMINE NEUROTRANSMITTER RELEASE CYCLE | Genes involved in Dopamine Neurotransmitter Release Cycle |
| 2.0 | 53.5 | REACTOME CS DS DEGRADATION | Genes involved in CS/DS degradation |
| 1.6 | 26.2 | REACTOME REVERSIBLE HYDRATION OF CARBON DIOXIDE | Genes involved in Reversible Hydration of Carbon Dioxide |
| 1.6 | 23.5 | REACTOME GLUTAMATE NEUROTRANSMITTER RELEASE CYCLE | Genes involved in Glutamate Neurotransmitter Release Cycle |
| 1.3 | 25.1 | REACTOME INITIAL TRIGGERING OF COMPLEMENT | Genes involved in Initial triggering of complement |
| 1.2 | 30.6 | REACTOME ACYL CHAIN REMODELLING OF PC | Genes involved in Acyl chain remodelling of PC |
| 1.2 | 1.2 | REACTOME PROSTACYCLIN SIGNALLING THROUGH PROSTACYCLIN RECEPTOR | Genes involved in Prostacyclin signalling through prostacyclin receptor |
| 1.2 | 24.5 | REACTOME GAP JUNCTION DEGRADATION | Genes involved in Gap junction degradation |
| 1.1 | 14.8 | REACTOME ANDROGEN BIOSYNTHESIS | Genes involved in Androgen biosynthesis |
| 1.0 | 2.1 | REACTOME ACYL CHAIN REMODELLING OF PI | Genes involved in Acyl chain remodelling of PI |
| 1.0 | 36.9 | REACTOME GABA A RECEPTOR ACTIVATION | Genes involved in GABA A receptor activation |
| 1.0 | 23.2 | REACTOME HDL MEDIATED LIPID TRANSPORT | Genes involved in HDL-mediated lipid transport |
| 0.9 | 19.7 | REACTOME TRANSLOCATION OF ZAP 70 TO IMMUNOLOGICAL SYNAPSE | Genes involved in Translocation of ZAP-70 to Immunological synapse |
| 0.9 | 40.1 | REACTOME INTERACTION BETWEEN L1 AND ANKYRINS | Genes involved in Interaction between L1 and Ankyrins |
| 0.9 | 4.6 | REACTOME HS GAG DEGRADATION | Genes involved in HS-GAG degradation |
| 0.9 | 48.8 | REACTOME ION TRANSPORT BY P TYPE ATPASES | Genes involved in Ion transport by P-type ATPases |
| 0.9 | 66.7 | REACTOME MYOGENESIS | Genes involved in Myogenesis |
| 0.9 | 26.1 | REACTOME NA CL DEPENDENT NEUROTRANSMITTER TRANSPORTERS | Genes involved in Na+/Cl- dependent neurotransmitter transporters |
| 0.9 | 22.3 | REACTOME REGULATION OF INSULIN LIKE GROWTH FACTOR IGF ACTIVITY BY INSULIN LIKE GROWTH FACTOR BINDING PROTEINS IGFBPS | Genes involved in Regulation of Insulin-like Growth Factor (IGF) Activity by Insulin-like Growth Factor Binding Proteins (IGFBPs) |
| 0.9 | 8.7 | REACTOME ETHANOL OXIDATION | Genes involved in Ethanol oxidation |
| 0.9 | 6.0 | REACTOME REGULATION OF THE FANCONI ANEMIA PATHWAY | Genes involved in Regulation of the Fanconi anemia pathway |
| 0.8 | 10.0 | REACTOME G ALPHA Z SIGNALLING EVENTS | Genes involved in G alpha (z) signalling events |
| 0.8 | 2.4 | REACTOME PLATELET AGGREGATION PLUG FORMATION | Genes involved in Platelet Aggregation (Plug Formation) |
| 0.8 | 8.3 | REACTOME THE ACTIVATION OF ARYLSULFATASES | Genes involved in The activation of arylsulfatases |
| 0.7 | 38.5 | REACTOME VOLTAGE GATED POTASSIUM CHANNELS | Genes involved in Voltage gated Potassium channels |
| 0.7 | 15.6 | REACTOME OTHER SEMAPHORIN INTERACTIONS | Genes involved in Other semaphorin interactions |
| 0.7 | 15.0 | REACTOME ACTIVATION OF THE AP1 FAMILY OF TRANSCRIPTION FACTORS | Genes involved in Activation of the AP-1 family of transcription factors |
| 0.7 | 2.7 | REACTOME TRAFFICKING OF GLUR2 CONTAINING AMPA RECEPTORS | Genes involved in Trafficking of GluR2-containing AMPA receptors |
| 0.6 | 2.5 | REACTOME ENDOSOMAL VACUOLAR PATHWAY | Genes involved in Endosomal/Vacuolar pathway |
| 0.6 | 9.2 | REACTOME PLATELET ADHESION TO EXPOSED COLLAGEN | Genes involved in Platelet Adhesion to exposed collagen |
| 0.6 | 24.4 | REACTOME G PROTEIN ACTIVATION | Genes involved in G-protein activation |
| 0.6 | 44.1 | REACTOME NCAM1 INTERACTIONS | Genes involved in NCAM1 interactions |
| 0.6 | 5.8 | REACTOME HORMONE SENSITIVE LIPASE HSL MEDIATED TRIACYLGLYCEROL HYDROLYSIS | Genes involved in Hormone-sensitive lipase (HSL)-mediated triacylglycerol hydrolysis |
| 0.6 | 113.1 | REACTOME PEPTIDE LIGAND BINDING RECEPTORS | Genes involved in Peptide ligand-binding receptors |
| 0.6 | 5.1 | REACTOME CIRCADIAN CLOCK | Genes involved in Circadian Clock |
| 0.5 | 14.6 | REACTOME GLYCOGEN BREAKDOWN GLYCOGENOLYSIS | Genes involved in Glycogen breakdown (glycogenolysis) |
| 0.5 | 17.1 | REACTOME UNBLOCKING OF NMDA RECEPTOR GLUTAMATE BINDING AND ACTIVATION | Genes involved in Unblocking of NMDA receptor, glutamate binding and activation |
| 0.5 | 7.2 | REACTOME SEROTONIN RECEPTORS | Genes involved in Serotonin receptors |
| 0.5 | 44.7 | REACTOME OLFACTORY SIGNALING PATHWAY | Genes involved in Olfactory Signaling Pathway |
| 0.5 | 11.1 | REACTOME RESOLUTION OF AP SITES VIA THE SINGLE NUCLEOTIDE REPLACEMENT PATHWAY | Genes involved in Resolution of AP sites via the single-nucleotide replacement pathway |
| 0.5 | 7.5 | REACTOME PYRIMIDINE CATABOLISM | Genes involved in Pyrimidine catabolism |
| 0.5 | 18.7 | REACTOME RAP1 SIGNALLING | Genes involved in Rap1 signalling |
| 0.5 | 4.3 | REACTOME ION CHANNEL TRANSPORT | Genes involved in Ion channel transport |
| 0.5 | 2.3 | REACTOME IRAK2 MEDIATED ACTIVATION OF TAK1 COMPLEX UPON TLR7 8 OR 9 STIMULATION | Genes involved in IRAK2 mediated activation of TAK1 complex upon TLR7/8 or 9 stimulation |
| 0.5 | 3.2 | REACTOME SHC MEDIATED SIGNALLING | Genes involved in SHC-mediated signalling |
| 0.4 | 18.0 | REACTOME AMYLOIDS | Genes involved in Amyloids |
| 0.4 | 2.6 | REACTOME G BETA GAMMA SIGNALLING THROUGH PI3KGAMMA | Genes involved in G beta:gamma signalling through PI3Kgamma |
| 0.4 | 43.4 | REACTOME G ALPHA I SIGNALLING EVENTS | Genes involved in G alpha (i) signalling events |
| 0.4 | 27.6 | REACTOME NRAGE SIGNALS DEATH THROUGH JNK | Genes involved in NRAGE signals death through JNK |
| 0.4 | 0.8 | REACTOME DAG AND IP3 SIGNALING | Genes involved in DAG and IP3 signaling |
| 0.4 | 5.2 | REACTOME PASSIVE TRANSPORT BY AQUAPORINS | Genes involved in Passive Transport by Aquaporins |
| 0.4 | 6.5 | REACTOME ORGANIC CATION ANION ZWITTERION TRANSPORT | Genes involved in Organic cation/anion/zwitterion transport |
| 0.4 | 1.9 | REACTOME TCR SIGNALING | Genes involved in TCR signaling |
| 0.4 | 10.7 | REACTOME EFFECTS OF PIP2 HYDROLYSIS | Genes involved in Effects of PIP2 hydrolysis |
| 0.4 | 16.9 | REACTOME REGULATION OF GENE EXPRESSION IN BETA CELLS | Genes involved in Regulation of gene expression in beta cells |
| 0.4 | 9.3 | REACTOME GENERATION OF SECOND MESSENGER MOLECULES | Genes involved in Generation of second messenger molecules |
| 0.4 | 4.4 | REACTOME HORMONE LIGAND BINDING RECEPTORS | Genes involved in Hormone ligand-binding receptors |
| 0.4 | 2.9 | REACTOME G ALPHA1213 SIGNALLING EVENTS | Genes involved in G alpha (12/13) signalling events |
| 0.4 | 11.0 | REACTOME SPHINGOLIPID DE NOVO BIOSYNTHESIS | Genes involved in Sphingolipid de novo biosynthesis |
| 0.4 | 0.7 | REACTOME REGULATION OF SIGNALING BY CBL | Genes involved in Regulation of signaling by CBL |
| 0.3 | 2.0 | REACTOME INTEGRATION OF ENERGY METABOLISM | Genes involved in Integration of energy metabolism |
| 0.3 | 14.2 | REACTOME LATENT INFECTION OF HOMO SAPIENS WITH MYCOBACTERIUM TUBERCULOSIS | Genes involved in Latent infection of Homo sapiens with Mycobacterium tuberculosis |
| 0.3 | 9.8 | REACTOME KERATAN SULFATE BIOSYNTHESIS | Genes involved in Keratan sulfate biosynthesis |
| 0.3 | 10.4 | REACTOME ACTIVATED AMPK STIMULATES FATTY ACID OXIDATION IN MUSCLE | Genes involved in Activated AMPK stimulates fatty-acid oxidation in muscle |
| 0.3 | 0.6 | REACTOME REMOVAL OF THE FLAP INTERMEDIATE FROM THE C STRAND | Genes involved in Removal of the Flap Intermediate from the C-strand |
| 0.3 | 5.7 | REACTOME GAMMA CARBOXYLATION TRANSPORT AND AMINO TERMINAL CLEAVAGE OF PROTEINS | Genes involved in Gamma-carboxylation, transport, and amino-terminal cleavage of proteins |
| 0.3 | 7.5 | REACTOME METABOLISM OF STEROID HORMONES AND VITAMINS A AND D | Genes involved in Metabolism of steroid hormones and vitamins A and D |
| 0.3 | 6.9 | REACTOME FGFR2C LIGAND BINDING AND ACTIVATION | Genes involved in FGFR2c ligand binding and activation |
| 0.3 | 6.0 | REACTOME IL RECEPTOR SHC SIGNALING | Genes involved in Interleukin receptor SHC signaling |
| 0.3 | 12.8 | REACTOME NITRIC OXIDE STIMULATES GUANYLATE CYCLASE | Genes involved in Nitric oxide stimulates guanylate cyclase |
| 0.3 | 3.4 | REACTOME SYNTHESIS OF BILE ACIDS AND BILE SALTS VIA 24 HYDROXYCHOLESTEROL | Genes involved in Synthesis of bile acids and bile salts via 24-hydroxycholesterol |
| 0.3 | 4.7 | REACTOME IL 7 SIGNALING | Genes involved in Interleukin-7 signaling |
| 0.3 | 1.4 | REACTOME REGULATION OF RHEB GTPASE ACTIVITY BY AMPK | Genes involved in Regulation of Rheb GTPase activity by AMPK |
| 0.3 | 6.2 | REACTOME SYNTHESIS OF PIPS AT THE GOLGI MEMBRANE | Genes involved in Synthesis of PIPs at the Golgi membrane |
| 0.3 | 8.1 | REACTOME HS GAG BIOSYNTHESIS | Genes involved in HS-GAG biosynthesis |
| 0.3 | 9.9 | REACTOME TIGHT JUNCTION INTERACTIONS | Genes involved in Tight junction interactions |
| 0.3 | 6.9 | REACTOME ADHERENS JUNCTIONS INTERACTIONS | Genes involved in Adherens junctions interactions |
| 0.2 | 3.9 | REACTOME AMINE LIGAND BINDING RECEPTORS | Genes involved in Amine ligand-binding receptors |
| 0.2 | 20.2 | REACTOME IMMUNOREGULATORY INTERACTIONS BETWEEN A LYMPHOID AND A NON LYMPHOID CELL | Genes involved in Immunoregulatory interactions between a Lymphoid and a non-Lymphoid cell |
| 0.2 | 14.7 | REACTOME AMINO ACID AND OLIGOPEPTIDE SLC TRANSPORTERS | Genes involved in Amino acid and oligopeptide SLC transporters |
| 0.2 | 2.9 | REACTOME ROLE OF DCC IN REGULATING APOPTOSIS | Genes involved in Role of DCC in regulating apoptosis |
| 0.2 | 2.2 | REACTOME PRE NOTCH PROCESSING IN GOLGI | Genes involved in Pre-NOTCH Processing in Golgi |
| 0.2 | 14.2 | REACTOME TRANSPORT OF INORGANIC CATIONS ANIONS AND AMINO ACIDS OLIGOPEPTIDES | Genes involved in Transport of inorganic cations/anions and amino acids/oligopeptides |
| 0.2 | 3.4 | REACTOME GAP JUNCTION TRAFFICKING | Genes involved in Gap junction trafficking |
| 0.2 | 0.6 | REACTOME GLUCAGON SIGNALING IN METABOLIC REGULATION | Genes involved in Glucagon signaling in metabolic regulation |
| 0.2 | 1.8 | REACTOME AMINE COMPOUND SLC TRANSPORTERS | Genes involved in Amine compound SLC transporters |
| 0.2 | 4.5 | REACTOME HIGHLY CALCIUM PERMEABLE POSTSYNAPTIC NICOTINIC ACETYLCHOLINE RECEPTORS | Genes involved in Highly calcium permeable postsynaptic nicotinic acetylcholine receptors |
| 0.2 | 2.3 | REACTOME YAP1 AND WWTR1 TAZ STIMULATED GENE EXPRESSION | Genes involved in YAP1- and WWTR1 (TAZ)-stimulated gene expression |
| 0.2 | 2.5 | REACTOME ANTIGEN ACTIVATES B CELL RECEPTOR LEADING TO GENERATION OF SECOND MESSENGERS | Genes involved in Antigen Activates B Cell Receptor Leading to Generation of Second Messengers |
| 0.2 | 5.5 | REACTOME SYNTHESIS OF VERY LONG CHAIN FATTY ACYL COAS | Genes involved in Synthesis of very long-chain fatty acyl-CoAs |
| 0.2 | 4.4 | REACTOME SIGNALING BY ROBO RECEPTOR | Genes involved in Signaling by Robo receptor |
| 0.2 | 7.8 | REACTOME DARPP 32 EVENTS | Genes involved in DARPP-32 events |
| 0.2 | 3.4 | REACTOME TERMINATION OF O GLYCAN BIOSYNTHESIS | Genes involved in Termination of O-glycan biosynthesis |
| 0.2 | 6.6 | REACTOME NOTCH1 INTRACELLULAR DOMAIN REGULATES TRANSCRIPTION | Genes involved in NOTCH1 Intracellular Domain Regulates Transcription |
| 0.2 | 3.6 | REACTOME TRAF3 DEPENDENT IRF ACTIVATION PATHWAY | Genes involved in TRAF3-dependent IRF activation pathway |
| 0.2 | 1.3 | REACTOME THROMBOXANE SIGNALLING THROUGH TP RECEPTOR | Genes involved in Thromboxane signalling through TP receptor |
| 0.2 | 1.1 | REACTOME BETA DEFENSINS | Genes involved in Beta defensins |
| 0.2 | 8.2 | REACTOME MEIOTIC SYNAPSIS | Genes involved in Meiotic Synapsis |
| 0.2 | 2.8 | REACTOME XENOBIOTICS | Genes involved in Xenobiotics |
| 0.2 | 1.1 | REACTOME ACTIVATION OF IRF3 IRF7 MEDIATED BY TBK1 IKK EPSILON | Genes involved in Activation of IRF3/IRF7 mediated by TBK1/IKK epsilon |
| 0.2 | 1.9 | REACTOME RECYCLING OF BILE ACIDS AND SALTS | Genes involved in Recycling of bile acids and salts |
| 0.2 | 7.3 | REACTOME SMOOTH MUSCLE CONTRACTION | Genes involved in Smooth Muscle Contraction |
| 0.2 | 2.2 | REACTOME CLASS C 3 METABOTROPIC GLUTAMATE PHEROMONE RECEPTORS | Genes involved in Class C/3 (Metabotropic glutamate/pheromone receptors) |
| 0.1 | 4.3 | REACTOME BRANCHED CHAIN AMINO ACID CATABOLISM | Genes involved in Branched-chain amino acid catabolism |
| 0.1 | 3.0 | REACTOME CRMPS IN SEMA3A SIGNALING | Genes involved in CRMPs in Sema3A signaling |
| 0.1 | 3.9 | REACTOME IONOTROPIC ACTIVITY OF KAINATE RECEPTORS | Genes involved in Ionotropic activity of Kainate Receptors |
| 0.1 | 0.5 | REACTOME PD1 SIGNALING | Genes involved in PD-1 signaling |
| 0.1 | 1.8 | REACTOME P2Y RECEPTORS | Genes involved in P2Y receptors |
| 0.1 | 9.5 | REACTOME NUCLEAR SIGNALING BY ERBB4 | Genes involved in Nuclear signaling by ERBB4 |
| 0.1 | 0.7 | REACTOME A TETRASACCHARIDE LINKER SEQUENCE IS REQUIRED FOR GAG SYNTHESIS | Genes involved in A tetrasaccharide linker sequence is required for GAG synthesis |
| 0.1 | 13.8 | REACTOME SIGNALING BY RHO GTPASES | Genes involved in Signaling by Rho GTPases |
| 0.1 | 1.1 | REACTOME DEFENSINS | Genes involved in Defensins |
| 0.1 | 5.4 | REACTOME POTASSIUM CHANNELS | Genes involved in Potassium Channels |
| 0.1 | 0.3 | REACTOME FORMATION OF TRANSCRIPTION COUPLED NER TC NER REPAIR COMPLEX | Genes involved in Formation of transcription-coupled NER (TC-NER) repair complex |
| 0.1 | 1.0 | REACTOME ABACAVIR TRANSPORT AND METABOLISM | Genes involved in Abacavir transport and metabolism |
| 0.1 | 1.6 | REACTOME SYNTHESIS OF PE | Genes involved in Synthesis of PE |
| 0.1 | 1.3 | REACTOME IL 6 SIGNALING | Genes involved in Interleukin-6 signaling |
| 0.1 | 1.0 | REACTOME ARMS MEDIATED ACTIVATION | Genes involved in ARMS-mediated activation |
| 0.1 | 8.5 | REACTOME NUCLEAR RECEPTOR TRANSCRIPTION PATHWAY | Genes involved in Nuclear Receptor transcription pathway |
| 0.1 | 27.6 | REACTOME GENERIC TRANSCRIPTION PATHWAY | Genes involved in Generic Transcription Pathway |
| 0.1 | 2.7 | REACTOME SULFUR AMINO ACID METABOLISM | Genes involved in Sulfur amino acid metabolism |
| 0.1 | 4.0 | REACTOME TRANSCRIPTIONAL REGULATION OF WHITE ADIPOCYTE DIFFERENTIATION | Genes involved in Transcriptional Regulation of White Adipocyte Differentiation |
| 0.1 | 2.7 | REACTOME BMAL1 CLOCK NPAS2 ACTIVATES CIRCADIAN EXPRESSION | Genes involved in BMAL1:CLOCK/NPAS2 Activates Circadian Expression |
| 0.1 | 2.0 | REACTOME P75 NTR RECEPTOR MEDIATED SIGNALLING | Genes involved in p75 NTR receptor-mediated signalling |
| 0.1 | 1.2 | REACTOME SEMA4D INDUCED CELL MIGRATION AND GROWTH CONE COLLAPSE | Genes involved in Sema4D induced cell migration and growth-cone collapse |
| 0.1 | 3.3 | REACTOME PHASE1 FUNCTIONALIZATION OF COMPOUNDS | Genes involved in Phase 1 - Functionalization of compounds |
| 0.1 | 1.2 | REACTOME CYTOSOLIC SULFONATION OF SMALL MOLECULES | Genes involved in Cytosolic sulfonation of small molecules |
| 0.1 | 1.6 | REACTOME PYRIMIDINE METABOLISM | Genes involved in Pyrimidine metabolism |
| 0.1 | 2.6 | REACTOME COLLAGEN FORMATION | Genes involved in Collagen formation |
| 0.1 | 3.8 | REACTOME G ALPHA S SIGNALLING EVENTS | Genes involved in G alpha (s) signalling events |
| 0.1 | 0.4 | REACTOME PRE NOTCH EXPRESSION AND PROCESSING | Genes involved in Pre-NOTCH Expression and Processing |
| 0.1 | 1.1 | REACTOME FACILITATIVE NA INDEPENDENT GLUCOSE TRANSPORTERS | Genes involved in Facilitative Na+-independent glucose transporters |
| 0.1 | 0.9 | REACTOME BILE SALT AND ORGANIC ANION SLC TRANSPORTERS | Genes involved in Bile salt and organic anion SLC transporters |
| 0.1 | 1.7 | REACTOME IL1 SIGNALING | Genes involved in Interleukin-1 signaling |
| 0.0 | 1.2 | REACTOME NETRIN1 SIGNALING | Genes involved in Netrin-1 signaling |
| 0.0 | 0.4 | REACTOME FGFR LIGAND BINDING AND ACTIVATION | Genes involved in FGFR ligand binding and activation |
| 0.0 | 0.6 | REACTOME ERK MAPK TARGETS | Genes involved in ERK/MAPK targets |
| 0.0 | 0.5 | REACTOME AMINE DERIVED HORMONES | Genes involved in Amine-derived hormones |
| 0.0 | 0.1 | REACTOME TRAF6 MEDIATED IRF7 ACTIVATION IN TLR7 8 OR 9 SIGNALING | Genes involved in TRAF6 mediated IRF7 activation in TLR7/8 or 9 signaling |
| 0.0 | 0.1 | REACTOME DSCAM INTERACTIONS | Genes involved in DSCAM interactions |
| 0.0 | 0.3 | REACTOME VEGF LIGAND RECEPTOR INTERACTIONS | Genes involved in VEGF ligand-receptor interactions |
| 0.0 | 0.1 | REACTOME ACETYLCHOLINE NEUROTRANSMITTER RELEASE CYCLE | Genes involved in Acetylcholine Neurotransmitter Release Cycle |