|
chr17_-_49764123
Show fit
|
15.96 |
ENST00000240364.7
ENST00000506156.1
|
FAM117A
|
family with sequence similarity 117 member A
|
|
chr11_+_119087979
Show fit
|
15.02 |
ENST00000535253.5
ENST00000392841.1
ENST00000648374.1
|
HMBS
|
hydroxymethylbilane synthase
|
|
chr12_-_54295748
Show fit
|
14.79 |
ENST00000540264.2
ENST00000312156.8
|
NFE2
|
nuclear factor, erythroid 2
|
|
chr1_-_158686700
Show fit
|
12.46 |
ENST00000643759.2
|
SPTA1
|
spectrin alpha, erythrocytic 1
|
|
chr16_+_31527876
Show fit
|
11.61 |
ENST00000302312.9
ENST00000564707.1
|
AHSP
|
alpha hemoglobin stabilizing protein
|
|
chr7_-_142962206
Show fit
|
10.97 |
ENST00000460479.2
ENST00000476829.5
ENST00000355265.7
|
KEL
|
Kell metallo-endopeptidase (Kell blood group)
|
|
chr19_-_13102848
Show fit
|
10.46 |
ENST00000264824.5
|
LYL1
|
LYL1 basic helix-loop-helix family member
|
|
chr15_-_43220989
Show fit
|
9.82 |
ENST00000540029.5
ENST00000441366.7
ENST00000648595.1
|
EPB42
|
erythrocyte membrane protein band 4.2
|
|
chr7_-_100641507
Show fit
|
9.59 |
ENST00000431692.5
ENST00000223051.8
|
TFR2
|
transferrin receptor 2
|
|
chr1_+_25272439
Show fit
|
9.55 |
ENST00000648012.1
|
RHD
|
Rh blood group D antigen
|
|
chr1_-_206023889
Show fit
|
9.06 |
ENST00000358184.7
ENST00000360218.3
ENST00000678712.1
ENST00000678498.1
|
CTSE
|
cathepsin E
|
|
chr7_+_142760398
Show fit
|
7.46 |
ENST00000632998.1
|
PRSS2
|
serine protease 2
|
|
chr1_+_25272492
Show fit
|
6.91 |
ENST00000454452.6
|
RHD
|
Rh blood group D antigen
|
|
chr8_-_41797589
Show fit
|
6.46 |
ENST00000347528.8
ENST00000289734.13
|
ANK1
|
ankyrin 1
|
|
chr13_-_46142834
Show fit
|
6.34 |
ENST00000674665.1
|
LCP1
|
lymphocyte cytosolic protein 1
|
|
chr1_+_25272502
Show fit
|
5.97 |
ENST00000328664.9
|
RHD
|
Rh blood group D antigen
|
|
chr7_+_130380339
Show fit
|
5.95 |
ENST00000481342.5
ENST00000604896.5
ENST00000011292.8
|
CPA1
|
carboxypeptidase A1
|
|
chr19_+_10286944
Show fit
|
5.68 |
ENST00000380770.5
|
ICAM4
|
intercellular adhesion molecule 4 (Landsteiner-Wiener blood group)
|
|
chr19_+_10286971
Show fit
|
5.57 |
ENST00000340992.4
ENST00000393717.2
|
ICAM4
|
intercellular adhesion molecule 4 (Landsteiner-Wiener blood group)
|
|
chr1_+_25272479
Show fit
|
5.51 |
ENST00000622561.4
|
RHD
|
Rh blood group D antigen
|
|
chr1_+_25272527
Show fit
|
5.49 |
ENST00000342055.9
ENST00000357542.8
ENST00000417538.6
ENST00000423810.6
ENST00000568195.5
|
RHD
|
Rh blood group D antigen
|
|
chr10_+_116545907
Show fit
|
5.41 |
ENST00000369221.2
|
PNLIP
|
pancreatic lipase
|
|
chr8_+_21966215
Show fit
|
5.38 |
ENST00000433566.8
|
XPO7
|
exportin 7
|
|
chr17_-_64006880
Show fit
|
5.14 |
ENST00000449662.6
|
ICAM2
|
intercellular adhesion molecule 2
|
|
chr1_+_161166390
Show fit
|
5.08 |
ENST00000352210.9
ENST00000367999.9
ENST00000497522.5
ENST00000652182.1
ENST00000544598.5
ENST00000535223.5
|
PPOX
|
protoporphyrinogen oxidase
|
|
chr7_+_142749465
Show fit
|
5.07 |
ENST00000486171.5
ENST00000619214.4
ENST00000311737.12
|
PRSS1
|
serine protease 1
|
|
chr13_-_40982880
Show fit
|
5.06 |
ENST00000635415.1
|
ELF1
|
E74 like ETS transcription factor 1
|
|
chr6_-_30160880
Show fit
|
4.57 |
ENST00000376704.3
|
TRIM10
|
tripartite motif containing 10
|
|
chr6_-_30161200
Show fit
|
4.11 |
ENST00000449742.7
|
TRIM10
|
tripartite motif containing 10
|
|
chr11_-_57390636
Show fit
|
3.75 |
ENST00000525955.1
ENST00000533605.5
ENST00000311862.10
|
PRG2
|
proteoglycan 2, pro eosinophil major basic protein
|
|
chr22_-_19881369
Show fit
|
3.73 |
ENST00000462330.5
|
TXNRD2
|
thioredoxin reductase 2
|
|
chr3_+_152268920
Show fit
|
3.48 |
ENST00000495875.6
ENST00000324210.10
ENST00000493459.5
|
MBNL1
|
muscleblind like splicing regulator 1
|
|
chr19_-_11384299
Show fit
|
3.46 |
ENST00000592375.6
ENST00000222139.11
|
EPOR
|
erythropoietin receptor
|
|
chr22_-_19881163
Show fit
|
3.45 |
ENST00000485358.5
|
TXNRD2
|
thioredoxin reductase 2
|
|
chr10_+_116590956
Show fit
|
3.14 |
ENST00000358834.9
ENST00000528052.5
|
PNLIPRP1
|
pancreatic lipase related protein 1
|
|
chr8_-_94436926
Show fit
|
3.02 |
ENST00000481490.3
|
FSBP
|
fibrinogen silencer binding protein
|
|
chr10_+_116591010
Show fit
|
2.87 |
ENST00000530319.5
ENST00000527980.5
ENST00000471549.5
ENST00000534537.5
|
PNLIPRP1
|
pancreatic lipase related protein 1
|
|
chr10_-_97771954
Show fit
|
2.85 |
ENST00000266066.4
|
SFRP5
|
secreted frizzled related protein 5
|
|
chr9_+_33795551
Show fit
|
2.79 |
ENST00000379405.4
|
PRSS3
|
serine protease 3
|
|
chr4_-_102345196
Show fit
|
2.55 |
ENST00000683412.1
ENST00000682227.1
|
SLC39A8
|
solute carrier family 39 member 8
|
|
chr12_+_111405861
Show fit
|
2.38 |
ENST00000341259.7
|
SH2B3
|
SH2B adaptor protein 3
|
|
chr8_-_144792380
Show fit
|
2.22 |
ENST00000532702.1
ENST00000394920.6
ENST00000528957.6
ENST00000527914.5
|
RPL8
|
ribosomal protein L8
|
|
chr14_-_22815421
Show fit
|
1.81 |
ENST00000674313.1
ENST00000555959.1
|
SLC7A7
|
solute carrier family 7 member 7
|
|
chr17_+_58755821
Show fit
|
1.80 |
ENST00000308249.4
|
PPM1E
|
protein phosphatase, Mg2+/Mn2+ dependent 1E
|
|
chr10_-_125816510
Show fit
|
1.79 |
ENST00000650587.1
|
UROS
|
uroporphyrinogen III synthase
|
|
chr1_-_26913964
Show fit
|
1.77 |
ENST00000254227.4
|
NR0B2
|
nuclear receptor subfamily 0 group B member 2
|
|
chr8_-_20183127
Show fit
|
1.68 |
ENST00000276373.10
ENST00000519026.5
ENST00000440926.3
ENST00000437980.3
|
SLC18A1
|
solute carrier family 18 member A1
|
|
chr4_+_99574812
Show fit
|
1.67 |
ENST00000422897.6
ENST00000265517.10
|
MTTP
|
microsomal triglyceride transfer protein
|
|
chr3_+_69763726
Show fit
|
1.63 |
ENST00000448226.9
|
MITF
|
melanocyte inducing transcription factor
|
|
chr8_-_20183090
Show fit
|
1.62 |
ENST00000265808.11
ENST00000522513.5
|
SLC18A1
|
solute carrier family 18 member A1
|
|
chr20_-_56392131
Show fit
|
1.48 |
ENST00000422322.5
ENST00000371356.6
ENST00000451915.1
ENST00000347343.6
ENST00000395911.5
ENST00000395915.8
ENST00000395907.5
ENST00000441357.5
ENST00000456249.5
ENST00000420474.5
ENST00000395914.5
ENST00000312783.10
ENST00000395913.7
|
AURKA
|
aurora kinase A
|
|
chr14_+_75522427
Show fit
|
1.47 |
ENST00000286639.8
|
BATF
|
basic leucine zipper ATF-like transcription factor
|
|
chr1_+_171248471
Show fit
|
1.42 |
ENST00000402921.6
ENST00000617670.6
ENST00000367750.7
|
FMO1
|
flavin containing dimethylaniline monoxygenase 1
|
|
chr16_+_283157
Show fit
|
1.31 |
ENST00000219406.11
ENST00000404312.5
ENST00000456379.1
|
PDIA2
|
protein disulfide isomerase family A member 2
|
|
chr6_+_31706866
Show fit
|
1.21 |
ENST00000375832.5
ENST00000503322.1
|
LY6G6F
LY6G6F-LY6G6D
|
lymphocyte antigen 6 family member G6F
LY6G6F-LY6G6D readthrough
|
|
chr12_+_6310669
Show fit
|
1.18 |
ENST00000684764.1
|
PLEKHG6
|
pleckstrin homology and RhoGEF domain containing G6
|
|
chr11_-_116837586
Show fit
|
1.12 |
ENST00000375320.5
ENST00000359492.6
ENST00000375329.6
ENST00000375323.5
ENST00000236850.5
|
APOA1
|
apolipoprotein A1
|
|
chr22_-_29388530
Show fit
|
1.11 |
ENST00000357586.7
ENST00000432560.6
ENST00000405198.6
ENST00000317368.11
|
AP1B1
|
adaptor related protein complex 1 subunit beta 1
|
|
chr2_-_68871382
Show fit
|
1.07 |
ENST00000295379.2
|
BMP10
|
bone morphogenetic protein 10
|
|
chr2_+_86441341
Show fit
|
1.02 |
ENST00000312912.10
ENST00000409064.5
|
KDM3A
|
lysine demethylase 3A
|
|
chr12_+_53425070
Show fit
|
1.01 |
ENST00000550839.1
|
AMHR2
|
anti-Mullerian hormone receptor type 2
|
|
chr14_+_75522531
Show fit
|
1.01 |
ENST00000555504.1
|
BATF
|
basic leucine zipper ATF-like transcription factor
|
|
chr4_-_102345061
Show fit
|
1.00 |
ENST00000394833.6
|
SLC39A8
|
solute carrier family 39 member 8
|
|
chr2_-_213150236
Show fit
|
0.99 |
ENST00000442445.1
ENST00000342002.6
|
IKZF2
|
IKAROS family zinc finger 2
|
|
chr18_-_31162849
Show fit
|
0.97 |
ENST00000257197.7
ENST00000257198.6
|
DSC1
|
desmocollin 1
|
|
chr19_-_38812936
Show fit
|
0.97 |
ENST00000307751.9
ENST00000594209.1
|
LGALS4
|
galectin 4
|
|
chr3_+_137998735
Show fit
|
0.94 |
ENST00000343735.8
|
CLDN18
|
claudin 18
|
|
chr5_-_33984636
Show fit
|
0.92 |
ENST00000382102.7
ENST00000509381.1
|
SLC45A2
|
solute carrier family 45 member 2
|
|
chr5_-_33984681
Show fit
|
0.91 |
ENST00000296589.9
|
SLC45A2
|
solute carrier family 45 member 2
|
|
chr14_-_22815801
Show fit
|
0.90 |
ENST00000397532.9
|
SLC7A7
|
solute carrier family 7 member 7
|
|
chr1_+_12464912
Show fit
|
0.87 |
ENST00000543766.2
|
VPS13D
|
vacuolar protein sorting 13 homolog D
|
|
chr1_-_24143112
Show fit
|
0.85 |
ENST00000270800.2
|
IL22RA1
|
interleukin 22 receptor subunit alpha 1
|
|
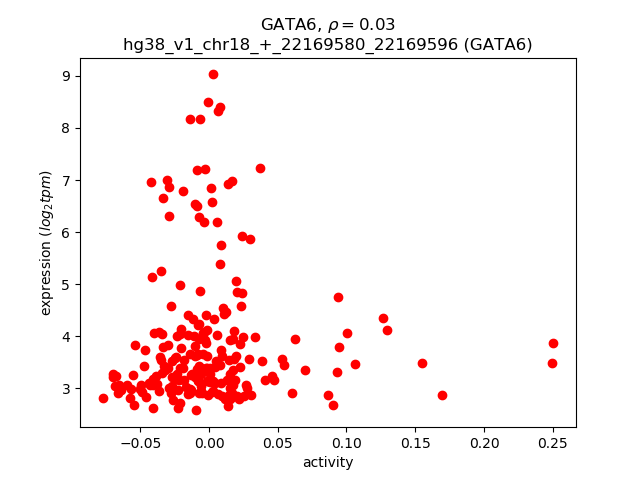
chr18_+_22169580
Show fit
|
0.84 |
ENST00000269216.10
|
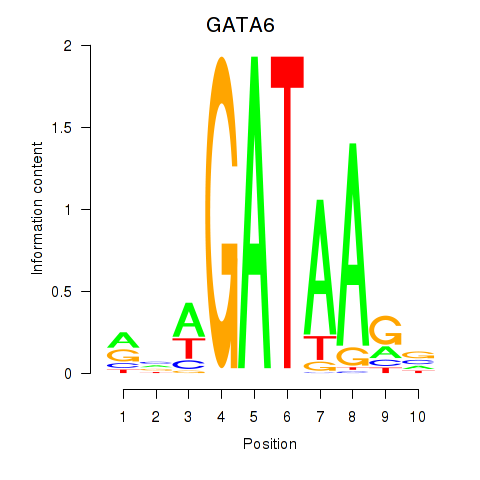
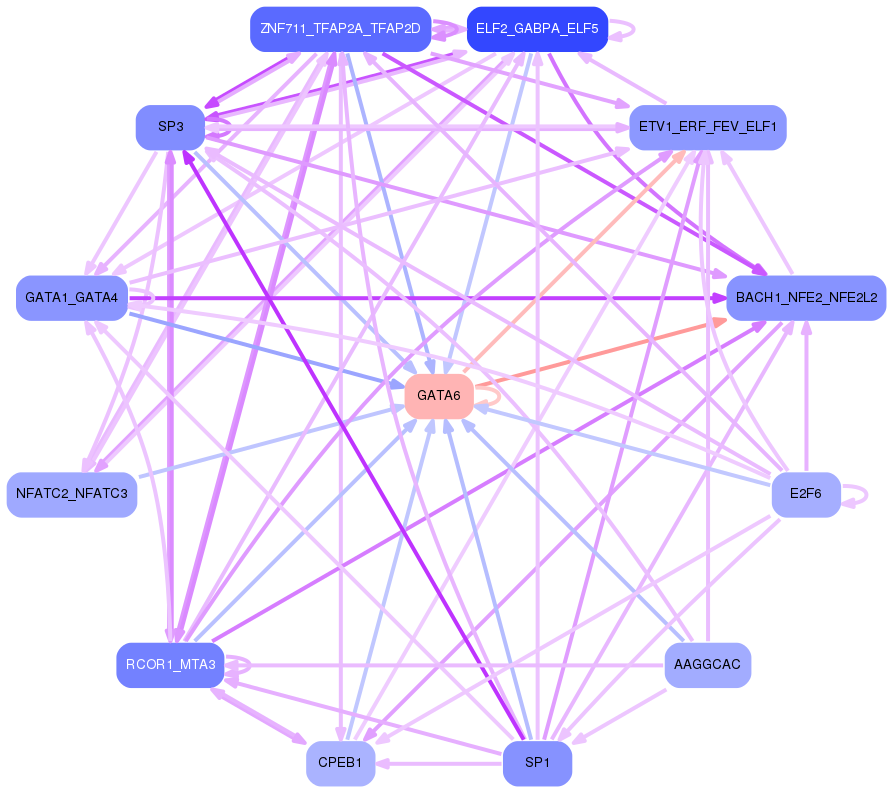
GATA6
|
GATA binding protein 6
|
|
chr14_-_22815856
Show fit
|
0.83 |
ENST00000554758.1
ENST00000397528.8
|
SLC7A7
|
solute carrier family 7 member 7
|
|
chr18_+_45724172
Show fit
|
0.76 |
ENST00000321925.9
ENST00000415427.7
ENST00000589322.7
ENST00000586951.6
ENST00000535474.5
ENST00000402943.6
|
SLC14A1
|
solute carrier family 14 member 1 (Kidd blood group)
|
|
chr5_-_135954962
Show fit
|
0.76 |
ENST00000522943.5
ENST00000514447.2
ENST00000274507.6
|
LECT2
|
leukocyte cell derived chemotaxin 2
|
|
chr19_+_14028148
Show fit
|
0.75 |
ENST00000431365.3
ENST00000585987.1
|
RLN3
|
relaxin 3
|
|
chr5_+_132556911
Show fit
|
0.73 |
ENST00000651541.1
ENST00000378823.8
ENST00000652485.1
|
RAD50
|
RAD50 double strand break repair protein
|
|
chr2_+_108621260
Show fit
|
0.73 |
ENST00000409441.5
|
LIMS1
|
LIM zinc finger domain containing 1
|
|
chr17_+_4932248
Show fit
|
0.70 |
ENST00000329125.6
|
GP1BA
|
glycoprotein Ib platelet subunit alpha
|
|
chr18_+_45724127
Show fit
|
0.68 |
ENST00000619403.4
ENST00000587601.5
|
SLC14A1
|
solute carrier family 14 member 1 (Kidd blood group)
|
|
chr1_-_167518583
Show fit
|
0.67 |
ENST00000392122.3
|
CD247
|
CD247 molecule
|
|
chr15_+_49423233
Show fit
|
0.67 |
ENST00000560270.1
ENST00000267843.9
ENST00000560979.1
|
FGF7
|
fibroblast growth factor 7
|
|
chr3_-_119660580
Show fit
|
0.63 |
ENST00000493094.6
ENST00000264231.7
ENST00000468801.1
|
POPDC2
|
popeye domain containing 2
|
|
chr8_-_71361860
Show fit
|
0.63 |
ENST00000303824.11
ENST00000645451.1
|
EYA1
|
EYA transcriptional coactivator and phosphatase 1
|
|
chr18_-_48137295
Show fit
|
0.61 |
ENST00000535628.6
|
ZBTB7C
|
zinc finger and BTB domain containing 7C
|
|
chr11_-_66438788
Show fit
|
0.58 |
ENST00000329819.4
ENST00000310999.11
ENST00000430466.6
|
MRPL11
|
mitochondrial ribosomal protein L11
|
|
chr8_-_38150943
Show fit
|
0.53 |
ENST00000276449.9
|
STAR
|
steroidogenic acute regulatory protein
|
|
chr2_+_168901290
Show fit
|
0.52 |
ENST00000429379.2
ENST00000375363.8
ENST00000421979.1
|
G6PC2
|
glucose-6-phosphatase catalytic subunit 2
|
|
chr19_-_51019699
Show fit
|
0.51 |
ENST00000358789.8
|
KLK10
|
kallikrein related peptidase 10
|
|
chr19_-_55038256
Show fit
|
0.49 |
ENST00000417454.5
ENST00000310373.7
ENST00000333884.2
|
GP6
|
glycoprotein VI platelet
|
|
chr4_+_165873231
Show fit
|
0.46 |
ENST00000061240.7
|
TLL1
|
tolloid like 1
|
|
chr21_-_38498415
Show fit
|
0.44 |
ENST00000398905.5
ENST00000398907.5
ENST00000453032.6
ENST00000288319.12
|
ERG
|
ETS transcription factor ERG
|
|
chr10_-_125816596
Show fit
|
0.43 |
ENST00000368786.5
|
UROS
|
uroporphyrinogen III synthase
|
|
chr17_+_4932285
Show fit
|
0.43 |
ENST00000611961.1
|
GP1BA
|
glycoprotein Ib platelet subunit alpha
|
|
chr10_+_69315760
Show fit
|
0.41 |
ENST00000298649.8
|
HK1
|
hexokinase 1
|
|
chr2_+_219572304
Show fit
|
0.40 |
ENST00000243786.3
|
INHA
|
inhibin subunit alpha
|
|
chr2_-_40512423
Show fit
|
0.38 |
ENST00000402441.5
ENST00000448531.1
|
SLC8A1
|
solute carrier family 8 member A1
|
|
chr2_-_40512361
Show fit
|
0.32 |
ENST00000403092.5
|
SLC8A1
|
solute carrier family 8 member A1
|
|
chr12_-_21775581
Show fit
|
0.29 |
ENST00000537950.1
ENST00000665145.1
|
KCNJ8
|
potassium inwardly rectifying channel subfamily J member 8
|
|
chr14_+_21477177
Show fit
|
0.25 |
ENST00000448790.7
ENST00000673643.1
ENST00000457430.2
ENST00000673911.1
|
TOX4
|
TOX high mobility group box family member 4
|
|
chr8_+_69466617
Show fit
|
0.24 |
ENST00000525061.5
ENST00000260128.8
ENST00000458141.6
|
SULF1
|
sulfatase 1
|
|
chr6_+_117675448
Show fit
|
0.16 |
ENST00000368494.4
|
NUS1
|
NUS1 dehydrodolichyl diphosphate synthase subunit
|
|
chr19_+_35358821
Show fit
|
0.14 |
ENST00000594310.1
|
FFAR3
|
free fatty acid receptor 3
|
|
chr18_+_3447562
Show fit
|
0.11 |
ENST00000618001.4
|
TGIF1
|
TGFB induced factor homeobox 1
|
|
chr9_-_114930508
Show fit
|
0.09 |
ENST00000223795.3
ENST00000618336.4
|
TNFSF8
|
TNF superfamily member 8
|
|
chr1_-_167518521
Show fit
|
0.09 |
ENST00000362089.10
|
CD247
|
CD247 molecule
|
|
chr12_-_9999176
Show fit
|
0.04 |
ENST00000298527.10
ENST00000348658.4
|
CLEC1B
|
C-type lectin domain family 1 member B
|
