Project
GNF SymAtlas + NCI-60 cancer cell lines, human (Su, 2004; Ross, 2000)
Navigation
Downloads
Results for GGCUCAG
Z-value: 0.98
Motif logo

miRNA associated with seed GGCUCAG
| Name | miRBASE accession |
|---|---|
|
hsa-miR-24-3p
|
MIMAT0000080 |
Activity profile of GGCUCAG motif
Sorted Z-values of GGCUCAG motif
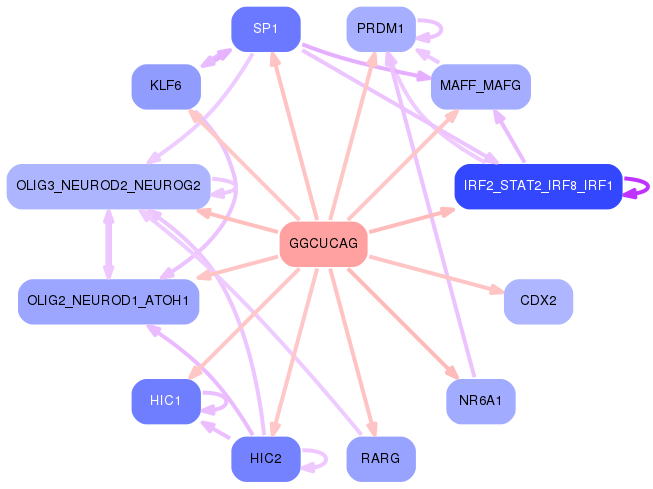
Network of associatons between targets according to the STRING database.

First level regulatory network of GGCUCAG
Gene Ontology Analysis
Gene overrepresentation in biological process category:
| Log-likelihood per target | Total log-likelihood | Term | Description |
|---|---|---|---|
| 4.8 | 14.4 | GO:0072277 | metanephric glomerulus morphogenesis(GO:0072275) metanephric glomerulus vasculature morphogenesis(GO:0072276) metanephric glomerular capillary formation(GO:0072277) |
| 4.4 | 17.5 | GO:0033693 | neurofilament bundle assembly(GO:0033693) |
| 3.8 | 11.5 | GO:0009386 | translational attenuation(GO:0009386) |
| 3.0 | 8.9 | GO:1904204 | regulation of skeletal muscle hypertrophy(GO:1904204) |
| 3.0 | 8.9 | GO:1903288 | positive regulation of potassium ion import(GO:1903288) |
| 2.7 | 10.7 | GO:1903070 | negative regulation of ER-associated ubiquitin-dependent protein catabolic process(GO:1903070) |
| 2.5 | 7.5 | GO:1990168 | protein K33-linked deubiquitination(GO:1990168) |
| 2.5 | 7.5 | GO:0002416 | IgG immunoglobulin transcytosis in epithelial cells mediated by FcRn immunoglobulin receptor(GO:0002416) |
| 2.1 | 6.3 | GO:0098528 | skeletal muscle fiber differentiation(GO:0098528) regulation of skeletal muscle fiber differentiation(GO:1902809) |
| 2.0 | 10.1 | GO:0042796 | snRNA transcription from RNA polymerase III promoter(GO:0042796) |
| 2.0 | 5.9 | GO:0042939 | glutathione transport(GO:0034635) tripeptide transport(GO:0042939) |
| 1.9 | 9.7 | GO:0097167 | circadian regulation of translation(GO:0097167) |
| 1.9 | 5.6 | GO:0099526 | presynaptic signal transduction(GO:0098928) presynapse to nucleus signaling pathway(GO:0099526) |
| 1.8 | 7.4 | GO:0030821 | negative regulation of cyclic nucleotide catabolic process(GO:0030806) negative regulation of cAMP catabolic process(GO:0030821) |
| 1.4 | 4.1 | GO:0072675 | multinuclear osteoclast differentiation(GO:0072674) osteoclast fusion(GO:0072675) |
| 1.3 | 1.3 | GO:2000777 | positive regulation of proteasomal ubiquitin-dependent protein catabolic process involved in cellular response to hypoxia(GO:2000777) |
| 1.2 | 3.5 | GO:1902630 | regulation of membrane hyperpolarization(GO:1902630) |
| 1.2 | 4.7 | GO:0050916 | sensory perception of sweet taste(GO:0050916) |
| 1.1 | 4.5 | GO:2000564 | CD8-positive, alpha-beta T cell proliferation(GO:0035740) regulation of CD8-positive, alpha-beta T cell proliferation(GO:2000564) |
| 1.1 | 3.2 | GO:0003245 | cardiac muscle tissue growth involved in heart morphogenesis(GO:0003245) |
| 1.1 | 3.2 | GO:0031587 | positive regulation of inositol 1,4,5-trisphosphate-sensitive calcium-release channel activity(GO:0031587) |
| 1.1 | 4.2 | GO:0007538 | primary sex determination(GO:0007538) |
| 1.0 | 3.1 | GO:1902263 | apoptotic process involved in embryonic digit morphogenesis(GO:1902263) |
| 1.0 | 3.9 | GO:2000297 | negative regulation of synapse maturation(GO:2000297) |
| 1.0 | 5.7 | GO:0048807 | female genitalia morphogenesis(GO:0048807) |
| 0.9 | 2.6 | GO:1900239 | phenotypic switching(GO:0036166) regulation of phenotypic switching(GO:1900239) |
| 0.8 | 3.3 | GO:0090076 | relaxation of skeletal muscle(GO:0090076) |
| 0.8 | 5.8 | GO:0070127 | tRNA aminoacylation for mitochondrial protein translation(GO:0070127) |
| 0.8 | 3.3 | GO:0003273 | cell migration involved in endocardial cushion formation(GO:0003273) condensed mesenchymal cell proliferation(GO:0072137) |
| 0.8 | 8.7 | GO:1904262 | negative regulation of TORC1 signaling(GO:1904262) |
| 0.7 | 2.1 | GO:1901491 | negative regulation of lymphangiogenesis(GO:1901491) |
| 0.7 | 2.8 | GO:0032904 | viral protein processing(GO:0019082) regulation of nerve growth factor production(GO:0032903) negative regulation of nerve growth factor production(GO:0032904) dibasic protein processing(GO:0090472) |
| 0.7 | 2.8 | GO:0070384 | growth plate cartilage chondrocyte growth(GO:0003430) growth plate cartilage chondrocyte development(GO:0003431) Harderian gland development(GO:0070384) |
| 0.7 | 2.1 | GO:1901859 | negative regulation of mitochondrial DNA replication(GO:0090298) negative regulation of mitochondrial DNA metabolic process(GO:1901859) |
| 0.7 | 2.0 | GO:2000118 | regulation of sodium-dependent phosphate transport(GO:2000118) |
| 0.7 | 2.7 | GO:0061073 | ciliary body morphogenesis(GO:0061073) |
| 0.7 | 2.0 | GO:2000661 | positive regulation of interleukin-1-mediated signaling pathway(GO:2000661) |
| 0.7 | 3.9 | GO:0033314 | mitotic DNA replication checkpoint(GO:0033314) |
| 0.6 | 4.4 | GO:0035871 | protein K11-linked deubiquitination(GO:0035871) |
| 0.6 | 3.1 | GO:1900425 | negative regulation of defense response to bacterium(GO:1900425) |
| 0.6 | 2.5 | GO:1901165 | positive regulation of trophoblast cell migration(GO:1901165) |
| 0.6 | 1.8 | GO:1990654 | regulation of extrathymic T cell differentiation(GO:0033082) sebum secreting cell proliferation(GO:1990654) |
| 0.6 | 1.8 | GO:0042823 | pyridoxine metabolic process(GO:0008614) pyridoxine biosynthetic process(GO:0008615) vitamin B6 biosynthetic process(GO:0042819) pyridoxal phosphate metabolic process(GO:0042822) pyridoxal phosphate biosynthetic process(GO:0042823) |
| 0.6 | 8.1 | GO:0060973 | cell migration involved in heart development(GO:0060973) |
| 0.6 | 2.9 | GO:0016240 | autophagosome docking(GO:0016240) |
| 0.6 | 3.9 | GO:0071477 | hypotonic salinity response(GO:0042539) cellular hypotonic salinity response(GO:0071477) |
| 0.6 | 4.5 | GO:0035694 | mitochondrial protein catabolic process(GO:0035694) |
| 0.5 | 4.4 | GO:0007185 | transmembrane receptor protein tyrosine phosphatase signaling pathway(GO:0007185) |
| 0.5 | 7.0 | GO:1902018 | negative regulation of cilium assembly(GO:1902018) |
| 0.5 | 2.1 | GO:0060729 | intestinal epithelial structure maintenance(GO:0060729) |
| 0.5 | 2.6 | GO:0050861 | positive regulation of B cell receptor signaling pathway(GO:0050861) |
| 0.5 | 2.5 | GO:0014807 | regulation of somitogenesis(GO:0014807) |
| 0.5 | 2.0 | GO:0097490 | sympathetic neuron projection extension(GO:0097490) sympathetic neuron projection guidance(GO:0097491) |
| 0.5 | 4.4 | GO:0038145 | macrophage colony-stimulating factor signaling pathway(GO:0038145) cell-cell junction maintenance(GO:0045217) |
| 0.5 | 3.2 | GO:0090166 | Golgi disassembly(GO:0090166) |
| 0.5 | 11.9 | GO:0097150 | neuronal stem cell population maintenance(GO:0097150) |
| 0.4 | 4.9 | GO:0006030 | chitin metabolic process(GO:0006030) chitin catabolic process(GO:0006032) |
| 0.4 | 1.7 | GO:0060718 | Spemann organizer formation(GO:0060061) chorionic trophoblast cell differentiation(GO:0060718) |
| 0.4 | 1.7 | GO:0051697 | protein delipidation(GO:0051697) |
| 0.4 | 5.8 | GO:0070050 | neuron cellular homeostasis(GO:0070050) |
| 0.4 | 6.6 | GO:0014051 | gamma-aminobutyric acid secretion(GO:0014051) |
| 0.4 | 7.1 | GO:0010510 | regulation of acetyl-CoA biosynthetic process from pyruvate(GO:0010510) |
| 0.4 | 4.2 | GO:0070561 | vitamin D receptor signaling pathway(GO:0070561) |
| 0.4 | 2.7 | GO:0035234 | ectopic germ cell programmed cell death(GO:0035234) positive regulation of monocyte chemotactic protein-1 production(GO:0071639) |
| 0.4 | 1.9 | GO:0010701 | positive regulation of norepinephrine secretion(GO:0010701) |
| 0.4 | 5.6 | GO:0060662 | tube lumen cavitation(GO:0060605) salivary gland cavitation(GO:0060662) |
| 0.4 | 1.5 | GO:0060414 | aorta smooth muscle tissue morphogenesis(GO:0060414) |
| 0.4 | 14.7 | GO:0060384 | innervation(GO:0060384) |
| 0.4 | 7.3 | GO:0051823 | regulation of synapse structural plasticity(GO:0051823) |
| 0.4 | 3.3 | GO:0046549 | retinal cone cell differentiation(GO:0042670) retinal cone cell development(GO:0046549) |
| 0.4 | 8.7 | GO:0030488 | tRNA methylation(GO:0030488) |
| 0.4 | 0.4 | GO:0048843 | negative regulation of axon extension involved in axon guidance(GO:0048843) |
| 0.3 | 1.4 | GO:0072658 | maintenance of protein location in membrane(GO:0072658) maintenance of protein location in plasma membrane(GO:0072660) positive regulation of membrane depolarization during cardiac muscle cell action potential(GO:1900827) |
| 0.3 | 1.0 | GO:0061428 | negative regulation of transcription from RNA polymerase II promoter in response to hypoxia(GO:0061428) |
| 0.3 | 0.6 | GO:1904339 | negative regulation of dopaminergic neuron differentiation(GO:1904339) |
| 0.3 | 2.4 | GO:0060075 | regulation of resting membrane potential(GO:0060075) |
| 0.3 | 10.0 | GO:0071425 | hematopoietic stem cell proliferation(GO:0071425) |
| 0.3 | 1.8 | GO:0070829 | response to vitamin B2(GO:0033274) heterochromatin maintenance(GO:0070829) |
| 0.3 | 9.1 | GO:0045956 | positive regulation of calcium ion-dependent exocytosis(GO:0045956) |
| 0.3 | 6.2 | GO:0045717 | negative regulation of fatty acid biosynthetic process(GO:0045717) |
| 0.3 | 1.4 | GO:0035672 | oligopeptide transmembrane transport(GO:0035672) |
| 0.3 | 1.4 | GO:0071543 | diadenosine polyphosphate catabolic process(GO:0015961) diphosphoinositol polyphosphate metabolic process(GO:0071543) diadenosine pentaphosphate metabolic process(GO:1901906) diadenosine pentaphosphate catabolic process(GO:1901907) diadenosine hexaphosphate metabolic process(GO:1901908) diadenosine hexaphosphate catabolic process(GO:1901909) adenosine 5'-(hexahydrogen pentaphosphate) metabolic process(GO:1901910) adenosine 5'-(hexahydrogen pentaphosphate) catabolic process(GO:1901911) |
| 0.3 | 7.1 | GO:0071526 | semaphorin-plexin signaling pathway(GO:0071526) |
| 0.3 | 4.6 | GO:0048263 | determination of dorsal identity(GO:0048263) |
| 0.3 | 1.5 | GO:0032483 | regulation of Rab protein signal transduction(GO:0032483) |
| 0.2 | 3.2 | GO:1990440 | positive regulation of transcription from RNA polymerase II promoter in response to endoplasmic reticulum stress(GO:1990440) |
| 0.2 | 1.7 | GO:0060907 | positive regulation of macrophage cytokine production(GO:0060907) |
| 0.2 | 3.1 | GO:0010668 | ectodermal cell differentiation(GO:0010668) |
| 0.2 | 6.1 | GO:0044126 | regulation of growth of symbiont in host(GO:0044126) |
| 0.2 | 3.7 | GO:0045475 | locomotor rhythm(GO:0045475) |
| 0.2 | 2.6 | GO:0001514 | selenocysteine incorporation(GO:0001514) translational readthrough(GO:0006451) |
| 0.2 | 1.1 | GO:0038169 | somatostatin receptor signaling pathway(GO:0038169) somatostatin signaling pathway(GO:0038170) |
| 0.2 | 0.6 | GO:2000417 | negative regulation of eosinophil migration(GO:2000417) |
| 0.2 | 3.7 | GO:0071786 | endoplasmic reticulum tubular network organization(GO:0071786) |
| 0.2 | 0.6 | GO:0043553 | negative regulation of phosphatidylinositol 3-kinase activity(GO:0043553) negative regulation of autophagosome maturation(GO:1901097) |
| 0.2 | 11.0 | GO:0000413 | protein peptidyl-prolyl isomerization(GO:0000413) |
| 0.2 | 3.9 | GO:0018345 | protein palmitoylation(GO:0018345) |
| 0.2 | 2.5 | GO:0015986 | energy coupled proton transport, down electrochemical gradient(GO:0015985) ATP synthesis coupled proton transport(GO:0015986) |
| 0.2 | 1.3 | GO:0038110 | interleukin-2-mediated signaling pathway(GO:0038110) |
| 0.2 | 0.9 | GO:0018352 | protein-pyridoxal-5-phosphate linkage(GO:0018352) |
| 0.2 | 3.1 | GO:0070389 | chaperone cofactor-dependent protein refolding(GO:0070389) |
| 0.2 | 2.4 | GO:0032836 | glomerular basement membrane development(GO:0032836) |
| 0.2 | 0.9 | GO:0038092 | nodal signaling pathway(GO:0038092) |
| 0.2 | 5.6 | GO:0060065 | uterus development(GO:0060065) |
| 0.2 | 3.2 | GO:0035988 | chondrocyte proliferation(GO:0035988) |
| 0.2 | 2.1 | GO:0048251 | elastic fiber assembly(GO:0048251) |
| 0.2 | 2.4 | GO:2001224 | positive regulation of neuron migration(GO:2001224) |
| 0.2 | 0.6 | GO:0002408 | myeloid dendritic cell chemotaxis(GO:0002408) |
| 0.1 | 1.8 | GO:0043517 | positive regulation of DNA damage response, signal transduction by p53 class mediator(GO:0043517) |
| 0.1 | 2.5 | GO:0048535 | lymph node development(GO:0048535) |
| 0.1 | 7.2 | GO:0032728 | positive regulation of interferon-beta production(GO:0032728) |
| 0.1 | 1.8 | GO:0035372 | protein localization to microtubule(GO:0035372) |
| 0.1 | 0.5 | GO:0048388 | endosomal lumen acidification(GO:0048388) |
| 0.1 | 6.3 | GO:0097178 | ruffle assembly(GO:0097178) |
| 0.1 | 0.5 | GO:0018125 | peptidyl-cysteine methylation(GO:0018125) |
| 0.1 | 0.7 | GO:0032926 | negative regulation of activin receptor signaling pathway(GO:0032926) |
| 0.1 | 1.9 | GO:1902043 | positive regulation of extrinsic apoptotic signaling pathway via death domain receptors(GO:1902043) |
| 0.1 | 5.3 | GO:0000188 | inactivation of MAPK activity(GO:0000188) |
| 0.1 | 0.7 | GO:0031022 | nuclear migration along microfilament(GO:0031022) |
| 0.1 | 1.1 | GO:2000807 | regulation of synaptic vesicle clustering(GO:2000807) |
| 0.1 | 1.0 | GO:0045198 | establishment of epithelial cell apical/basal polarity(GO:0045198) |
| 0.1 | 1.0 | GO:0035970 | peptidyl-threonine dephosphorylation(GO:0035970) |
| 0.1 | 5.9 | GO:0050435 | beta-amyloid metabolic process(GO:0050435) |
| 0.1 | 3.4 | GO:2000369 | regulation of clathrin-mediated endocytosis(GO:2000369) |
| 0.1 | 3.7 | GO:0030214 | hyaluronan catabolic process(GO:0030214) |
| 0.1 | 2.7 | GO:0000042 | protein targeting to Golgi(GO:0000042) |
| 0.1 | 3.6 | GO:0007214 | gamma-aminobutyric acid signaling pathway(GO:0007214) |
| 0.1 | 0.8 | GO:0046015 | regulation of transcription by glucose(GO:0046015) |
| 0.1 | 1.3 | GO:0051967 | negative regulation of synaptic transmission, glutamatergic(GO:0051967) |
| 0.1 | 2.0 | GO:0090200 | positive regulation of release of cytochrome c from mitochondria(GO:0090200) |
| 0.1 | 0.7 | GO:0035093 | spermatogenesis, exchange of chromosomal proteins(GO:0035093) |
| 0.1 | 1.1 | GO:0010739 | positive regulation of protein kinase A signaling(GO:0010739) |
| 0.1 | 2.5 | GO:0060732 | positive regulation of inositol phosphate biosynthetic process(GO:0060732) |
| 0.1 | 7.4 | GO:1902108 | regulation of mitochondrial membrane permeability involved in apoptotic process(GO:1902108) |
| 0.1 | 0.8 | GO:0043374 | CD8-positive, alpha-beta T cell differentiation(GO:0043374) |
| 0.1 | 8.7 | GO:0007368 | determination of left/right symmetry(GO:0007368) |
| 0.1 | 0.5 | GO:0001880 | Mullerian duct regression(GO:0001880) |
| 0.1 | 1.5 | GO:0048820 | hair follicle maturation(GO:0048820) |
| 0.1 | 1.1 | GO:0016024 | CDP-diacylglycerol biosynthetic process(GO:0016024) |
| 0.1 | 0.8 | GO:0001731 | formation of translation preinitiation complex(GO:0001731) |
| 0.1 | 0.3 | GO:0044336 | canonical Wnt signaling pathway involved in negative regulation of apoptotic process(GO:0044336) |
| 0.1 | 1.9 | GO:0032012 | regulation of ARF protein signal transduction(GO:0032012) |
| 0.1 | 2.0 | GO:0045943 | positive regulation of transcription from RNA polymerase I promoter(GO:0045943) |
| 0.1 | 0.9 | GO:0060766 | negative regulation of androgen receptor signaling pathway(GO:0060766) |
| 0.1 | 2.1 | GO:2001275 | positive regulation of glucose import in response to insulin stimulus(GO:2001275) |
| 0.1 | 0.4 | GO:0045176 | apical protein localization(GO:0045176) |
| 0.1 | 1.5 | GO:0050901 | leukocyte tethering or rolling(GO:0050901) |
| 0.1 | 1.2 | GO:0045109 | intermediate filament organization(GO:0045109) |
| 0.1 | 2.1 | GO:0001578 | microtubule bundle formation(GO:0001578) |
| 0.1 | 2.9 | GO:0006890 | retrograde vesicle-mediated transport, Golgi to ER(GO:0006890) |
| 0.0 | 0.9 | GO:0071880 | adenylate cyclase-activating adrenergic receptor signaling pathway(GO:0071880) |
| 0.0 | 1.3 | GO:0042501 | serine phosphorylation of STAT protein(GO:0042501) |
| 0.0 | 0.2 | GO:0030311 | poly-N-acetyllactosamine metabolic process(GO:0030309) poly-N-acetyllactosamine biosynthetic process(GO:0030311) |
| 0.0 | 1.8 | GO:0051123 | RNA polymerase II transcriptional preinitiation complex assembly(GO:0051123) |
| 0.0 | 5.9 | GO:0044782 | cilium organization(GO:0044782) |
| 0.0 | 3.7 | GO:0072332 | intrinsic apoptotic signaling pathway by p53 class mediator(GO:0072332) |
| 0.0 | 5.0 | GO:0060996 | dendritic spine development(GO:0060996) |
| 0.0 | 1.1 | GO:0042994 | cytoplasmic sequestering of transcription factor(GO:0042994) |
| 0.0 | 2.1 | GO:0007520 | myoblast fusion(GO:0007520) |
| 0.0 | 1.5 | GO:0006376 | mRNA splice site selection(GO:0006376) |
| 0.0 | 1.3 | GO:0000083 | regulation of transcription involved in G1/S transition of mitotic cell cycle(GO:0000083) |
| 0.0 | 2.5 | GO:0010633 | negative regulation of epithelial cell migration(GO:0010633) |
| 0.0 | 1.7 | GO:0045604 | regulation of epidermal cell differentiation(GO:0045604) |
| 0.0 | 1.0 | GO:0060612 | adipose tissue development(GO:0060612) |
| 0.0 | 0.4 | GO:0090110 | cargo loading into vesicle(GO:0035459) cargo loading into COPII-coated vesicle(GO:0090110) |
| 0.0 | 0.3 | GO:0003360 | brainstem development(GO:0003360) |
| 0.0 | 2.0 | GO:0010923 | negative regulation of phosphatase activity(GO:0010923) |
| 0.0 | 2.2 | GO:0008625 | extrinsic apoptotic signaling pathway via death domain receptors(GO:0008625) |
| 0.0 | 0.6 | GO:0009303 | rRNA transcription(GO:0009303) |
| 0.0 | 1.0 | GO:0010765 | positive regulation of sodium ion transport(GO:0010765) |
| 0.0 | 0.7 | GO:0002931 | response to ischemia(GO:0002931) |
| 0.0 | 0.9 | GO:0045022 | early endosome to late endosome transport(GO:0045022) |
| 0.0 | 1.8 | GO:0043966 | histone H3 acetylation(GO:0043966) |
| 0.0 | 4.1 | GO:0003014 | renal system process(GO:0003014) |
| 0.0 | 0.0 | GO:0002159 | desmosome assembly(GO:0002159) |
| 0.0 | 2.6 | GO:0021987 | cerebral cortex development(GO:0021987) |
| 0.0 | 0.5 | GO:0014002 | astrocyte development(GO:0014002) |
| 0.0 | 2.9 | GO:0030518 | intracellular steroid hormone receptor signaling pathway(GO:0030518) |
| 0.0 | 0.8 | GO:1904893 | negative regulation of JAK-STAT cascade(GO:0046426) negative regulation of STAT cascade(GO:1904893) |
| 0.0 | 0.5 | GO:0030206 | chondroitin sulfate biosynthetic process(GO:0030206) |
| 0.0 | 0.3 | GO:0070193 | synaptonemal complex assembly(GO:0007130) synaptonemal complex organization(GO:0070193) |
| 0.0 | 1.7 | GO:0070268 | cornification(GO:0070268) |
| 0.0 | 2.5 | GO:0007018 | microtubule-based movement(GO:0007018) |
| 0.0 | 1.0 | GO:0036297 | interstrand cross-link repair(GO:0036297) |
| 0.0 | 0.6 | GO:0000027 | ribosomal large subunit assembly(GO:0000027) |
| 0.0 | 0.6 | GO:0061014 | positive regulation of mRNA catabolic process(GO:0061014) |
| 0.0 | 1.3 | GO:0030183 | B cell differentiation(GO:0030183) |
| 0.0 | 2.1 | GO:0051262 | protein tetramerization(GO:0051262) |
| 0.0 | 0.7 | GO:0015701 | bicarbonate transport(GO:0015701) |
| 0.0 | 0.3 | GO:2000401 | regulation of lymphocyte migration(GO:2000401) |
| 0.0 | 1.5 | GO:0051438 | regulation of ubiquitin-protein transferase activity(GO:0051438) |
| 0.0 | 1.0 | GO:0009311 | oligosaccharide metabolic process(GO:0009311) |
| 0.0 | 0.5 | GO:0030866 | cortical actin cytoskeleton organization(GO:0030866) |
Gene overrepresentation in cellular component category:
| Log-likelihood per target | Total log-likelihood | Term | Description |
|---|---|---|---|
| 2.5 | 10.1 | GO:0035363 | histone locus body(GO:0035363) |
| 2.0 | 5.9 | GO:0032426 | stereocilium tip(GO:0032426) |
| 2.0 | 5.9 | GO:0070931 | Golgi-associated vesicle lumen(GO:0070931) |
| 1.9 | 5.6 | GO:0048788 | cytoskeleton of presynaptic active zone(GO:0048788) presynaptic active zone cytoplasmic component(GO:0098831) presynaptic cytoskeleton(GO:0099569) |
| 1.7 | 13.6 | GO:0030868 | smooth endoplasmic reticulum membrane(GO:0030868) smooth endoplasmic reticulum part(GO:0097425) |
| 1.2 | 17.5 | GO:0097418 | neurofibrillary tangle(GO:0097418) |
| 1.2 | 4.6 | GO:0038039 | G-protein coupled receptor heterodimeric complex(GO:0038039) |
| 1.1 | 8.7 | GO:0061700 | GATOR2 complex(GO:0061700) |
| 1.0 | 12.1 | GO:0043240 | Fanconi anaemia nuclear complex(GO:0043240) |
| 0.9 | 8.9 | GO:0042567 | insulin-like growth factor ternary complex(GO:0042567) |
| 0.7 | 4.4 | GO:1990682 | CSF1-CSF1R complex(GO:1990682) |
| 0.6 | 2.5 | GO:0048179 | activin receptor complex(GO:0048179) |
| 0.5 | 8.9 | GO:0005890 | sodium:potassium-exchanging ATPase complex(GO:0005890) |
| 0.5 | 5.1 | GO:0032593 | insulin-responsive compartment(GO:0032593) |
| 0.4 | 14.2 | GO:0080008 | Cul4-RING E3 ubiquitin ligase complex(GO:0080008) |
| 0.3 | 2.9 | GO:0033018 | sarcoplasmic reticulum lumen(GO:0033018) |
| 0.3 | 2.6 | GO:0031462 | Cul2-RING ubiquitin ligase complex(GO:0031462) |
| 0.3 | 2.5 | GO:0000220 | vacuolar proton-transporting V-type ATPase, V0 domain(GO:0000220) |
| 0.2 | 2.9 | GO:0017119 | Golgi transport complex(GO:0017119) |
| 0.2 | 4.8 | GO:0005666 | DNA-directed RNA polymerase III complex(GO:0005666) |
| 0.2 | 0.7 | GO:0036449 | microtubule minus-end(GO:0036449) |
| 0.2 | 1.8 | GO:0070775 | H3 histone acetyltransferase complex(GO:0070775) MOZ/MORF histone acetyltransferase complex(GO:0070776) |
| 0.2 | 1.3 | GO:0097504 | Gemini of coiled bodies(GO:0097504) |
| 0.2 | 3.1 | GO:0097431 | mitotic spindle pole(GO:0097431) |
| 0.1 | 7.8 | GO:0002102 | podosome(GO:0002102) |
| 0.1 | 9.4 | GO:0031201 | SNARE complex(GO:0031201) |
| 0.1 | 3.7 | GO:0071782 | endoplasmic reticulum tubular network(GO:0071782) |
| 0.1 | 7.3 | GO:0033017 | sarcoplasmic reticulum membrane(GO:0033017) |
| 0.1 | 0.8 | GO:0033553 | rDNA heterochromatin(GO:0033553) |
| 0.1 | 1.5 | GO:0008290 | F-actin capping protein complex(GO:0008290) |
| 0.1 | 3.1 | GO:0005868 | cytoplasmic dynein complex(GO:0005868) |
| 0.1 | 3.3 | GO:0005790 | smooth endoplasmic reticulum(GO:0005790) |
| 0.1 | 0.5 | GO:0044352 | pinosome(GO:0044352) macropinosome(GO:0044354) |
| 0.1 | 2.9 | GO:0030057 | desmosome(GO:0030057) |
| 0.1 | 2.7 | GO:0030137 | COPI-coated vesicle(GO:0030137) |
| 0.1 | 9.1 | GO:0036064 | ciliary basal body(GO:0036064) |
| 0.1 | 0.9 | GO:0061200 | clathrin-sculpted gamma-aminobutyric acid transport vesicle(GO:0061200) clathrin-sculpted gamma-aminobutyric acid transport vesicle membrane(GO:0061202) |
| 0.1 | 2.8 | GO:0030140 | trans-Golgi network transport vesicle(GO:0030140) |
| 0.1 | 2.1 | GO:0005942 | phosphatidylinositol 3-kinase complex(GO:0005942) |
| 0.1 | 5.2 | GO:0005881 | cytoplasmic microtubule(GO:0005881) |
| 0.1 | 1.5 | GO:0071004 | U2-type prespliceosome(GO:0071004) |
| 0.1 | 0.3 | GO:0097059 | CNTFR-CLCF1 complex(GO:0097059) |
| 0.1 | 10.2 | GO:0043202 | lysosomal lumen(GO:0043202) |
| 0.1 | 3.2 | GO:1904115 | axon cytoplasm(GO:1904115) |
| 0.1 | 6.3 | GO:0005758 | mitochondrial intermembrane space(GO:0005758) |
| 0.1 | 2.2 | GO:0090545 | NuRD complex(GO:0016581) CHD-type complex(GO:0090545) |
| 0.1 | 1.4 | GO:0043194 | axon initial segment(GO:0043194) |
| 0.1 | 0.9 | GO:0008074 | guanylate cyclase complex, soluble(GO:0008074) |
| 0.1 | 1.1 | GO:0005662 | DNA replication factor A complex(GO:0005662) |
| 0.1 | 8.8 | GO:0016605 | PML body(GO:0016605) |
| 0.1 | 3.4 | GO:0031463 | Cul3-RING ubiquitin ligase complex(GO:0031463) |
| 0.1 | 0.7 | GO:0034992 | microtubule organizing center attachment site(GO:0034992) LINC complex(GO:0034993) |
| 0.1 | 4.7 | GO:0043195 | terminal bouton(GO:0043195) |
| 0.1 | 5.0 | GO:0017053 | transcriptional repressor complex(GO:0017053) |
| 0.1 | 4.4 | GO:0101003 | ficolin-1-rich granule membrane(GO:0101003) |
| 0.1 | 2.5 | GO:0005871 | kinesin complex(GO:0005871) |
| 0.1 | 0.6 | GO:1990909 | Wnt signalosome(GO:1990909) |
| 0.0 | 9.2 | GO:0090575 | RNA polymerase II transcription factor complex(GO:0090575) |
| 0.0 | 1.3 | GO:0005801 | cis-Golgi network(GO:0005801) |
| 0.0 | 3.3 | GO:0035580 | specific granule lumen(GO:0035580) |
| 0.0 | 6.4 | GO:0008021 | synaptic vesicle(GO:0008021) |
| 0.0 | 5.7 | GO:0005795 | Golgi stack(GO:0005795) |
| 0.0 | 6.5 | GO:0001650 | fibrillar center(GO:0001650) |
| 0.0 | 1.0 | GO:0046658 | anchored component of plasma membrane(GO:0046658) |
| 0.0 | 3.2 | GO:0005581 | collagen trimer(GO:0005581) |
| 0.0 | 6.4 | GO:0030133 | transport vesicle(GO:0030133) |
| 0.0 | 8.2 | GO:0005741 | mitochondrial outer membrane(GO:0005741) |
| 0.0 | 1.2 | GO:0048786 | presynaptic active zone(GO:0048786) |
| 0.0 | 2.5 | GO:0005791 | rough endoplasmic reticulum(GO:0005791) |
| 0.0 | 4.1 | GO:0034705 | voltage-gated potassium channel complex(GO:0008076) potassium channel complex(GO:0034705) |
| 0.0 | 29.8 | GO:0005789 | endoplasmic reticulum membrane(GO:0005789) |
| 0.0 | 0.6 | GO:0000177 | cytoplasmic exosome (RNase complex)(GO:0000177) |
| 0.0 | 0.5 | GO:0071141 | SMAD protein complex(GO:0071141) |
| 0.0 | 1.9 | GO:0005875 | microtubule associated complex(GO:0005875) |
| 0.0 | 2.0 | GO:0001725 | stress fiber(GO:0001725) contractile actin filament bundle(GO:0097517) |
| 0.0 | 1.4 | GO:0005902 | microvillus(GO:0005902) |
| 0.0 | 5.2 | GO:0005667 | transcription factor complex(GO:0005667) |
| 0.0 | 0.8 | GO:0001772 | immunological synapse(GO:0001772) |
| 0.0 | 0.6 | GO:0030687 | preribosome, large subunit precursor(GO:0030687) |
| 0.0 | 3.8 | GO:0043025 | neuronal cell body(GO:0043025) |
| 0.0 | 1.5 | GO:0005913 | cell-cell adherens junction(GO:0005913) |
| 0.0 | 4.7 | GO:0009897 | external side of plasma membrane(GO:0009897) |
| 0.0 | 0.7 | GO:0031526 | brush border membrane(GO:0031526) |
| 0.0 | 5.3 | GO:0016607 | nuclear speck(GO:0016607) |
| 0.0 | 2.5 | GO:0030027 | lamellipodium(GO:0030027) |
| 0.0 | 3.4 | GO:0000790 | nuclear chromatin(GO:0000790) |
| 0.0 | 0.2 | GO:0030173 | integral component of Golgi membrane(GO:0030173) |
| 0.0 | 38.2 | GO:0016021 | integral component of membrane(GO:0016021) |
Gene overrepresentation in molecular function category:
| Log-likelihood per target | Total log-likelihood | Term | Description |
|---|---|---|---|
| 4.8 | 14.4 | GO:0005017 | platelet-derived growth factor-activated receptor activity(GO:0005017) |
| 2.5 | 7.5 | GO:1904455 | ubiquitin-specific protease activity involved in negative regulation of ERAD pathway(GO:1904455) |
| 1.9 | 7.5 | GO:0019770 | IgG receptor activity(GO:0019770) |
| 1.8 | 7.1 | GO:0004741 | [pyruvate dehydrogenase (lipoamide)] phosphatase activity(GO:0004741) |
| 1.5 | 5.9 | GO:0008798 | beta-aspartyl-peptidase activity(GO:0008798) |
| 1.5 | 4.4 | GO:0005011 | macrophage colony-stimulating factor receptor activity(GO:0005011) |
| 1.4 | 8.7 | GO:0070728 | leucine binding(GO:0070728) |
| 1.2 | 7.3 | GO:0008142 | oxysterol binding(GO:0008142) |
| 1.2 | 3.7 | GO:0031849 | olfactory receptor binding(GO:0031849) |
| 1.2 | 4.6 | GO:0004965 | G-protein coupled GABA receptor activity(GO:0004965) |
| 0.8 | 3.2 | GO:0048403 | brain-derived neurotrophic factor binding(GO:0048403) |
| 0.7 | 8.9 | GO:0031995 | insulin-like growth factor II binding(GO:0031995) |
| 0.7 | 2.1 | GO:0004720 | protein-lysine 6-oxidase activity(GO:0004720) |
| 0.7 | 8.9 | GO:0005391 | sodium:potassium-exchanging ATPase activity(GO:0005391) |
| 0.7 | 8.7 | GO:0016423 | tRNA (guanine) methyltransferase activity(GO:0016423) |
| 0.7 | 3.3 | GO:0004800 | thyroxine 5'-deiodinase activity(GO:0004800) |
| 0.6 | 3.9 | GO:0010997 | anaphase-promoting complex binding(GO:0010997) |
| 0.5 | 3.2 | GO:0043237 | laminin-1 binding(GO:0043237) |
| 0.5 | 4.1 | GO:0016176 | superoxide-generating NADPH oxidase activator activity(GO:0016176) |
| 0.5 | 2.5 | GO:0004999 | vasoactive intestinal polypeptide receptor activity(GO:0004999) |
| 0.5 | 2.0 | GO:0004909 | interleukin-1, Type I, activating receptor activity(GO:0004909) |
| 0.5 | 9.1 | GO:0038191 | neuropilin binding(GO:0038191) |
| 0.4 | 4.9 | GO:0004568 | chitinase activity(GO:0004568) chitin binding(GO:0008061) |
| 0.4 | 5.3 | GO:0046625 | sphingolipid binding(GO:0046625) |
| 0.4 | 2.6 | GO:0004699 | calcium-independent protein kinase C activity(GO:0004699) |
| 0.4 | 5.9 | GO:0045159 | myosin II binding(GO:0045159) |
| 0.4 | 2.5 | GO:0016361 | activin receptor activity, type I(GO:0016361) |
| 0.4 | 0.8 | GO:0050692 | DBD domain binding(GO:0050692) |
| 0.4 | 5.8 | GO:0004716 | receptor signaling protein tyrosine kinase activity(GO:0004716) |
| 0.4 | 1.5 | GO:0004687 | myosin light chain kinase activity(GO:0004687) |
| 0.4 | 2.6 | GO:0035368 | selenocysteine insertion sequence binding(GO:0035368) |
| 0.4 | 5.7 | GO:0016918 | retinal binding(GO:0016918) retinol binding(GO:0019841) |
| 0.4 | 5.3 | GO:0017017 | MAP kinase tyrosine/serine/threonine phosphatase activity(GO:0017017) |
| 0.3 | 1.3 | GO:0004911 | interleukin-2 receptor activity(GO:0004911) interleukin-2 binding(GO:0019976) |
| 0.3 | 3.2 | GO:0001162 | RNA polymerase II intronic transcription regulatory region sequence-specific DNA binding(GO:0001162) |
| 0.3 | 1.8 | GO:0004489 | methylenetetrahydrofolate reductase (NAD(P)H) activity(GO:0004489) |
| 0.3 | 2.0 | GO:0000182 | rDNA binding(GO:0000182) |
| 0.3 | 3.9 | GO:0022820 | potassium:chloride symporter activity(GO:0015379) potassium ion symporter activity(GO:0022820) |
| 0.3 | 1.4 | GO:0035673 | oligopeptide transmembrane transporter activity(GO:0035673) |
| 0.3 | 1.4 | GO:0034432 | endopolyphosphatase activity(GO:0000298) diphosphoinositol-polyphosphate diphosphatase activity(GO:0008486) bis(5'-adenosyl)-hexaphosphatase activity(GO:0034431) bis(5'-adenosyl)-pentaphosphatase activity(GO:0034432) inositol diphosphate tetrakisphosphate diphosphatase activity(GO:0052840) inositol bisdiphosphate tetrakisphosphate diphosphatase activity(GO:0052841) inositol diphosphate pentakisphosphate diphosphatase activity(GO:0052842) inositol-1-diphosphate-2,3,4,5,6-pentakisphosphate diphosphatase activity(GO:0052843) inositol-3-diphosphate-1,2,4,5,6-pentakisphosphate diphosphatase activity(GO:0052844) inositol-5-diphosphate-1,2,3,4,6-pentakisphosphate diphosphatase activity(GO:0052845) inositol-1,5-bisdiphosphate-2,3,4,6-tetrakisphosphate 1-diphosphatase activity(GO:0052846) inositol-1,5-bisdiphosphate-2,3,4,6-tetrakisphosphate 5-diphosphatase activity(GO:0052847) inositol-3,5-bisdiphosphate-2,3,4,6-tetrakisphosphate 5-diphosphatase activity(GO:0052848) |
| 0.3 | 4.2 | GO:0043024 | ribosomal small subunit binding(GO:0043024) |
| 0.3 | 2.1 | GO:0003910 | DNA ligase (ATP) activity(GO:0003910) |
| 0.3 | 3.1 | GO:0004065 | arylsulfatase activity(GO:0004065) |
| 0.3 | 5.8 | GO:0016875 | aminoacyl-tRNA ligase activity(GO:0004812) ligase activity, forming carbon-oxygen bonds(GO:0016875) ligase activity, forming aminoacyl-tRNA and related compounds(GO:0016876) |
| 0.2 | 7.4 | GO:0004707 | MAP kinase activity(GO:0004707) |
| 0.2 | 3.5 | GO:0008140 | cAMP response element binding protein binding(GO:0008140) |
| 0.2 | 7.9 | GO:0070742 | C2H2 zinc finger domain binding(GO:0070742) |
| 0.2 | 2.1 | GO:0046935 | 1-phosphatidylinositol-3-kinase regulator activity(GO:0046935) |
| 0.2 | 3.4 | GO:0035612 | AP-2 adaptor complex binding(GO:0035612) |
| 0.2 | 4.8 | GO:0001056 | RNA polymerase III activity(GO:0001056) |
| 0.2 | 1.1 | GO:0004994 | somatostatin receptor activity(GO:0004994) |
| 0.2 | 2.1 | GO:0022841 | potassium ion leak channel activity(GO:0022841) |
| 0.2 | 3.9 | GO:0019706 | protein-cysteine S-palmitoyltransferase activity(GO:0019706) protein-cysteine S-acyltransferase activity(GO:0019707) |
| 0.2 | 2.5 | GO:0016494 | C-X-C chemokine receptor activity(GO:0016494) |
| 0.2 | 11.0 | GO:0003755 | peptidyl-prolyl cis-trans isomerase activity(GO:0003755) |
| 0.2 | 13.6 | GO:0070888 | E-box binding(GO:0070888) |
| 0.2 | 2.8 | GO:0048406 | nerve growth factor binding(GO:0048406) |
| 0.2 | 10.1 | GO:0017112 | Rab guanyl-nucleotide exchange factor activity(GO:0017112) |
| 0.2 | 1.5 | GO:0050733 | RS domain binding(GO:0050733) |
| 0.2 | 1.3 | GO:0001640 | adenylate cyclase inhibiting G-protein coupled glutamate receptor activity(GO:0001640) G-protein coupled glutamate receptor activity(GO:0098988) |
| 0.2 | 3.3 | GO:0015467 | G-protein activated inward rectifier potassium channel activity(GO:0015467) |
| 0.2 | 5.0 | GO:0098641 | cadherin binding involved in cell-cell adhesion(GO:0098641) |
| 0.2 | 2.7 | GO:0005149 | interleukin-1 receptor binding(GO:0005149) |
| 0.2 | 3.7 | GO:0008409 | 5'-3' exonuclease activity(GO:0008409) |
| 0.2 | 1.0 | GO:0071532 | ankyrin repeat binding(GO:0071532) |
| 0.2 | 0.5 | GO:0030158 | protein xylosyltransferase activity(GO:0030158) |
| 0.2 | 2.0 | GO:0030306 | ADP-ribosylation factor binding(GO:0030306) |
| 0.1 | 7.3 | GO:0004683 | calmodulin-dependent protein kinase activity(GO:0004683) |
| 0.1 | 0.9 | GO:0061665 | SUMO ligase activity(GO:0061665) |
| 0.1 | 1.0 | GO:0003810 | protein-glutamine gamma-glutamyltransferase activity(GO:0003810) |
| 0.1 | 2.8 | GO:0003708 | retinoic acid receptor activity(GO:0003708) |
| 0.1 | 4.4 | GO:0005001 | transmembrane receptor protein tyrosine phosphatase activity(GO:0005001) transmembrane receptor protein phosphatase activity(GO:0019198) |
| 0.1 | 0.8 | GO:0071074 | eukaryotic initiation factor eIF2 binding(GO:0071074) |
| 0.1 | 1.5 | GO:0005007 | fibroblast growth factor-activated receptor activity(GO:0005007) |
| 0.1 | 10.7 | GO:0043621 | protein self-association(GO:0043621) |
| 0.1 | 9.4 | GO:0098531 | RNA polymerase II transcription factor activity, ligand-activated sequence-specific DNA binding(GO:0004879) transcription factor activity, direct ligand regulated sequence-specific DNA binding(GO:0098531) |
| 0.1 | 2.0 | GO:0009881 | photoreceptor activity(GO:0009881) |
| 0.1 | 1.8 | GO:0016641 | oxidoreductase activity, acting on the CH-NH2 group of donors, oxygen as acceptor(GO:0016641) |
| 0.1 | 0.9 | GO:0004351 | glutamate decarboxylase activity(GO:0004351) |
| 0.1 | 2.8 | GO:0050321 | tau-protein kinase activity(GO:0050321) |
| 0.1 | 3.1 | GO:0005035 | tumor necrosis factor-activated receptor activity(GO:0005031) death receptor activity(GO:0005035) |
| 0.1 | 14.2 | GO:0004222 | metalloendopeptidase activity(GO:0004222) |
| 0.1 | 0.4 | GO:0042954 | lipoprotein transporter activity(GO:0042954) |
| 0.1 | 21.0 | GO:0005200 | structural constituent of cytoskeleton(GO:0005200) |
| 0.1 | 8.0 | GO:0001540 | beta-amyloid binding(GO:0001540) |
| 0.1 | 1.1 | GO:0030346 | protein phosphatase 2B binding(GO:0030346) |
| 0.1 | 3.7 | GO:0005540 | hyaluronic acid binding(GO:0005540) |
| 0.1 | 8.1 | GO:0004843 | thiol-dependent ubiquitin-specific protease activity(GO:0004843) |
| 0.1 | 2.5 | GO:0046961 | ATPase activity, coupled to transmembrane movement of ions, rotational mechanism(GO:0044769) proton-transporting ATPase activity, rotational mechanism(GO:0046961) |
| 0.1 | 3.2 | GO:0005109 | frizzled binding(GO:0005109) |
| 0.1 | 1.0 | GO:0015925 | galactosidase activity(GO:0015925) |
| 0.1 | 10.1 | GO:0042826 | histone deacetylase binding(GO:0042826) |
| 0.1 | 2.6 | GO:0043425 | bHLH transcription factor binding(GO:0043425) |
| 0.1 | 3.1 | GO:0070840 | dynein complex binding(GO:0070840) |
| 0.1 | 5.1 | GO:0002039 | p53 binding(GO:0002039) |
| 0.1 | 3.1 | GO:0005484 | SNAP receptor activity(GO:0005484) |
| 0.1 | 1.4 | GO:0043495 | protein anchor(GO:0043495) |
| 0.1 | 6.4 | GO:0031490 | chromatin DNA binding(GO:0031490) |
| 0.1 | 1.9 | GO:0005251 | delayed rectifier potassium channel activity(GO:0005251) |
| 0.1 | 0.7 | GO:0048185 | activin binding(GO:0048185) |
| 0.1 | 3.1 | GO:0030544 | Hsp70 protein binding(GO:0030544) |
| 0.1 | 2.4 | GO:0071889 | 14-3-3 protein binding(GO:0071889) |
| 0.1 | 0.6 | GO:0004957 | prostaglandin E receptor activity(GO:0004957) |
| 0.1 | 1.4 | GO:0052629 | phosphatidylinositol-3,5-bisphosphate 3-phosphatase activity(GO:0052629) |
| 0.1 | 0.5 | GO:0030618 | transforming growth factor beta receptor, pathway-specific cytoplasmic mediator activity(GO:0030618) |
| 0.1 | 1.5 | GO:0030507 | spectrin binding(GO:0030507) |
| 0.1 | 0.9 | GO:0004383 | guanylate cyclase activity(GO:0004383) |
| 0.1 | 1.9 | GO:0005086 | ARF guanyl-nucleotide exchange factor activity(GO:0005086) |
| 0.1 | 7.7 | GO:0005262 | calcium channel activity(GO:0005262) |
| 0.0 | 0.2 | GO:0008532 | N-acetyllactosaminide beta-1,3-N-acetylglucosaminyltransferase activity(GO:0008532) |
| 0.0 | 1.1 | GO:0003841 | 1-acylglycerol-3-phosphate O-acyltransferase activity(GO:0003841) |
| 0.0 | 1.8 | GO:0035035 | histone acetyltransferase binding(GO:0035035) |
| 0.0 | 6.5 | GO:0017137 | Rab GTPase binding(GO:0017137) |
| 0.0 | 2.5 | GO:0000980 | RNA polymerase II distal enhancer sequence-specific DNA binding(GO:0000980) |
| 0.0 | 1.0 | GO:0051019 | mitogen-activated protein kinase binding(GO:0051019) |
| 0.0 | 1.7 | GO:0003705 | transcription factor activity, RNA polymerase II distal enhancer sequence-specific binding(GO:0003705) |
| 0.0 | 2.5 | GO:0003777 | microtubule motor activity(GO:0003777) |
| 0.0 | 0.4 | GO:0070700 | BMP receptor binding(GO:0070700) |
| 0.0 | 0.9 | GO:0004864 | protein phosphatase inhibitor activity(GO:0004864) |
| 0.0 | 1.0 | GO:0017080 | sodium channel regulator activity(GO:0017080) |
| 0.0 | 1.0 | GO:0032452 | histone demethylase activity(GO:0032452) |
| 0.0 | 0.3 | GO:0004897 | ciliary neurotrophic factor receptor activity(GO:0004897) |
| 0.0 | 0.4 | GO:0015280 | ligand-gated sodium channel activity(GO:0015280) |
| 0.0 | 3.4 | GO:0004860 | protein kinase inhibitor activity(GO:0004860) |
| 0.0 | 4.5 | GO:0044325 | ion channel binding(GO:0044325) |
| 0.0 | 1.3 | GO:0035064 | methylated histone binding(GO:0035064) |
| 0.0 | 0.5 | GO:0017147 | Wnt-protein binding(GO:0017147) |
| 0.0 | 0.5 | GO:0031489 | myosin V binding(GO:0031489) |
| 0.0 | 1.7 | GO:0004197 | cysteine-type endopeptidase activity(GO:0004197) |
| 0.0 | 0.7 | GO:0031593 | polyubiquitin binding(GO:0031593) |
| 0.0 | 0.7 | GO:0005123 | death receptor binding(GO:0005123) |
| 0.0 | 3.7 | GO:0019902 | phosphatase binding(GO:0019902) |
| 0.0 | 2.4 | GO:0017124 | SH3 domain binding(GO:0017124) |
| 0.0 | 2.3 | GO:0051015 | actin filament binding(GO:0051015) |
| 0.0 | 10.9 | GO:0005509 | calcium ion binding(GO:0005509) |
| 0.0 | 1.1 | GO:0046332 | SMAD binding(GO:0046332) |
Gene overrepresentation in curated gene sets: canonical pathways category:
| Log-likelihood per target | Total log-likelihood | Term | Description |
|---|---|---|---|
| 0.6 | 11.7 | PID CIRCADIAN PATHWAY | Circadian rhythm pathway |
| 0.4 | 15.9 | PID S1P S1P1 PATHWAY | S1P1 pathway |
| 0.3 | 6.3 | PID TCR JNK PATHWAY | JNK signaling in the CD4+ TCR pathway |
| 0.3 | 12.1 | PID FANCONI PATHWAY | Fanconi anemia pathway |
| 0.2 | 6.1 | PID P38 MKK3 6PATHWAY | p38 MAPK signaling pathway |
| 0.2 | 14.6 | ST JNK MAPK PATHWAY | JNK MAPK Pathway |
| 0.2 | 4.2 | PID IL5 PATHWAY | IL5-mediated signaling events |
| 0.1 | 3.1 | SA PROGRAMMED CELL DEATH | Programmed cell death, or apoptosis, eliminates damaged or unneeded cells. |
| 0.1 | 9.5 | PID TXA2PATHWAY | Thromboxane A2 receptor signaling |
| 0.1 | 6.5 | PID TCPTP PATHWAY | Signaling events mediated by TCPTP |
| 0.1 | 4.5 | PID IL6 7 PATHWAY | IL6-mediated signaling events |
| 0.1 | 3.9 | PID ATR PATHWAY | ATR signaling pathway |
| 0.1 | 3.3 | PID INTEGRIN A9B1 PATHWAY | Alpha9 beta1 integrin signaling events |
| 0.1 | 3.3 | PID IL2 STAT5 PATHWAY | IL2 signaling events mediated by STAT5 |
| 0.1 | 6.5 | SIG CHEMOTAXIS | Genes related to chemotaxis |
| 0.1 | 2.8 | PID RETINOIC ACID PATHWAY | Retinoic acid receptors-mediated signaling |
| 0.1 | 16.0 | PID P53 DOWNSTREAM PATHWAY | Direct p53 effectors |
| 0.1 | 2.7 | PID IL1 PATHWAY | IL1-mediated signaling events |
| 0.1 | 12.4 | NABA ECM AFFILIATED | Genes encoding proteins affiliated structurally or functionally to extracellular matrix proteins |
| 0.1 | 2.1 | PID WNT NONCANONICAL PATHWAY | Noncanonical Wnt signaling pathway |
| 0.1 | 0.6 | SIG IL4RECEPTOR IN B LYPHOCYTES | Genes related to IL4 rceptor signaling in B lymphocytes |
| 0.1 | 0.9 | PID LPA4 PATHWAY | LPA4-mediated signaling events |
| 0.0 | 4.0 | PID P73PATHWAY | p73 transcription factor network |
| 0.0 | 2.1 | PID ATF2 PATHWAY | ATF-2 transcription factor network |
| 0.0 | 0.9 | PID RANBP2 PATHWAY | Sumoylation by RanBP2 regulates transcriptional repression |
| 0.0 | 4.8 | PID MYC ACTIV PATHWAY | Validated targets of C-MYC transcriptional activation |
| 0.0 | 2.8 | PID P75 NTR PATHWAY | p75(NTR)-mediated signaling |
| 0.0 | 2.1 | PID LKB1 PATHWAY | LKB1 signaling events |
| 0.0 | 1.0 | PID HIF1A PATHWAY | Hypoxic and oxygen homeostasis regulation of HIF-1-alpha |
| 0.0 | 0.7 | PID ATM PATHWAY | ATM pathway |
| 0.0 | 1.1 | PID TCR CALCIUM PATHWAY | Calcium signaling in the CD4+ TCR pathway |
| 0.0 | 0.5 | PID PI3K PLC TRK PATHWAY | Trk receptor signaling mediated by PI3K and PLC-gamma |
| 0.0 | 0.5 | PID ALK2 PATHWAY | ALK2 signaling events |
| 0.0 | 1.5 | PID FGF PATHWAY | FGF signaling pathway |
| 0.0 | 0.8 | SA MMP CYTOKINE CONNECTION | Cytokines can induce activation of matrix metalloproteinases, which degrade extracellular matrix. |
| 0.0 | 1.8 | PID ECADHERIN STABILIZATION PATHWAY | Stabilization and expansion of the E-cadherin adherens junction |
| 0.0 | 0.2 | PID ER NONGENOMIC PATHWAY | Plasma membrane estrogen receptor signaling |
| 0.0 | 0.9 | PID P53 REGULATION PATHWAY | p53 pathway |
| 0.0 | 0.5 | PID HIF2PATHWAY | HIF-2-alpha transcription factor network |
| 0.0 | 0.7 | PID BMP PATHWAY | BMP receptor signaling |
| 0.0 | 0.5 | PID E2F PATHWAY | E2F transcription factor network |
Gene overrepresentation in curated gene sets: REACTOME pathways category:
| Log-likelihood per target | Total log-likelihood | Term | Description |
|---|---|---|---|
| 0.5 | 12.1 | REACTOME FANCONI ANEMIA PATHWAY | Genes involved in Fanconi Anemia pathway |
| 0.5 | 11.5 | REACTOME OTHER SEMAPHORIN INTERACTIONS | Genes involved in Other semaphorin interactions |
| 0.4 | 7.1 | REACTOME REGULATION OF PYRUVATE DEHYDROGENASE PDH COMPLEX | Genes involved in Regulation of pyruvate dehydrogenase (PDH) complex |
| 0.4 | 7.4 | REACTOME ERKS ARE INACTIVATED | Genes involved in ERKs are inactivated |
| 0.4 | 5.8 | REACTOME MITOCHONDRIAL TRNA AMINOACYLATION | Genes involved in Mitochondrial tRNA aminoacylation |
| 0.4 | 8.9 | REACTOME REGULATION OF INSULIN LIKE GROWTH FACTOR IGF ACTIVITY BY INSULIN LIKE GROWTH FACTOR BINDING PROTEINS IGFBPS | Genes involved in Regulation of Insulin-like Growth Factor (IGF) Activity by Insulin-like Growth Factor Binding Proteins (IGFBPs) |
| 0.3 | 2.1 | REACTOME TANDEM PORE DOMAIN POTASSIUM CHANNELS | Genes involved in Tandem pore domain potassium channels |
| 0.3 | 7.0 | REACTOME ELONGATION ARREST AND RECOVERY | Genes involved in Elongation arrest and recovery |
| 0.2 | 3.1 | REACTOME THE ACTIVATION OF ARYLSULFATASES | Genes involved in The activation of arylsulfatases |
| 0.2 | 11.7 | REACTOME BMAL1 CLOCK NPAS2 ACTIVATES CIRCADIAN EXPRESSION | Genes involved in BMAL1:CLOCK/NPAS2 Activates Circadian Expression |
| 0.2 | 4.6 | REACTOME CLASS C 3 METABOTROPIC GLUTAMATE PHEROMONE RECEPTORS | Genes involved in Class C/3 (Metabotropic glutamate/pheromone receptors) |
| 0.2 | 7.3 | REACTOME UNBLOCKING OF NMDA RECEPTOR GLUTAMATE BINDING AND ACTIVATION | Genes involved in Unblocking of NMDA receptor, glutamate binding and activation |
| 0.2 | 4.8 | REACTOME RNA POL III CHAIN ELONGATION | Genes involved in RNA Polymerase III Chain Elongation |
| 0.2 | 6.7 | REACTOME SPHINGOLIPID DE NOVO BIOSYNTHESIS | Genes involved in Sphingolipid de novo biosynthesis |
| 0.2 | 5.0 | REACTOME ACTIVATION OF RAC | Genes involved in Activation of Rac |
| 0.2 | 9.0 | REACTOME BASIGIN INTERACTIONS | Genes involved in Basigin interactions |
| 0.2 | 3.2 | REACTOME ACTIVATION OF CHAPERONES BY ATF6 ALPHA | Genes involved in Activation of Chaperones by ATF6-alpha |
| 0.2 | 6.3 | REACTOME CASPASE MEDIATED CLEAVAGE OF CYTOSKELETAL PROTEINS | Genes involved in Caspase-mediated cleavage of cytoskeletal proteins |
| 0.2 | 2.8 | REACTOME GAMMA CARBOXYLATION TRANSPORT AND AMINO TERMINAL CLEAVAGE OF PROTEINS | Genes involved in Gamma-carboxylation, transport, and amino-terminal cleavage of proteins |
| 0.2 | 3.3 | REACTOME AMINE DERIVED HORMONES | Genes involved in Amine-derived hormones |
| 0.2 | 3.7 | REACTOME HYALURONAN UPTAKE AND DEGRADATION | Genes involved in Hyaluronan uptake and degradation |
| 0.2 | 3.5 | REACTOME ACTIVATION OF BH3 ONLY PROTEINS | Genes involved in Activation of BH3-only proteins |
| 0.1 | 12.2 | REACTOME NUCLEAR RECEPTOR TRANSCRIPTION PATHWAY | Genes involved in Nuclear Receptor transcription pathway |
| 0.1 | 4.5 | REACTOME TRAF6 MEDIATED IRF7 ACTIVATION | Genes involved in TRAF6 mediated IRF7 activation |
| 0.1 | 3.5 | REACTOME SMAD2 SMAD3 SMAD4 HETEROTRIMER REGULATES TRANSCRIPTION | Genes involved in SMAD2/SMAD3:SMAD4 heterotrimer regulates transcription |
| 0.1 | 3.3 | REACTOME INHIBITION OF VOLTAGE GATED CA2 CHANNELS VIA GBETA GAMMA SUBUNITS | Genes involved in Inhibition of voltage gated Ca2+ channels via Gbeta/gamma subunits |
| 0.1 | 2.1 | REACTOME REGULATION OF GENE EXPRESSION IN BETA CELLS | Genes involved in Regulation of gene expression in beta cells |
| 0.1 | 2.1 | REACTOME IL 7 SIGNALING | Genes involved in Interleukin-7 signaling |
| 0.1 | 3.5 | REACTOME G ALPHA Z SIGNALLING EVENTS | Genes involved in G alpha (z) signalling events |
| 0.1 | 2.1 | REACTOME RESOLUTION OF AP SITES VIA THE SINGLE NUCLEOTIDE REPLACEMENT PATHWAY | Genes involved in Resolution of AP sites via the single-nucleotide replacement pathway |
| 0.1 | 2.6 | REACTOME SIGNAL REGULATORY PROTEIN SIRP FAMILY INTERACTIONS | Genes involved in Signal regulatory protein (SIRP) family interactions |
| 0.1 | 2.5 | REACTOME INSULIN RECEPTOR RECYCLING | Genes involved in Insulin receptor recycling |
| 0.1 | 4.6 | REACTOME IL1 SIGNALING | Genes involved in Interleukin-1 signaling |
| 0.1 | 2.2 | REACTOME SIGNALING BY EGFR IN CANCER | Genes involved in Signaling by EGFR in Cancer |
| 0.1 | 1.5 | REACTOME SIGNALING BY FGFR3 MUTANTS | Genes involved in Signaling by FGFR3 mutants |
| 0.1 | 2.5 | REACTOME SIGNALING BY NODAL | Genes involved in Signaling by NODAL |
| 0.1 | 8.3 | REACTOME CLASS B 2 SECRETIN FAMILY RECEPTORS | Genes involved in Class B/2 (Secretin family receptors) |
| 0.1 | 2.5 | REACTOME SYNTHESIS SECRETION AND INACTIVATION OF GLP1 | Genes involved in Synthesis, Secretion, and Inactivation of Glucagon-like Peptide-1 (GLP-1) |
| 0.1 | 1.3 | REACTOME IONOTROPIC ACTIVITY OF KAINATE RECEPTORS | Genes involved in Ionotropic activity of Kainate Receptors |
| 0.1 | 0.8 | REACTOME REGULATION OF KIT SIGNALING | Genes involved in Regulation of KIT signaling |
| 0.1 | 1.6 | REACTOME DEGRADATION OF THE EXTRACELLULAR MATRIX | Genes involved in Degradation of the extracellular matrix |
| 0.0 | 0.6 | REACTOME PROSTANOID LIGAND RECEPTORS | Genes involved in Prostanoid ligand receptors |
| 0.0 | 0.7 | REACTOME RETROGRADE NEUROTROPHIN SIGNALLING | Genes involved in Retrograde neurotrophin signalling |
| 0.0 | 2.5 | REACTOME CHEMOKINE RECEPTORS BIND CHEMOKINES | Genes involved in Chemokine receptors bind chemokines |
| 0.0 | 1.6 | REACTOME TRAFFICKING OF AMPA RECEPTORS | Genes involved in Trafficking of AMPA receptors |
| 0.0 | 4.6 | REACTOME TRANSPORT OF INORGANIC CATIONS ANIONS AND AMINO ACIDS OLIGOPEPTIDES | Genes involved in Transport of inorganic cations/anions and amino acids/oligopeptides |
| 0.0 | 1.1 | REACTOME SYNTHESIS OF PA | Genes involved in Synthesis of PA |
| 0.0 | 1.9 | REACTOME VOLTAGE GATED POTASSIUM CHANNELS | Genes involved in Voltage gated Potassium channels |
| 0.0 | 1.4 | REACTOME INTERACTION BETWEEN L1 AND ANKYRINS | Genes involved in Interaction between L1 and Ankyrins |
| 0.0 | 1.4 | REACTOME SYNTHESIS OF PIPS AT THE PLASMA MEMBRANE | Genes involved in Synthesis of PIPs at the plasma membrane |
| 0.0 | 1.5 | REACTOME SMOOTH MUSCLE CONTRACTION | Genes involved in Smooth Muscle Contraction |
| 0.0 | 4.3 | REACTOME G ALPHA I SIGNALLING EVENTS | Genes involved in G alpha (i) signalling events |
| 0.0 | 0.7 | REACTOME EXTRINSIC PATHWAY FOR APOPTOSIS | Genes involved in Extrinsic Pathway for Apoptosis |
| 0.0 | 0.9 | REACTOME ADHERENS JUNCTIONS INTERACTIONS | Genes involved in Adherens junctions interactions |
| 0.0 | 0.9 | REACTOME GABA SYNTHESIS RELEASE REUPTAKE AND DEGRADATION | Genes involved in GABA synthesis, release, reuptake and degradation |
| 0.0 | 1.0 | REACTOME REGULATION OF HYPOXIA INDUCIBLE FACTOR HIF BY OXYGEN | Genes involved in Regulation of Hypoxia-inducible Factor (HIF) by Oxygen |
| 0.0 | 0.5 | REACTOME SIGNALING BY BMP | Genes involved in Signaling by BMP |
| 0.0 | 0.4 | REACTOME SEMA4D INDUCED CELL MIGRATION AND GROWTH CONE COLLAPSE | Genes involved in Sema4D induced cell migration and growth-cone collapse |
| 0.0 | 0.3 | REACTOME PROTEOLYTIC CLEAVAGE OF SNARE COMPLEX PROTEINS | Genes involved in Proteolytic cleavage of SNARE complex proteins |
| 0.0 | 0.9 | REACTOME METABOLISM OF VITAMINS AND COFACTORS | Genes involved in Metabolism of vitamins and cofactors |