Project
GNF SymAtlas + NCI-60 cancer cell lines, human (Su, 2004; Ross, 2000)
Navigation
Downloads
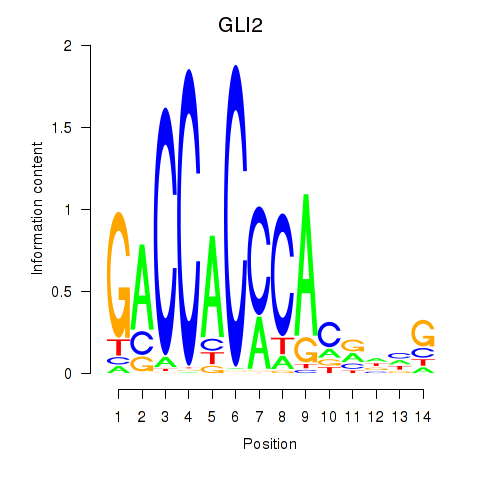
Results for GLI2
Z-value: 1.38
Motif logo
Transcription factors associated with GLI2
| Gene Symbol | Gene ID | Gene Info |
|---|---|---|
|
GLI2
|
ENSG00000074047.22 | GLI2 |
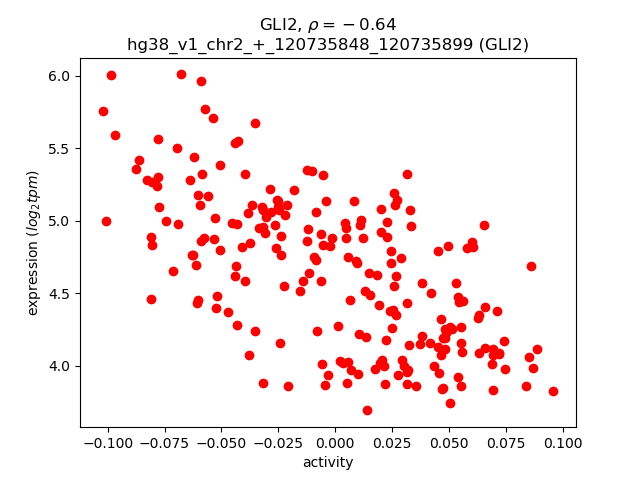
Activity-expression correlation:
| Gene | Promoter | Pearson corr. coef. | P-value | Plot |
|---|---|---|---|---|
| GLI2 | hg38_v1_chr2_+_120735848_120735899 | -0.64 | 3.3e-26 | Click! |
Activity profile of GLI2 motif
Sorted Z-values of GLI2 motif
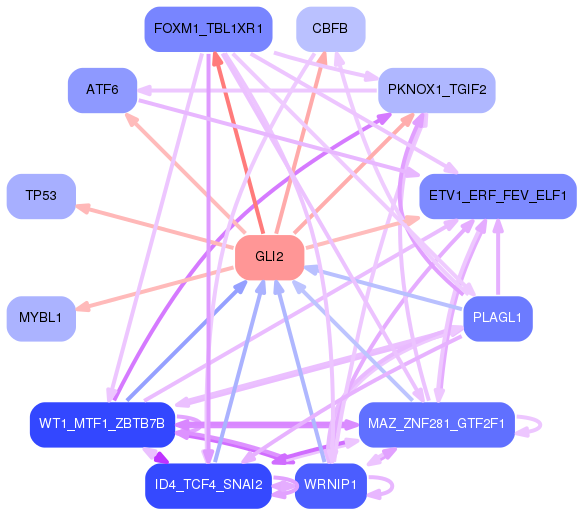
Network of associatons between targets according to the STRING database.

First level regulatory network of GLI2
Gene Ontology Analysis
Gene overrepresentation in biological process category:
| Log-likelihood per target | Total log-likelihood | Term | Description |
|---|---|---|---|
| 8.0 | 32.0 | GO:0009216 | adenosine salvage(GO:0006169) dATP biosynthetic process(GO:0006175) purine deoxyribonucleoside triphosphate biosynthetic process(GO:0009216) |
| 6.5 | 26.2 | GO:1903976 | Schwann cell migration(GO:0036135) regulation of Schwann cell migration(GO:1900147) negative regulation of glial cell migration(GO:1903976) |
| 5.9 | 17.6 | GO:0018171 | peptidyl-cysteine oxidation(GO:0018171) |
| 5.8 | 23.1 | GO:2000255 | negative regulation of male germ cell proliferation(GO:2000255) |
| 5.2 | 47.1 | GO:2000582 | regulation of ATP-dependent microtubule motor activity, plus-end-directed(GO:2000580) positive regulation of ATP-dependent microtubule motor activity, plus-end-directed(GO:2000582) |
| 4.9 | 14.6 | GO:0070682 | proteasome regulatory particle assembly(GO:0070682) |
| 4.7 | 23.4 | GO:0006177 | GMP biosynthetic process(GO:0006177) |
| 4.4 | 13.2 | GO:0015920 | lipopolysaccharide transport(GO:0015920) |
| 4.4 | 43.6 | GO:0060136 | embryonic process involved in female pregnancy(GO:0060136) |
| 4.2 | 12.6 | GO:1901389 | regulation of transforming growth factor beta activation(GO:1901388) negative regulation of transforming growth factor beta activation(GO:1901389) |
| 4.1 | 24.9 | GO:0033490 | cholesterol biosynthetic process via desmosterol(GO:0033489) cholesterol biosynthetic process via lathosterol(GO:0033490) |
| 3.9 | 19.3 | GO:0043137 | DNA replication, removal of RNA primer(GO:0043137) |
| 3.7 | 14.9 | GO:0036116 | medium-chain fatty-acyl-CoA catabolic process(GO:0036114) long-chain fatty-acyl-CoA catabolic process(GO:0036116) palmitic acid metabolic process(GO:1900533) palmitic acid biosynthetic process(GO:1900535) |
| 3.6 | 25.3 | GO:0030421 | defecation(GO:0030421) |
| 3.5 | 17.7 | GO:0002439 | chronic inflammatory response to antigenic stimulus(GO:0002439) |
| 3.5 | 41.6 | GO:0070494 | regulation of thrombin receptor signaling pathway(GO:0070494) negative regulation of thrombin receptor signaling pathway(GO:0070495) |
| 3.3 | 26.7 | GO:0046984 | regulation of hemoglobin biosynthetic process(GO:0046984) |
| 3.3 | 42.5 | GO:0043248 | proteasome assembly(GO:0043248) |
| 3.2 | 9.6 | GO:1903778 | protein localization to vacuolar membrane(GO:1903778) |
| 3.2 | 12.8 | GO:0046900 | tetrahydrofolylpolyglutamate metabolic process(GO:0046900) |
| 3.2 | 41.5 | GO:2000781 | positive regulation of double-strand break repair(GO:2000781) |
| 3.0 | 12.0 | GO:0032597 | B cell receptor transport within lipid bilayer(GO:0032595) B cell receptor transport into membrane raft(GO:0032597) protein transport out of membrane raft(GO:0032599) chemokine receptor transport out of membrane raft(GO:0032600) negative regulation of transforming growth factor beta3 production(GO:0032913) chemokine receptor transport within lipid bilayer(GO:0033606) |
| 3.0 | 8.9 | GO:0003420 | regulation of growth plate cartilage chondrocyte proliferation(GO:0003420) |
| 2.8 | 22.1 | GO:0032020 | ISG15-protein conjugation(GO:0032020) |
| 2.7 | 8.1 | GO:0035752 | lysosomal lumen pH elevation(GO:0035752) |
| 2.6 | 34.3 | GO:0010528 | regulation of transposition(GO:0010528) negative regulation of transposition(GO:0010529) |
| 2.6 | 13.2 | GO:0006015 | 5-phosphoribose 1-diphosphate biosynthetic process(GO:0006015) 5-phosphoribose 1-diphosphate metabolic process(GO:0046391) |
| 2.5 | 7.6 | GO:1903826 | arginine transmembrane transport(GO:1903826) |
| 2.4 | 16.7 | GO:0008295 | spermidine biosynthetic process(GO:0008295) |
| 2.3 | 23.5 | GO:0061732 | mitochondrial acetyl-CoA biosynthetic process from pyruvate(GO:0061732) |
| 2.3 | 9.4 | GO:0036496 | regulation of translational initiation by eIF2 alpha dephosphorylation(GO:0036496) |
| 2.3 | 27.5 | GO:0046689 | response to mercury ion(GO:0046689) |
| 2.2 | 6.5 | GO:0051464 | positive regulation of cortisol secretion(GO:0051464) |
| 2.1 | 21.0 | GO:0045716 | positive regulation of low-density lipoprotein particle receptor biosynthetic process(GO:0045716) |
| 2.0 | 10.2 | GO:1902766 | skeletal muscle satellite cell migration(GO:1902766) |
| 2.0 | 8.1 | GO:0042663 | regulation of endodermal cell fate specification(GO:0042663) |
| 2.0 | 7.9 | GO:0033634 | positive regulation of cell-cell adhesion mediated by integrin(GO:0033634) |
| 1.9 | 5.7 | GO:1903719 | regulation of I-kappaB phosphorylation(GO:1903719) positive regulation of I-kappaB phosphorylation(GO:1903721) |
| 1.8 | 22.0 | GO:0046784 | viral mRNA export from host cell nucleus(GO:0046784) |
| 1.8 | 5.4 | GO:0051097 | negative regulation of helicase activity(GO:0051097) oligodendrocyte apoptotic process(GO:0097252) |
| 1.8 | 5.4 | GO:0043461 | proton-transporting ATP synthase complex assembly(GO:0043461) proton-transporting ATP synthase complex biogenesis(GO:0070272) |
| 1.7 | 6.9 | GO:1901536 | regulation of DNA demethylation(GO:1901535) negative regulation of DNA demethylation(GO:1901536) regulation of genetic imprinting(GO:2000653) |
| 1.7 | 8.6 | GO:0005997 | xylulose metabolic process(GO:0005997) |
| 1.7 | 5.1 | GO:0006059 | hexitol metabolic process(GO:0006059) |
| 1.7 | 5.1 | GO:0006121 | mitochondrial electron transport, succinate to ubiquinone(GO:0006121) |
| 1.7 | 8.4 | GO:1903377 | negative regulation of oxidative stress-induced neuron intrinsic apoptotic signaling pathway(GO:1903377) |
| 1.7 | 11.7 | GO:0060154 | cellular process regulating host cell cycle in response to virus(GO:0060154) |
| 1.7 | 11.6 | GO:0051490 | negative regulation of filopodium assembly(GO:0051490) |
| 1.7 | 5.0 | GO:0018160 | peptidyl-pyrromethane cofactor linkage(GO:0018160) |
| 1.6 | 6.5 | GO:1901873 | regulation of post-translational protein modification(GO:1901873) |
| 1.6 | 8.0 | GO:0070269 | pyroptosis(GO:0070269) |
| 1.6 | 3.1 | GO:0006404 | RNA import into nucleus(GO:0006404) |
| 1.5 | 27.5 | GO:0030388 | fructose 1,6-bisphosphate metabolic process(GO:0030388) |
| 1.5 | 16.7 | GO:0007144 | female meiosis I(GO:0007144) |
| 1.5 | 7.5 | GO:1900262 | regulation of DNA-directed DNA polymerase activity(GO:1900262) positive regulation of DNA-directed DNA polymerase activity(GO:1900264) |
| 1.5 | 5.9 | GO:0032487 | regulation of Rap protein signal transduction(GO:0032487) |
| 1.5 | 20.4 | GO:2000643 | positive regulation of early endosome to late endosome transport(GO:2000643) |
| 1.5 | 5.8 | GO:1990737 | response to manganese-induced endoplasmic reticulum stress(GO:1990737) |
| 1.4 | 9.8 | GO:0032511 | late endosome to vacuole transport via multivesicular body sorting pathway(GO:0032511) |
| 1.4 | 14.0 | GO:0050703 | interleukin-1 alpha secretion(GO:0050703) |
| 1.4 | 9.5 | GO:2000491 | positive regulation of hepatic stellate cell activation(GO:2000491) |
| 1.4 | 17.6 | GO:0044387 | negative regulation of protein kinase activity by regulation of protein phosphorylation(GO:0044387) |
| 1.3 | 14.8 | GO:1904263 | positive regulation of TORC1 signaling(GO:1904263) |
| 1.3 | 4.0 | GO:2000616 | negative regulation of histone H3-K9 acetylation(GO:2000616) |
| 1.3 | 60.0 | GO:0006370 | 7-methylguanosine mRNA capping(GO:0006370) |
| 1.3 | 8.9 | GO:0035879 | plasma membrane lactate transport(GO:0035879) |
| 1.2 | 5.0 | GO:0046947 | hydroxylysine metabolic process(GO:0046946) hydroxylysine biosynthetic process(GO:0046947) |
| 1.2 | 3.7 | GO:1904751 | positive regulation of protein localization to nucleolus(GO:1904751) |
| 1.2 | 4.8 | GO:0018199 | peptidyl-glutamine modification(GO:0018199) |
| 1.2 | 18.9 | GO:1901673 | regulation of mitotic spindle assembly(GO:1901673) |
| 1.1 | 5.7 | GO:0010193 | response to ozone(GO:0010193) |
| 1.1 | 6.9 | GO:0032815 | negative regulation of natural killer cell activation(GO:0032815) |
| 1.1 | 10.2 | GO:0009249 | protein lipoylation(GO:0009249) |
| 1.1 | 19.2 | GO:0070389 | chaperone cofactor-dependent protein refolding(GO:0070389) |
| 1.1 | 14.6 | GO:0008635 | activation of cysteine-type endopeptidase activity involved in apoptotic process by cytochrome c(GO:0008635) |
| 1.1 | 3.4 | GO:1903925 | signal transduction involved in intra-S DNA damage checkpoint(GO:0072428) response to bisphenol A(GO:1903925) cellular response to bisphenol A(GO:1903926) negative regulation of DNA damage checkpoint(GO:2000002) |
| 1.1 | 15.6 | GO:0006089 | lactate metabolic process(GO:0006089) |
| 1.1 | 4.4 | GO:0045048 | protein insertion into ER membrane(GO:0045048) |
| 1.1 | 5.5 | GO:0030174 | regulation of DNA-dependent DNA replication initiation(GO:0030174) |
| 1.0 | 7.3 | GO:0006990 | positive regulation of transcription from RNA polymerase II promoter involved in unfolded protein response(GO:0006990) |
| 1.0 | 6.1 | GO:0071460 | cellular response to cell-matrix adhesion(GO:0071460) |
| 1.0 | 3.0 | GO:0071072 | negative regulation of phospholipid biosynthetic process(GO:0071072) |
| 1.0 | 12.9 | GO:0035518 | histone H2A monoubiquitination(GO:0035518) |
| 1.0 | 2.9 | GO:1903238 | positive regulation of leukocyte tethering or rolling(GO:1903238) |
| 1.0 | 3.9 | GO:0046952 | ketone body catabolic process(GO:0046952) |
| 0.9 | 3.8 | GO:0071418 | cellular response to amine stimulus(GO:0071418) |
| 0.9 | 9.4 | GO:0005984 | disaccharide metabolic process(GO:0005984) |
| 0.9 | 5.6 | GO:2000563 | positive regulation of CD4-positive, alpha-beta T cell proliferation(GO:2000563) |
| 0.9 | 3.7 | GO:0006550 | isoleucine catabolic process(GO:0006550) |
| 0.9 | 6.4 | GO:0045079 | negative regulation of chemokine biosynthetic process(GO:0045079) |
| 0.9 | 11.7 | GO:0000715 | nucleotide-excision repair, DNA damage recognition(GO:0000715) |
| 0.9 | 4.4 | GO:0044791 | modulation by host of viral release from host cell(GO:0044789) positive regulation by host of viral release from host cell(GO:0044791) |
| 0.9 | 8.9 | GO:0048386 | positive regulation of retinoic acid receptor signaling pathway(GO:0048386) |
| 0.9 | 27.3 | GO:0006418 | tRNA aminoacylation for protein translation(GO:0006418) |
| 0.9 | 3.5 | GO:0008588 | release of cytoplasmic sequestered NF-kappaB(GO:0008588) |
| 0.9 | 7.8 | GO:1902661 | negative regulation of transcription during mitosis(GO:0007068) negative regulation of transcription from RNA polymerase II promoter during mitosis(GO:0007070) positive regulation of glucose mediated signaling pathway(GO:1902661) |
| 0.9 | 5.2 | GO:1902570 | protein localization to nucleolus(GO:1902570) |
| 0.8 | 9.1 | GO:0010499 | proteasomal ubiquitin-independent protein catabolic process(GO:0010499) |
| 0.8 | 3.3 | GO:0098957 | anterograde axonal transport of mitochondrion(GO:0098957) |
| 0.8 | 12.2 | GO:0070986 | left/right axis specification(GO:0070986) |
| 0.8 | 27.3 | GO:0006294 | nucleotide-excision repair, preincision complex assembly(GO:0006294) |
| 0.8 | 2.3 | GO:1903567 | negative regulation of protein localization to cilium(GO:1903565) regulation of protein localization to ciliary membrane(GO:1903567) negative regulation of protein localization to ciliary membrane(GO:1903568) |
| 0.8 | 3.1 | GO:0010982 | regulation of high-density lipoprotein particle clearance(GO:0010982) regulation of cholesterol import(GO:0060620) negative regulation of cholesterol import(GO:0060621) regulation of sterol import(GO:2000909) negative regulation of sterol import(GO:2000910) |
| 0.8 | 4.6 | GO:0001878 | response to yeast(GO:0001878) |
| 0.8 | 4.6 | GO:0060011 | Sertoli cell proliferation(GO:0060011) |
| 0.8 | 6.9 | GO:0090435 | protein localization to nuclear envelope(GO:0090435) |
| 0.8 | 6.8 | GO:0042276 | error-prone translesion synthesis(GO:0042276) |
| 0.8 | 2.3 | GO:0006478 | peptidyl-tyrosine sulfation(GO:0006478) |
| 0.7 | 3.7 | GO:0006529 | asparagine biosynthetic process(GO:0006529) |
| 0.7 | 7.4 | GO:0000463 | maturation of LSU-rRNA from tricistronic rRNA transcript (SSU-rRNA, 5.8S rRNA, LSU-rRNA)(GO:0000463) |
| 0.7 | 5.1 | GO:0033600 | negative regulation of mammary gland epithelial cell proliferation(GO:0033600) |
| 0.7 | 15.1 | GO:0070911 | global genome nucleotide-excision repair(GO:0070911) |
| 0.7 | 4.1 | GO:0010643 | cell communication by chemical coupling(GO:0010643) |
| 0.7 | 3.4 | GO:1902527 | positive regulation of protein monoubiquitination(GO:1902527) |
| 0.7 | 3.4 | GO:0044111 | development involved in symbiotic interaction(GO:0044111) |
| 0.7 | 2.0 | GO:0002581 | negative regulation of antigen processing and presentation of peptide or polysaccharide antigen via MHC class II(GO:0002581) |
| 0.7 | 2.7 | GO:0061086 | regulation of mRNA export from nucleus(GO:0010793) negative regulation of histone H3-K27 methylation(GO:0061086) |
| 0.7 | 8.0 | GO:0015939 | pantothenate metabolic process(GO:0015939) |
| 0.6 | 8.4 | GO:0000212 | meiotic spindle organization(GO:0000212) |
| 0.6 | 13.5 | GO:0070262 | peptidyl-serine dephosphorylation(GO:0070262) |
| 0.6 | 17.8 | GO:0031581 | hemidesmosome assembly(GO:0031581) |
| 0.6 | 8.8 | GO:0010579 | regulation of adenylate cyclase activity involved in G-protein coupled receptor signaling pathway(GO:0010578) positive regulation of adenylate cyclase activity involved in G-protein coupled receptor signaling pathway(GO:0010579) |
| 0.6 | 54.8 | GO:0051436 | negative regulation of ubiquitin-protein ligase activity involved in mitotic cell cycle(GO:0051436) regulation of ubiquitin-protein ligase activity involved in mitotic cell cycle(GO:0051439) |
| 0.6 | 9.4 | GO:0045116 | protein neddylation(GO:0045116) |
| 0.6 | 24.3 | GO:0045737 | positive regulation of cyclin-dependent protein serine/threonine kinase activity(GO:0045737) |
| 0.6 | 4.9 | GO:1902741 | interferon-alpha secretion(GO:0072642) regulation of interferon-alpha secretion(GO:1902739) positive regulation of interferon-alpha secretion(GO:1902741) |
| 0.6 | 3.7 | GO:0035965 | cardiolipin acyl-chain remodeling(GO:0035965) |
| 0.6 | 9.1 | GO:0009312 | oligosaccharide biosynthetic process(GO:0009312) |
| 0.6 | 23.9 | GO:0043928 | nuclear-transcribed mRNA catabolic process, exonucleolytic(GO:0000291) exonucleolytic nuclear-transcribed mRNA catabolic process involved in deadenylation-dependent decay(GO:0043928) |
| 0.6 | 2.9 | GO:0042986 | positive regulation of amyloid precursor protein biosynthetic process(GO:0042986) |
| 0.6 | 4.6 | GO:0000160 | phosphorelay signal transduction system(GO:0000160) |
| 0.6 | 12.0 | GO:0008655 | pyrimidine-containing compound salvage(GO:0008655) pyrimidine nucleoside salvage(GO:0043097) |
| 0.6 | 1.1 | GO:0033594 | response to hydroxyisoflavone(GO:0033594) |
| 0.6 | 8.5 | GO:0090073 | positive regulation of protein homodimerization activity(GO:0090073) |
| 0.6 | 1.7 | GO:0001545 | primary ovarian follicle growth(GO:0001545) |
| 0.5 | 7.7 | GO:0030150 | protein import into mitochondrial matrix(GO:0030150) |
| 0.5 | 2.2 | GO:0032747 | positive regulation of interleukin-23 production(GO:0032747) |
| 0.5 | 9.2 | GO:0007172 | signal complex assembly(GO:0007172) |
| 0.5 | 5.3 | GO:0009146 | purine nucleoside triphosphate catabolic process(GO:0009146) |
| 0.5 | 15.0 | GO:0050855 | regulation of B cell receptor signaling pathway(GO:0050855) |
| 0.5 | 17.0 | GO:0046655 | folic acid metabolic process(GO:0046655) |
| 0.5 | 3.1 | GO:0030579 | ubiquitin-dependent SMAD protein catabolic process(GO:0030579) |
| 0.5 | 22.7 | GO:0034314 | Arp2/3 complex-mediated actin nucleation(GO:0034314) |
| 0.5 | 4.4 | GO:0060244 | negative regulation of cell proliferation involved in contact inhibition(GO:0060244) negative regulation of cell growth involved in cardiac muscle cell development(GO:0061052) |
| 0.5 | 3.9 | GO:0019367 | fatty acid elongation, saturated fatty acid(GO:0019367) fatty acid elongation, unsaturated fatty acid(GO:0019368) fatty acid elongation, monounsaturated fatty acid(GO:0034625) fatty acid elongation, polyunsaturated fatty acid(GO:0034626) |
| 0.5 | 10.6 | GO:0098779 | mitophagy in response to mitochondrial depolarization(GO:0098779) |
| 0.5 | 0.5 | GO:0090274 | regulation of somatostatin secretion(GO:0090273) positive regulation of somatostatin secretion(GO:0090274) |
| 0.5 | 1.4 | GO:0002752 | cell surface pattern recognition receptor signaling pathway(GO:0002752) |
| 0.5 | 3.2 | GO:1905146 | lysosomal protein catabolic process(GO:1905146) |
| 0.4 | 0.4 | GO:0045799 | positive regulation of chromatin assembly or disassembly(GO:0045799) |
| 0.4 | 7.5 | GO:0017121 | phospholipid scrambling(GO:0017121) |
| 0.4 | 5.7 | GO:1900623 | regulation of monocyte aggregation(GO:1900623) positive regulation of monocyte aggregation(GO:1900625) |
| 0.4 | 7.5 | GO:0019800 | peptide cross-linking via chondroitin 4-sulfate glycosaminoglycan(GO:0019800) |
| 0.4 | 9.7 | GO:2000675 | negative regulation of type B pancreatic cell apoptotic process(GO:2000675) |
| 0.4 | 2.8 | GO:0071386 | cellular response to corticosterone stimulus(GO:0071386) |
| 0.4 | 28.3 | GO:0006953 | acute-phase response(GO:0006953) |
| 0.4 | 1.6 | GO:1901143 | insulin catabolic process(GO:1901143) |
| 0.4 | 4.8 | GO:0070327 | thyroid hormone transport(GO:0070327) |
| 0.4 | 12.3 | GO:0042347 | negative regulation of NF-kappaB import into nucleus(GO:0042347) |
| 0.4 | 2.3 | GO:0061767 | negative regulation of lung blood pressure(GO:0061767) |
| 0.4 | 8.4 | GO:0071294 | cellular response to zinc ion(GO:0071294) |
| 0.4 | 1.5 | GO:0008628 | hormone-mediated apoptotic signaling pathway(GO:0008628) |
| 0.4 | 12.2 | GO:0048025 | negative regulation of mRNA splicing, via spliceosome(GO:0048025) |
| 0.4 | 3.0 | GO:0000480 | endonucleolytic cleavage in 5'-ETS of tricistronic rRNA transcript (SSU-rRNA, 5.8S rRNA, LSU-rRNA)(GO:0000480) |
| 0.4 | 3.2 | GO:0061302 | smooth muscle cell-matrix adhesion(GO:0061302) |
| 0.4 | 2.8 | GO:0070475 | rRNA base methylation(GO:0070475) |
| 0.3 | 5.2 | GO:0006516 | glycoprotein catabolic process(GO:0006516) |
| 0.3 | 10.7 | GO:0019372 | lipoxygenase pathway(GO:0019372) |
| 0.3 | 4.9 | GO:0035020 | regulation of Rac protein signal transduction(GO:0035020) |
| 0.3 | 3.6 | GO:0030322 | stabilization of membrane potential(GO:0030322) |
| 0.3 | 7.5 | GO:0006337 | nucleosome disassembly(GO:0006337) |
| 0.3 | 3.2 | GO:0031146 | SCF-dependent proteasomal ubiquitin-dependent protein catabolic process(GO:0031146) |
| 0.3 | 4.1 | GO:0035269 | protein O-linked mannosylation(GO:0035269) |
| 0.3 | 4.1 | GO:2000001 | regulation of DNA damage checkpoint(GO:2000001) |
| 0.3 | 6.3 | GO:0000470 | maturation of LSU-rRNA(GO:0000470) |
| 0.3 | 2.2 | GO:0008050 | negative regulation of female receptivity(GO:0007621) female courtship behavior(GO:0008050) |
| 0.3 | 14.3 | GO:2000249 | regulation of actin cytoskeleton reorganization(GO:2000249) |
| 0.3 | 1.5 | GO:0019919 | peptidyl-arginine methylation, to asymmetrical-dimethyl arginine(GO:0019919) |
| 0.3 | 12.3 | GO:0061077 | chaperone-mediated protein folding(GO:0061077) |
| 0.3 | 1.5 | GO:0007197 | adenylate cyclase-inhibiting G-protein coupled acetylcholine receptor signaling pathway(GO:0007197) |
| 0.3 | 4.6 | GO:0015937 | coenzyme A biosynthetic process(GO:0015937) |
| 0.3 | 2.3 | GO:1902412 | regulation of mitotic cytokinesis(GO:1902412) |
| 0.3 | 2.5 | GO:0090161 | Golgi ribbon formation(GO:0090161) |
| 0.3 | 4.4 | GO:0008228 | opsonization(GO:0008228) |
| 0.3 | 1.4 | GO:0050915 | sensory perception of sour taste(GO:0050915) |
| 0.3 | 3.2 | GO:0060340 | positive regulation of type I interferon-mediated signaling pathway(GO:0060340) |
| 0.3 | 4.8 | GO:0072321 | chaperone-mediated protein transport(GO:0072321) |
| 0.3 | 12.1 | GO:0035329 | hippo signaling(GO:0035329) |
| 0.3 | 7.1 | GO:0007216 | G-protein coupled glutamate receptor signaling pathway(GO:0007216) |
| 0.3 | 12.8 | GO:0045839 | negative regulation of mitotic nuclear division(GO:0045839) |
| 0.3 | 11.4 | GO:0006739 | NADP metabolic process(GO:0006739) |
| 0.2 | 0.7 | GO:0072365 | regulation of cellular ketone metabolic process by negative regulation of transcription from RNA polymerase II promoter(GO:0072365) |
| 0.2 | 2.5 | GO:1903715 | regulation of aerobic respiration(GO:1903715) |
| 0.2 | 1.2 | GO:0044860 | protein localization to plasma membrane raft(GO:0044860) |
| 0.2 | 3.7 | GO:0006703 | estrogen biosynthetic process(GO:0006703) |
| 0.2 | 3.7 | GO:0040032 | post-embryonic body morphogenesis(GO:0040032) |
| 0.2 | 2.1 | GO:1903361 | protein localization to basolateral plasma membrane(GO:1903361) |
| 0.2 | 21.5 | GO:0031398 | positive regulation of protein ubiquitination(GO:0031398) |
| 0.2 | 0.4 | GO:1904479 | negative regulation of intestinal absorption(GO:1904479) |
| 0.2 | 2.2 | GO:2000311 | regulation of alpha-amino-3-hydroxy-5-methyl-4-isoxazole propionate selective glutamate receptor activity(GO:2000311) |
| 0.2 | 2.0 | GO:1903800 | positive regulation of production of miRNAs involved in gene silencing by miRNA(GO:1903800) |
| 0.2 | 1.3 | GO:0032445 | fructose transport(GO:0015755) fructose import(GO:0032445) carbohydrate import into cell(GO:0097319) carbohydrate import across plasma membrane(GO:0098704) fructose import across plasma membrane(GO:1990539) |
| 0.2 | 12.6 | GO:0006120 | mitochondrial electron transport, NADH to ubiquinone(GO:0006120) |
| 0.2 | 1.7 | GO:2000304 | positive regulation of sphingolipid biosynthetic process(GO:0090154) positive regulation of ceramide biosynthetic process(GO:2000304) |
| 0.2 | 3.2 | GO:0034244 | negative regulation of transcription elongation from RNA polymerase II promoter(GO:0034244) |
| 0.2 | 1.7 | GO:2000786 | positive regulation of autophagosome assembly(GO:2000786) |
| 0.2 | 2.7 | GO:0071803 | positive regulation of podosome assembly(GO:0071803) |
| 0.2 | 2.0 | GO:0015781 | pyrimidine nucleotide-sugar transport(GO:0015781) |
| 0.2 | 0.6 | GO:0000103 | sulfate assimilation(GO:0000103) |
| 0.2 | 0.8 | GO:0000466 | maturation of 5.8S rRNA from tricistronic rRNA transcript (SSU-rRNA, 5.8S rRNA, LSU-rRNA)(GO:0000466) |
| 0.2 | 9.0 | GO:0006458 | 'de novo' protein folding(GO:0006458) |
| 0.2 | 5.2 | GO:1902547 | regulation of vascular endothelial growth factor signaling pathway(GO:1900746) regulation of cellular response to vascular endothelial growth factor stimulus(GO:1902547) |
| 0.2 | 4.2 | GO:0000028 | ribosomal small subunit assembly(GO:0000028) |
| 0.2 | 9.1 | GO:0043486 | histone exchange(GO:0043486) |
| 0.2 | 0.9 | GO:0040031 | snRNA modification(GO:0040031) |
| 0.2 | 0.6 | GO:0044805 | late nucleophagy(GO:0044805) negative regulation of mitochondrial DNA replication(GO:0090298) negative regulation of mitochondrial DNA metabolic process(GO:1901859) |
| 0.2 | 0.7 | GO:1900186 | negative regulation of clathrin-mediated endocytosis(GO:1900186) |
| 0.2 | 4.2 | GO:0090190 | positive regulation of branching involved in ureteric bud morphogenesis(GO:0090190) |
| 0.2 | 21.0 | GO:0035335 | peptidyl-tyrosine dephosphorylation(GO:0035335) |
| 0.2 | 4.8 | GO:0002089 | lens morphogenesis in camera-type eye(GO:0002089) |
| 0.2 | 8.3 | GO:0010470 | regulation of gastrulation(GO:0010470) |
| 0.2 | 4.7 | GO:0030252 | growth hormone secretion(GO:0030252) |
| 0.2 | 2.8 | GO:0006012 | galactose metabolic process(GO:0006012) |
| 0.2 | 15.4 | GO:0036498 | IRE1-mediated unfolded protein response(GO:0036498) |
| 0.2 | 2.8 | GO:0019852 | L-ascorbic acid metabolic process(GO:0019852) |
| 0.2 | 2.6 | GO:0007080 | mitotic metaphase plate congression(GO:0007080) |
| 0.2 | 8.1 | GO:0006383 | transcription from RNA polymerase III promoter(GO:0006383) |
| 0.2 | 1.5 | GO:0031507 | heterochromatin assembly(GO:0031507) |
| 0.2 | 0.5 | GO:0051970 | negative regulation of transmission of nerve impulse(GO:0051970) |
| 0.1 | 8.5 | GO:0006334 | nucleosome assembly(GO:0006334) |
| 0.1 | 0.6 | GO:0010989 | negative regulation of low-density lipoprotein particle clearance(GO:0010989) |
| 0.1 | 10.9 | GO:0035722 | interleukin-12-mediated signaling pathway(GO:0035722) response to interleukin-12(GO:0070671) cellular response to interleukin-12(GO:0071349) |
| 0.1 | 6.8 | GO:0061001 | regulation of dendritic spine morphogenesis(GO:0061001) |
| 0.1 | 0.6 | GO:0051697 | protein delipidation(GO:0051697) |
| 0.1 | 1.7 | GO:0034114 | regulation of heterotypic cell-cell adhesion(GO:0034114) |
| 0.1 | 3.4 | GO:0001937 | negative regulation of endothelial cell proliferation(GO:0001937) |
| 0.1 | 1.5 | GO:0043569 | negative regulation of insulin-like growth factor receptor signaling pathway(GO:0043569) |
| 0.1 | 8.8 | GO:0000045 | autophagosome assembly(GO:0000045) |
| 0.1 | 1.2 | GO:0046940 | nucleoside monophosphate phosphorylation(GO:0046940) |
| 0.1 | 0.9 | GO:0019375 | galactosylceramide biosynthetic process(GO:0006682) galactolipid biosynthetic process(GO:0019375) |
| 0.1 | 1.3 | GO:0038203 | TORC2 signaling(GO:0038203) |
| 0.1 | 1.9 | GO:0048172 | regulation of short-term neuronal synaptic plasticity(GO:0048172) |
| 0.1 | 5.9 | GO:0001824 | blastocyst development(GO:0001824) |
| 0.1 | 1.1 | GO:0034384 | high-density lipoprotein particle clearance(GO:0034384) |
| 0.1 | 8.2 | GO:0000380 | alternative mRNA splicing, via spliceosome(GO:0000380) |
| 0.1 | 0.5 | GO:2001268 | negative regulation of cysteine-type endopeptidase activity involved in apoptotic signaling pathway(GO:2001268) |
| 0.1 | 0.4 | GO:0010710 | regulation of collagen catabolic process(GO:0010710) |
| 0.1 | 0.6 | GO:1904628 | response to phorbol 13-acetate 12-myristate(GO:1904627) cellular response to phorbol 13-acetate 12-myristate(GO:1904628) |
| 0.1 | 0.6 | GO:0061042 | vascular wound healing(GO:0061042) |
| 0.1 | 3.7 | GO:0030490 | maturation of SSU-rRNA(GO:0030490) |
| 0.1 | 20.9 | GO:0007051 | spindle organization(GO:0007051) |
| 0.1 | 6.1 | GO:0006687 | glycosphingolipid metabolic process(GO:0006687) |
| 0.1 | 0.6 | GO:0015808 | L-alanine transport(GO:0015808) |
| 0.1 | 3.3 | GO:0045746 | negative regulation of Notch signaling pathway(GO:0045746) |
| 0.1 | 11.4 | GO:0006338 | chromatin remodeling(GO:0006338) |
| 0.1 | 3.9 | GO:0031440 | regulation of mRNA 3'-end processing(GO:0031440) |
| 0.1 | 6.0 | GO:0007098 | centrosome cycle(GO:0007098) |
| 0.1 | 1.0 | GO:2001241 | positive regulation of extrinsic apoptotic signaling pathway in absence of ligand(GO:2001241) |
| 0.1 | 2.6 | GO:0031648 | protein destabilization(GO:0031648) |
| 0.1 | 2.0 | GO:0000154 | rRNA modification(GO:0000154) |
| 0.1 | 1.6 | GO:0006853 | carnitine shuttle(GO:0006853) |
| 0.1 | 2.9 | GO:0033198 | response to ATP(GO:0033198) |
| 0.1 | 1.1 | GO:0043567 | regulation of insulin-like growth factor receptor signaling pathway(GO:0043567) |
| 0.1 | 1.7 | GO:0046337 | phosphatidylethanolamine metabolic process(GO:0046337) |
| 0.1 | 0.9 | GO:0070307 | lens fiber cell development(GO:0070307) |
| 0.1 | 3.6 | GO:0000266 | mitochondrial fission(GO:0000266) |
| 0.1 | 3.3 | GO:0006270 | DNA replication initiation(GO:0006270) |
| 0.1 | 0.6 | GO:0007379 | segment specification(GO:0007379) |
| 0.1 | 3.9 | GO:0032088 | negative regulation of NF-kappaB transcription factor activity(GO:0032088) |
| 0.1 | 4.8 | GO:0001895 | retina homeostasis(GO:0001895) |
| 0.1 | 0.1 | GO:1903233 | regulation of calcium ion-dependent exocytosis of neurotransmitter(GO:1903233) |
| 0.1 | 1.3 | GO:0060334 | regulation of interferon-gamma-mediated signaling pathway(GO:0060334) |
| 0.1 | 6.3 | GO:0002181 | cytoplasmic translation(GO:0002181) |
| 0.1 | 1.7 | GO:0009235 | cobalamin metabolic process(GO:0009235) |
| 0.1 | 0.9 | GO:0007130 | synaptonemal complex assembly(GO:0007130) |
| 0.1 | 0.3 | GO:0097089 | methyl-branched fatty acid metabolic process(GO:0097089) |
| 0.1 | 0.4 | GO:0015760 | hexose phosphate transport(GO:0015712) glucose-6-phosphate transport(GO:0015760) |
| 0.1 | 1.4 | GO:0045747 | positive regulation of Notch signaling pathway(GO:0045747) |
| 0.1 | 0.4 | GO:0007256 | activation of JNKK activity(GO:0007256) |
| 0.1 | 2.6 | GO:1903959 | regulation of anion transmembrane transport(GO:1903959) |
| 0.1 | 0.9 | GO:0036149 | phosphatidylinositol acyl-chain remodeling(GO:0036149) |
| 0.1 | 1.2 | GO:1902894 | negative regulation of pri-miRNA transcription from RNA polymerase II promoter(GO:1902894) |
| 0.1 | 0.2 | GO:0010757 | negative regulation of plasminogen activation(GO:0010757) |
| 0.1 | 0.7 | GO:0071243 | cellular response to arsenic-containing substance(GO:0071243) |
| 0.1 | 3.6 | GO:0016575 | histone deacetylation(GO:0016575) |
| 0.1 | 0.5 | GO:0097490 | sympathetic neuron projection extension(GO:0097490) sympathetic neuron projection guidance(GO:0097491) |
| 0.1 | 0.6 | GO:0021520 | spinal cord motor neuron cell fate specification(GO:0021520) |
| 0.1 | 3.4 | GO:0006635 | fatty acid beta-oxidation(GO:0006635) |
| 0.0 | 0.6 | GO:1904714 | regulation of chaperone-mediated autophagy(GO:1904714) |
| 0.0 | 1.3 | GO:0090023 | positive regulation of neutrophil chemotaxis(GO:0090023) |
| 0.0 | 12.9 | GO:0000377 | RNA splicing, via transesterification reactions with bulged adenosine as nucleophile(GO:0000377) mRNA splicing, via spliceosome(GO:0000398) |
| 0.0 | 0.8 | GO:0043537 | negative regulation of blood vessel endothelial cell migration(GO:0043537) |
| 0.0 | 0.2 | GO:0040030 | regulation of molecular function, epigenetic(GO:0040030) |
| 0.0 | 0.2 | GO:0071801 | regulation of podosome assembly(GO:0071801) |
| 0.0 | 0.6 | GO:2000172 | regulation of branching morphogenesis of a nerve(GO:2000172) |
| 0.0 | 2.4 | GO:0045669 | positive regulation of osteoblast differentiation(GO:0045669) |
| 0.0 | 0.6 | GO:0018214 | peptidyl-glutamic acid carboxylation(GO:0017187) protein carboxylation(GO:0018214) |
| 0.0 | 2.7 | GO:1902653 | cholesterol biosynthetic process(GO:0006695) secondary alcohol biosynthetic process(GO:1902653) |
| 0.0 | 7.1 | GO:0016042 | lipid catabolic process(GO:0016042) |
| 0.0 | 0.5 | GO:0097242 | beta-amyloid clearance(GO:0097242) |
| 0.0 | 3.1 | GO:0042787 | protein ubiquitination involved in ubiquitin-dependent protein catabolic process(GO:0042787) |
| 0.0 | 1.4 | GO:0006611 | protein export from nucleus(GO:0006611) |
| 0.0 | 0.1 | GO:0090472 | viral protein processing(GO:0019082) regulation of nerve growth factor production(GO:0032903) negative regulation of nerve growth factor production(GO:0032904) dibasic protein processing(GO:0090472) |
| 0.0 | 0.5 | GO:0051639 | actin filament network formation(GO:0051639) |
| 0.0 | 0.3 | GO:0032926 | negative regulation of activin receptor signaling pathway(GO:0032926) |
| 0.0 | 2.4 | GO:0033209 | tumor necrosis factor-mediated signaling pathway(GO:0033209) |
| 0.0 | 1.1 | GO:0015949 | nucleobase-containing small molecule interconversion(GO:0015949) |
| 0.0 | 1.7 | GO:0030049 | muscle filament sliding(GO:0030049) actin-myosin filament sliding(GO:0033275) |
| 0.0 | 2.5 | GO:1901796 | regulation of signal transduction by p53 class mediator(GO:1901796) |
| 0.0 | 1.8 | GO:0046330 | positive regulation of JNK cascade(GO:0046330) |
| 0.0 | 0.0 | GO:0022605 | oogenesis stage(GO:0022605) |
| 0.0 | 0.4 | GO:0016254 | preassembly of GPI anchor in ER membrane(GO:0016254) |
| 0.0 | 1.2 | GO:0036092 | phosphatidylinositol-3-phosphate biosynthetic process(GO:0036092) |
| 0.0 | 1.3 | GO:0048278 | vesicle docking(GO:0048278) |
| 0.0 | 0.1 | GO:0035548 | gamma-delta T cell activation involved in immune response(GO:0002290) negative regulation of cytokine secretion involved in immune response(GO:0002740) interferon-beta secretion(GO:0035546) regulation of interferon-beta secretion(GO:0035547) negative regulation of interferon-beta secretion(GO:0035548) negative regulation of interleukin-10 secretion(GO:2001180) negative regulation of CD8-positive, alpha-beta T cell activation(GO:2001186) regulation of gamma-delta T cell activation involved in immune response(GO:2001191) positive regulation of gamma-delta T cell activation involved in immune response(GO:2001193) negative regulation of transforming growth factor-beta secretion(GO:2001202) |
| 0.0 | 0.2 | GO:0033299 | secretion of lysosomal enzymes(GO:0033299) |
| 0.0 | 0.3 | GO:0007597 | blood coagulation, intrinsic pathway(GO:0007597) |
| 0.0 | 0.7 | GO:0008306 | associative learning(GO:0008306) |
| 0.0 | 0.2 | GO:0097264 | self proteolysis(GO:0097264) |
Gene overrepresentation in cellular component category:
| Log-likelihood per target | Total log-likelihood | Term | Description |
|---|---|---|---|
| 8.3 | 33.3 | GO:0008537 | proteasome activator complex(GO:0008537) |
| 4.2 | 12.6 | GO:1990913 | sperm head plasma membrane(GO:1990913) ooplasm(GO:1990917) |
| 4.0 | 16.2 | GO:0071942 | XPC complex(GO:0071942) |
| 3.7 | 11.1 | GO:0031262 | Ndc80 complex(GO:0031262) |
| 3.3 | 13.2 | GO:0002189 | ribose phosphate diphosphokinase complex(GO:0002189) |
| 3.2 | 12.9 | GO:0005850 | eukaryotic translation initiation factor 2 complex(GO:0005850) |
| 2.9 | 23.3 | GO:0098559 | cytoplasmic side of early endosome membrane(GO:0098559) |
| 2.8 | 45.3 | GO:0005736 | DNA-directed RNA polymerase I complex(GO:0005736) |
| 2.7 | 43.6 | GO:0044233 | ER-mitochondrion membrane contact site(GO:0044233) |
| 2.6 | 20.9 | GO:0061700 | GATOR2 complex(GO:0061700) |
| 2.4 | 22.0 | GO:0000347 | THO complex(GO:0000347) THO complex part of transcription export complex(GO:0000445) |
| 2.4 | 24.3 | GO:0097255 | R2TP complex(GO:0097255) |
| 2.1 | 6.2 | GO:0017102 | methionyl glutamyl tRNA synthetase complex(GO:0017102) |
| 2.0 | 23.5 | GO:0045254 | pyruvate dehydrogenase complex(GO:0045254) |
| 1.9 | 7.7 | GO:0001405 | presequence translocase-associated import motor(GO:0001405) |
| 1.8 | 47.1 | GO:0005868 | cytoplasmic dynein complex(GO:0005868) |
| 1.7 | 22.6 | GO:0008385 | IkappaB kinase complex(GO:0008385) |
| 1.7 | 10.3 | GO:0031390 | Ctf18 RFC-like complex(GO:0031390) |
| 1.6 | 19.7 | GO:0030015 | CCR4-NOT core complex(GO:0030015) |
| 1.6 | 17.4 | GO:0042587 | glycogen granule(GO:0042587) |
| 1.5 | 16.2 | GO:0097136 | Bcl-2 family protein complex(GO:0097136) |
| 1.4 | 12.6 | GO:0042382 | paraspeckles(GO:0042382) |
| 1.4 | 6.8 | GO:0008622 | epsilon DNA polymerase complex(GO:0008622) |
| 1.3 | 10.4 | GO:0005827 | polar microtubule(GO:0005827) |
| 1.3 | 20.8 | GO:0034709 | methylosome(GO:0034709) |
| 1.2 | 7.4 | GO:0070545 | PeBoW complex(GO:0070545) |
| 1.2 | 12.2 | GO:0061574 | ASAP complex(GO:0061574) |
| 1.2 | 18.8 | GO:0016600 | flotillin complex(GO:0016600) |
| 1.2 | 3.5 | GO:0045323 | interleukin-1 receptor complex(GO:0045323) |
| 1.2 | 4.6 | GO:0071817 | MMXD complex(GO:0071817) |
| 1.1 | 22.7 | GO:0005885 | Arp2/3 protein complex(GO:0005885) |
| 1.1 | 5.6 | GO:0044232 | organelle membrane contact site(GO:0044232) |
| 1.1 | 10.1 | GO:0090543 | Flemming body(GO:0090543) |
| 1.1 | 3.3 | GO:0000939 | condensed chromosome inner kinetochore(GO:0000939) |
| 1.1 | 3.2 | GO:0097637 | intrinsic component of autophagosome membrane(GO:0097636) integral component of autophagosome membrane(GO:0097637) |
| 1.1 | 27.5 | GO:0002080 | acrosomal membrane(GO:0002080) |
| 1.1 | 3.2 | GO:0048237 | rough endoplasmic reticulum lumen(GO:0048237) |
| 1.0 | 5.1 | GO:0045257 | mitochondrial respiratory chain complex II, succinate dehydrogenase complex (ubiquinone)(GO:0005749) succinate dehydrogenase complex (ubiquinone)(GO:0045257) respiratory chain complex II(GO:0045273) succinate dehydrogenase complex(GO:0045281) fumarate reductase complex(GO:0045283) |
| 1.0 | 11.6 | GO:0071203 | F-actin capping protein complex(GO:0008290) WASH complex(GO:0071203) |
| 0.9 | 11.4 | GO:0031618 | nuclear pericentric heterochromatin(GO:0031618) |
| 0.9 | 6.6 | GO:0005610 | laminin-5 complex(GO:0005610) |
| 0.9 | 14.6 | GO:0008540 | proteasome regulatory particle, base subcomplex(GO:0008540) |
| 0.9 | 36.2 | GO:0005640 | nuclear outer membrane(GO:0005640) |
| 0.9 | 9.4 | GO:0005666 | DNA-directed RNA polymerase III complex(GO:0005666) |
| 0.8 | 5.7 | GO:0016272 | prefoldin complex(GO:0016272) |
| 0.8 | 29.6 | GO:0005790 | smooth endoplasmic reticulum(GO:0005790) |
| 0.8 | 7.0 | GO:0000439 | core TFIIH complex(GO:0000439) |
| 0.7 | 2.9 | GO:0034669 | integrin alpha4-beta7 complex(GO:0034669) |
| 0.7 | 9.3 | GO:0005641 | nuclear envelope lumen(GO:0005641) |
| 0.7 | 18.6 | GO:0031528 | microvillus membrane(GO:0031528) |
| 0.7 | 37.3 | GO:0019005 | SCF ubiquitin ligase complex(GO:0019005) |
| 0.6 | 1.9 | GO:0030689 | Noc complex(GO:0030689) |
| 0.6 | 8.6 | GO:0005686 | U2 snRNP(GO:0005686) |
| 0.6 | 3.6 | GO:0032279 | asymmetric synapse(GO:0032279) |
| 0.6 | 9.1 | GO:0035631 | CD40 receptor complex(GO:0035631) |
| 0.6 | 9.0 | GO:0097470 | ribbon synapse(GO:0097470) |
| 0.6 | 7.9 | GO:0005862 | muscle thin filament tropomyosin(GO:0005862) |
| 0.6 | 16.2 | GO:0005680 | anaphase-promoting complex(GO:0005680) |
| 0.6 | 49.5 | GO:1904724 | tertiary granule lumen(GO:1904724) |
| 0.5 | 4.8 | GO:0042719 | mitochondrial intermembrane space protein transporter complex(GO:0042719) |
| 0.5 | 21.4 | GO:0046658 | anchored component of plasma membrane(GO:0046658) |
| 0.5 | 12.2 | GO:0030992 | intraciliary transport particle B(GO:0030992) |
| 0.5 | 6.9 | GO:0044613 | nuclear pore central transport channel(GO:0044613) |
| 0.5 | 3.1 | GO:0034363 | intermediate-density lipoprotein particle(GO:0034363) |
| 0.5 | 5.7 | GO:0035692 | macrophage migration inhibitory factor receptor complex(GO:0035692) |
| 0.5 | 5.5 | GO:0030870 | Mre11 complex(GO:0030870) |
| 0.5 | 5.9 | GO:0008250 | oligosaccharyltransferase complex(GO:0008250) |
| 0.5 | 11.2 | GO:0030056 | hemidesmosome(GO:0030056) |
| 0.5 | 3.4 | GO:0044352 | pinosome(GO:0044352) macropinosome(GO:0044354) |
| 0.5 | 5.8 | GO:0000815 | ESCRT III complex(GO:0000815) |
| 0.5 | 5.2 | GO:0005638 | lamin filament(GO:0005638) |
| 0.5 | 15.4 | GO:0016514 | SWI/SNF complex(GO:0016514) |
| 0.5 | 3.2 | GO:0032021 | NELF complex(GO:0032021) |
| 0.4 | 5.3 | GO:0019773 | proteasome core complex, alpha-subunit complex(GO:0019773) |
| 0.4 | 4.4 | GO:0000506 | glycosylphosphatidylinositol-N-acetylglucosaminyltransferase (GPI-GnT) complex(GO:0000506) |
| 0.4 | 16.1 | GO:0000791 | euchromatin(GO:0000791) |
| 0.4 | 5.0 | GO:0016602 | CCAAT-binding factor complex(GO:0016602) |
| 0.4 | 4.8 | GO:0097487 | multivesicular body, internal vesicle(GO:0097487) |
| 0.4 | 22.9 | GO:0030964 | mitochondrial respiratory chain complex I(GO:0005747) NADH dehydrogenase complex(GO:0030964) respiratory chain complex I(GO:0045271) |
| 0.4 | 62.1 | GO:1904813 | ficolin-1-rich granule(GO:0101002) ficolin-1-rich granule lumen(GO:1904813) |
| 0.3 | 17.8 | GO:0031463 | Cul3-RING ubiquitin ligase complex(GO:0031463) |
| 0.3 | 12.8 | GO:0042629 | mast cell granule(GO:0042629) |
| 0.3 | 6.2 | GO:0005662 | DNA replication factor A complex(GO:0005662) |
| 0.3 | 5.4 | GO:0005665 | DNA-directed RNA polymerase II, core complex(GO:0005665) |
| 0.3 | 13.2 | GO:0000159 | protein phosphatase type 2A complex(GO:0000159) |
| 0.3 | 2.0 | GO:0070761 | pre-snoRNP complex(GO:0070761) |
| 0.3 | 44.9 | GO:0042470 | melanosome(GO:0042470) pigment granule(GO:0048770) |
| 0.3 | 1.6 | GO:0031597 | cytosolic proteasome complex(GO:0031597) |
| 0.3 | 11.7 | GO:0008180 | COP9 signalosome(GO:0008180) |
| 0.3 | 8.8 | GO:0000407 | pre-autophagosomal structure(GO:0000407) |
| 0.3 | 0.9 | GO:0097208 | alveolar lamellar body(GO:0097208) |
| 0.3 | 1.2 | GO:0030895 | apolipoprotein B mRNA editing enzyme complex(GO:0030895) |
| 0.3 | 7.0 | GO:0070971 | endoplasmic reticulum exit site(GO:0070971) |
| 0.3 | 9.0 | GO:0051233 | spindle midzone(GO:0051233) |
| 0.3 | 0.8 | GO:0042555 | MCM complex(GO:0042555) |
| 0.3 | 2.3 | GO:0071144 | SMAD2-SMAD3 protein complex(GO:0071144) |
| 0.3 | 1.5 | GO:0031466 | Cul5-RING ubiquitin ligase complex(GO:0031466) |
| 0.2 | 7.5 | GO:0032420 | stereocilium(GO:0032420) |
| 0.2 | 4.1 | GO:0035861 | site of double-strand break(GO:0035861) |
| 0.2 | 11.6 | GO:0031519 | PcG protein complex(GO:0031519) |
| 0.2 | 9.5 | GO:0042645 | nucleoid(GO:0009295) mitochondrial nucleoid(GO:0042645) |
| 0.2 | 20.9 | GO:0042641 | actomyosin(GO:0042641) |
| 0.2 | 4.4 | GO:0071437 | invadopodium(GO:0071437) |
| 0.2 | 2.8 | GO:0032591 | dendritic spine membrane(GO:0032591) |
| 0.2 | 11.0 | GO:0005776 | autophagosome(GO:0005776) |
| 0.2 | 2.2 | GO:0071141 | SMAD protein complex(GO:0071141) |
| 0.2 | 19.6 | GO:0016605 | PML body(GO:0016605) |
| 0.2 | 3.3 | GO:0030904 | retromer complex(GO:0030904) |
| 0.2 | 0.5 | GO:0034657 | GID complex(GO:0034657) |
| 0.2 | 5.0 | GO:0030867 | rough endoplasmic reticulum membrane(GO:0030867) |
| 0.1 | 6.5 | GO:0005902 | microvillus(GO:0005902) |
| 0.1 | 14.9 | GO:0022625 | cytosolic large ribosomal subunit(GO:0022625) |
| 0.1 | 1.5 | GO:0005677 | chromatin silencing complex(GO:0005677) |
| 0.1 | 5.2 | GO:0016235 | aggresome(GO:0016235) |
| 0.1 | 2.1 | GO:0005682 | U5 snRNP(GO:0005682) |
| 0.1 | 5.6 | GO:0035577 | azurophil granule membrane(GO:0035577) |
| 0.1 | 6.7 | GO:0045178 | basal part of cell(GO:0045178) |
| 0.1 | 8.7 | GO:0031594 | neuromuscular junction(GO:0031594) |
| 0.1 | 9.0 | GO:0010494 | cytoplasmic stress granule(GO:0010494) |
| 0.1 | 3.7 | GO:0032040 | small-subunit processome(GO:0032040) |
| 0.1 | 1.6 | GO:0031588 | nucleotide-activated protein kinase complex(GO:0031588) |
| 0.1 | 2.1 | GO:0097025 | MPP7-DLG1-LIN7 complex(GO:0097025) |
| 0.1 | 8.7 | GO:0071013 | catalytic step 2 spliceosome(GO:0071013) |
| 0.1 | 0.5 | GO:0034688 | integrin alphaM-beta2 complex(GO:0034688) |
| 0.1 | 11.1 | GO:0000922 | spindle pole(GO:0000922) |
| 0.1 | 38.2 | GO:0005759 | mitochondrial matrix(GO:0005759) |
| 0.1 | 1.3 | GO:0038201 | TORC2 complex(GO:0031932) TOR complex(GO:0038201) |
| 0.1 | 7.6 | GO:0000784 | nuclear chromosome, telomeric region(GO:0000784) |
| 0.1 | 0.7 | GO:0044327 | dendritic spine head(GO:0044327) |
| 0.1 | 30.3 | GO:0016607 | nuclear speck(GO:0016607) |
| 0.1 | 4.7 | GO:0000118 | histone deacetylase complex(GO:0000118) |
| 0.1 | 7.3 | GO:0005913 | cell-cell adherens junction(GO:0005913) |
| 0.1 | 0.7 | GO:0033588 | Elongator holoenzyme complex(GO:0033588) |
| 0.1 | 2.6 | GO:0000502 | proteasome complex(GO:0000502) |
| 0.0 | 5.7 | GO:0005840 | ribosome(GO:0005840) |
| 0.0 | 2.6 | GO:0000777 | condensed chromosome kinetochore(GO:0000777) |
| 0.0 | 3.1 | GO:0005643 | nuclear pore(GO:0005643) |
| 0.0 | 0.4 | GO:0043190 | ATP-binding cassette (ABC) transporter complex(GO:0043190) |
| 0.0 | 0.5 | GO:0002116 | semaphorin receptor complex(GO:0002116) |
| 0.0 | 1.4 | GO:0030173 | integral component of Golgi membrane(GO:0030173) |
| 0.0 | 0.3 | GO:0070449 | elongin complex(GO:0070449) |
| 0.0 | 0.5 | GO:0005833 | hemoglobin complex(GO:0005833) |
| 0.0 | 1.2 | GO:0005859 | muscle myosin complex(GO:0005859) |
| 0.0 | 0.2 | GO:1990031 | pinceau fiber(GO:1990031) |
| 0.0 | 0.1 | GO:0035841 | new growing cell tip(GO:0035841) |
| 0.0 | 1.3 | GO:0031201 | SNARE complex(GO:0031201) |
| 0.0 | 0.9 | GO:0000795 | synaptonemal complex(GO:0000795) |
| 0.0 | 3.4 | GO:0008021 | synaptic vesicle(GO:0008021) |
| 0.0 | 2.2 | GO:0031225 | anchored component of membrane(GO:0031225) |
| 0.0 | 1.0 | GO:0032592 | integral component of mitochondrial membrane(GO:0032592) |
| 0.0 | 0.3 | GO:0005779 | integral component of peroxisomal membrane(GO:0005779) intrinsic component of peroxisomal membrane(GO:0031231) |
| 0.0 | 0.6 | GO:0045171 | intercellular bridge(GO:0045171) |
| 0.0 | 0.4 | GO:0097610 | cell division site(GO:0032153) cleavage furrow(GO:0032154) cell division site part(GO:0032155) cell surface furrow(GO:0097610) |
| 0.0 | 0.1 | GO:0005577 | fibrinogen complex(GO:0005577) |
Gene overrepresentation in molecular function category:
| Log-likelihood per target | Total log-likelihood | Term | Description |
|---|---|---|---|
| 11.8 | 58.9 | GO:0047179 | platelet-activating factor acetyltransferase activity(GO:0047179) |
| 10.9 | 43.6 | GO:0047676 | arachidonate-CoA ligase activity(GO:0047676) |
| 8.0 | 32.0 | GO:0004001 | adenosine kinase activity(GO:0004001) |
| 7.1 | 35.4 | GO:0047844 | deoxycytidine deaminase activity(GO:0047844) |
| 5.9 | 35.3 | GO:0061575 | cyclin-dependent protein serine/threonine kinase activator activity(GO:0061575) |
| 5.8 | 23.4 | GO:0003938 | IMP dehydrogenase activity(GO:0003938) |
| 5.6 | 22.5 | GO:0102007 | lactonohydrolase activity(GO:0046573) acyl-L-homoserine-lactone lactonohydrolase activity(GO:0102007) |
| 5.6 | 16.7 | GO:0004766 | spermidine synthase activity(GO:0004766) |
| 5.1 | 40.8 | GO:0008379 | thioredoxin peroxidase activity(GO:0008379) |
| 4.8 | 33.3 | GO:0061133 | endopeptidase activator activity(GO:0061133) |
| 4.6 | 18.3 | GO:0031177 | phosphopantetheine binding(GO:0031177) |
| 4.2 | 12.6 | GO:0002135 | CTP binding(GO:0002135) |
| 3.8 | 15.3 | GO:0004488 | methenyltetrahydrofolate cyclohydrolase activity(GO:0004477) methylenetetrahydrofolate dehydrogenase (NAD+) activity(GO:0004487) methylenetetrahydrofolate dehydrogenase (NADP+) activity(GO:0004488) |
| 3.7 | 26.2 | GO:0050291 | sphingosine N-acyltransferase activity(GO:0050291) |
| 3.5 | 20.8 | GO:0044020 | histone methyltransferase activity (H4-R3 specific)(GO:0044020) |
| 3.3 | 13.1 | GO:0004739 | pyruvate dehydrogenase (acetyl-transferring) activity(GO:0004739) |
| 3.0 | 8.9 | GO:0004165 | dodecenoyl-CoA delta-isomerase activity(GO:0004165) |
| 2.9 | 17.7 | GO:0016802 | adenosylhomocysteinase activity(GO:0004013) trialkylsulfonium hydrolase activity(GO:0016802) |
| 2.8 | 45.3 | GO:0001054 | RNA polymerase I activity(GO:0001054) |
| 2.6 | 10.4 | GO:0034604 | pyruvate dehydrogenase activity(GO:0004738) pyruvate dehydrogenase [NAD(P)+] activity(GO:0034603) pyruvate dehydrogenase (NAD+) activity(GO:0034604) |
| 2.5 | 7.6 | GO:0015181 | arginine transmembrane transporter activity(GO:0015181) |
| 2.5 | 7.4 | GO:0009032 | thymidine phosphorylase activity(GO:0009032) pyrimidine-nucleoside phosphorylase activity(GO:0016154) |
| 2.4 | 26.6 | GO:0004332 | fructose-bisphosphate aldolase activity(GO:0004332) |
| 2.3 | 13.9 | GO:0034186 | apolipoprotein A-I binding(GO:0034186) |
| 2.2 | 47.1 | GO:0045505 | dynein intermediate chain binding(GO:0045505) |
| 2.2 | 15.6 | GO:0004457 | lactate dehydrogenase activity(GO:0004457) L-lactate dehydrogenase activity(GO:0004459) |
| 2.2 | 13.3 | GO:1990226 | histone methyltransferase binding(GO:1990226) |
| 2.2 | 13.2 | GO:0004749 | ribose phosphate diphosphokinase activity(GO:0004749) |
| 2.1 | 10.4 | GO:0008469 | histone-arginine N-methyltransferase activity(GO:0008469) protein-arginine omega-N asymmetric methyltransferase activity(GO:0035242) |
| 2.0 | 28.1 | GO:0031386 | protein tag(GO:0031386) |
| 2.0 | 8.0 | GO:0004335 | galactokinase activity(GO:0004335) |
| 1.9 | 11.3 | GO:0003960 | NADPH:quinone reductase activity(GO:0003960) |
| 1.8 | 11.1 | GO:0060961 | phospholipase D inhibitor activity(GO:0060961) |
| 1.8 | 3.7 | GO:0070404 | NADH binding(GO:0070404) |
| 1.8 | 9.1 | GO:0042296 | ISG15 transferase activity(GO:0042296) |
| 1.8 | 10.7 | GO:0008309 | double-stranded DNA exodeoxyribonuclease activity(GO:0008309) 5'-flap endonuclease activity(GO:0017108) |
| 1.8 | 42.5 | GO:0070628 | proteasome binding(GO:0070628) |
| 1.8 | 5.3 | GO:0035529 | NADH pyrophosphatase activity(GO:0035529) |
| 1.7 | 10.5 | GO:0002161 | aminoacyl-tRNA editing activity(GO:0002161) |
| 1.7 | 12.1 | GO:0050815 | phosphoserine binding(GO:0050815) |
| 1.7 | 5.0 | GO:0004418 | hydroxymethylbilane synthase activity(GO:0004418) |
| 1.7 | 14.9 | GO:0036042 | long-chain fatty acyl-CoA binding(GO:0036042) |
| 1.6 | 4.9 | GO:0008384 | IkappaB kinase activity(GO:0008384) |
| 1.5 | 12.1 | GO:0005094 | Rho GDP-dissociation inhibitor activity(GO:0005094) |
| 1.4 | 8.6 | GO:0004523 | RNA-DNA hybrid ribonuclease activity(GO:0004523) |
| 1.4 | 12.7 | GO:0004727 | prenylated protein tyrosine phosphatase activity(GO:0004727) |
| 1.4 | 4.1 | GO:0097371 | MDM2/MDM4 family protein binding(GO:0097371) |
| 1.3 | 30.8 | GO:0005537 | mannose binding(GO:0005537) |
| 1.3 | 9.4 | GO:0019788 | NEDD8 transferase activity(GO:0019788) protein-glutamic acid ligase activity(GO:0070739) |
| 1.3 | 10.5 | GO:0015450 | P-P-bond-hydrolysis-driven protein transmembrane transporter activity(GO:0015450) |
| 1.3 | 6.5 | GO:0004966 | galanin receptor activity(GO:0004966) |
| 1.3 | 3.9 | GO:0003858 | 3-hydroxybutyrate dehydrogenase activity(GO:0003858) |
| 1.3 | 5.1 | GO:0008177 | succinate dehydrogenase (ubiquinone) activity(GO:0008177) |
| 1.3 | 8.9 | GO:0016618 | hydroxypyruvate reductase activity(GO:0016618) glyoxylate reductase (NADP) activity(GO:0030267) |
| 1.2 | 5.0 | GO:0033823 | procollagen-lysine 5-dioxygenase activity(GO:0008475) procollagen glucosyltransferase activity(GO:0033823) |
| 1.2 | 5.9 | GO:0004694 | eukaryotic translation initiation factor 2alpha kinase activity(GO:0004694) |
| 1.2 | 7.1 | GO:0003998 | acylphosphatase activity(GO:0003998) |
| 1.2 | 4.7 | GO:0003963 | RNA-3'-phosphate cyclase activity(GO:0003963) |
| 1.1 | 20.5 | GO:0070513 | death domain binding(GO:0070513) |
| 1.1 | 19.7 | GO:0004535 | poly(A)-specific ribonuclease activity(GO:0004535) |
| 1.1 | 7.5 | GO:0003689 | DNA clamp loader activity(GO:0003689) protein-DNA loading ATPase activity(GO:0033170) |
| 1.0 | 8.1 | GO:0000990 | transcription factor activity, core RNA polymerase binding(GO:0000990) |
| 1.0 | 7.0 | GO:0000182 | rDNA binding(GO:0000182) |
| 1.0 | 4.9 | GO:0008240 | tripeptidyl-peptidase activity(GO:0008240) |
| 1.0 | 9.7 | GO:0010859 | calcium-dependent cysteine-type endopeptidase inhibitor activity(GO:0010859) |
| 1.0 | 2.9 | GO:0004772 | sterol O-acyltransferase activity(GO:0004772) cholesterol O-acyltransferase activity(GO:0034736) |
| 1.0 | 5.7 | GO:0004046 | aminoacylase activity(GO:0004046) |
| 0.9 | 3.8 | GO:0004852 | uroporphyrinogen-III synthase activity(GO:0004852) |
| 0.9 | 3.7 | GO:0016509 | long-chain-3-hydroxyacyl-CoA dehydrogenase activity(GO:0016509) |
| 0.9 | 25.1 | GO:0016628 | oxidoreductase activity, acting on the CH-CH group of donors, NAD or NADP as acceptor(GO:0016628) |
| 0.9 | 5.1 | GO:0008381 | mechanically-gated ion channel activity(GO:0008381) mechanically gated channel activity(GO:0022833) |
| 0.8 | 17.7 | GO:0050786 | RAGE receptor binding(GO:0050786) |
| 0.8 | 4.0 | GO:0052828 | phosphatidylinositol-3,4-bisphosphate 4-phosphatase activity(GO:0016316) inositol-1,3,4-trisphosphate 4-phosphatase activity(GO:0017161) phosphatidylinositol-4,5-bisphosphate 4-phosphatase activity(GO:0034597) inositol-3,4-bisphosphate 4-phosphatase activity(GO:0052828) |
| 0.8 | 22.7 | GO:0098641 | cadherin binding involved in cell-cell adhesion(GO:0098641) |
| 0.8 | 3.0 | GO:0047192 | 1-alkylglycerophosphocholine O-acetyltransferase activity(GO:0047192) |
| 0.8 | 2.3 | GO:0008476 | protein-tyrosine sulfotransferase activity(GO:0008476) |
| 0.7 | 3.7 | GO:0004066 | asparagine synthase (glutamine-hydrolyzing) activity(GO:0004066) |
| 0.7 | 3.7 | GO:0004084 | branched-chain-amino-acid transaminase activity(GO:0004084) L-leucine transaminase activity(GO:0052654) L-valine transaminase activity(GO:0052655) L-isoleucine transaminase activity(GO:0052656) |
| 0.7 | 8.9 | GO:0015129 | lactate transmembrane transporter activity(GO:0015129) |
| 0.7 | 11.1 | GO:0098505 | G-rich strand telomeric DNA binding(GO:0098505) |
| 0.7 | 3.7 | GO:0043023 | ribosomal large subunit binding(GO:0043023) |
| 0.7 | 5.8 | GO:0015288 | porin activity(GO:0015288) |
| 0.7 | 5.0 | GO:0004873 | asialoglycoprotein receptor activity(GO:0004873) |
| 0.7 | 33.3 | GO:0050699 | WW domain binding(GO:0050699) |
| 0.7 | 6.9 | GO:0070087 | chromo shadow domain binding(GO:0070087) |
| 0.7 | 6.1 | GO:0001056 | RNA polymerase III activity(GO:0001056) |
| 0.7 | 13.5 | GO:0048156 | tau protein binding(GO:0048156) |
| 0.7 | 12.8 | GO:0035256 | G-protein coupled glutamate receptor binding(GO:0035256) |
| 0.7 | 5.4 | GO:0001055 | RNA polymerase II activity(GO:0001055) |
| 0.7 | 4.6 | GO:0051400 | BH domain binding(GO:0051400) |
| 0.6 | 3.1 | GO:0070653 | high-density lipoprotein particle receptor binding(GO:0070653) |
| 0.6 | 4.8 | GO:0015349 | thyroid hormone transmembrane transporter activity(GO:0015349) |
| 0.6 | 5.9 | GO:0004579 | dolichyl-diphosphooligosaccharide-protein glycotransferase activity(GO:0004579) |
| 0.6 | 4.1 | GO:0004169 | dolichyl-phosphate-mannose-protein mannosyltransferase activity(GO:0004169) |
| 0.6 | 2.3 | GO:0004906 | interferon-gamma receptor activity(GO:0004906) |
| 0.6 | 3.9 | GO:0004652 | polynucleotide adenylyltransferase activity(GO:0004652) |
| 0.6 | 1.7 | GO:0016309 | 1-phosphatidylinositol-5-phosphate 4-kinase activity(GO:0016309) |
| 0.6 | 1.7 | GO:0004963 | follicle-stimulating hormone receptor activity(GO:0004963) |
| 0.5 | 8.1 | GO:0017017 | MAP kinase tyrosine/serine/threonine phosphatase activity(GO:0017017) |
| 0.5 | 5.4 | GO:0097157 | pre-mRNA intronic binding(GO:0097157) |
| 0.5 | 1.6 | GO:0031626 | beta-endorphin binding(GO:0031626) |
| 0.5 | 5.2 | GO:0070883 | pre-miRNA binding(GO:0070883) |
| 0.5 | 3.0 | GO:0061665 | SUMO ligase activity(GO:0061665) |
| 0.5 | 4.4 | GO:0017176 | phosphatidylinositol N-acetylglucosaminyltransferase activity(GO:0017176) |
| 0.5 | 3.9 | GO:0102338 | fatty acid elongase activity(GO:0009922) 3-oxo-arachidoyl-CoA synthase activity(GO:0102336) 3-oxo-cerotoyl-CoA synthase activity(GO:0102337) 3-oxo-lignoceronyl-CoA synthase activity(GO:0102338) |
| 0.5 | 2.4 | GO:0008174 | mRNA methyltransferase activity(GO:0008174) |
| 0.5 | 4.2 | GO:0046703 | natural killer cell lectin-like receptor binding(GO:0046703) |
| 0.5 | 1.9 | GO:0005412 | glucose:sodium symporter activity(GO:0005412) |
| 0.5 | 7.5 | GO:0017128 | phospholipid scramblase activity(GO:0017128) |
| 0.5 | 2.8 | GO:0051880 | G-quadruplex DNA binding(GO:0051880) |
| 0.5 | 6.0 | GO:0000774 | adenyl-nucleotide exchange factor activity(GO:0000774) |
| 0.4 | 14.4 | GO:0070182 | DNA polymerase binding(GO:0070182) |
| 0.4 | 4.9 | GO:0001135 | transcription factor activity, RNA polymerase II transcription factor recruiting(GO:0001135) |
| 0.4 | 4.8 | GO:0016755 | transferase activity, transferring amino-acyl groups(GO:0016755) |
| 0.4 | 2.1 | GO:0097016 | L27 domain binding(GO:0097016) |
| 0.4 | 7.3 | GO:0035497 | cAMP response element binding(GO:0035497) |
| 0.4 | 6.1 | GO:0005049 | nuclear export signal receptor activity(GO:0005049) |
| 0.4 | 3.9 | GO:0030235 | nitric-oxide synthase regulator activity(GO:0030235) |
| 0.4 | 2.3 | GO:0031962 | mineralocorticoid receptor binding(GO:0031962) |
| 0.4 | 2.2 | GO:0035500 | MH2 domain binding(GO:0035500) |
| 0.4 | 9.5 | GO:0005528 | macrolide binding(GO:0005527) FK506 binding(GO:0005528) |
| 0.4 | 4.4 | GO:0070053 | thrombospondin receptor activity(GO:0070053) |
| 0.4 | 2.9 | GO:1990405 | protein antigen binding(GO:1990405) |
| 0.4 | 1.4 | GO:0033829 | O-fucosylpeptide 3-beta-N-acetylglucosaminyltransferase activity(GO:0033829) |
| 0.4 | 21.2 | GO:0016655 | oxidoreductase activity, acting on NAD(P)H, quinone or similar compound as acceptor(GO:0016655) |
| 0.4 | 11.0 | GO:0008266 | poly(U) RNA binding(GO:0008266) |
| 0.4 | 10.5 | GO:0003887 | DNA-directed DNA polymerase activity(GO:0003887) |
| 0.3 | 1.4 | GO:0044736 | acid-sensing ion channel activity(GO:0044736) |
| 0.3 | 12.3 | GO:0030296 | protein tyrosine kinase activator activity(GO:0030296) |
| 0.3 | 4.2 | GO:0008494 | translation activator activity(GO:0008494) |
| 0.3 | 5.1 | GO:0031996 | thioesterase binding(GO:0031996) |
| 0.3 | 4.1 | GO:1990381 | ubiquitin-specific protease binding(GO:1990381) |
| 0.3 | 1.5 | GO:0016936 | galactoside binding(GO:0016936) |
| 0.3 | 11.0 | GO:0001671 | ATPase activator activity(GO:0001671) |
| 0.3 | 1.5 | GO:0004994 | somatostatin receptor activity(GO:0004994) |
| 0.3 | 8.5 | GO:0017166 | vinculin binding(GO:0017166) |
| 0.3 | 0.6 | GO:0098770 | FBXO family protein binding(GO:0098770) |
| 0.3 | 1.5 | GO:0016907 | G-protein coupled acetylcholine receptor activity(GO:0016907) |
| 0.3 | 22.4 | GO:0048365 | Rac GTPase binding(GO:0048365) |
| 0.3 | 47.0 | GO:0005200 | structural constituent of cytoskeleton(GO:0005200) |
| 0.3 | 26.1 | GO:0008307 | structural constituent of muscle(GO:0008307) |
| 0.3 | 30.3 | GO:0004867 | serine-type endopeptidase inhibitor activity(GO:0004867) |
| 0.3 | 10.5 | GO:0008138 | protein tyrosine/serine/threonine phosphatase activity(GO:0008138) |
| 0.3 | 4.4 | GO:0097602 | cullin family protein binding(GO:0097602) |
| 0.3 | 34.1 | GO:0051082 | unfolded protein binding(GO:0051082) |
| 0.3 | 27.2 | GO:0000980 | RNA polymerase II distal enhancer sequence-specific DNA binding(GO:0000980) |
| 0.3 | 4.0 | GO:0045236 | CXCR chemokine receptor binding(GO:0045236) |
| 0.3 | 6.9 | GO:0017056 | structural constituent of nuclear pore(GO:0017056) |
| 0.3 | 9.3 | GO:0043236 | laminin binding(GO:0043236) |
| 0.3 | 5.9 | GO:0008574 | ATP-dependent microtubule motor activity, plus-end-directed(GO:0008574) |
| 0.3 | 2.0 | GO:0015165 | pyrimidine nucleotide-sugar transmembrane transporter activity(GO:0015165) |
| 0.3 | 5.0 | GO:0005095 | GTPase inhibitor activity(GO:0005095) |
| 0.2 | 3.2 | GO:0001871 | pattern binding(GO:0001871) polysaccharide binding(GO:0030247) |
| 0.2 | 2.9 | GO:0070411 | I-SMAD binding(GO:0070411) |
| 0.2 | 1.7 | GO:0008109 | N-acetyllactosaminide beta-1,6-N-acetylglucosaminyltransferase activity(GO:0008109) |
| 0.2 | 3.3 | GO:0003688 | DNA replication origin binding(GO:0003688) |
| 0.2 | 1.2 | GO:0046899 | nucleoside triphosphate adenylate kinase activity(GO:0046899) |
| 0.2 | 3.2 | GO:0035612 | AP-2 adaptor complex binding(GO:0035612) |
| 0.2 | 3.5 | GO:0005149 | interleukin-1 receptor binding(GO:0005149) |
| 0.2 | 1.3 | GO:0005353 | fructose transmembrane transporter activity(GO:0005353) |
| 0.2 | 17.4 | GO:0003684 | damaged DNA binding(GO:0003684) |
| 0.2 | 3.4 | GO:0005522 | profilin binding(GO:0005522) |
| 0.2 | 1.7 | GO:0004767 | sphingomyelin phosphodiesterase activity(GO:0004767) |
| 0.2 | 4.2 | GO:0008242 | omega peptidase activity(GO:0008242) |
| 0.2 | 9.5 | GO:0030331 | estrogen receptor binding(GO:0030331) |
| 0.2 | 2.3 | GO:0008607 | phosphorylase kinase regulator activity(GO:0008607) |
| 0.2 | 0.9 | GO:0047144 | 2-acylglycerol-3-phosphate O-acyltransferase activity(GO:0047144) |
| 0.2 | 7.0 | GO:0043027 | cysteine-type endopeptidase inhibitor activity involved in apoptotic process(GO:0043027) |
| 0.2 | 1.8 | GO:0016286 | small conductance calcium-activated potassium channel activity(GO:0016286) |
| 0.2 | 3.3 | GO:0009931 | calcium-dependent protein serine/threonine kinase activity(GO:0009931) |
| 0.2 | 72.4 | GO:0045296 | cadherin binding(GO:0045296) |
| 0.2 | 8.3 | GO:0005159 | insulin-like growth factor receptor binding(GO:0005159) |
| 0.2 | 14.9 | GO:0004725 | protein tyrosine phosphatase activity(GO:0004725) |
| 0.2 | 2.5 | GO:0003899 | DNA-directed RNA polymerase activity(GO:0003899) |
| 0.2 | 2.2 | GO:0070324 | thyroid hormone binding(GO:0070324) |
| 0.2 | 5.2 | GO:0017025 | TBP-class protein binding(GO:0017025) |
| 0.2 | 1.9 | GO:0032395 | MHC class II receptor activity(GO:0032395) |
| 0.2 | 3.3 | GO:0050811 | GABA receptor binding(GO:0050811) |
| 0.2 | 3.1 | GO:0000339 | RNA cap binding(GO:0000339) |
| 0.2 | 5.7 | GO:0005540 | hyaluronic acid binding(GO:0005540) |
| 0.2 | 1.4 | GO:0033691 | sialic acid binding(GO:0033691) |
| 0.1 | 0.6 | GO:0004306 | ethanolamine-phosphate cytidylyltransferase activity(GO:0004306) |
| 0.1 | 1.1 | GO:0047499 | calcium-independent phospholipase A2 activity(GO:0047499) |
| 0.1 | 2.8 | GO:0008649 | rRNA methyltransferase activity(GO:0008649) |
| 0.1 | 0.9 | GO:0003958 | NADPH-hemoprotein reductase activity(GO:0003958) |
| 0.1 | 2.2 | GO:0008349 | MAP kinase kinase kinase kinase activity(GO:0008349) |
| 0.1 | 0.7 | GO:0015350 | reduced folate carrier activity(GO:0008518) methotrexate transporter activity(GO:0015350) |
| 0.1 | 1.1 | GO:0004017 | adenylate kinase activity(GO:0004017) |
| 0.1 | 3.2 | GO:0003785 | actin monomer binding(GO:0003785) |
| 0.1 | 0.9 | GO:0001733 | galactosylceramide sulfotransferase activity(GO:0001733) galactose 3-O-sulfotransferase activity(GO:0050694) |
| 0.1 | 0.6 | GO:0015180 | L-alanine transmembrane transporter activity(GO:0015180) alanine transmembrane transporter activity(GO:0022858) |
| 0.1 | 1.2 | GO:0043274 | phospholipase binding(GO:0043274) |
| 0.1 | 4.0 | GO:0000049 | tRNA binding(GO:0000049) |
| 0.1 | 1.1 | GO:0031995 | insulin-like growth factor II binding(GO:0031995) |
| 0.1 | 0.6 | GO:0005131 | growth hormone receptor binding(GO:0005131) |
| 0.1 | 0.4 | GO:0015315 | hexose phosphate transmembrane transporter activity(GO:0015119) organophosphate:inorganic phosphate antiporter activity(GO:0015315) hexose-phosphate:inorganic phosphate antiporter activity(GO:0015526) glucose 6-phosphate:inorganic phosphate antiporter activity(GO:0061513) |
| 0.1 | 18.7 | GO:0008083 | growth factor activity(GO:0008083) |
| 0.1 | 0.6 | GO:0004839 | ubiquitin activating enzyme activity(GO:0004839) |
| 0.1 | 0.5 | GO:0030369 | ICAM-3 receptor activity(GO:0030369) |
| 0.1 | 2.3 | GO:0015002 | cytochrome-c oxidase activity(GO:0004129) heme-copper terminal oxidase activity(GO:0015002) oxidoreductase activity, acting on a heme group of donors(GO:0016675) oxidoreductase activity, acting on a heme group of donors, oxygen as acceptor(GO:0016676) |
| 0.1 | 0.5 | GO:0017040 | ceramidase activity(GO:0017040) |
| 0.1 | 0.6 | GO:0071535 | RING-like zinc finger domain binding(GO:0071535) |
| 0.1 | 1.9 | GO:0051393 | alpha-actinin binding(GO:0051393) |
| 0.1 | 0.7 | GO:0005549 | odorant binding(GO:0005549) |
| 0.1 | 2.4 | GO:0003950 | NAD+ ADP-ribosyltransferase activity(GO:0003950) |
| 0.1 | 2.3 | GO:0001103 | RNA polymerase II repressing transcription factor binding(GO:0001103) |
| 0.1 | 5.0 | GO:0019003 | GDP binding(GO:0019003) |
| 0.1 | 1.1 | GO:0008191 | metalloendopeptidase inhibitor activity(GO:0008191) |
| 0.1 | 1.1 | GO:0071837 | HMG box domain binding(GO:0071837) |
| 0.1 | 5.5 | GO:0004553 | hydrolase activity, hydrolyzing O-glycosyl compounds(GO:0004553) |
| 0.1 | 0.9 | GO:0015299 | solute:proton antiporter activity(GO:0015299) |
| 0.0 | 0.6 | GO:0016857 | racemase and epimerase activity, acting on carbohydrates and derivatives(GO:0016857) |
| 0.0 | 0.7 | GO:0005112 | Notch binding(GO:0005112) |
| 0.0 | 0.5 | GO:0016208 | AMP binding(GO:0016208) |
| 0.0 | 0.2 | GO:0031779 | melanocortin receptor binding(GO:0031779) type 3 melanocortin receptor binding(GO:0031781) type 4 melanocortin receptor binding(GO:0031782) |
| 0.0 | 3.6 | GO:0004721 | phosphoprotein phosphatase activity(GO:0004721) |
| 0.0 | 0.9 | GO:0008173 | RNA methyltransferase activity(GO:0008173) |
| 0.0 | 0.2 | GO:0010484 | H3 histone acetyltransferase activity(GO:0010484) |
| 0.0 | 1.5 | GO:0003743 | translation initiation factor activity(GO:0003743) |
| 0.0 | 1.3 | GO:0005484 | SNAP receptor activity(GO:0005484) |
| 0.0 | 0.5 | GO:0017154 | semaphorin receptor activity(GO:0017154) |
| 0.0 | 1.1 | GO:0030971 | receptor tyrosine kinase binding(GO:0030971) |
| 0.0 | 0.4 | GO:0017127 | cholesterol transporter activity(GO:0017127) |
| 0.0 | 0.6 | GO:0070566 | adenylyltransferase activity(GO:0070566) |
| 0.0 | 0.1 | GO:0030107 | HLA-A specific inhibitory MHC class I receptor activity(GO:0030107) |
| 0.0 | 5.4 | GO:0015631 | tubulin binding(GO:0015631) |
| 0.0 | 0.1 | GO:0018685 | alkane 1-monooxygenase activity(GO:0018685) leukotriene-B4 20-monooxygenase activity(GO:0050051) |
| 0.0 | 0.1 | GO:0044548 | S100 protein binding(GO:0044548) |
| 0.0 | 0.3 | GO:0008198 | ferrous iron binding(GO:0008198) |
| 0.0 | 1.2 | GO:0042826 | histone deacetylase binding(GO:0042826) |
| 0.0 | 1.0 | GO:0003730 | mRNA 3'-UTR binding(GO:0003730) |
| 0.0 | 0.9 | GO:0003697 | single-stranded DNA binding(GO:0003697) |
Gene overrepresentation in curated gene sets: canonical pathways category:
| Log-likelihood per target | Total log-likelihood | Term | Description |
|---|---|---|---|
| 1.5 | 30.2 | PID P38 GAMMA DELTA PATHWAY | Signaling mediated by p38-gamma and p38-delta |
| 1.4 | 5.6 | ST PHOSPHOINOSITIDE 3 KINASE PATHWAY | PI3K Pathway |
| 1.3 | 100.7 | PID FOXM1 PATHWAY | FOXM1 transcription factor network |
| 1.2 | 59.0 | PID LIS1 PATHWAY | Lissencephaly gene (LIS1) in neuronal migration and development |
| 0.7 | 22.8 | PID PRL SIGNALING EVENTS PATHWAY | Signaling events mediated by PRL |
| 0.7 | 9.8 | PID CIRCADIAN PATHWAY | Circadian rhythm pathway |
| 0.6 | 36.2 | PID ATR PATHWAY | ATR signaling pathway |
| 0.6 | 46.8 | PID INTEGRIN A4B1 PATHWAY | Alpha4 beta1 integrin signaling events |
| 0.5 | 21.6 | PID AURORA A PATHWAY | Aurora A signaling |
| 0.5 | 33.7 | PID HNF3A PATHWAY | FOXA1 transcription factor network |
| 0.5 | 36.4 | PID TAP63 PATHWAY | Validated transcriptional targets of TAp63 isoforms |
| 0.5 | 10.2 | SA PROGRAMMED CELL DEATH | Programmed cell death, or apoptosis, eliminates damaged or unneeded cells. |
| 0.5 | 31.3 | PID SYNDECAN 1 PATHWAY | Syndecan-1-mediated signaling events |
| 0.5 | 6.6 | PID INTEGRIN4 PATHWAY | Alpha6 beta4 integrin-ligand interactions |
| 0.5 | 37.6 | PID RAC1 PATHWAY | RAC1 signaling pathway |
| 0.4 | 10.1 | PID ERB GENOMIC PATHWAY | Validated nuclear estrogen receptor beta network |
| 0.4 | 20.2 | ST ERK1 ERK2 MAPK PATHWAY | ERK1/ERK2 MAPK Pathway |
| 0.4 | 38.5 | PID HIF1 TFPATHWAY | HIF-1-alpha transcription factor network |
| 0.3 | 12.3 | PID ALK1 PATHWAY | ALK1 signaling events |
| 0.3 | 17.0 | PID ERA GENOMIC PATHWAY | Validated nuclear estrogen receptor alpha network |
| 0.3 | 19.6 | PID AP1 PATHWAY | AP-1 transcription factor network |
| 0.3 | 24.2 | ST FAS SIGNALING PATHWAY | Fas Signaling Pathway |
| 0.3 | 7.2 | PID SMAD2 3PATHWAY | Regulation of cytoplasmic and nuclear SMAD2/3 signaling |
| 0.3 | 12.1 | PID P53 REGULATION PATHWAY | p53 pathway |
| 0.2 | 13.5 | PID TGFBR PATHWAY | TGF-beta receptor signaling |
| 0.2 | 14.5 | PID REG GR PATHWAY | Glucocorticoid receptor regulatory network |
| 0.2 | 13.0 | PID P73PATHWAY | p73 transcription factor network |
| 0.2 | 11.6 | PID LKB1 PATHWAY | LKB1 signaling events |
| 0.2 | 7.7 | PID RET PATHWAY | Signaling events regulated by Ret tyrosine kinase |
| 0.2 | 24.1 | PID P53 DOWNSTREAM PATHWAY | Direct p53 effectors |
| 0.2 | 15.1 | PID MYC ACTIV PATHWAY | Validated targets of C-MYC transcriptional activation |
| 0.2 | 1.9 | ST JAK STAT PATHWAY | Jak-STAT Pathway |
| 0.2 | 5.7 | SA MMP CYTOKINE CONNECTION | Cytokines can induce activation of matrix metalloproteinases, which degrade extracellular matrix. |
| 0.2 | 7.0 | PID P38 ALPHA BETA DOWNSTREAM PATHWAY | Signaling mediated by p38-alpha and p38-beta |
| 0.2 | 7.5 | NABA PROTEOGLYCANS | Genes encoding proteoglycans |
| 0.1 | 6.7 | PID PLK1 PATHWAY | PLK1 signaling events |
| 0.1 | 4.0 | PID IL23 PATHWAY | IL23-mediated signaling events |
| 0.1 | 7.2 | PID VEGFR1 2 PATHWAY | Signaling events mediated by VEGFR1 and VEGFR2 |
| 0.1 | 12.1 | WNT SIGNALING | Genes related to Wnt-mediated signal transduction |
| 0.1 | 8.6 | PID E2F PATHWAY | E2F transcription factor network |
| 0.1 | 0.9 | ST DIFFERENTIATION PATHWAY IN PC12 CELLS | Differentiation Pathway in PC12 Cells; this is a specific case of PAC1 Receptor Pathway. |
| 0.1 | 4.8 | PID ER NONGENOMIC PATHWAY | Plasma membrane estrogen receptor signaling |
| 0.1 | 4.4 | PID INTEGRIN3 PATHWAY | Beta3 integrin cell surface interactions |
| 0.1 | 4.8 | PID CDC42 REG PATHWAY | Regulation of CDC42 activity |
| 0.1 | 3.6 | PID ALPHA SYNUCLEIN PATHWAY | Alpha-synuclein signaling |
| 0.1 | 5.2 | PID CASPASE PATHWAY | Caspase cascade in apoptosis |
| 0.1 | 3.9 | PID HNF3B PATHWAY | FOXA2 and FOXA3 transcription factor networks |
| 0.1 | 2.7 | PID ERBB1 INTERNALIZATION PATHWAY | Internalization of ErbB1 |
| 0.1 | 2.5 | PID ERBB4 PATHWAY | ErbB4 signaling events |
| 0.1 | 3.6 | PID BETA CATENIN NUC PATHWAY | Regulation of nuclear beta catenin signaling and target gene transcription |
| 0.0 | 0.5 | PID VEGFR1 PATHWAY | VEGFR1 specific signals |
| 0.0 | 0.5 | ST GRANULE CELL SURVIVAL PATHWAY | Granule Cell Survival Pathway is a specific case of more general PAC1 Receptor Pathway. |
| 0.0 | 0.8 | SIG REGULATION OF THE ACTIN CYTOSKELETON BY RHO GTPASES | Genes related to regulation of the actin cytoskeleton |
| 0.0 | 0.9 | PID SMAD2 3NUCLEAR PATHWAY | Regulation of nuclear SMAD2/3 signaling |
| 0.0 | 0.2 | PID REELIN PATHWAY | Reelin signaling pathway |
| 0.0 | 1.5 | PID AR PATHWAY | Coregulation of Androgen receptor activity |
| 0.0 | 1.2 | PID TRKR PATHWAY | Neurotrophic factor-mediated Trk receptor signaling |
| 0.0 | 0.2 | PID INSULIN GLUCOSE PATHWAY | Insulin-mediated glucose transport |
Gene overrepresentation in curated gene sets: REACTOME pathways category:
| Log-likelihood per target | Total log-likelihood | Term | Description |
|---|---|---|---|
| 3.0 | 68.9 | REACTOME ACTIVATION OF BH3 ONLY PROTEINS | Genes involved in Activation of BH3-only proteins |
| 2.4 | 51.4 | REACTOME RNA POL III CHAIN ELONGATION | Genes involved in RNA Polymerase III Chain Elongation |
| 2.4 | 14.4 | REACTOME REPAIR SYNTHESIS FOR GAP FILLING BY DNA POL IN TC NER | Genes involved in Repair synthesis for gap-filling by DNA polymerase in TC-NER |
| 2.2 | 72.8 | REACTOME PYRUVATE METABOLISM | Genes involved in Pyruvate metabolism |
| 1.6 | 23.4 | REACTOME PURINE RIBONUCLEOSIDE MONOPHOSPHATE BIOSYNTHESIS | Genes involved in Purine ribonucleoside monophosphate biosynthesis |
| 1.5 | 47.5 | REACTOME SYNTHESIS OF VERY LONG CHAIN FATTY ACYL COAS | Genes involved in Synthesis of very long-chain fatty acyl-CoAs |
| 1.4 | 21.7 | REACTOME REMOVAL OF THE FLAP INTERMEDIATE FROM THE C STRAND | Genes involved in Removal of the Flap Intermediate from the C-strand |
| 1.3 | 32.0 | REACTOME PURINE SALVAGE | Genes involved in Purine salvage |
| 1.3 | 21.1 | REACTOME MITOCHONDRIAL TRNA AMINOACYLATION | Genes involved in Mitochondrial tRNA aminoacylation |
| 1.2 | 25.3 | REACTOME AUTODEGRADATION OF CDH1 BY CDH1 APC C | Genes involved in Autodegradation of Cdh1 by Cdh1:APC/C |
| 1.2 | 10.4 | REACTOME RECRUITMENT OF NUMA TO MITOTIC CENTROSOMES | Genes involved in Recruitment of NuMA to mitotic centrosomes |
| 1.1 | 94.7 | REACTOME SCFSKP2 MEDIATED DEGRADATION OF P27 P21 | Genes involved in SCF(Skp2)-mediated degradation of p27/p21 |
| 1.0 | 30.6 | REACTOME SPHINGOLIPID DE NOVO BIOSYNTHESIS | Genes involved in Sphingolipid de novo biosynthesis |
| 0.9 | 24.2 | REACTOME INFLAMMASOMES | Genes involved in Inflammasomes |
| 0.9 | 8.0 | REACTOME FATTY ACYL COA BIOSYNTHESIS | Genes involved in Fatty Acyl-CoA Biosynthesis |
| 0.9 | 16.7 | REACTOME CYCLIN A B1 ASSOCIATED EVENTS DURING G2 M TRANSITION | Genes involved in Cyclin A/B1 associated events during G2/M transition |
| 0.9 | 17.2 | REACTOME METABOLISM OF POLYAMINES | Genes involved in Metabolism of polyamines |
| 0.8 | 32.9 | REACTOME NEP NS2 INTERACTS WITH THE CELLULAR EXPORT MACHINERY | Genes involved in NEP/NS2 Interacts with the Cellular Export Machinery |
| 0.8 | 9.4 | REACTOME DIGESTION OF DIETARY CARBOHYDRATE | Genes involved in Digestion of dietary carbohydrate |
| 0.8 | 18.1 | REACTOME HDL MEDIATED LIPID TRANSPORT | Genes involved in HDL-mediated lipid transport |
| 0.7 | 12.6 | REACTOME MITOCHONDRIAL FATTY ACID BETA OXIDATION | Genes involved in Mitochondrial Fatty Acid Beta-Oxidation |
| 0.7 | 19.5 | REACTOME ELONGATION ARREST AND RECOVERY | Genes involved in Elongation arrest and recovery |
| 0.7 | 5.7 | REACTOME PURINE METABOLISM | Genes involved in Purine metabolism |
| 0.7 | 6.2 | REACTOME CYTOSOLIC TRNA AMINOACYLATION | Genes involved in Cytosolic tRNA aminoacylation |
| 0.7 | 2.7 | REACTOME VIF MEDIATED DEGRADATION OF APOBEC3G | Genes involved in Vif-mediated degradation of APOBEC3G |
| 0.7 | 10.5 | REACTOME ER PHAGOSOME PATHWAY | Genes involved in ER-Phagosome pathway |
| 0.6 | 16.2 | REACTOME FORMATION OF INCISION COMPLEX IN GG NER | Genes involved in Formation of incision complex in GG-NER |
| 0.6 | 25.1 | REACTOME CHOLESTEROL BIOSYNTHESIS | Genes involved in Cholesterol biosynthesis |
| 0.6 | 14.6 | REACTOME INTRINSIC PATHWAY FOR APOPTOSIS | Genes involved in Intrinsic Pathway for Apoptosis |
| 0.6 | 7.3 | REACTOME ACTIVATION OF CHAPERONE GENES BY ATF6 ALPHA | Genes involved in Activation of Chaperone Genes by ATF6-alpha |
| 0.6 | 26.6 | REACTOME GLYCOLYSIS | Genes involved in Glycolysis |
| 0.5 | 4.9 | REACTOME IRAK1 RECRUITS IKK COMPLEX | Genes involved in IRAK1 recruits IKK complex |
| 0.5 | 19.7 | REACTOME DEADENYLATION OF MRNA | Genes involved in Deadenylation of mRNA |
| 0.5 | 14.3 | REACTOME SIGNALING BY CONSTITUTIVELY ACTIVE EGFR | Genes involved in Signaling by constitutively active EGFR |
| 0.5 | 10.5 | REACTOME TETRAHYDROBIOPTERIN BH4 SYNTHESIS RECYCLING SALVAGE AND REGULATION | Genes involved in Tetrahydrobiopterin (BH4) synthesis, recycling, salvage and regulation |
| 0.5 | 9.0 | REACTOME ERKS ARE INACTIVATED | Genes involved in ERKs are inactivated |
| 0.5 | 7.4 | REACTOME PYRIMIDINE CATABOLISM | Genes involved in Pyrimidine catabolism |
| 0.5 | 11.4 | REACTOME RNA POL I TRANSCRIPTION | Genes involved in RNA Polymerase I Transcription |
| 0.5 | 3.4 | REACTOME P53 INDEPENDENT G1 S DNA DAMAGE CHECKPOINT | Genes involved in p53-Independent G1/S DNA damage checkpoint |
| 0.4 | 11.2 | REACTOME CASPASE MEDIATED CLEAVAGE OF CYTOSKELETAL PROTEINS | Genes involved in Caspase-mediated cleavage of cytoskeletal proteins |
| 0.4 | 10.6 | REACTOME SULFUR AMINO ACID METABOLISM | Genes involved in Sulfur amino acid metabolism |
| 0.4 | 4.6 | REACTOME SIGNAL ATTENUATION | Genes involved in Signal attenuation |
| 0.4 | 3.3 | REACTOME E2F ENABLED INHIBITION OF PRE REPLICATION COMPLEX FORMATION | Genes involved in E2F-enabled inhibition of pre-replication complex formation |
| 0.4 | 11.1 | REACTOME ERK MAPK TARGETS | Genes involved in ERK/MAPK targets |
| 0.4 | 16.7 | REACTOME PREFOLDIN MEDIATED TRANSFER OF SUBSTRATE TO CCT TRIC | Genes involved in Prefoldin mediated transfer of substrate to CCT/TriC |
| 0.4 | 12.2 | REACTOME TRANSPORT OF MATURE TRANSCRIPT TO CYTOPLASM | Genes involved in Transport of Mature Transcript to Cytoplasm |
| 0.4 | 10.7 | REACTOME MRNA SPLICING MINOR PATHWAY | Genes involved in mRNA Splicing - Minor Pathway |
| 0.4 | 6.2 | REACTOME TRANSPORT OF ORGANIC ANIONS | Genes involved in Transport of organic anions |
| 0.3 | 7.1 | REACTOME ASSOCIATION OF TRIC CCT WITH TARGET PROTEINS DURING BIOSYNTHESIS | Genes involved in Association of TriC/CCT with target proteins during biosynthesis |
| 0.3 | 7.1 | REACTOME FORMATION OF THE TERNARY COMPLEX AND SUBSEQUENTLY THE 43S COMPLEX | Genes involved in Formation of the ternary complex, and subsequently, the 43S complex |
| 0.3 | 28.0 | REACTOME RESPIRATORY ELECTRON TRANSPORT | Genes involved in Respiratory electron transport |
| 0.3 | 4.6 | REACTOME VITAMIN B5 PANTOTHENATE METABOLISM | Genes involved in Vitamin B5 (pantothenate) metabolism |
| 0.3 | 11.5 | REACTOME DOWNREGULATION OF TGF BETA RECEPTOR SIGNALING | Genes involved in Downregulation of TGF-beta receptor signaling |
| 0.3 | 11.1 | REACTOME AMYLOIDS | Genes involved in Amyloids |
| 0.3 | 4.4 | REACTOME DSCAM INTERACTIONS | Genes involved in DSCAM interactions |
| 0.3 | 5.7 | REACTOME HOMOLOGOUS RECOMBINATION REPAIR OF REPLICATION INDEPENDENT DOUBLE STRAND BREAKS | Genes involved in Homologous recombination repair of replication-independent double-strand breaks |
| 0.3 | 3.6 | REACTOME REGULATION OF INSULIN SECRETION BY ACETYLCHOLINE | Genes involved in Regulation of Insulin Secretion by Acetylcholine |
| 0.3 | 8.7 | REACTOME METABOLISM OF PORPHYRINS | Genes involved in Metabolism of porphyrins |
| 0.3 | 37.3 | REACTOME RESPONSE TO ELEVATED PLATELET CYTOSOLIC CA2 | Genes involved in Response to elevated platelet cytosolic Ca2+ |
| 0.3 | 13.1 | REACTOME NEGATIVE REGULATORS OF RIG I MDA5 SIGNALING | Genes involved in Negative regulators of RIG-I/MDA5 signaling |
| 0.3 | 3.9 | REACTOME MRNA 3 END PROCESSING | Genes involved in mRNA 3'-end processing |
| 0.3 | 10.6 | REACTOME SMOOTH MUSCLE CONTRACTION | Genes involved in Smooth Muscle Contraction |
| 0.3 | 5.5 | REACTOME ENDOSOMAL SORTING COMPLEX REQUIRED FOR TRANSPORT ESCRT | Genes involved in Endosomal Sorting Complex Required For Transport (ESCRT) |
| 0.3 | 9.1 | REACTOME DOWNREGULATION OF SMAD2 3 SMAD4 TRANSCRIPTIONAL ACTIVITY | Genes involved in Downregulation of SMAD2/3:SMAD4 transcriptional activity |
| 0.2 | 10.3 | REACTOME SEMA4D INDUCED CELL MIGRATION AND GROWTH CONE COLLAPSE | Genes involved in Sema4D induced cell migration and growth-cone collapse |
| 0.2 | 4.2 | REACTOME MRNA DECAY BY 5 TO 3 EXORIBONUCLEASE | Genes involved in mRNA Decay by 5' to 3' Exoribonuclease |
| 0.2 | 3.1 | REACTOME METABOLISM OF NON CODING RNA | Genes involved in Metabolism of non-coding RNA |
| 0.2 | 4.0 | REACTOME SYNTHESIS OF PIPS AT THE EARLY ENDOSOME MEMBRANE | Genes involved in Synthesis of PIPs at the early endosome membrane |
| 0.2 | 3.1 | REACTOME PERK REGULATED GENE EXPRESSION | Genes involved in PERK regulated gene expression |
| 0.2 | 9.1 | REACTOME REGULATION OF MRNA STABILITY BY PROTEINS THAT BIND AU RICH ELEMENTS | Genes involved in Regulation of mRNA Stability by Proteins that Bind AU-rich Elements |
| 0.2 | 0.9 | REACTOME ACYL CHAIN REMODELLING OF PI | Genes involved in Acyl chain remodelling of PI |
| 0.2 | 3.0 | REACTOME ACYL CHAIN REMODELLING OF PG | Genes involved in Acyl chain remodelling of PG |
| 0.2 | 4.2 | REACTOME HYALURONAN UPTAKE AND DEGRADATION | Genes involved in Hyaluronan uptake and degradation |
| 0.2 | 1.4 | REACTOME G ALPHA Z SIGNALLING EVENTS | Genes involved in G alpha (z) signalling events |
| 0.2 | 4.4 | REACTOME SIGNAL REGULATORY PROTEIN SIRP FAMILY INTERACTIONS | Genes involved in Signal regulatory protein (SIRP) family interactions |
| 0.2 | 8.2 | REACTOME AMINO ACID TRANSPORT ACROSS THE PLASMA MEMBRANE | Genes involved in Amino acid transport across the plasma membrane |
| 0.1 | 9.6 | REACTOME MRNA SPLICING | Genes involved in mRNA Splicing |
| 0.1 | 3.7 | REACTOME BRANCHED CHAIN AMINO ACID CATABOLISM | Genes involved in Branched-chain amino acid catabolism |
| 0.1 | 10.3 | REACTOME TRANS GOLGI NETWORK VESICLE BUDDING | Genes involved in trans-Golgi Network Vesicle Budding |
| 0.1 | 8.0 | REACTOME COLLAGEN FORMATION | Genes involved in Collagen formation |
| 0.1 | 7.7 | REACTOME ACTIVATION OF CHAPERONE GENES BY XBP1S | Genes involved in Activation of Chaperone Genes by XBP1(S) |
| 0.1 | 5.2 | REACTOME MEIOTIC SYNAPSIS | Genes involved in Meiotic Synapsis |
| 0.1 | 18.4 | REACTOME NONSENSE MEDIATED DECAY ENHANCED BY THE EXON JUNCTION COMPLEX | Genes involved in Nonsense Mediated Decay Enhanced by the Exon Junction Complex |
| 0.1 | 3.6 | REACTOME YAP1 AND WWTR1 TAZ STIMULATED GENE EXPRESSION | Genes involved in YAP1- and WWTR1 (TAZ)-stimulated gene expression |
| 0.1 | 2.2 | REACTOME REGULATION OF IFNG SIGNALING | Genes involved in Regulation of IFNG signaling |
| 0.1 | 16.2 | REACTOME ANTIGEN PROCESSING UBIQUITINATION PROTEASOME DEGRADATION | Genes involved in Antigen processing: Ubiquitination & Proteasome degradation |
| 0.1 | 1.9 | REACTOME GAMMA CARBOXYLATION TRANSPORT AND AMINO TERMINAL CLEAVAGE OF PROTEINS | Genes involved in Gamma-carboxylation, transport, and amino-terminal cleavage of proteins |
| 0.1 | 11.3 | REACTOME P75 NTR RECEPTOR MEDIATED SIGNALLING | Genes involved in p75 NTR receptor-mediated signalling |
| 0.1 | 7.5 | REACTOME MITOTIC PROMETAPHASE | Genes involved in Mitotic Prometaphase |
| 0.1 | 2.9 | REACTOME RECYCLING PATHWAY OF L1 | Genes involved in Recycling pathway of L1 |
| 0.1 | 2.0 | REACTOME TRANSPORT OF VITAMINS NUCLEOSIDES AND RELATED MOLECULES | Genes involved in Transport of vitamins, nucleosides, and related molecules |
| 0.1 | 0.6 | REACTOME IL 6 SIGNALING | Genes involved in Interleukin-6 signaling |
| 0.1 | 0.6 | REACTOME PEPTIDE CHAIN ELONGATION | Genes involved in Peptide chain elongation |
| 0.1 | 2.2 | REACTOME IL RECEPTOR SHC SIGNALING | Genes involved in Interleukin receptor SHC signaling |
| 0.1 | 1.6 | REACTOME REGULATION OF AMPK ACTIVITY VIA LKB1 | Genes involved in Regulation of AMPK activity via LKB1 |
| 0.1 | 1.6 | REACTOME PRE NOTCH PROCESSING IN GOLGI | Genes involved in Pre-NOTCH Processing in Golgi |
| 0.1 | 1.5 | REACTOME REGULATION OF COMPLEMENT CASCADE | Genes involved in Regulation of Complement cascade |
| 0.1 | 1.3 | REACTOME PROTEOLYTIC CLEAVAGE OF SNARE COMPLEX PROTEINS | Genes involved in Proteolytic cleavage of SNARE complex proteins |
| 0.1 | 0.8 | REACTOME TIE2 SIGNALING | Genes involved in Tie2 Signaling |
| 0.1 | 5.9 | REACTOME ASPARAGINE N LINKED GLYCOSYLATION | Genes involved in Asparagine N-linked glycosylation |
| 0.1 | 3.5 | REACTOME METABOLISM OF VITAMINS AND COFACTORS | Genes involved in Metabolism of vitamins and cofactors |
| 0.1 | 0.3 | REACTOME SEMA4D IN SEMAPHORIN SIGNALING | Genes involved in Sema4D in semaphorin signaling |
| 0.1 | 3.7 | REACTOME MYD88 MAL CASCADE INITIATED ON PLASMA MEMBRANE | Genes involved in MyD88:Mal cascade initiated on plasma membrane |
| 0.1 | 1.1 | REACTOME REGULATION OF INSULIN LIKE GROWTH FACTOR IGF ACTIVITY BY INSULIN LIKE GROWTH FACTOR BINDING PROTEINS IGFBPS | Genes involved in Regulation of Insulin-like Growth Factor (IGF) Activity by Insulin-like Growth Factor Binding Proteins (IGFBPs) |
| 0.1 | 1.9 | REACTOME MHC CLASS II ANTIGEN PRESENTATION | Genes involved in MHC class II antigen presentation |
| 0.0 | 4.0 | REACTOME INTEGRIN CELL SURFACE INTERACTIONS | Genes involved in Integrin cell surface interactions |
| 0.0 | 0.8 | REACTOME ACTIVATION OF RAC | Genes involved in Activation of Rac |
| 0.0 | 0.3 | REACTOME PLATELET ADHESION TO EXPOSED COLLAGEN | Genes involved in Platelet Adhesion to exposed collagen |
| 0.0 | 0.6 | REACTOME SYNTHESIS OF PE | Genes involved in Synthesis of PE |
| 0.0 | 0.6 | REACTOME CYTOSOLIC SULFONATION OF SMALL MOLECULES | Genes involved in Cytosolic sulfonation of small molecules |
| 0.0 | 0.4 | REACTOME DCC MEDIATED ATTRACTIVE SIGNALING | Genes involved in DCC mediated attractive signaling |
| 0.0 | 1.1 | REACTOME SYNTHESIS AND INTERCONVERSION OF NUCLEOTIDE DI AND TRIPHOSPHATES | Genes involved in Synthesis and interconversion of nucleotide di- and triphosphates |
| 0.0 | 1.4 | REACTOME TRANSLATION | Genes involved in Translation |
| 0.0 | 1.7 | REACTOME LOSS OF NLP FROM MITOTIC CENTROSOMES | Genes involved in Loss of Nlp from mitotic centrosomes |
| 0.0 | 0.4 | REACTOME ABCA TRANSPORTERS IN LIPID HOMEOSTASIS | Genes involved in ABCA transporters in lipid homeostasis |
| 0.0 | 0.4 | REACTOME SYNTHESIS OF GLYCOSYLPHOSPHATIDYLINOSITOL GPI | Genes involved in Synthesis of glycosylphosphatidylinositol (GPI) |
| 0.0 | 0.8 | REACTOME TRANSCRIPTIONAL REGULATION OF WHITE ADIPOCYTE DIFFERENTIATION | Genes involved in Transcriptional Regulation of White Adipocyte Differentiation |