Project
GNF SymAtlas + NCI-60 cancer cell lines, human (Su, 2004; Ross, 2000)
Navigation
Downloads
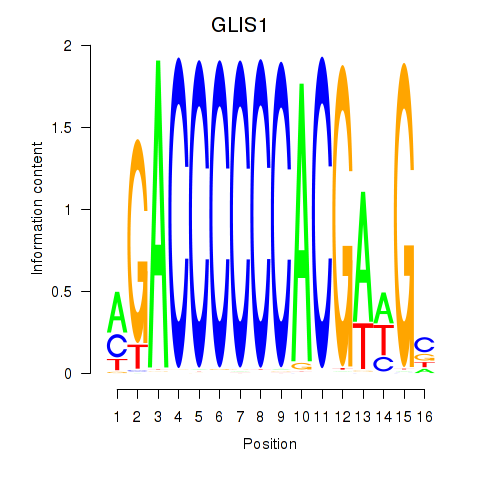
Results for GLIS1
Z-value: 0.18
Motif logo
Transcription factors associated with GLIS1
| Gene Symbol | Gene ID | Gene Info |
|---|---|---|
|
GLIS1
|
ENSG00000174332.5 | GLIS1 |
Activity profile of GLIS1 motif
Sorted Z-values of GLIS1 motif
Network of associatons between targets according to the STRING database.

| Promoter | Score | Transcript | Gene | Gene Info |
|---|---|---|---|---|
| chr7_+_107044689 | 4.05 |
ENST00000265717.5
|
PRKAR2B
|
protein kinase cAMP-dependent type II regulatory subunit beta |
| chr19_-_49325181 | 2.84 |
ENST00000454748.7
ENST00000335875.9 ENST00000598828.1 |
SLC6A16
|
solute carrier family 6 member 16 |
| chr19_+_40191410 | 1.82 |
ENST00000253055.8
|
MAP3K10
|
mitogen-activated protein kinase kinase kinase 10 |
| chr18_+_11752041 | 1.56 |
ENST00000423027.8
|
GNAL
|
G protein subunit alpha L |
| chr18_+_11751467 | 1.28 |
ENST00000535121.5
|
GNAL
|
G protein subunit alpha L |
| chr11_+_68903849 | 0.96 |
ENST00000675615.1
ENST00000255078.8 |
IGHMBP2
|
immunoglobulin mu DNA binding protein 2 |
| chr19_-_41959266 | 0.48 |
ENST00000600292.5
ENST00000601078.5 ENST00000601891.5 ENST00000222008.11 |
RABAC1
|
Rab acceptor 1 |
| chr18_+_11751494 | 0.42 |
ENST00000269162.9
|
GNAL
|
G protein subunit alpha L |
| chr16_+_58025745 | 0.38 |
ENST00000219271.4
|
MMP15
|
matrix metallopeptidase 15 |
| chr19_+_1275508 | 0.14 |
ENST00000409293.6
|
FAM174C
|
family with sequence similarity 174 member C |
| chr18_-_63158208 | 0.08 |
ENST00000678301.1
|
BCL2
|
BCL2 apoptosis regulator |
| chr11_+_68684534 | 0.04 |
ENST00000265643.4
|
GAL
|
galanin and GMAP prepropeptide |
Gene Ontology Analysis
Gene overrepresentation in biological process category:
| Log-likelihood per target | Total log-likelihood | Term | Description |
|---|---|---|---|
| 0.7 | 4.0 | GO:0097338 | response to clozapine(GO:0097338) |
| 0.2 | 1.8 | GO:0007256 | activation of JNKK activity(GO:0007256) |
| 0.1 | 3.3 | GO:0007191 | adenylate cyclase-activating dopamine receptor signaling pathway(GO:0007191) |
| 0.0 | 2.8 | GO:0003333 | amino acid transmembrane transport(GO:0003333) |
| 0.0 | 0.1 | GO:0046671 | negative regulation of cellular pH reduction(GO:0032848) CD8-positive, alpha-beta T cell lineage commitment(GO:0043375) negative regulation of retinal cell programmed cell death(GO:0046671) |
| 0.0 | 0.0 | GO:0051464 | positive regulation of cortisol secretion(GO:0051464) |
Gene overrepresentation in cellular component category:
| Log-likelihood per target | Total log-likelihood | Term | Description |
|---|---|---|---|
| 0.2 | 4.0 | GO:0005952 | cAMP-dependent protein kinase complex(GO:0005952) |
| 0.1 | 1.0 | GO:0032797 | SMN complex(GO:0032797) |
| 0.0 | 3.3 | GO:0005834 | heterotrimeric G-protein complex(GO:0005834) |
Gene overrepresentation in molecular function category:
| Log-likelihood per target | Total log-likelihood | Term | Description |
|---|---|---|---|
| 0.5 | 1.8 | GO:0004706 | JUN kinase kinase kinase activity(GO:0004706) |
| 0.2 | 4.0 | GO:0008603 | cAMP-dependent protein kinase regulator activity(GO:0008603) |
| 0.2 | 1.0 | GO:0043141 | ATP-dependent 5'-3' DNA helicase activity(GO:0043141) |
| 0.1 | 2.8 | GO:0005328 | neurotransmitter:sodium symporter activity(GO:0005328) |
| 0.1 | 3.3 | GO:0031683 | G-protein beta/gamma-subunit complex binding(GO:0031683) |
| 0.0 | 0.4 | GO:0070006 | metalloaminopeptidase activity(GO:0070006) |
| 0.0 | 0.5 | GO:0070064 | proline-rich region binding(GO:0070064) |
Gene overrepresentation in curated gene sets: canonical pathways category:
| Log-likelihood per target | Total log-likelihood | Term | Description |
|---|---|---|---|
| 0.1 | 3.3 | PID LPA4 PATHWAY | LPA4-mediated signaling events |
| 0.0 | 1.8 | PID P38 MKK3 6PATHWAY | p38 MAPK signaling pathway |
Gene overrepresentation in curated gene sets: REACTOME pathways category:
| Log-likelihood per target | Total log-likelihood | Term | Description |
|---|---|---|---|
| 0.3 | 3.3 | REACTOME ADENYLATE CYCLASE ACTIVATING PATHWAY | Genes involved in Adenylate cyclase activating pathway |
| 0.2 | 4.0 | REACTOME PKA MEDIATED PHOSPHORYLATION OF CREB | Genes involved in PKA-mediated phosphorylation of CREB |