Project
GNF SymAtlas + NCI-60 cancer cell lines, human (Su, 2004; Ross, 2000)
Navigation
Downloads
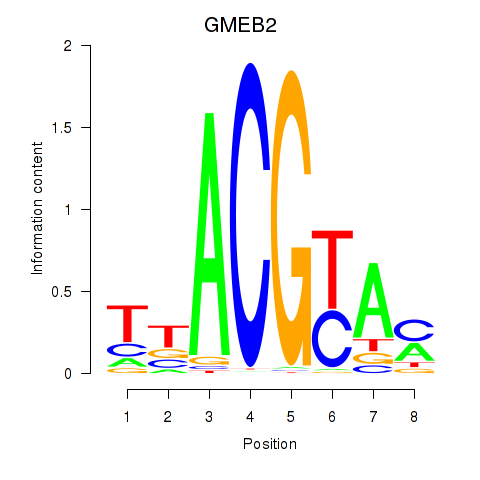
Results for GMEB2
Z-value: 2.38
Motif logo
Transcription factors associated with GMEB2
| Gene Symbol | Gene ID | Gene Info |
|---|---|---|
|
GMEB2
|
ENSG00000101216.11 | GMEB2 |
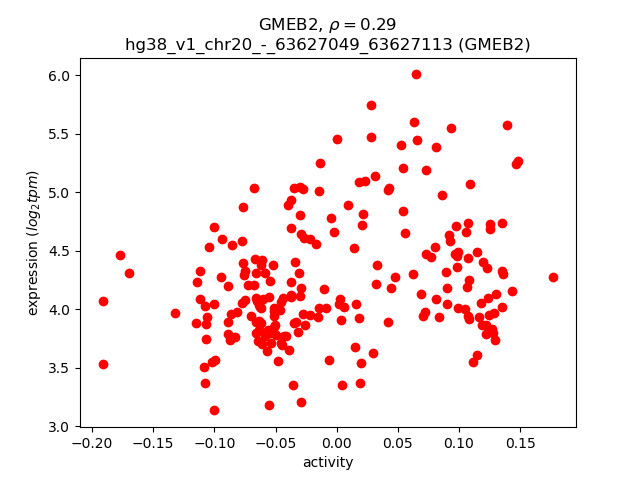
Activity-expression correlation:
| Gene | Promoter | Pearson corr. coef. | P-value | Plot |
|---|---|---|---|---|
| GMEB2 | hg38_v1_chr20_-_63627049_63627113 | 0.29 | 1.3e-05 | Click! |
Activity profile of GMEB2 motif
Sorted Z-values of GMEB2 motif
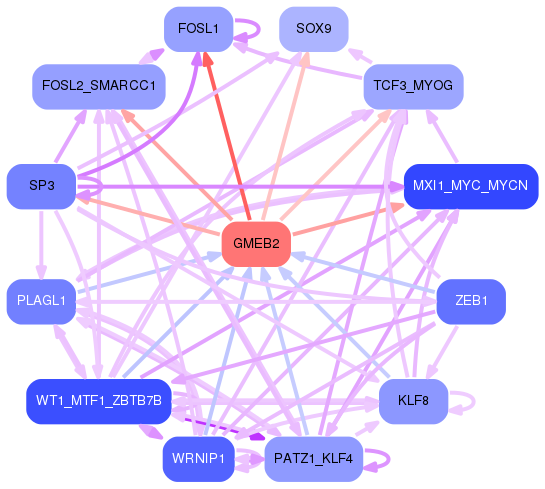
Network of associatons between targets according to the STRING database.

First level regulatory network of GMEB2
Gene Ontology Analysis
Gene overrepresentation in biological process category:
| Log-likelihood per target | Total log-likelihood | Term | Description |
|---|---|---|---|
| 19.4 | 58.2 | GO:0001732 | formation of cytoplasmic translation initiation complex(GO:0001732) |
| 17.4 | 17.4 | GO:1904871 | protein localization to nuclear body(GO:1903405) protein localization to Cajal body(GO:1904867) regulation of protein localization to Cajal body(GO:1904869) positive regulation of protein localization to Cajal body(GO:1904871) |
| 15.2 | 45.7 | GO:0090669 | telomerase RNA stabilization(GO:0090669) |
| 15.0 | 90.0 | GO:0007296 | vitellogenesis(GO:0007296) |
| 13.6 | 54.5 | GO:2000435 | regulation of protein neddylation(GO:2000434) negative regulation of protein neddylation(GO:2000435) |
| 13.2 | 39.6 | GO:1902568 | positive regulation of eosinophil degranulation(GO:0043311) positive regulation of eosinophil activation(GO:1902568) |
| 11.3 | 158.5 | GO:0000492 | box C/D snoRNP assembly(GO:0000492) |
| 11.0 | 32.9 | GO:0006391 | transcription initiation from mitochondrial promoter(GO:0006391) |
| 10.5 | 41.9 | GO:1904569 | regulation of selenocysteine incorporation(GO:1904569) |
| 10.4 | 41.5 | GO:0007113 | endomitotic cell cycle(GO:0007113) |
| 9.5 | 28.6 | GO:0048254 | peptidyl-glutamine methylation(GO:0018364) snoRNA localization(GO:0048254) |
| 9.2 | 36.8 | GO:1902544 | regulation of DNA N-glycosylase activity(GO:1902544) |
| 9.1 | 27.3 | GO:0000454 | snoRNA guided rRNA pseudouridine synthesis(GO:0000454) snRNA pseudouridine synthesis(GO:0031120) |
| 8.5 | 59.6 | GO:0071475 | cellular hyperosmotic salinity response(GO:0071475) |
| 8.4 | 33.6 | GO:0000915 | assembly of actomyosin apparatus involved in cytokinesis(GO:0000912) actomyosin contractile ring assembly(GO:0000915) actomyosin contractile ring organization(GO:0044837) |
| 8.2 | 24.5 | GO:2000616 | negative regulation of histone H3-K9 acetylation(GO:2000616) |
| 8.1 | 56.9 | GO:0044806 | G-quadruplex DNA unwinding(GO:0044806) |
| 8.0 | 24.1 | GO:0044205 | 'de novo' UMP biosynthetic process(GO:0044205) |
| 7.8 | 31.0 | GO:0046121 | deoxyribonucleoside catabolic process(GO:0046121) |
| 7.2 | 28.9 | GO:0046900 | tetrahydrofolylpolyglutamate metabolic process(GO:0046900) |
| 7.1 | 35.5 | GO:0006177 | GMP biosynthetic process(GO:0006177) |
| 6.8 | 27.2 | GO:2001247 | positive regulation of phosphatidylcholine biosynthetic process(GO:2001247) |
| 6.8 | 74.4 | GO:0010756 | positive regulation of plasminogen activation(GO:0010756) |
| 6.7 | 26.8 | GO:0035927 | RNA import into mitochondrion(GO:0035927) |
| 6.6 | 33.2 | GO:0043103 | hypoxanthine salvage(GO:0043103) |
| 6.6 | 39.3 | GO:0051177 | meiotic sister chromatid cohesion(GO:0051177) |
| 6.3 | 18.9 | GO:0015785 | UDP-galactose transport(GO:0015785) UDP-galactose transmembrane transport(GO:0072334) |
| 6.3 | 18.8 | GO:1902990 | mitotic telomere maintenance via semi-conservative replication(GO:1902990) |
| 5.9 | 23.6 | GO:1901535 | regulation of DNA demethylation(GO:1901535) negative regulation of DNA demethylation(GO:1901536) regulation of genetic imprinting(GO:2000653) |
| 5.6 | 16.8 | GO:0043328 | protein targeting to vacuole involved in ubiquitin-dependent protein catabolic process via the multivesicular body sorting pathway(GO:0043328) |
| 5.5 | 32.8 | GO:0010032 | meiotic chromosome condensation(GO:0010032) |
| 5.5 | 27.3 | GO:0019348 | dolichol metabolic process(GO:0019348) |
| 5.4 | 37.7 | GO:0008215 | spermine metabolic process(GO:0008215) |
| 5.3 | 15.8 | GO:1903031 | regulation of microtubule plus-end binding(GO:1903031) positive regulation of microtubule plus-end binding(GO:1903033) |
| 5.2 | 15.6 | GO:0009085 | lysine biosynthetic process(GO:0009085) lysine biosynthetic process via aminoadipic acid(GO:0019878) |
| 5.1 | 30.8 | GO:2000563 | positive regulation of CD4-positive, alpha-beta T cell proliferation(GO:2000563) |
| 5.1 | 20.4 | GO:0070982 | L-asparagine biosynthetic process(GO:0070981) L-asparagine metabolic process(GO:0070982) |
| 4.8 | 14.4 | GO:0006121 | mitochondrial electron transport, succinate to ubiquinone(GO:0006121) |
| 4.8 | 19.1 | GO:0051182 | coenzyme transport(GO:0051182) |
| 4.7 | 14.2 | GO:1901355 | response to rapamycin(GO:1901355) |
| 4.7 | 9.5 | GO:0036482 | neuron intrinsic apoptotic signaling pathway in response to hydrogen peroxide(GO:0036482) positive regulation of mitochondrial electron transport, NADH to ubiquinone(GO:1902958) regulation of hydrogen peroxide-induced neuron intrinsic apoptotic signaling pathway(GO:1903383) negative regulation of hydrogen peroxide-induced neuron intrinsic apoptotic signaling pathway(GO:1903384) |
| 4.7 | 18.7 | GO:0090094 | metanephric cap development(GO:0072185) metanephric cap morphogenesis(GO:0072186) metanephric cap mesenchymal cell proliferation involved in metanephros development(GO:0090094) regulation of metanephric cap mesenchymal cell proliferation(GO:0090095) positive regulation of metanephric cap mesenchymal cell proliferation(GO:0090096) |
| 4.6 | 13.9 | GO:0018160 | peptidyl-pyrromethane cofactor linkage(GO:0018160) |
| 4.6 | 18.5 | GO:0061668 | mitochondrial ribosome assembly(GO:0061668) mitochondrial large ribosomal subunit assembly(GO:1902775) |
| 4.6 | 13.8 | GO:0042823 | pyridoxal phosphate metabolic process(GO:0042822) pyridoxal phosphate biosynthetic process(GO:0042823) |
| 4.6 | 18.3 | GO:0046166 | glyceraldehyde-3-phosphate biosynthetic process(GO:0046166) |
| 4.6 | 13.7 | GO:0044752 | response to human chorionic gonadotropin(GO:0044752) cellular response to thyroxine stimulus(GO:0097069) cellular response to L-phenylalanine derivative(GO:1904387) |
| 4.5 | 49.9 | GO:0045116 | protein neddylation(GO:0045116) |
| 4.4 | 26.2 | GO:0032487 | regulation of Rap protein signal transduction(GO:0032487) |
| 4.3 | 43.1 | GO:0061179 | negative regulation of insulin secretion involved in cellular response to glucose stimulus(GO:0061179) |
| 4.2 | 12.6 | GO:0000350 | generation of catalytic spliceosome for second transesterification step(GO:0000350) positive regulation of response to alcohol(GO:1901421) |
| 4.2 | 4.2 | GO:1903436 | regulation of cytokinetic process(GO:0032954) regulation of mitotic cytokinetic process(GO:1903436) positive regulation of mitotic cytokinetic process(GO:1903438) positive regulation of mitotic cytokinesis(GO:1903490) |
| 4.2 | 54.3 | GO:0042407 | cristae formation(GO:0042407) |
| 4.1 | 12.3 | GO:0006421 | asparaginyl-tRNA aminoacylation(GO:0006421) |
| 4.1 | 8.1 | GO:0071033 | nuclear retention of pre-mRNA at the site of transcription(GO:0071033) |
| 4.1 | 69.0 | GO:0070389 | chaperone cofactor-dependent protein refolding(GO:0070389) |
| 3.9 | 31.5 | GO:0052405 | negative regulation by host of symbiont molecular function(GO:0052405) |
| 3.8 | 11.3 | GO:0019287 | isopentenyl diphosphate biosynthetic process, mevalonate pathway(GO:0019287) |
| 3.6 | 10.9 | GO:0033184 | positive regulation of histone ubiquitination(GO:0033184) |
| 3.6 | 10.8 | GO:0003420 | regulation of growth plate cartilage chondrocyte proliferation(GO:0003420) |
| 3.6 | 10.7 | GO:1902299 | pre-replicative complex assembly involved in nuclear cell cycle DNA replication(GO:0006267) pre-replicative complex assembly(GO:0036388) pre-replicative complex assembly involved in cell cycle DNA replication(GO:1902299) |
| 3.5 | 74.2 | GO:0070935 | 3'-UTR-mediated mRNA stabilization(GO:0070935) |
| 3.5 | 38.7 | GO:0042262 | DNA protection(GO:0042262) |
| 3.5 | 14.0 | GO:1904045 | cellular response to aldosterone(GO:1904045) |
| 3.5 | 17.5 | GO:1900264 | regulation of DNA-directed DNA polymerase activity(GO:1900262) positive regulation of DNA-directed DNA polymerase activity(GO:1900264) |
| 3.5 | 31.4 | GO:0015693 | magnesium ion transport(GO:0015693) |
| 3.5 | 142.6 | GO:0006363 | termination of RNA polymerase I transcription(GO:0006363) |
| 3.4 | 17.1 | GO:0099590 | neurotransmitter receptor internalization(GO:0099590) |
| 3.4 | 40.9 | GO:0051151 | negative regulation of smooth muscle cell differentiation(GO:0051151) |
| 3.1 | 12.4 | GO:0035965 | cardiolipin acyl-chain remodeling(GO:0035965) |
| 3.1 | 9.2 | GO:0070407 | oxidation-dependent protein catabolic process(GO:0070407) |
| 3.1 | 18.4 | GO:0006287 | base-excision repair, gap-filling(GO:0006287) |
| 3.0 | 9.1 | GO:0002101 | tRNA wobble cytosine modification(GO:0002101) |
| 3.0 | 18.0 | GO:0009052 | pentose-phosphate shunt, non-oxidative branch(GO:0009052) |
| 3.0 | 5.9 | GO:1904742 | regulation of telomeric DNA binding(GO:1904742) |
| 2.9 | 52.1 | GO:0045780 | positive regulation of bone resorption(GO:0045780) positive regulation of bone remodeling(GO:0046852) |
| 2.9 | 11.4 | GO:0034773 | histone H4-K20 trimethylation(GO:0034773) |
| 2.8 | 37.0 | GO:0000972 | transcription-dependent tethering of RNA polymerase II gene DNA at nuclear periphery(GO:0000972) |
| 2.8 | 48.4 | GO:0048026 | positive regulation of mRNA splicing, via spliceosome(GO:0048026) |
| 2.8 | 16.7 | GO:1904721 | negative regulation of mRNA cleavage(GO:0031438) negative regulation of mRNA endonucleolytic cleavage involved in unfolded protein response(GO:1904721) |
| 2.7 | 112.3 | GO:0000387 | spliceosomal snRNP assembly(GO:0000387) |
| 2.7 | 2.7 | GO:0045903 | positive regulation of translational fidelity(GO:0045903) |
| 2.7 | 13.7 | GO:2000864 | histone H3-K4 demethylation, trimethyl-H3-K4-specific(GO:0034721) estrogen secretion(GO:0035937) estradiol secretion(GO:0035938) regulation of estrogen secretion(GO:2000861) regulation of estradiol secretion(GO:2000864) |
| 2.7 | 16.2 | GO:0006104 | succinyl-CoA metabolic process(GO:0006104) |
| 2.7 | 24.1 | GO:1904798 | positive regulation of core promoter binding(GO:1904798) |
| 2.7 | 13.3 | GO:0070127 | tRNA aminoacylation for mitochondrial protein translation(GO:0070127) |
| 2.6 | 18.5 | GO:0006591 | ornithine metabolic process(GO:0006591) |
| 2.6 | 15.9 | GO:0000727 | double-strand break repair via break-induced replication(GO:0000727) |
| 2.6 | 10.6 | GO:0042450 | arginine biosynthetic process via ornithine(GO:0042450) |
| 2.6 | 10.5 | GO:0046833 | snRNA export from nucleus(GO:0006408) positive regulation of RNA export from nucleus(GO:0046833) snRNA transport(GO:0051030) |
| 2.6 | 197.2 | GO:0070125 | mitochondrial translational elongation(GO:0070125) |
| 2.6 | 31.3 | GO:0035414 | negative regulation of catenin import into nucleus(GO:0035414) |
| 2.5 | 20.2 | GO:0090267 | positive regulation of mitotic cell cycle spindle assembly checkpoint(GO:0090267) |
| 2.5 | 22.8 | GO:0038110 | interleukin-2-mediated signaling pathway(GO:0038110) |
| 2.5 | 243.2 | GO:0006521 | regulation of cellular amino acid metabolic process(GO:0006521) |
| 2.5 | 9.8 | GO:0045048 | protein insertion into ER membrane(GO:0045048) |
| 2.4 | 17.0 | GO:1903377 | negative regulation of oxidative stress-induced neuron intrinsic apoptotic signaling pathway(GO:1903377) |
| 2.4 | 7.3 | GO:0071963 | establishment or maintenance of cell polarity regulating cell shape(GO:0071963) |
| 2.4 | 29.1 | GO:0006122 | mitochondrial electron transport, ubiquinol to cytochrome c(GO:0006122) |
| 2.3 | 30.0 | GO:0006268 | DNA unwinding involved in DNA replication(GO:0006268) |
| 2.3 | 22.8 | GO:2001140 | regulation of phospholipid transport(GO:2001138) positive regulation of phospholipid transport(GO:2001140) |
| 2.3 | 6.8 | GO:0002905 | mature B cell apoptotic process(GO:0002901) regulation of mature B cell apoptotic process(GO:0002905) negative regulation of mature B cell apoptotic process(GO:0002906) |
| 2.3 | 11.4 | GO:0045875 | negative regulation of sister chromatid cohesion(GO:0045875) |
| 2.3 | 31.8 | GO:0051096 | positive regulation of helicase activity(GO:0051096) |
| 2.2 | 13.0 | GO:0006931 | substrate-dependent cell migration, cell attachment to substrate(GO:0006931) |
| 2.1 | 6.3 | GO:0036245 | cellular response to menadione(GO:0036245) |
| 2.1 | 8.2 | GO:1903750 | regulation of intrinsic apoptotic signaling pathway in response to hydrogen peroxide(GO:1903750) negative regulation of intrinsic apoptotic signaling pathway in response to hydrogen peroxide(GO:1903751) |
| 2.0 | 68.9 | GO:0030214 | hyaluronan catabolic process(GO:0030214) |
| 2.0 | 32.3 | GO:0035520 | monoubiquitinated protein deubiquitination(GO:0035520) |
| 2.0 | 38.2 | GO:0046349 | amino sugar biosynthetic process(GO:0046349) |
| 2.0 | 17.9 | GO:0071578 | zinc II ion transmembrane import(GO:0071578) |
| 2.0 | 21.8 | GO:0045722 | positive regulation of gluconeogenesis(GO:0045722) |
| 2.0 | 9.9 | GO:1903553 | positive regulation of extracellular exosome assembly(GO:1903553) |
| 2.0 | 19.6 | GO:0002480 | antigen processing and presentation of exogenous peptide antigen via MHC class I, TAP-independent(GO:0002480) |
| 1.9 | 25.2 | GO:0045835 | negative regulation of meiotic nuclear division(GO:0045835) |
| 1.9 | 9.7 | GO:0006850 | mitochondrial pyruvate transport(GO:0006850) mitochondrial pyruvate transmembrane transport(GO:1902361) |
| 1.9 | 15.0 | GO:0006729 | tetrahydrobiopterin biosynthetic process(GO:0006729) tetrahydrobiopterin metabolic process(GO:0046146) |
| 1.9 | 9.3 | GO:0072719 | cellular response to cisplatin(GO:0072719) |
| 1.8 | 9.2 | GO:0019747 | regulation of isoprenoid metabolic process(GO:0019747) |
| 1.8 | 14.5 | GO:0046604 | positive regulation of mitotic centrosome separation(GO:0046604) |
| 1.8 | 3.6 | GO:2000812 | regulation of barbed-end actin filament capping(GO:2000812) |
| 1.7 | 8.6 | GO:0006620 | posttranslational protein targeting to membrane(GO:0006620) |
| 1.7 | 16.9 | GO:0032510 | endosome to lysosome transport via multivesicular body sorting pathway(GO:0032510) |
| 1.7 | 38.7 | GO:0043968 | histone H2A acetylation(GO:0043968) |
| 1.7 | 5.0 | GO:0036233 | glycine import(GO:0036233) |
| 1.7 | 43.1 | GO:0015937 | coenzyme A biosynthetic process(GO:0015937) |
| 1.6 | 16.0 | GO:0000463 | maturation of LSU-rRNA from tricistronic rRNA transcript (SSU-rRNA, 5.8S rRNA, LSU-rRNA)(GO:0000463) |
| 1.6 | 6.3 | GO:0048388 | endosomal lumen acidification(GO:0048388) |
| 1.6 | 4.7 | GO:0050717 | positive regulation of interleukin-1 alpha secretion(GO:0050717) |
| 1.6 | 14.2 | GO:0009249 | protein lipoylation(GO:0009249) |
| 1.6 | 7.8 | GO:0002318 | myeloid progenitor cell differentiation(GO:0002318) |
| 1.6 | 100.0 | GO:0007157 | heterophilic cell-cell adhesion via plasma membrane cell adhesion molecules(GO:0007157) |
| 1.5 | 15.3 | GO:0045716 | positive regulation of low-density lipoprotein particle receptor biosynthetic process(GO:0045716) |
| 1.5 | 7.7 | GO:0030174 | regulation of DNA-dependent DNA replication initiation(GO:0030174) |
| 1.5 | 13.8 | GO:2000270 | negative regulation of fibroblast apoptotic process(GO:2000270) |
| 1.5 | 19.8 | GO:0005981 | regulation of glycogen catabolic process(GO:0005981) |
| 1.5 | 85.9 | GO:0007077 | mitotic nuclear envelope disassembly(GO:0007077) |
| 1.5 | 7.4 | GO:0060161 | positive regulation of dopamine receptor signaling pathway(GO:0060161) |
| 1.5 | 26.1 | GO:1904816 | positive regulation of protein localization to chromosome, telomeric region(GO:1904816) |
| 1.4 | 4.3 | GO:0045541 | negative regulation of cholesterol biosynthetic process(GO:0045541) negative regulation of cholesterol metabolic process(GO:0090206) |
| 1.4 | 5.5 | GO:0046946 | hydroxylysine metabolic process(GO:0046946) hydroxylysine biosynthetic process(GO:0046947) |
| 1.4 | 2.7 | GO:0000965 | mitochondrial RNA 3'-end processing(GO:0000965) |
| 1.3 | 10.8 | GO:0045040 | protein import into mitochondrial outer membrane(GO:0045040) |
| 1.3 | 50.9 | GO:0006376 | mRNA splice site selection(GO:0006376) |
| 1.3 | 4.0 | GO:0036510 | trimming of terminal mannose on C branch(GO:0036510) |
| 1.3 | 10.6 | GO:0034626 | fatty acid elongation, saturated fatty acid(GO:0019367) fatty acid elongation, unsaturated fatty acid(GO:0019368) fatty acid elongation, monounsaturated fatty acid(GO:0034625) fatty acid elongation, polyunsaturated fatty acid(GO:0034626) |
| 1.3 | 14.5 | GO:0070900 | mitochondrial tRNA modification(GO:0070900) mitochondrial RNA modification(GO:1900864) |
| 1.3 | 17.0 | GO:0090073 | positive regulation of protein homodimerization activity(GO:0090073) |
| 1.3 | 20.7 | GO:0040032 | post-embryonic body morphogenesis(GO:0040032) |
| 1.3 | 5.2 | GO:0031126 | snoRNA 3'-end processing(GO:0031126) |
| 1.3 | 12.9 | GO:0060136 | enucleate erythrocyte differentiation(GO:0043353) embryonic process involved in female pregnancy(GO:0060136) |
| 1.3 | 7.7 | GO:0006689 | ganglioside catabolic process(GO:0006689) |
| 1.3 | 189.0 | GO:0045047 | protein targeting to ER(GO:0045047) |
| 1.3 | 35.7 | GO:0000245 | spliceosomal complex assembly(GO:0000245) |
| 1.2 | 41.8 | GO:0031055 | chromatin remodeling at centromere(GO:0031055) CENP-A containing nucleosome assembly(GO:0034080) CENP-A containing chromatin organization(GO:0061641) |
| 1.2 | 9.7 | GO:0001887 | selenium compound metabolic process(GO:0001887) |
| 1.2 | 10.8 | GO:0046784 | viral mRNA export from host cell nucleus(GO:0046784) |
| 1.2 | 21.6 | GO:0035458 | cellular response to interferon-beta(GO:0035458) |
| 1.2 | 7.2 | GO:0014057 | positive regulation of acetylcholine secretion, neurotransmission(GO:0014057) |
| 1.2 | 3.5 | GO:0060018 | astrocyte fate commitment(GO:0060018) retinal rod cell differentiation(GO:0060221) |
| 1.1 | 16.8 | GO:0006983 | ER overload response(GO:0006983) |
| 1.1 | 6.7 | GO:0072307 | metanephric nephron tubule epithelial cell differentiation(GO:0072257) regulation of metanephric nephron tubule epithelial cell differentiation(GO:0072307) |
| 1.1 | 23.2 | GO:0033234 | negative regulation of protein sumoylation(GO:0033234) |
| 1.1 | 42.6 | GO:0010501 | RNA secondary structure unwinding(GO:0010501) |
| 1.1 | 9.8 | GO:0035246 | peptidyl-arginine N-methylation(GO:0035246) |
| 1.1 | 2.1 | GO:0019853 | L-ascorbic acid biosynthetic process(GO:0019853) |
| 1.1 | 8.5 | GO:2000210 | positive regulation of anoikis(GO:2000210) |
| 1.1 | 21.1 | GO:0051290 | protein heterotetramerization(GO:0051290) |
| 1.1 | 10.6 | GO:0030043 | actin filament fragmentation(GO:0030043) |
| 1.0 | 19.7 | GO:0006123 | mitochondrial electron transport, cytochrome c to oxygen(GO:0006123) |
| 1.0 | 6.2 | GO:0002943 | tRNA dihydrouridine synthesis(GO:0002943) |
| 1.0 | 12.3 | GO:1903800 | positive regulation of production of miRNAs involved in gene silencing by miRNA(GO:1903800) |
| 1.0 | 2.1 | GO:0010273 | detoxification of copper ion(GO:0010273) stress response to metal ion(GO:0097501) stress response to copper ion(GO:1990169) |
| 1.0 | 5.1 | GO:2000111 | positive regulation of macrophage apoptotic process(GO:2000111) |
| 1.0 | 5.0 | GO:0033314 | mitotic DNA replication checkpoint(GO:0033314) |
| 1.0 | 29.5 | GO:0033048 | negative regulation of mitotic sister chromatid segregation(GO:0033048) negative regulation of mitotic sister chromatid separation(GO:2000816) |
| 1.0 | 12.8 | GO:0070327 | thyroid hormone transport(GO:0070327) |
| 1.0 | 6.7 | GO:1902962 | regulation of metalloendopeptidase activity involved in amyloid precursor protein catabolic process(GO:1902962) negative regulation of metalloendopeptidase activity involved in amyloid precursor protein catabolic process(GO:1902963) |
| 1.0 | 5.7 | GO:0044351 | macropinocytosis(GO:0044351) |
| 1.0 | 39.0 | GO:0071451 | removal of superoxide radicals(GO:0019430) cellular response to oxygen radical(GO:0071450) cellular response to superoxide(GO:0071451) |
| 0.9 | 7.6 | GO:0050859 | negative regulation of B cell receptor signaling pathway(GO:0050859) |
| 0.9 | 14.0 | GO:0032836 | glomerular basement membrane development(GO:0032836) |
| 0.9 | 12.2 | GO:0048227 | plasma membrane to endosome transport(GO:0048227) |
| 0.9 | 9.3 | GO:0045329 | carnitine biosynthetic process(GO:0045329) |
| 0.9 | 10.1 | GO:0071044 | histone mRNA catabolic process(GO:0071044) |
| 0.9 | 2.7 | GO:0035048 | splicing factor protein import into nucleus(GO:0035048) |
| 0.9 | 6.3 | GO:0006499 | N-terminal protein myristoylation(GO:0006499) |
| 0.9 | 14.2 | GO:0006488 | dolichol-linked oligosaccharide biosynthetic process(GO:0006488) |
| 0.9 | 17.7 | GO:0048025 | negative regulation of mRNA splicing, via spliceosome(GO:0048025) |
| 0.9 | 245.2 | GO:0000377 | RNA splicing, via transesterification reactions with bulged adenosine as nucleophile(GO:0000377) mRNA splicing, via spliceosome(GO:0000398) |
| 0.8 | 4.9 | GO:0046654 | tetrahydrofolate biosynthetic process(GO:0046654) |
| 0.8 | 5.7 | GO:0006264 | mitochondrial DNA replication(GO:0006264) |
| 0.8 | 5.7 | GO:0070459 | prolactin secretion(GO:0070459) |
| 0.8 | 5.6 | GO:0070475 | rRNA base methylation(GO:0070475) |
| 0.8 | 59.7 | GO:0001578 | microtubule bundle formation(GO:0001578) |
| 0.7 | 3.7 | GO:0061732 | mitochondrial acetyl-CoA biosynthetic process from pyruvate(GO:0061732) |
| 0.7 | 5.8 | GO:0033182 | regulation of histone ubiquitination(GO:0033182) |
| 0.7 | 13.9 | GO:0016254 | preassembly of GPI anchor in ER membrane(GO:0016254) |
| 0.7 | 7.5 | GO:0033299 | secretion of lysosomal enzymes(GO:0033299) |
| 0.7 | 14.4 | GO:0006418 | tRNA aminoacylation for protein translation(GO:0006418) |
| 0.7 | 71.3 | GO:0007062 | sister chromatid cohesion(GO:0007062) |
| 0.7 | 4.0 | GO:0000012 | single strand break repair(GO:0000012) |
| 0.6 | 3.2 | GO:0042796 | snRNA transcription from RNA polymerase III promoter(GO:0042796) |
| 0.6 | 11.6 | GO:0016578 | histone deubiquitination(GO:0016578) |
| 0.6 | 3.9 | GO:0006013 | mannose metabolic process(GO:0006013) |
| 0.6 | 1.9 | GO:0070681 | glutaminyl-tRNAGln biosynthesis via transamidation(GO:0070681) |
| 0.6 | 1.2 | GO:0015917 | aminophospholipid transport(GO:0015917) |
| 0.6 | 7.1 | GO:0000470 | maturation of LSU-rRNA(GO:0000470) |
| 0.6 | 6.9 | GO:0051044 | positive regulation of membrane protein ectodomain proteolysis(GO:0051044) |
| 0.6 | 10.3 | GO:0034975 | protein folding in endoplasmic reticulum(GO:0034975) |
| 0.6 | 4.0 | GO:0060235 | lens induction in camera-type eye(GO:0060235) |
| 0.6 | 9.2 | GO:0006105 | succinate metabolic process(GO:0006105) |
| 0.6 | 17.5 | GO:0032986 | protein-DNA complex disassembly(GO:0032986) |
| 0.5 | 38.2 | GO:0051865 | protein autoubiquitination(GO:0051865) |
| 0.5 | 3.8 | GO:0035860 | glial cell-derived neurotrophic factor receptor signaling pathway(GO:0035860) |
| 0.5 | 37.0 | GO:0061178 | regulation of insulin secretion involved in cellular response to glucose stimulus(GO:0061178) |
| 0.5 | 16.3 | GO:0000301 | retrograde transport, vesicle recycling within Golgi(GO:0000301) |
| 0.5 | 10.5 | GO:0018345 | protein palmitoylation(GO:0018345) |
| 0.5 | 1.6 | GO:1903774 | positive regulation of viral budding via host ESCRT complex(GO:1903774) |
| 0.5 | 5.7 | GO:0032930 | positive regulation of superoxide anion generation(GO:0032930) |
| 0.5 | 11.9 | GO:0009404 | toxin metabolic process(GO:0009404) |
| 0.5 | 7.8 | GO:0031915 | positive regulation of synaptic plasticity(GO:0031915) |
| 0.5 | 6.7 | GO:0010452 | histone H3-K36 methylation(GO:0010452) |
| 0.5 | 1.0 | GO:1903626 | positive regulation of apoptotic DNA fragmentation(GO:1902512) positive regulation of DNA catabolic process(GO:1903626) |
| 0.5 | 10.6 | GO:0016558 | protein import into peroxisome matrix(GO:0016558) |
| 0.5 | 6.4 | GO:0010668 | ectodermal cell differentiation(GO:0010668) |
| 0.5 | 15.5 | GO:0090503 | RNA phosphodiester bond hydrolysis, exonucleolytic(GO:0090503) |
| 0.5 | 19.8 | GO:0048745 | smooth muscle tissue development(GO:0048745) |
| 0.5 | 7.7 | GO:2000036 | regulation of stem cell population maintenance(GO:2000036) |
| 0.5 | 3.3 | GO:0002326 | B cell lineage commitment(GO:0002326) |
| 0.5 | 9.1 | GO:0035518 | histone H2A monoubiquitination(GO:0035518) |
| 0.5 | 2.4 | GO:0034334 | adherens junction maintenance(GO:0034334) |
| 0.5 | 9.7 | GO:0009303 | rRNA transcription(GO:0009303) |
| 0.5 | 5.5 | GO:0006703 | estrogen biosynthetic process(GO:0006703) |
| 0.4 | 10.4 | GO:0046339 | diacylglycerol metabolic process(GO:0046339) |
| 0.4 | 3.0 | GO:0046940 | nucleoside monophosphate phosphorylation(GO:0046940) |
| 0.4 | 7.8 | GO:2000251 | positive regulation of actin cytoskeleton reorganization(GO:2000251) |
| 0.4 | 10.1 | GO:0060334 | regulation of interferon-gamma-mediated signaling pathway(GO:0060334) |
| 0.4 | 5.2 | GO:1900037 | regulation of cellular response to hypoxia(GO:1900037) |
| 0.4 | 16.6 | GO:0000281 | mitotic cytokinesis(GO:0000281) |
| 0.4 | 14.6 | GO:0043277 | apoptotic cell clearance(GO:0043277) |
| 0.4 | 10.6 | GO:0045736 | negative regulation of cyclin-dependent protein serine/threonine kinase activity(GO:0045736) |
| 0.4 | 1.5 | GO:1902463 | protein localization to cell leading edge(GO:1902463) |
| 0.4 | 18.0 | GO:0001824 | blastocyst development(GO:0001824) |
| 0.4 | 4.6 | GO:2000304 | positive regulation of sphingolipid biosynthetic process(GO:0090154) positive regulation of ceramide biosynthetic process(GO:2000304) |
| 0.4 | 2.1 | GO:0060017 | parathyroid gland development(GO:0060017) |
| 0.3 | 1.0 | GO:0035803 | egg coat formation(GO:0035803) |
| 0.3 | 9.4 | GO:0070979 | protein K11-linked ubiquitination(GO:0070979) |
| 0.3 | 2.3 | GO:0009597 | detection of virus(GO:0009597) |
| 0.3 | 2.3 | GO:1904263 | positive regulation of TORC1 signaling(GO:1904263) |
| 0.3 | 2.7 | GO:0032264 | IMP salvage(GO:0032264) |
| 0.3 | 5.0 | GO:1903206 | negative regulation of hydrogen peroxide-induced cell death(GO:1903206) |
| 0.3 | 12.6 | GO:0017145 | stem cell division(GO:0017145) |
| 0.3 | 7.8 | GO:0042590 | antigen processing and presentation of exogenous peptide antigen via MHC class I(GO:0042590) |
| 0.3 | 1.4 | GO:0050428 | purine ribonucleoside bisphosphate biosynthetic process(GO:0034036) 3'-phosphoadenosine 5'-phosphosulfate biosynthetic process(GO:0050428) |
| 0.3 | 5.4 | GO:0006228 | UTP biosynthetic process(GO:0006228) |
| 0.3 | 22.6 | GO:2000177 | regulation of neural precursor cell proliferation(GO:2000177) |
| 0.3 | 17.2 | GO:0015914 | phospholipid transport(GO:0015914) |
| 0.3 | 4.2 | GO:0000154 | rRNA modification(GO:0000154) |
| 0.3 | 2.8 | GO:0006044 | N-acetylglucosamine metabolic process(GO:0006044) |
| 0.3 | 4.7 | GO:0032060 | bleb assembly(GO:0032060) |
| 0.3 | 11.0 | GO:0046856 | phosphatidylinositol dephosphorylation(GO:0046856) |
| 0.3 | 4.6 | GO:0006829 | zinc II ion transport(GO:0006829) |
| 0.3 | 30.2 | GO:0045727 | positive regulation of translation(GO:0045727) |
| 0.3 | 13.7 | GO:0021762 | substantia nigra development(GO:0021762) |
| 0.3 | 14.4 | GO:1900034 | regulation of cellular response to heat(GO:1900034) |
| 0.3 | 5.7 | GO:1904886 | beta-catenin destruction complex disassembly(GO:1904886) |
| 0.3 | 0.8 | GO:0061031 | subthalamus development(GO:0021539) subthalamic nucleus development(GO:0021763) deltoid tuberosity development(GO:0035993) prolactin secreting cell differentiation(GO:0060127) left lung development(GO:0060459) left lung morphogenesis(GO:0060460) pulmonary vein morphogenesis(GO:0060577) superior vena cava morphogenesis(GO:0060578) endodermal digestive tract morphogenesis(GO:0061031) |
| 0.2 | 2.1 | GO:0071763 | nuclear membrane organization(GO:0071763) |
| 0.2 | 48.2 | GO:0006888 | ER to Golgi vesicle-mediated transport(GO:0006888) |
| 0.2 | 1.6 | GO:0006686 | sphingomyelin biosynthetic process(GO:0006686) |
| 0.2 | 9.9 | GO:0006261 | DNA-dependent DNA replication(GO:0006261) |
| 0.2 | 6.8 | GO:0030206 | chondroitin sulfate biosynthetic process(GO:0030206) |
| 0.2 | 4.2 | GO:0061099 | negative regulation of protein tyrosine kinase activity(GO:0061099) |
| 0.2 | 14.5 | GO:0006413 | translational initiation(GO:0006413) |
| 0.2 | 1.7 | GO:0000733 | DNA strand renaturation(GO:0000733) |
| 0.2 | 9.3 | GO:0002011 | morphogenesis of an epithelial sheet(GO:0002011) |
| 0.2 | 1.6 | GO:0048875 | chemical homeostasis within a tissue(GO:0048875) |
| 0.2 | 7.9 | GO:0035722 | interleukin-12-mediated signaling pathway(GO:0035722) cellular response to interleukin-12(GO:0071349) |
| 0.2 | 12.9 | GO:0006911 | phagocytosis, engulfment(GO:0006911) |
| 0.2 | 2.4 | GO:0033141 | positive regulation of peptidyl-serine phosphorylation of STAT protein(GO:0033141) |
| 0.2 | 5.6 | GO:0035019 | somatic stem cell population maintenance(GO:0035019) |
| 0.2 | 0.6 | GO:1903173 | phytol metabolic process(GO:0033306) fatty alcohol metabolic process(GO:1903173) |
| 0.2 | 3.3 | GO:0070534 | protein K63-linked ubiquitination(GO:0070534) |
| 0.1 | 5.4 | GO:0032456 | endocytic recycling(GO:0032456) |
| 0.1 | 3.0 | GO:0006270 | DNA replication initiation(GO:0006270) |
| 0.1 | 7.7 | GO:0000079 | regulation of cyclin-dependent protein serine/threonine kinase activity(GO:0000079) |
| 0.1 | 1.2 | GO:0071787 | endoplasmic reticulum tubular network assembly(GO:0071787) |
| 0.1 | 2.1 | GO:0035902 | response to immobilization stress(GO:0035902) |
| 0.1 | 8.4 | GO:0050911 | detection of chemical stimulus involved in sensory perception of smell(GO:0050911) |
| 0.1 | 3.0 | GO:0000188 | inactivation of MAPK activity(GO:0000188) |
| 0.1 | 1.8 | GO:0070584 | mitochondrion morphogenesis(GO:0070584) |
| 0.1 | 1.9 | GO:0090200 | positive regulation of release of cytochrome c from mitochondria(GO:0090200) |
| 0.1 | 8.5 | GO:0051495 | positive regulation of cytoskeleton organization(GO:0051495) |
| 0.1 | 1.1 | GO:0032780 | negative regulation of ATPase activity(GO:0032780) |
| 0.1 | 2.3 | GO:0090003 | regulation of establishment of protein localization to plasma membrane(GO:0090003) |
| 0.1 | 1.1 | GO:0002091 | negative regulation of receptor internalization(GO:0002091) |
| 0.1 | 8.1 | GO:0002433 | immune response-regulating cell surface receptor signaling pathway involved in phagocytosis(GO:0002433) Fc-gamma receptor signaling pathway involved in phagocytosis(GO:0038096) |
| 0.0 | 3.4 | GO:0006749 | glutathione metabolic process(GO:0006749) |
| 0.0 | 0.7 | GO:0031113 | regulation of microtubule polymerization(GO:0031113) |
| 0.0 | 0.2 | GO:0003340 | negative regulation of mesenchymal to epithelial transition involved in metanephros morphogenesis(GO:0003340) |
| 0.0 | 0.3 | GO:0051775 | response to redox state(GO:0051775) |
| 0.0 | 1.4 | GO:0010923 | negative regulation of phosphatase activity(GO:0010923) |
| 0.0 | 0.8 | GO:0035065 | regulation of histone acetylation(GO:0035065) |
| 0.0 | 0.2 | GO:0036295 | cellular response to increased oxygen levels(GO:0036295) |
| 0.0 | 0.0 | GO:0043379 | memory T cell differentiation(GO:0043379) regulation of memory T cell differentiation(GO:0043380) positive regulation of memory T cell differentiation(GO:0043382) |
| 0.0 | 1.6 | GO:0002576 | platelet degranulation(GO:0002576) |
| 0.0 | 0.1 | GO:0008105 | asymmetric protein localization(GO:0008105) |
Gene overrepresentation in cellular component category:
| Log-likelihood per target | Total log-likelihood | Term | Description |
|---|---|---|---|
| 20.2 | 161.2 | GO:0070761 | pre-snoRNP complex(GO:0070761) |
| 17.9 | 71.4 | GO:1990423 | RZZ complex(GO:1990423) |
| 16.1 | 193.2 | GO:0019773 | proteasome core complex, alpha-subunit complex(GO:0019773) |
| 12.1 | 60.3 | GO:0071598 | neuronal ribonucleoprotein granule(GO:0071598) |
| 11.9 | 59.6 | GO:0043564 | Ku70:Ku80 complex(GO:0043564) |
| 10.4 | 73.0 | GO:0031429 | box H/ACA snoRNP complex(GO:0031429) box H/ACA RNP complex(GO:0072588) box H/ACA scaRNP complex(GO:0072589) box H/ACA telomerase RNP complex(GO:0090661) |
| 9.5 | 38.0 | GO:0032777 | Piccolo NuA4 histone acetyltransferase complex(GO:0032777) |
| 9.3 | 74.4 | GO:0000015 | phosphopyruvate hydratase complex(GO:0000015) |
| 9.1 | 27.3 | GO:0033185 | dolichol-phosphate-mannose synthase complex(GO:0033185) |
| 8.2 | 131.8 | GO:0005736 | DNA-directed RNA polymerase I complex(GO:0005736) |
| 8.2 | 81.5 | GO:0071541 | eukaryotic translation initiation factor 3 complex, eIF3m(GO:0071541) |
| 8.0 | 48.1 | GO:0061617 | MICOS complex(GO:0061617) |
| 8.0 | 95.4 | GO:0000940 | condensed chromosome outer kinetochore(GO:0000940) |
| 7.7 | 23.2 | GO:0071001 | U4/U6 snRNP(GO:0071001) |
| 6.8 | 143.0 | GO:0071004 | U2-type prespliceosome(GO:0071004) |
| 6.7 | 33.6 | GO:0097149 | centralspindlin complex(GO:0097149) |
| 6.1 | 172.0 | GO:0005763 | organellar small ribosomal subunit(GO:0000314) mitochondrial small ribosomal subunit(GO:0005763) |
| 5.7 | 28.6 | GO:0001651 | dense fibrillar component(GO:0001651) granular component(GO:0001652) |
| 5.3 | 21.3 | GO:0000243 | commitment complex(GO:0000243) |
| 5.3 | 21.1 | GO:0005971 | ribonucleoside-diphosphate reductase complex(GO:0005971) |
| 5.2 | 36.2 | GO:0005663 | DNA replication factor C complex(GO:0005663) |
| 5.0 | 19.9 | GO:0071942 | XPC complex(GO:0071942) |
| 4.7 | 33.2 | GO:0044530 | supraspliceosomal complex(GO:0044530) |
| 4.6 | 13.7 | GO:0017109 | glutamate-cysteine ligase complex(GO:0017109) |
| 4.3 | 30.2 | GO:0016272 | prefoldin complex(GO:0016272) |
| 4.1 | 32.8 | GO:0000796 | condensin complex(GO:0000796) |
| 3.9 | 31.3 | GO:0032541 | cortical endoplasmic reticulum(GO:0032541) |
| 3.9 | 11.6 | GO:1990723 | cytoplasmic periphery of the nuclear pore complex(GO:1990723) |
| 3.8 | 45.9 | GO:0005688 | U6 snRNP(GO:0005688) |
| 3.8 | 30.5 | GO:0000322 | storage vacuole(GO:0000322) |
| 3.6 | 50.6 | GO:0070938 | contractile ring(GO:0070938) |
| 3.6 | 18.0 | GO:0034388 | Pwp2p-containing subcomplex of 90S preribosome(GO:0034388) |
| 3.6 | 10.7 | GO:0036387 | nuclear pre-replicative complex(GO:0005656) pre-replicative complex(GO:0036387) |
| 3.4 | 30.2 | GO:0005787 | signal peptidase complex(GO:0005787) |
| 3.2 | 45.3 | GO:1990712 | HFE-transferrin receptor complex(GO:1990712) |
| 3.2 | 15.8 | GO:0030981 | cortical microtubule cytoskeleton(GO:0030981) |
| 3.0 | 83.3 | GO:0005697 | telomerase holoenzyme complex(GO:0005697) |
| 2.9 | 17.4 | GO:0009368 | endopeptidase Clp complex(GO:0009368) |
| 2.9 | 14.4 | GO:0045281 | mitochondrial respiratory chain complex II, succinate dehydrogenase complex (ubiquinone)(GO:0005749) succinate dehydrogenase complex (ubiquinone)(GO:0045257) respiratory chain complex II(GO:0045273) succinate dehydrogenase complex(GO:0045281) fumarate reductase complex(GO:0045283) |
| 2.8 | 37.0 | GO:0042555 | MCM complex(GO:0042555) |
| 2.8 | 42.6 | GO:0000346 | transcription export complex(GO:0000346) |
| 2.7 | 65.6 | GO:0035145 | exon-exon junction complex(GO:0035145) |
| 2.7 | 16.2 | GO:0030062 | mitochondrial tricarboxylic acid cycle enzyme complex(GO:0030062) |
| 2.6 | 10.5 | GO:0005846 | nuclear cap binding complex(GO:0005846) |
| 2.6 | 49.4 | GO:0000974 | Prp19 complex(GO:0000974) |
| 2.6 | 7.7 | GO:0097135 | X chromosome(GO:0000805) cyclin E2-CDK2 complex(GO:0097135) |
| 2.5 | 39.2 | GO:0031080 | nuclear pore outer ring(GO:0031080) |
| 2.4 | 19.6 | GO:0042612 | MHC class I protein complex(GO:0042612) |
| 2.4 | 29.0 | GO:0008250 | oligosaccharyltransferase complex(GO:0008250) |
| 2.4 | 24.1 | GO:0097550 | transcriptional preinitiation complex(GO:0097550) |
| 2.4 | 23.8 | GO:0031595 | nuclear proteasome complex(GO:0031595) |
| 2.2 | 6.7 | GO:0071148 | TEAD-1-YAP complex(GO:0071148) |
| 2.2 | 13.0 | GO:0031467 | Cul7-RING ubiquitin ligase complex(GO:0031467) |
| 2.1 | 12.6 | GO:0071014 | post-mRNA release spliceosomal complex(GO:0071014) |
| 2.0 | 16.1 | GO:0008274 | gamma-tubulin large complex(GO:0000931) gamma-tubulin ring complex(GO:0008274) |
| 2.0 | 95.6 | GO:0042645 | nucleoid(GO:0009295) mitochondrial nucleoid(GO:0042645) |
| 1.9 | 5.8 | GO:0035370 | UBC13-UEV1A complex(GO:0035370) |
| 1.9 | 5.8 | GO:0055087 | Ski complex(GO:0055087) |
| 1.9 | 17.0 | GO:0042382 | paraspeckles(GO:0042382) |
| 1.9 | 26.2 | GO:0019774 | proteasome core complex, beta-subunit complex(GO:0019774) |
| 1.9 | 11.1 | GO:0033061 | DNA recombinase mediator complex(GO:0033061) Rad51B-Rad51C-Rad51D-XRCC2 complex(GO:0033063) |
| 1.8 | 186.6 | GO:0022625 | cytosolic large ribosomal subunit(GO:0022625) |
| 1.8 | 19.8 | GO:0042587 | glycogen granule(GO:0042587) PTW/PP1 phosphatase complex(GO:0072357) |
| 1.8 | 15.8 | GO:0019907 | cyclin-dependent protein kinase activating kinase holoenzyme complex(GO:0019907) |
| 1.7 | 13.9 | GO:0005742 | mitochondrial outer membrane translocase complex(GO:0005742) |
| 1.7 | 34.7 | GO:0031588 | nucleotide-activated protein kinase complex(GO:0031588) |
| 1.7 | 8.6 | GO:0031205 | endoplasmic reticulum Sec complex(GO:0031205) |
| 1.5 | 19.7 | GO:0005751 | mitochondrial respiratory chain complex IV(GO:0005751) |
| 1.4 | 7.1 | GO:0043625 | delta DNA polymerase complex(GO:0043625) |
| 1.3 | 6.7 | GO:0070381 | endosome to plasma membrane transport vesicle(GO:0070381) |
| 1.3 | 17.4 | GO:0002199 | zona pellucida receptor complex(GO:0002199) |
| 1.3 | 121.1 | GO:0071013 | catalytic step 2 spliceosome(GO:0071013) |
| 1.3 | 7.8 | GO:0070554 | synaptobrevin 2-SNAP-25-syntaxin-3-complexin complex(GO:0070554) |
| 1.3 | 15.5 | GO:0030015 | CCR4-NOT core complex(GO:0030015) |
| 1.3 | 8.9 | GO:0031298 | replication fork protection complex(GO:0031298) |
| 1.2 | 49.8 | GO:0016592 | mediator complex(GO:0016592) |
| 1.2 | 14.9 | GO:0030008 | TRAPP complex(GO:0030008) |
| 1.2 | 7.2 | GO:0002177 | manchette(GO:0002177) |
| 1.2 | 17.5 | GO:0001741 | XY body(GO:0001741) |
| 1.1 | 29.5 | GO:0036452 | ESCRT complex(GO:0036452) |
| 1.1 | 117.1 | GO:0005758 | mitochondrial intermembrane space(GO:0005758) |
| 1.1 | 10.6 | GO:0016593 | Cdc73/Paf1 complex(GO:0016593) |
| 1.1 | 11.6 | GO:0000124 | SAGA complex(GO:0000124) |
| 1.0 | 10.8 | GO:0017119 | Golgi transport complex(GO:0017119) |
| 1.0 | 14.6 | GO:0034663 | endoplasmic reticulum chaperone complex(GO:0034663) |
| 0.9 | 11.4 | GO:0071203 | WASH complex(GO:0071203) |
| 0.9 | 10.4 | GO:0005750 | mitochondrial respiratory chain complex III(GO:0005750) respiratory chain complex III(GO:0045275) |
| 0.9 | 27.3 | GO:0070971 | endoplasmic reticulum exit site(GO:0070971) |
| 0.9 | 2.8 | GO:0030689 | Noc complex(GO:0030689) |
| 0.9 | 37.6 | GO:0015934 | large ribosomal subunit(GO:0015934) |
| 0.9 | 9.1 | GO:0031465 | Cul4B-RING E3 ubiquitin ligase complex(GO:0031465) |
| 0.9 | 17.1 | GO:0030122 | AP-2 adaptor complex(GO:0030122) |
| 0.9 | 32.5 | GO:0030173 | integral component of Golgi membrane(GO:0030173) |
| 0.8 | 6.4 | GO:0031464 | Cul4A-RING E3 ubiquitin ligase complex(GO:0031464) |
| 0.8 | 13.3 | GO:0000177 | cytoplasmic exosome (RNase complex)(GO:0000177) |
| 0.8 | 69.5 | GO:0005778 | peroxisomal membrane(GO:0005778) microbody membrane(GO:0031903) |
| 0.8 | 142.0 | GO:0048770 | melanosome(GO:0042470) pigment granule(GO:0048770) |
| 0.8 | 2.3 | GO:0005745 | m-AAA complex(GO:0005745) |
| 0.7 | 5.9 | GO:0070187 | telosome(GO:0070187) |
| 0.7 | 23.6 | GO:0005719 | nuclear euchromatin(GO:0005719) |
| 0.7 | 5.1 | GO:0035985 | senescence-associated heterochromatin focus(GO:0035985) |
| 0.7 | 23.2 | GO:0030687 | preribosome, large subunit precursor(GO:0030687) |
| 0.7 | 21.2 | GO:0030140 | trans-Golgi network transport vesicle(GO:0030140) |
| 0.7 | 2.7 | GO:0034457 | Mpp10 complex(GO:0034457) |
| 0.6 | 1.9 | GO:0030956 | glutamyl-tRNA(Gln) amidotransferase complex(GO:0030956) |
| 0.6 | 3.7 | GO:0070552 | BRISC complex(GO:0070552) |
| 0.6 | 10.8 | GO:0016281 | eukaryotic translation initiation factor 4F complex(GO:0016281) |
| 0.5 | 63.5 | GO:0042734 | presynaptic membrane(GO:0042734) |
| 0.5 | 6.5 | GO:0005852 | eukaryotic translation initiation factor 3 complex(GO:0005852) |
| 0.5 | 29.4 | GO:0005747 | mitochondrial respiratory chain complex I(GO:0005747) NADH dehydrogenase complex(GO:0030964) respiratory chain complex I(GO:0045271) |
| 0.5 | 1.6 | GO:0032426 | stereocilium tip(GO:0032426) |
| 0.5 | 12.0 | GO:0070822 | Sin3-type complex(GO:0070822) |
| 0.5 | 32.6 | GO:0022627 | cytosolic small ribosomal subunit(GO:0022627) |
| 0.5 | 4.5 | GO:0000506 | glycosylphosphatidylinositol-N-acetylglucosaminyltransferase (GPI-GnT) complex(GO:0000506) |
| 0.5 | 71.2 | GO:0016605 | PML body(GO:0016605) |
| 0.4 | 23.7 | GO:0045171 | intercellular bridge(GO:0045171) |
| 0.4 | 1.6 | GO:0002945 | cyclin K-CDK13 complex(GO:0002945) |
| 0.4 | 2.3 | GO:1990131 | EGO complex(GO:0034448) Gtr1-Gtr2 GTPase complex(GO:1990131) |
| 0.4 | 7.5 | GO:0030904 | retromer complex(GO:0030904) |
| 0.4 | 34.8 | GO:0101003 | ficolin-1-rich granule membrane(GO:0101003) |
| 0.3 | 9.4 | GO:0005680 | anaphase-promoting complex(GO:0005680) |
| 0.3 | 4.7 | GO:0032059 | bleb(GO:0032059) |
| 0.3 | 3.7 | GO:0045254 | pyruvate dehydrogenase complex(GO:0045254) |
| 0.3 | 37.3 | GO:0005913 | cell-cell adherens junction(GO:0005913) |
| 0.3 | 3.7 | GO:0044615 | nuclear pore nuclear basket(GO:0044615) |
| 0.3 | 21.5 | GO:0035580 | specific granule lumen(GO:0035580) |
| 0.3 | 12.4 | GO:0005876 | spindle microtubule(GO:0005876) |
| 0.3 | 36.6 | GO:0030496 | midbody(GO:0030496) |
| 0.2 | 16.7 | GO:0005637 | nuclear inner membrane(GO:0005637) |
| 0.2 | 20.3 | GO:0005791 | rough endoplasmic reticulum(GO:0005791) |
| 0.2 | 2.1 | GO:0070776 | H3 histone acetyltransferase complex(GO:0070775) MOZ/MORF histone acetyltransferase complex(GO:0070776) |
| 0.2 | 11.5 | GO:0000777 | condensed chromosome kinetochore(GO:0000777) |
| 0.2 | 7.6 | GO:0002102 | podosome(GO:0002102) |
| 0.2 | 58.0 | GO:0034774 | secretory granule lumen(GO:0034774) |
| 0.1 | 10.6 | GO:0030864 | cortical actin cytoskeleton(GO:0030864) |
| 0.1 | 1.4 | GO:0030127 | COPII vesicle coat(GO:0030127) |
| 0.1 | 6.5 | GO:0005840 | ribosome(GO:0005840) |
| 0.1 | 1.4 | GO:0032433 | filopodium tip(GO:0032433) |
| 0.1 | 3.6 | GO:0072686 | mitotic spindle(GO:0072686) |
| 0.1 | 5.3 | GO:0005834 | heterotrimeric G-protein complex(GO:0005834) |
| 0.1 | 1.0 | GO:0046930 | pore complex(GO:0046930) |
| 0.1 | 6.3 | GO:0042581 | specific granule(GO:0042581) |
| 0.0 | 10.1 | GO:0030027 | lamellipodium(GO:0030027) |
| 0.0 | 2.5 | GO:0042571 | immunoglobulin complex, circulating(GO:0042571) |
| 0.0 | 35.0 | GO:0009986 | cell surface(GO:0009986) |
| 0.0 | 1.1 | GO:0005844 | polysome(GO:0005844) |
| 0.0 | 0.5 | GO:0031011 | Ino80 complex(GO:0031011) DNA helicase complex(GO:0033202) |
| 0.0 | 6.3 | GO:0000151 | ubiquitin ligase complex(GO:0000151) |
| 0.0 | 5.7 | GO:0019866 | organelle inner membrane(GO:0019866) |
| 0.0 | 1.5 | GO:0032580 | Golgi cisterna membrane(GO:0032580) |
Gene overrepresentation in molecular function category:
| Log-likelihood per target | Total log-likelihood | Term | Description |
|---|---|---|---|
| 17.4 | 52.1 | GO:0004998 | transferrin receptor activity(GO:0004998) |
| 15.6 | 187.1 | GO:1990247 | N6-methyladenosine-containing RNA binding(GO:1990247) |
| 14.8 | 44.4 | GO:0098808 | mRNA cap binding(GO:0098808) |
| 13.3 | 40.0 | GO:1990050 | phosphatidic acid transporter activity(GO:1990050) |
| 12.3 | 36.8 | GO:0043739 | G/U mismatch-specific uracil-DNA glycosylase activity(GO:0043739) |
| 11.1 | 100.1 | GO:0050145 | nucleoside phosphate kinase activity(GO:0050145) |
| 11.1 | 44.2 | GO:0016230 | sphingomyelin phosphodiesterase activator activity(GO:0016230) |
| 10.8 | 43.1 | GO:0042282 | hydroxymethylglutaryl-CoA reductase (NADPH) activity(GO:0004420) hydroxymethylglutaryl-CoA reductase activity(GO:0042282) |
| 10.4 | 73.0 | GO:0034513 | box H/ACA snoRNA binding(GO:0034513) |
| 9.3 | 74.4 | GO:0004634 | phosphopyruvate hydratase activity(GO:0004634) |
| 9.1 | 27.3 | GO:0004582 | dolichyl-phosphate beta-D-mannosyltransferase activity(GO:0004582) |
| 8.9 | 35.5 | GO:0003938 | IMP dehydrogenase activity(GO:0003938) |
| 8.2 | 131.8 | GO:0001054 | RNA polymerase I activity(GO:0001054) |
| 7.8 | 219.4 | GO:0070003 | threonine-type endopeptidase activity(GO:0004298) threonine-type peptidase activity(GO:0070003) |
| 7.8 | 54.5 | GO:0019788 | NEDD8 transferase activity(GO:0019788) |
| 6.8 | 27.2 | GO:0070363 | mitochondrial light strand promoter sense binding(GO:0070363) |
| 6.6 | 59.6 | GO:0051575 | 5'-deoxyribose-5-phosphate lyase activity(GO:0051575) |
| 6.3 | 18.9 | GO:0005459 | UDP-galactose transmembrane transporter activity(GO:0005459) |
| 6.3 | 50.4 | GO:0008379 | thioredoxin peroxidase activity(GO:0008379) |
| 6.3 | 18.8 | GO:0035529 | NADH pyrophosphatase activity(GO:0035529) |
| 6.3 | 18.8 | GO:0030337 | DNA polymerase processivity factor activity(GO:0030337) |
| 6.1 | 18.4 | GO:0070259 | tyrosyl-DNA phosphodiesterase activity(GO:0070259) |
| 6.0 | 72.3 | GO:0008097 | 5S rRNA binding(GO:0008097) |
| 5.7 | 17.1 | GO:0000035 | acyl binding(GO:0000035) |
| 5.4 | 38.0 | GO:0015450 | P-P-bond-hydrolysis-driven protein transmembrane transporter activity(GO:0015450) |
| 5.3 | 21.1 | GO:0061731 | ribonucleoside-diphosphate reductase activity, thioredoxin disulfide as acceptor(GO:0004748) oxidoreductase activity, acting on CH or CH2 groups, disulfide as acceptor(GO:0016728) ribonucleoside-diphosphate reductase activity(GO:0061731) |
| 5.1 | 20.6 | GO:0016774 | phosphotransferase activity, carboxyl group as acceptor(GO:0016774) |
| 5.0 | 15.0 | GO:0016838 | carbon-oxygen lyase activity, acting on phosphates(GO:0016838) |
| 5.0 | 14.9 | GO:0000033 | alpha-1,3-mannosyltransferase activity(GO:0000033) |
| 4.6 | 13.9 | GO:0004418 | hydroxymethylbilane synthase activity(GO:0004418) |
| 4.6 | 13.8 | GO:0031403 | lithium ion binding(GO:0031403) |
| 4.6 | 13.7 | GO:0004357 | glutamate-cysteine ligase activity(GO:0004357) |
| 4.1 | 24.6 | GO:0034648 | histone demethylase activity (H3-dimethyl-K4 specific)(GO:0034648) |
| 4.1 | 20.4 | GO:0004066 | asparagine synthase (glutamine-hydrolyzing) activity(GO:0004066) |
| 4.1 | 24.5 | GO:0061665 | SUMO ligase activity(GO:0061665) |
| 4.0 | 40.0 | GO:0042731 | PH domain binding(GO:0042731) |
| 4.0 | 19.8 | GO:0017018 | myosin phosphatase activity(GO:0017018) |
| 3.6 | 21.3 | GO:1990446 | U1 snRNP binding(GO:1990446) |
| 3.5 | 10.6 | GO:0004056 | argininosuccinate lyase activity(GO:0004056) |
| 3.5 | 10.5 | GO:0030156 | benzodiazepine receptor binding(GO:0030156) |
| 3.5 | 17.4 | GO:0004176 | ATP-dependent peptidase activity(GO:0004176) |
| 3.4 | 17.1 | GO:0061649 | ubiquitinated histone binding(GO:0061649) |
| 3.3 | 20.1 | GO:0015093 | ferrous iron transmembrane transporter activity(GO:0015093) |
| 3.3 | 36.3 | GO:0016861 | intramolecular oxidoreductase activity, interconverting aldoses and ketoses(GO:0016861) |
| 3.3 | 19.5 | GO:0008821 | crossover junction endodeoxyribonuclease activity(GO:0008821) |
| 3.2 | 16.2 | GO:0004774 | succinate-CoA ligase activity(GO:0004774) |
| 3.2 | 22.5 | GO:0003689 | DNA clamp loader activity(GO:0003689) protein-DNA loading ATPase activity(GO:0033170) |
| 3.2 | 12.6 | GO:0042809 | vitamin D receptor binding(GO:0042809) |
| 3.1 | 12.4 | GO:0016509 | long-chain-3-hydroxyacyl-CoA dehydrogenase activity(GO:0016509) |
| 3.1 | 12.3 | GO:0035500 | MH2 domain binding(GO:0035500) |
| 3.0 | 9.1 | GO:0004307 | ethanolaminephosphotransferase activity(GO:0004307) |
| 2.9 | 29.0 | GO:0004579 | dolichyl-diphosphooligosaccharide-protein glycotransferase activity(GO:0004579) |
| 2.9 | 8.7 | GO:0008466 | glycogenin glucosyltransferase activity(GO:0008466) |
| 2.9 | 14.4 | GO:0000104 | succinate dehydrogenase activity(GO:0000104) |
| 2.9 | 62.7 | GO:0008649 | rRNA methyltransferase activity(GO:0008649) |
| 2.8 | 19.9 | GO:0030613 | oxidoreductase activity, acting on phosphorus or arsenic in donors(GO:0030613) oxidoreductase activity, acting on phosphorus or arsenic in donors, disulfide as acceptor(GO:0030614) |
| 2.8 | 28.1 | GO:0070569 | uridylyltransferase activity(GO:0070569) |
| 2.7 | 46.5 | GO:0003688 | DNA replication origin binding(GO:0003688) |
| 2.7 | 10.6 | GO:0004087 | carbamoyl-phosphate synthase (ammonia) activity(GO:0004087) carbamoyl-phosphate synthase (glutamine-hydrolyzing) activity(GO:0004088) |
| 2.6 | 23.8 | GO:0036402 | proteasome-activating ATPase activity(GO:0036402) |
| 2.6 | 23.2 | GO:0030621 | U4 snRNA binding(GO:0030621) |
| 2.6 | 7.7 | GO:0052795 | exo-alpha-(2->3)-sialidase activity(GO:0052794) exo-alpha-(2->6)-sialidase activity(GO:0052795) exo-alpha-(2->8)-sialidase activity(GO:0052796) |
| 2.5 | 22.8 | GO:0031730 | CCR5 chemokine receptor binding(GO:0031730) |
| 2.5 | 10.1 | GO:0032557 | pyrimidine nucleoside binding(GO:0001884) UTP binding(GO:0002134) pyrimidine ribonucleoside binding(GO:0032551) pyrimidine ribonucleotide binding(GO:0032557) |
| 2.4 | 14.4 | GO:0051032 | nucleic acid transmembrane transporter activity(GO:0051032) RNA transmembrane transporter activity(GO:0051033) |
| 2.4 | 16.7 | GO:0060698 | endoribonuclease inhibitor activity(GO:0060698) |
| 2.4 | 9.5 | GO:0016532 | superoxide dismutase copper chaperone activity(GO:0016532) |
| 2.3 | 14.1 | GO:0046979 | TAP2 binding(GO:0046979) |
| 2.2 | 36.9 | GO:0097602 | cullin family protein binding(GO:0097602) |
| 2.1 | 6.4 | GO:0050510 | N-acetylgalactosaminyl-proteoglycan 3-beta-glucuronosyltransferase activity(GO:0050510) |
| 2.1 | 40.0 | GO:0035613 | RNA stem-loop binding(GO:0035613) |
| 1.9 | 63.3 | GO:0070064 | proline-rich region binding(GO:0070064) |
| 1.9 | 1.9 | GO:0015616 | DNA translocase activity(GO:0015616) |
| 1.9 | 56.3 | GO:0070742 | C2H2 zinc finger domain binding(GO:0070742) |
| 1.9 | 71.3 | GO:0005540 | hyaluronic acid binding(GO:0005540) |
| 1.9 | 16.9 | GO:0000340 | RNA 7-methylguanosine cap binding(GO:0000340) |
| 1.8 | 48.1 | GO:0043021 | ribonucleoprotein complex binding(GO:0043021) |
| 1.8 | 5.5 | GO:0000253 | 3-keto sterol reductase activity(GO:0000253) |
| 1.8 | 77.3 | GO:0005487 | nucleocytoplasmic transporter activity(GO:0005487) |
| 1.7 | 40.0 | GO:0016876 | aminoacyl-tRNA ligase activity(GO:0004812) ligase activity, forming carbon-oxygen bonds(GO:0016875) ligase activity, forming aminoacyl-tRNA and related compounds(GO:0016876) |
| 1.7 | 34.7 | GO:0008603 | cAMP-dependent protein kinase regulator activity(GO:0008603) |
| 1.6 | 12.8 | GO:0015349 | thyroid hormone transmembrane transporter activity(GO:0015349) |
| 1.6 | 11.1 | GO:0016846 | carbon-sulfur lyase activity(GO:0016846) |
| 1.6 | 70.0 | GO:0046966 | thyroid hormone receptor binding(GO:0046966) |
| 1.6 | 6.3 | GO:0072320 | volume-sensitive chloride channel activity(GO:0072320) |
| 1.6 | 4.7 | GO:0055077 | gap junction hemi-channel activity(GO:0055077) |
| 1.6 | 31.5 | GO:0016881 | acid-amino acid ligase activity(GO:0016881) |
| 1.6 | 9.3 | GO:0005375 | copper ion transmembrane transporter activity(GO:0005375) |
| 1.5 | 21.1 | GO:0015095 | magnesium ion transmembrane transporter activity(GO:0015095) |
| 1.5 | 18.1 | GO:0070087 | chromo shadow domain binding(GO:0070087) |
| 1.5 | 6.0 | GO:0008311 | double-stranded DNA 3'-5' exodeoxyribonuclease activity(GO:0008311) |
| 1.5 | 20.6 | GO:0016273 | arginine N-methyltransferase activity(GO:0016273) protein-arginine N-methyltransferase activity(GO:0016274) |
| 1.4 | 21.7 | GO:0008327 | methyl-CpG binding(GO:0008327) |
| 1.4 | 50.7 | GO:0001671 | ATPase activator activity(GO:0001671) |
| 1.4 | 5.7 | GO:0033265 | choline binding(GO:0033265) |
| 1.4 | 5.5 | GO:0008475 | procollagen-lysine 5-dioxygenase activity(GO:0008475) procollagen glucosyltransferase activity(GO:0033823) procollagen galactosyltransferase activity(GO:0050211) |
| 1.4 | 6.8 | GO:0004167 | dopachrome isomerase activity(GO:0004167) |
| 1.3 | 10.6 | GO:0009922 | fatty acid elongase activity(GO:0009922) 3-oxo-arachidoyl-CoA synthase activity(GO:0102336) 3-oxo-cerotoyl-CoA synthase activity(GO:0102337) 3-oxo-lignoceronyl-CoA synthase activity(GO:0102338) |
| 1.3 | 28.9 | GO:0008242 | omega peptidase activity(GO:0008242) |
| 1.3 | 19.1 | GO:0008517 | folic acid transporter activity(GO:0008517) |
| 1.2 | 9.7 | GO:0050833 | pyruvate transmembrane transporter activity(GO:0050833) |
| 1.2 | 26.4 | GO:0016832 | aldehyde-lyase activity(GO:0016832) |
| 1.2 | 14.0 | GO:0016174 | NAD(P)H oxidase activity(GO:0016174) |
| 1.2 | 6.9 | GO:0048408 | epidermal growth factor binding(GO:0048408) |
| 1.1 | 41.4 | GO:0044183 | protein binding involved in protein folding(GO:0044183) |
| 1.1 | 14.6 | GO:0015037 | peptide disulfide oxidoreductase activity(GO:0015037) |
| 1.1 | 233.7 | GO:0003735 | structural constituent of ribosome(GO:0003735) |
| 1.1 | 6.7 | GO:0046975 | histone methyltransferase activity (H3-K36 specific)(GO:0046975) |
| 1.1 | 3.3 | GO:0070644 | vitamin D response element binding(GO:0070644) |
| 1.1 | 5.6 | GO:0004920 | interleukin-10 receptor activity(GO:0004920) |
| 1.1 | 9.9 | GO:0045545 | syndecan binding(GO:0045545) |
| 1.1 | 27.2 | GO:0102391 | decanoate--CoA ligase activity(GO:0102391) |
| 1.1 | 30.4 | GO:0008574 | ATP-dependent microtubule motor activity, plus-end-directed(GO:0008574) |
| 1.0 | 23.8 | GO:0035615 | clathrin adaptor activity(GO:0035615) endocytic adaptor activity(GO:0098748) |
| 1.0 | 6.2 | GO:0017150 | tRNA dihydrouridine synthase activity(GO:0017150) |
| 1.0 | 11.2 | GO:0003906 | DNA-(apurinic or apyrimidinic site) lyase activity(GO:0003906) |
| 1.0 | 14.2 | GO:0003680 | AT DNA binding(GO:0003680) |
| 1.0 | 19.2 | GO:0042609 | CD4 receptor binding(GO:0042609) |
| 1.0 | 8.0 | GO:0008121 | ubiquinol-cytochrome-c reductase activity(GO:0008121) oxidoreductase activity, acting on diphenols and related substances as donors, cytochrome as acceptor(GO:0016681) |
| 1.0 | 3.0 | GO:0061752 | telomeric repeat-containing RNA binding(GO:0061752) |
| 1.0 | 5.0 | GO:0016427 | tRNA (cytosine) methyltransferase activity(GO:0016427) |
| 1.0 | 4.9 | GO:0016882 | cyclo-ligase activity(GO:0016882) |
| 0.9 | 3.7 | GO:0004739 | pyruvate dehydrogenase (acetyl-transferring) activity(GO:0004739) |
| 0.9 | 57.4 | GO:0003724 | RNA helicase activity(GO:0003724) ATP-dependent RNA helicase activity(GO:0004004) RNA-dependent ATPase activity(GO:0008186) |
| 0.9 | 15.7 | GO:0004861 | cyclin-dependent protein serine/threonine kinase inhibitor activity(GO:0004861) |
| 0.9 | 16.6 | GO:0031996 | thioesterase binding(GO:0031996) |
| 0.9 | 47.4 | GO:0048487 | beta-tubulin binding(GO:0048487) |
| 0.9 | 43.6 | GO:0004693 | cyclin-dependent protein serine/threonine kinase activity(GO:0004693) |
| 0.9 | 3.5 | GO:0045127 | N-acetylglucosamine kinase activity(GO:0045127) |
| 0.9 | 20.7 | GO:0051430 | corticotropin-releasing hormone receptor binding(GO:0051429) corticotropin-releasing hormone receptor 1 binding(GO:0051430) |
| 0.9 | 15.5 | GO:0004535 | poly(A)-specific ribonuclease activity(GO:0004535) |
| 0.8 | 36.8 | GO:0061631 | ubiquitin conjugating enzyme activity(GO:0061631) |
| 0.8 | 8.1 | GO:0008312 | 7S RNA binding(GO:0008312) |
| 0.8 | 7.2 | GO:0001609 | G-protein coupled adenosine receptor activity(GO:0001609) type 5 metabotropic glutamate receptor binding(GO:0031802) |
| 0.8 | 18.3 | GO:0016505 | peptidase activator activity involved in apoptotic process(GO:0016505) |
| 0.8 | 17.4 | GO:0008353 | RNA polymerase II carboxy-terminal domain kinase activity(GO:0008353) |
| 0.8 | 24.9 | GO:0070182 | DNA polymerase binding(GO:0070182) |
| 0.8 | 6.2 | GO:0030292 | protein tyrosine kinase inhibitor activity(GO:0030292) |
| 0.7 | 8.2 | GO:0000774 | adenyl-nucleotide exchange factor activity(GO:0000774) |
| 0.7 | 7.1 | GO:0008296 | 3'-5'-exodeoxyribonuclease activity(GO:0008296) |
| 0.7 | 5.0 | GO:0015187 | glycine transmembrane transporter activity(GO:0015187) |
| 0.7 | 9.9 | GO:1990381 | ubiquitin-specific protease binding(GO:1990381) |
| 0.7 | 52.7 | GO:0019003 | GDP binding(GO:0019003) |
| 0.7 | 19.7 | GO:0016676 | cytochrome-c oxidase activity(GO:0004129) heme-copper terminal oxidase activity(GO:0015002) oxidoreductase activity, acting on a heme group of donors, oxygen as acceptor(GO:0016676) |
| 0.7 | 10.7 | GO:0048027 | mRNA 5'-UTR binding(GO:0048027) |
| 0.7 | 15.8 | GO:0051010 | microtubule plus-end binding(GO:0051010) |
| 0.6 | 11.0 | GO:0016780 | phosphotransferase activity, for other substituted phosphate groups(GO:0016780) |
| 0.6 | 1.9 | GO:0050567 | glutaminyl-tRNA synthase (glutamine-hydrolyzing) activity(GO:0050567) |
| 0.6 | 41.2 | GO:0016763 | transferase activity, transferring pentosyl groups(GO:0016763) |
| 0.6 | 6.1 | GO:0001222 | transcription corepressor binding(GO:0001222) |
| 0.6 | 9.3 | GO:0004028 | 3-chloroallyl aldehyde dehydrogenase activity(GO:0004028) |
| 0.6 | 17.5 | GO:0031492 | nucleosomal DNA binding(GO:0031492) |
| 0.6 | 2.3 | GO:0004768 | stearoyl-CoA 9-desaturase activity(GO:0004768) acyl-CoA desaturase activity(GO:0016215) |
| 0.6 | 7.9 | GO:0004559 | alpha-mannosidase activity(GO:0004559) |
| 0.5 | 21.8 | GO:0051721 | protein phosphatase 2A binding(GO:0051721) |
| 0.5 | 42.2 | GO:0009055 | electron carrier activity(GO:0009055) |
| 0.5 | 3.8 | GO:0016167 | glial cell-derived neurotrophic factor receptor activity(GO:0016167) |
| 0.5 | 6.4 | GO:0038132 | neuregulin binding(GO:0038132) |
| 0.5 | 1.6 | GO:0080101 | phosphatidyl-N-methylethanolamine N-methyltransferase activity(GO:0000773) phosphatidylethanolamine N-methyltransferase activity(GO:0004608) phosphatidyl-N-dimethylethanolamine N-methyltransferase activity(GO:0080101) |
| 0.5 | 11.0 | GO:0052629 | phosphatidylinositol-3,5-bisphosphate 3-phosphatase activity(GO:0052629) |
| 0.5 | 4.5 | GO:0017176 | phosphatidylinositol N-acetylglucosaminyltransferase activity(GO:0017176) |
| 0.5 | 1.5 | GO:0016419 | [acyl-carrier-protein] S-malonyltransferase activity(GO:0004314) S-malonyltransferase activity(GO:0016419) malonyltransferase activity(GO:0016420) |
| 0.5 | 15.2 | GO:0070717 | poly-purine tract binding(GO:0070717) |
| 0.5 | 7.8 | GO:0019966 | interleukin-1 binding(GO:0019966) |
| 0.5 | 22.6 | GO:0042169 | SH2 domain binding(GO:0042169) |
| 0.5 | 2.8 | GO:0009378 | four-way junction helicase activity(GO:0009378) |
| 0.5 | 3.7 | GO:0000268 | peroxisome targeting sequence binding(GO:0000268) |
| 0.4 | 2.7 | GO:1990226 | histone methyltransferase binding(GO:1990226) |
| 0.4 | 28.3 | GO:0003743 | translation initiation factor activity(GO:0003743) |
| 0.4 | 7.6 | GO:0019992 | diacylglycerol binding(GO:0019992) |
| 0.4 | 21.7 | GO:0017112 | Rab guanyl-nucleotide exchange factor activity(GO:0017112) |
| 0.4 | 2.8 | GO:0001517 | N-acetylglucosamine 6-O-sulfotransferase activity(GO:0001517) |
| 0.4 | 9.9 | GO:0042974 | retinoic acid receptor binding(GO:0042974) |
| 0.4 | 14.5 | GO:0008536 | Ran GTPase binding(GO:0008536) |
| 0.4 | 8.2 | GO:0019843 | rRNA binding(GO:0019843) |
| 0.4 | 5.2 | GO:0000175 | 3'-5'-exoribonuclease activity(GO:0000175) |
| 0.4 | 7.9 | GO:0005092 | GDP-dissociation inhibitor activity(GO:0005092) |
| 0.3 | 5.4 | GO:1901612 | cardiolipin binding(GO:1901612) |
| 0.3 | 5.7 | GO:0009931 | calcium-dependent protein serine/threonine kinase activity(GO:0009931) |
| 0.3 | 7.5 | GO:0005537 | mannose binding(GO:0005537) |
| 0.3 | 5.5 | GO:0030881 | beta-2-microglobulin binding(GO:0030881) |
| 0.3 | 7.4 | GO:0070577 | lysine-acetylated histone binding(GO:0070577) |
| 0.3 | 25.6 | GO:0001158 | enhancer sequence-specific DNA binding(GO:0001158) |
| 0.3 | 16.3 | GO:0030374 | ligand-dependent nuclear receptor transcription coactivator activity(GO:0030374) |
| 0.3 | 2.7 | GO:0047623 | AMP deaminase activity(GO:0003876) adenosine-phosphate deaminase activity(GO:0047623) |
| 0.3 | 3.6 | GO:0010314 | phosphatidylinositol-5-phosphate binding(GO:0010314) |
| 0.3 | 10.3 | GO:0008135 | translation factor activity, RNA binding(GO:0008135) |
| 0.3 | 2.3 | GO:0015194 | L-serine transmembrane transporter activity(GO:0015194) serine transmembrane transporter activity(GO:0022889) |
| 0.3 | 5.1 | GO:0016018 | cyclosporin A binding(GO:0016018) |
| 0.3 | 27.4 | GO:0033613 | activating transcription factor binding(GO:0033613) |
| 0.3 | 8.8 | GO:0017091 | AU-rich element binding(GO:0017091) |
| 0.3 | 2.7 | GO:0008139 | nuclear localization sequence binding(GO:0008139) |
| 0.3 | 7.8 | GO:0017075 | syntaxin-1 binding(GO:0017075) |
| 0.3 | 10.3 | GO:0019213 | deacetylase activity(GO:0019213) |
| 0.3 | 18.0 | GO:0004869 | cysteine-type endopeptidase inhibitor activity(GO:0004869) |
| 0.3 | 7.8 | GO:0016667 | oxidoreductase activity, acting on a sulfur group of donors(GO:0016667) |
| 0.2 | 1.4 | GO:0019531 | oxalate transmembrane transporter activity(GO:0019531) |
| 0.2 | 6.4 | GO:0031624 | ubiquitin conjugating enzyme binding(GO:0031624) |
| 0.2 | 73.7 | GO:0005525 | GTP binding(GO:0005525) |
| 0.2 | 5.5 | GO:0051059 | NF-kappaB binding(GO:0051059) |
| 0.2 | 1.6 | GO:0030160 | GKAP/Homer scaffold activity(GO:0030160) |
| 0.2 | 13.5 | GO:0015485 | cholesterol binding(GO:0015485) |
| 0.2 | 6.7 | GO:0030544 | Hsp70 protein binding(GO:0030544) |
| 0.2 | 1.5 | GO:0071933 | Arp2/3 complex binding(GO:0071933) |
| 0.2 | 3.2 | GO:0043225 | anion transmembrane-transporting ATPase activity(GO:0043225) |
| 0.2 | 35.9 | GO:0001047 | core promoter binding(GO:0001047) |
| 0.2 | 0.6 | GO:0008670 | 2,4-dienoyl-CoA reductase (NADPH) activity(GO:0008670) trans-2-enoyl-CoA reductase (NADPH) activity(GO:0019166) |
| 0.2 | 4.5 | GO:0004003 | ATP-dependent DNA helicase activity(GO:0004003) |
| 0.2 | 9.1 | GO:0035035 | histone acetyltransferase binding(GO:0035035) |
| 0.2 | 23.0 | GO:0001618 | virus receptor activity(GO:0001618) |
| 0.2 | 3.0 | GO:0005095 | GTPase inhibitor activity(GO:0005095) |
| 0.2 | 2.3 | GO:0043422 | protein kinase B binding(GO:0043422) |
| 0.2 | 1.0 | GO:0004809 | tRNA (guanine-N2-)-methyltransferase activity(GO:0004809) |
| 0.2 | 5.5 | GO:0017134 | fibroblast growth factor binding(GO:0017134) |
| 0.2 | 1.3 | GO:0001165 | RNA polymerase I upstream control element sequence-specific DNA binding(GO:0001165) |
| 0.2 | 14.0 | GO:0016765 | transferase activity, transferring alkyl or aryl (other than methyl) groups(GO:0016765) |
| 0.2 | 1.4 | GO:0060002 | plus-end directed microfilament motor activity(GO:0060002) |
| 0.2 | 37.2 | GO:0008017 | microtubule binding(GO:0008017) |
| 0.2 | 8.4 | GO:0031593 | polyubiquitin binding(GO:0031593) |
| 0.2 | 12.0 | GO:0035064 | methylated histone binding(GO:0035064) |
| 0.2 | 2.4 | GO:0005132 | type I interferon receptor binding(GO:0005132) |
| 0.1 | 11.3 | GO:0016776 | phosphotransferase activity, phosphate group as acceptor(GO:0016776) |
| 0.1 | 20.2 | GO:0005200 | structural constituent of cytoskeleton(GO:0005200) |
| 0.1 | 0.7 | GO:0004427 | inorganic diphosphatase activity(GO:0004427) |
| 0.1 | 6.3 | GO:0030145 | manganese ion binding(GO:0030145) |
| 0.1 | 163.6 | GO:0003723 | RNA binding(GO:0003723) |
| 0.1 | 5.9 | GO:0008138 | protein tyrosine/serine/threonine phosphatase activity(GO:0008138) |
| 0.1 | 7.4 | GO:0097110 | scaffold protein binding(GO:0097110) |
| 0.1 | 1.3 | GO:0030331 | estrogen receptor binding(GO:0030331) |
| 0.1 | 0.3 | GO:0047238 | glucuronylgalactosylproteoglycan 4-beta-N-acetylgalactosaminyltransferase activity(GO:0047237) glucuronosyl-N-acetylgalactosaminyl-proteoglycan 4-beta-N-acetylgalactosaminyltransferase activity(GO:0047238) |
| 0.1 | 1.0 | GO:0032190 | acrosin binding(GO:0032190) |
| 0.1 | 2.0 | GO:0004185 | serine-type carboxypeptidase activity(GO:0004185) |
| 0.1 | 3.3 | GO:0005154 | epidermal growth factor receptor binding(GO:0005154) |
| 0.1 | 8.4 | GO:0004984 | olfactory receptor activity(GO:0004984) |
| 0.1 | 11.2 | GO:0008237 | metallopeptidase activity(GO:0008237) |
| 0.1 | 22.8 | GO:0000978 | RNA polymerase II core promoter proximal region sequence-specific DNA binding(GO:0000978) |
| 0.0 | 1.2 | GO:0004012 | phospholipid-translocating ATPase activity(GO:0004012) |
| 0.0 | 0.2 | GO:0050693 | LBD domain binding(GO:0050693) |
| 0.0 | 2.5 | GO:0034987 | immunoglobulin receptor binding(GO:0034987) |
| 0.0 | 0.2 | GO:0008553 | hydrogen-exporting ATPase activity, phosphorylative mechanism(GO:0008553) |
| 0.0 | 1.3 | GO:0003707 | steroid hormone receptor activity(GO:0003707) |
| 0.0 | 1.6 | GO:0048306 | calcium-dependent protein binding(GO:0048306) |
| 0.0 | 4.4 | GO:0061630 | ubiquitin protein ligase activity(GO:0061630) |
| 0.0 | 4.1 | GO:0016247 | channel regulator activity(GO:0016247) |
| 0.0 | 0.1 | GO:0045503 | dynein light chain binding(GO:0045503) |
Gene overrepresentation in curated gene sets: canonical pathways category:
| Log-likelihood per target | Total log-likelihood | Term | Description |
|---|---|---|---|
| 3.6 | 182.4 | PID MYC PATHWAY | C-MYC pathway |
| 2.1 | 249.9 | PID MYC ACTIV PATHWAY | Validated targets of C-MYC transcriptional activation |
| 2.1 | 22.8 | ST IL 13 PATHWAY | Interleukin 13 (IL-13) Pathway |
| 1.9 | 188.5 | PID TELOMERASE PATHWAY | Regulation of Telomerase |
| 1.6 | 110.7 | PID P53 REGULATION PATHWAY | p53 pathway |
| 1.5 | 41.5 | PID ERB GENOMIC PATHWAY | Validated nuclear estrogen receptor beta network |
| 1.5 | 54.7 | PID FANCONI PATHWAY | Fanconi anemia pathway |
| 1.5 | 103.3 | PID PLK1 PATHWAY | PLK1 signaling events |
| 1.3 | 42.9 | PID FOXM1 PATHWAY | FOXM1 transcription factor network |
| 1.2 | 17.4 | PID CIRCADIAN PATHWAY | Circadian rhythm pathway |
| 1.0 | 24.2 | PID ATR PATHWAY | ATR signaling pathway |
| 0.8 | 27.0 | PID INSULIN GLUCOSE PATHWAY | Insulin-mediated glucose transport |
| 0.8 | 49.7 | ST B CELL ANTIGEN RECEPTOR | B Cell Antigen Receptor |
| 0.8 | 18.8 | PID BARD1 PATHWAY | BARD1 signaling events |
| 0.7 | 29.0 | PID AURORA B PATHWAY | Aurora B signaling |
| 0.6 | 11.6 | PID RANBP2 PATHWAY | Sumoylation by RanBP2 regulates transcriptional repression |
| 0.5 | 15.8 | PID RETINOIC ACID PATHWAY | Retinoic acid receptors-mediated signaling |
| 0.5 | 9.1 | PID P38 MK2 PATHWAY | p38 signaling mediated by MAPKAP kinases |
| 0.5 | 7.8 | ST PHOSPHOINOSITIDE 3 KINASE PATHWAY | PI3K Pathway |
| 0.5 | 13.8 | PID IL2 PI3K PATHWAY | IL2 signaling events mediated by PI3K |
| 0.5 | 19.8 | PID FOXO PATHWAY | FoxO family signaling |
| 0.5 | 13.7 | PID PRL SIGNALING EVENTS PATHWAY | Signaling events mediated by PRL |
| 0.5 | 6.4 | PID INTEGRIN4 PATHWAY | Alpha6 beta4 integrin-ligand interactions |
| 0.5 | 17.2 | PID SYNDECAN 2 PATHWAY | Syndecan-2-mediated signaling events |
| 0.4 | 41.1 | PID TRKR PATHWAY | Neurotrophic factor-mediated Trk receptor signaling |
| 0.4 | 12.9 | PID ERBB1 INTERNALIZATION PATHWAY | Internalization of ErbB1 |
| 0.4 | 13.6 | PID CD40 PATHWAY | CD40/CD40L signaling |
| 0.4 | 25.2 | PID INTEGRIN A4B1 PATHWAY | Alpha4 beta1 integrin signaling events |
| 0.4 | 22.3 | PID LKB1 PATHWAY | LKB1 signaling events |
| 0.3 | 17.0 | PID TAP63 PATHWAY | Validated transcriptional targets of TAp63 isoforms |
| 0.3 | 15.8 | PID AR TF PATHWAY | Regulation of Androgen receptor activity |
| 0.3 | 15.4 | PID CERAMIDE PATHWAY | Ceramide signaling pathway |
| 0.3 | 14.4 | PID E2F PATHWAY | E2F transcription factor network |
| 0.3 | 9.2 | PID HIF2PATHWAY | HIF-2-alpha transcription factor network |
| 0.2 | 4.7 | PID HIF1A PATHWAY | Hypoxic and oxygen homeostasis regulation of HIF-1-alpha |
| 0.2 | 9.5 | PID ALPHA SYNUCLEIN PATHWAY | Alpha-synuclein signaling |
| 0.2 | 7.9 | SIG REGULATION OF THE ACTIN CYTOSKELETON BY RHO GTPASES | Genes related to regulation of the actin cytoskeleton |
| 0.2 | 5.7 | ST WNT BETA CATENIN PATHWAY | Wnt/beta-catenin Pathway |
| 0.2 | 9.9 | ST FAS SIGNALING PATHWAY | Fas Signaling Pathway |
| 0.2 | 27.0 | PID P53 DOWNSTREAM PATHWAY | Direct p53 effectors |
| 0.2 | 10.9 | PID NOTCH PATHWAY | Notch signaling pathway |
| 0.2 | 6.1 | PID IL6 7 PATHWAY | IL6-mediated signaling events |
| 0.2 | 4.0 | PID VEGFR1 2 PATHWAY | Signaling events mediated by VEGFR1 and VEGFR2 |
| 0.2 | 3.8 | PID RET PATHWAY | Signaling events regulated by Ret tyrosine kinase |
| 0.2 | 6.7 | PID P73PATHWAY | p73 transcription factor network |
| 0.2 | 12.6 | WNT SIGNALING | Genes related to Wnt-mediated signal transduction |
| 0.1 | 6.2 | PID NCADHERIN PATHWAY | N-cadherin signaling events |
| 0.1 | 7.3 | PID ILK PATHWAY | Integrin-linked kinase signaling |
| 0.1 | 5.5 | PID CD8 TCR PATHWAY | TCR signaling in naïve CD8+ T cells |
| 0.1 | 4.2 | PID BCR 5PATHWAY | BCR signaling pathway |
| 0.1 | 5.8 | PID CMYB PATHWAY | C-MYB transcription factor network |
| 0.1 | 6.1 | PID MYC REPRESS PATHWAY | Validated targets of C-MYC transcriptional repression |
| 0.1 | 3.3 | PID ERA GENOMIC PATHWAY | Validated nuclear estrogen receptor alpha network |
| 0.1 | 1.4 | PID NETRIN PATHWAY | Netrin-mediated signaling events |
| 0.0 | 0.4 | SIG CD40PATHWAYMAP | Genes related to CD40 signaling |
| 0.0 | 1.5 | PID ARF6 PATHWAY | Arf6 signaling events |
Gene overrepresentation in curated gene sets: REACTOME pathways category:
| Log-likelihood per target | Total log-likelihood | Term | Description |
|---|---|---|---|
| 5.9 | 124.4 | REACTOME RNA POL III CHAIN ELONGATION | Genes involved in RNA Polymerase III Chain Elongation |
| 4.0 | 32.3 | REACTOME REGULATION OF THE FANCONI ANEMIA PATHWAY | Genes involved in Regulation of the Fanconi anemia pathway |
| 3.8 | 7.7 | REACTOME CDK MEDIATED PHOSPHORYLATION AND REMOVAL OF CDC6 | Genes involved in CDK-mediated phosphorylation and removal of Cdc6 |
| 3.8 | 57.0 | REACTOME SLBP DEPENDENT PROCESSING OF REPLICATION DEPENDENT HISTONE PRE MRNAS | Genes involved in SLBP Dependent Processing of Replication-Dependent Histone Pre-mRNAs |
| 3.6 | 253.6 | REACTOME VIF MEDIATED DEGRADATION OF APOBEC3G | Genes involved in Vif-mediated degradation of APOBEC3G |
| 3.1 | 108.4 | REACTOME RNA POL II TRANSCRIPTION PRE INITIATION AND PROMOTER OPENING | Genes involved in RNA Polymerase II Transcription Pre-Initiation And Promoter Opening |
| 3.1 | 49.3 | REACTOME VITAMIN B5 PANTOTHENATE METABOLISM | Genes involved in Vitamin B5 (pantothenate) metabolism |
| 3.0 | 71.3 | REACTOME HYALURONAN UPTAKE AND DEGRADATION | Genes involved in Hyaluronan uptake and degradation |
| 2.7 | 43.3 | REACTOME POL SWITCHING | Genes involved in Polymerase switching |
| 2.7 | 40.4 | REACTOME PURINE RIBONUCLEOSIDE MONOPHOSPHATE BIOSYNTHESIS | Genes involved in Purine ribonucleoside monophosphate biosynthesis |
| 2.5 | 91.5 | REACTOME REGULATION OF GLUCOKINASE BY GLUCOKINASE REGULATORY PROTEIN | Genes involved in Regulation of Glucokinase by Glucokinase Regulatory Protein |
| 2.5 | 37.0 | REACTOME UNWINDING OF DNA | Genes involved in Unwinding of DNA |
| 2.4 | 45.9 | REACTOME MRNA DECAY BY 5 TO 3 EXORIBONUCLEASE | Genes involved in mRNA Decay by 5' to 3' Exoribonuclease |
| 2.4 | 48.1 | REACTOME BASE FREE SUGAR PHOSPHATE REMOVAL VIA THE SINGLE NUCLEOTIDE REPLACEMENT PATHWAY | Genes involved in Base-free sugar-phosphate removal via the single-nucleotide replacement pathway |
| 2.3 | 67.6 | REACTOME APC C CDC20 MEDIATED DEGRADATION OF MITOTIC PROTEINS | Genes involved in APC/C:Cdc20 mediated degradation of mitotic proteins |
| 2.3 | 70.3 | REACTOME MRNA SPLICING MINOR PATHWAY | Genes involved in mRNA Splicing - Minor Pathway |
| 2.1 | 45.7 | REACTOME EXTENSION OF TELOMERES | Genes involved in Extension of Telomeres |
| 2.1 | 70.6 | REACTOME G2 M CHECKPOINTS | Genes involved in G2/M Checkpoints |
| 2.0 | 37.9 | REACTOME INTEGRATION OF PROVIRUS | Genes involved in Integration of provirus |
| 1.9 | 37.7 | REACTOME METABOLISM OF POLYAMINES | Genes involved in Metabolism of polyamines |
| 1.9 | 189.1 | REACTOME INFLUENZA VIRAL RNA TRANSCRIPTION AND REPLICATION | Genes involved in Influenza Viral RNA Transcription and Replication |
| 1.8 | 201.6 | REACTOME MRNA SPLICING | Genes involved in mRNA Splicing |
| 1.8 | 19.6 | REACTOME ENDOSOMAL VACUOLAR PATHWAY | Genes involved in Endosomal/Vacuolar pathway |
| 1.8 | 130.0 | REACTOME FORMATION OF THE TERNARY COMPLEX AND SUBSEQUENTLY THE 43S COMPLEX | Genes involved in Formation of the ternary complex, and subsequently, the 43S complex |
| 1.7 | 27.7 | REACTOME MITOCHONDRIAL TRNA AMINOACYLATION | Genes involved in Mitochondrial tRNA aminoacylation |
| 1.7 | 35.2 | REACTOME ENDOSOMAL SORTING COMPLEX REQUIRED FOR TRANSPORT ESCRT | Genes involved in Endosomal Sorting Complex Required For Transport (ESCRT) |
| 1.6 | 30.2 | REACTOME SYNTHESIS SECRETION AND DEACYLATION OF GHRELIN | Genes involved in Synthesis, Secretion, and Deacylation of Ghrelin |
| 1.5 | 55.2 | REACTOME DEADENYLATION OF MRNA | Genes involved in Deadenylation of mRNA |
| 1.5 | 45.2 | REACTOME TRANSFERRIN ENDOCYTOSIS AND RECYCLING | Genes involved in Transferrin endocytosis and recycling |
| 1.5 | 59.9 | REACTOME CHOLESTEROL BIOSYNTHESIS | Genes involved in Cholesterol biosynthesis |
| 1.5 | 35.9 | REACTOME PURINE SALVAGE | Genes involved in Purine salvage |
| 1.5 | 32.4 | REACTOME KINESINS | Genes involved in Kinesins |
| 1.5 | 13.1 | REACTOME RNA POL III TRANSCRIPTION INITIATION FROM TYPE 3 PROMOTER | Genes involved in RNA Polymerase III Transcription Initiation From Type 3 Promoter |
| 1.4 | 39.0 | REACTOME AMINO ACID SYNTHESIS AND INTERCONVERSION TRANSAMINATION | Genes involved in Amino acid synthesis and interconversion (transamination) |
| 1.4 | 134.2 | REACTOME MITOTIC PROMETAPHASE | Genes involved in Mitotic Prometaphase |
| 1.4 | 35.4 | REACTOME PROTEOLYTIC CLEAVAGE OF SNARE COMPLEX PROTEINS | Genes involved in Proteolytic cleavage of SNARE complex proteins |
| 1.3 | 22.8 | REACTOME IL 6 SIGNALING | Genes involved in Interleukin-6 signaling |
| 1.3 | 64.0 | REACTOME GLYCOLYSIS | Genes involved in Glycolysis |
| 1.2 | 41.1 | REACTOME POST TRANSLATIONAL MODIFICATION SYNTHESIS OF GPI ANCHORED PROTEINS | Genes involved in Post-translational modification: synthesis of GPI-anchored proteins |
| 1.2 | 37.8 | REACTOME SYNTHESIS OF VERY LONG CHAIN FATTY ACYL COAS | Genes involved in Synthesis of very long-chain fatty acyl-CoAs |
| 1.2 | 19.9 | REACTOME FORMATION OF INCISION COMPLEX IN GG NER | Genes involved in Formation of incision complex in GG-NER |
| 1.2 | 99.3 | REACTOME RESPIRATORY ELECTRON TRANSPORT | Genes involved in Respiratory electron transport |
| 1.2 | 47.6 | REACTOME PREFOLDIN MEDIATED TRANSFER OF SUBSTRATE TO CCT TRIC | Genes involved in Prefoldin mediated transfer of substrate to CCT/TriC |
| 1.1 | 31.1 | REACTOME OXYGEN DEPENDENT PROLINE HYDROXYLATION OF HYPOXIA INDUCIBLE FACTOR ALPHA | Genes involved in Oxygen-dependent Proline Hydroxylation of Hypoxia-inducible Factor Alpha |
| 1.0 | 8.6 | REACTOME ER PHAGOSOME PATHWAY | Genes involved in ER-Phagosome pathway |
| 1.0 | 23.8 | REACTOME REGULATION OF COMPLEMENT CASCADE | Genes involved in Regulation of Complement cascade |
| 0.9 | 15.5 | REACTOME CITRIC ACID CYCLE TCA CYCLE | Genes involved in Citric acid cycle (TCA cycle) |
| 0.8 | 19.1 | REACTOME SIGNALLING TO P38 VIA RIT AND RIN | Genes involved in Signalling to p38 via RIT and RIN |
| 0.8 | 17.1 | REACTOME RETROGRADE NEUROTROPHIN SIGNALLING | Genes involved in Retrograde neurotrophin signalling |
| 0.8 | 26.5 | REACTOME SYNTHESIS AND INTERCONVERSION OF NUCLEOTIDE DI AND TRIPHOSPHATES | Genes involved in Synthesis and interconversion of nucleotide di- and triphosphates |
| 0.7 | 5.9 | REACTOME PACKAGING OF TELOMERE ENDS | Genes involved in Packaging Of Telomere Ends |
| 0.7 | 12.4 | REACTOME MITOCHONDRIAL FATTY ACID BETA OXIDATION | Genes involved in Mitochondrial Fatty Acid Beta-Oxidation |
| 0.7 | 19.3 | REACTOME MEIOTIC RECOMBINATION | Genes involved in Meiotic Recombination |
| 0.7 | 46.0 | REACTOME REGULATION OF INSULIN SECRETION BY GLUCAGON LIKE PEPTIDE1 | Genes involved in Regulation of Insulin Secretion by Glucagon-like Peptide-1 |
| 0.7 | 12.8 | REACTOME TRANSPORT OF ORGANIC ANIONS | Genes involved in Transport of organic anions |
| 0.6 | 5.8 | REACTOME IRAK1 RECRUITS IKK COMPLEX | Genes involved in IRAK1 recruits IKK complex |
| 0.6 | 18.7 | REACTOME CYCLIN E ASSOCIATED EVENTS DURING G1 S TRANSITION | Genes involved in Cyclin E associated events during G1/S transition |
| 0.6 | 19.8 | REACTOME HORMONE SENSITIVE LIPASE HSL MEDIATED TRIACYLGLYCEROL HYDROLYSIS | Genes involved in Hormone-sensitive lipase (HSL)-mediated triacylglycerol hydrolysis |
| 0.6 | 12.9 | REACTOME SIGNALING BY CONSTITUTIVELY ACTIVE EGFR | Genes involved in Signaling by constitutively active EGFR |
| 0.6 | 10.0 | REACTOME NOTCH HLH TRANSCRIPTION PATHWAY | Genes involved in Notch-HLH transcription pathway |
| 0.5 | 14.0 | REACTOME SIGNALING BY HIPPO | Genes involved in Signaling by Hippo |
| 0.5 | 20.2 | REACTOME PYRIMIDINE METABOLISM | Genes involved in Pyrimidine metabolism |
| 0.5 | 5.7 | REACTOME CREATION OF C4 AND C2 ACTIVATORS | Genes involved in Creation of C4 and C2 activators |
| 0.5 | 9.4 | REACTOME REGULATION OF RHEB GTPASE ACTIVITY BY AMPK | Genes involved in Regulation of Rheb GTPase activity by AMPK |
| 0.5 | 23.3 | REACTOME ANTIVIRAL MECHANISM BY IFN STIMULATED GENES | Genes involved in Antiviral mechanism by IFN-stimulated genes |
| 0.5 | 13.9 | REACTOME METABOLISM OF PORPHYRINS | Genes involved in Metabolism of porphyrins |
| 0.5 | 15.7 | REACTOME G1 PHASE | Genes involved in G1 Phase |
| 0.4 | 8.4 | REACTOME TETRAHYDROBIOPTERIN BH4 SYNTHESIS RECYCLING SALVAGE AND REGULATION | Genes involved in Tetrahydrobiopterin (BH4) synthesis, recycling, salvage and regulation |
| 0.4 | 4.0 | REACTOME DOUBLE STRAND BREAK REPAIR | Genes involved in Double-Strand Break Repair |
| 0.4 | 8.7 | REACTOME GLYCOGEN BREAKDOWN GLYCOGENOLYSIS | Genes involved in Glycogen breakdown (glycogenolysis) |
| 0.4 | 64.6 | REACTOME ANTIGEN PROCESSING UBIQUITINATION PROTEASOME DEGRADATION | Genes involved in Antigen processing: Ubiquitination & Proteasome degradation |
| 0.4 | 24.9 | REACTOME MITOCHONDRIAL PROTEIN IMPORT | Genes involved in Mitochondrial Protein Import |
| 0.4 | 5.7 | REACTOME SIGNALING BY WNT | Genes involved in Signaling by Wnt |
| 0.4 | 13.7 | REACTOME GLUTATHIONE CONJUGATION | Genes involved in Glutathione conjugation |
| 0.3 | 5.5 | REACTOME N GLYCAN TRIMMING IN THE ER AND CALNEXIN CALRETICULIN CYCLE | Genes involved in N-glycan trimming in the ER and Calnexin/Calreticulin cycle |
| 0.3 | 13.4 | REACTOME RNA POL I RNA POL III AND MITOCHONDRIAL TRANSCRIPTION | Genes involved in RNA Polymerase I, RNA Polymerase III, and Mitochondrial Transcription |
| 0.3 | 7.2 | REACTOME METAL ION SLC TRANSPORTERS | Genes involved in Metal ion SLC transporters |
| 0.3 | 4.7 | REACTOME THE NLRP3 INFLAMMASOME | Genes involved in The NLRP3 inflammasome |
| 0.3 | 7.2 | REACTOME NUCLEOTIDE LIKE PURINERGIC RECEPTORS | Genes involved in Nucleotide-like (purinergic) receptors |
| 0.3 | 11.0 | REACTOME SYNTHESIS OF PIPS AT THE PLASMA MEMBRANE | Genes involved in Synthesis of PIPs at the plasma membrane |
| 0.2 | 5.7 | REACTOME P38MAPK EVENTS | Genes involved in p38MAPK events |
| 0.2 | 3.7 | REACTOME REGULATION OF PYRUVATE DEHYDROGENASE PDH COMPLEX | Genes involved in Regulation of pyruvate dehydrogenase (PDH) complex |
| 0.2 | 7.3 | REACTOME CELL EXTRACELLULAR MATRIX INTERACTIONS | Genes involved in Cell-extracellular matrix interactions |
| 0.2 | 6.8 | REACTOME CHONDROITIN SULFATE BIOSYNTHESIS | Genes involved in Chondroitin sulfate biosynthesis |
| 0.2 | 7.5 | REACTOME LYSOSOME VESICLE BIOGENESIS | Genes involved in Lysosome Vesicle Biogenesis |
| 0.2 | 2.3 | REACTOME ALPHA LINOLENIC ACID ALA METABOLISM | Genes involved in alpha-linolenic acid (ALA) metabolism |
| 0.2 | 3.1 | REACTOME NONSENSE MEDIATED DECAY ENHANCED BY THE EXON JUNCTION COMPLEX | Genes involved in Nonsense Mediated Decay Enhanced by the Exon Junction Complex |
| 0.2 | 6.1 | REACTOME SPHINGOLIPID DE NOVO BIOSYNTHESIS | Genes involved in Sphingolipid de novo biosynthesis |
| 0.2 | 2.7 | REACTOME ASSOCIATION OF TRIC CCT WITH TARGET PROTEINS DURING BIOSYNTHESIS | Genes involved in Association of TriC/CCT with target proteins during biosynthesis |
| 0.2 | 14.7 | REACTOME ASPARAGINE N LINKED GLYCOSYLATION | Genes involved in Asparagine N-linked glycosylation |
| 0.1 | 2.1 | REACTOME REGULATION OF SIGNALING BY CBL | Genes involved in Regulation of signaling by CBL |
| 0.1 | 6.8 | REACTOME METABOLISM OF VITAMINS AND COFACTORS | Genes involved in Metabolism of vitamins and cofactors |
| 0.1 | 2.8 | REACTOME KERATAN SULFATE BIOSYNTHESIS | Genes involved in Keratan sulfate biosynthesis |
| 0.1 | 2.4 | REACTOME REGULATION OF IFNA SIGNALING | Genes involved in Regulation of IFNA signaling |
| 0.1 | 8.4 | REACTOME OLFACTORY SIGNALING PATHWAY | Genes involved in Olfactory Signaling Pathway |
| 0.1 | 3.1 | REACTOME EFFECTS OF PIP2 HYDROLYSIS | Genes involved in Effects of PIP2 hydrolysis |
| 0.1 | 0.3 | REACTOME CIRCADIAN REPRESSION OF EXPRESSION BY REV ERBA | Genes involved in Circadian Repression of Expression by REV-ERBA |
| 0.1 | 2.8 | REACTOME COLLAGEN FORMATION | Genes involved in Collagen formation |
| 0.1 | 3.3 | REACTOME MYOGENESIS | Genes involved in Myogenesis |
| 0.1 | 6.8 | REACTOME L1CAM INTERACTIONS | Genes involved in L1CAM interactions |
| 0.1 | 3.8 | REACTOME NCAM1 INTERACTIONS | Genes involved in NCAM1 interactions |
| 0.0 | 1.3 | REACTOME SYNTHESIS OF PC | Genes involved in Synthesis of PC |
| 0.0 | 3.8 | REACTOME TRANSCRIPTIONAL REGULATION OF WHITE ADIPOCYTE DIFFERENTIATION | Genes involved in Transcriptional Regulation of White Adipocyte Differentiation |
| 0.0 | 1.4 | REACTOME NETRIN1 SIGNALING | Genes involved in Netrin-1 signaling |
| 0.0 | 1.2 | REACTOME ION TRANSPORT BY P TYPE ATPASES | Genes involved in Ion transport by P-type ATPases |
| 0.0 | 3.6 | REACTOME SIGNALING BY RHO GTPASES | Genes involved in Signaling by Rho GTPases |