Project
GNF SymAtlas + NCI-60 cancer cell lines, human (Su, 2004; Ross, 2000)
Navigation
Downloads
Results for GSC_GSC2
Z-value: 0.89
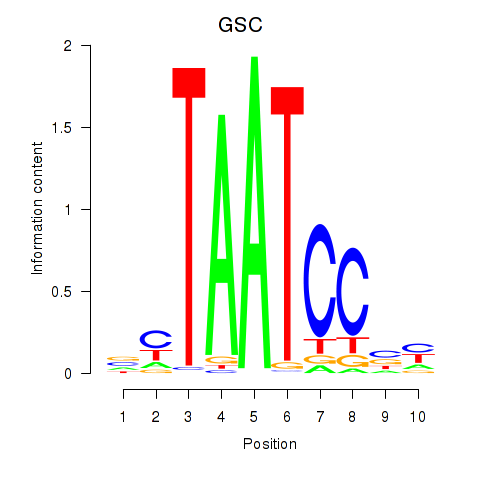
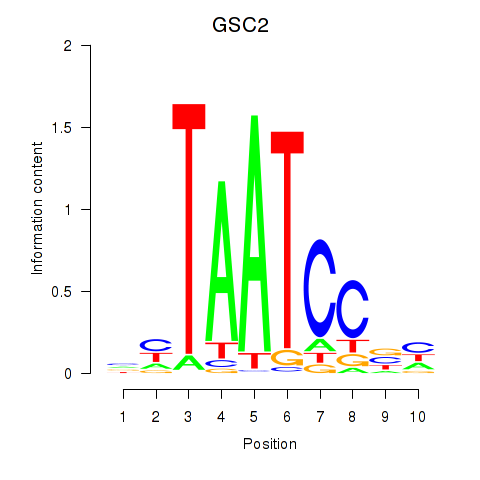
Motif logo
Transcription factors associated with GSC_GSC2
| Gene Symbol | Gene ID | Gene Info |
|---|---|---|
|
GSC
|
ENSG00000133937.5 | GSC |
|
GSC2
|
ENSG00000063515.3 | GSC2 |
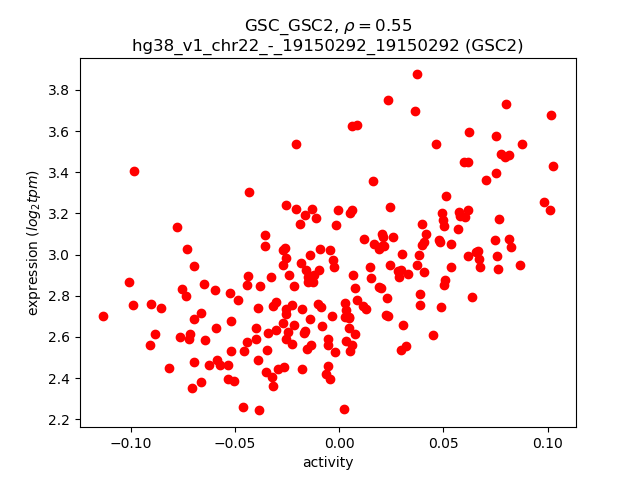
Activity-expression correlation:
| Gene | Promoter | Pearson corr. coef. | P-value | Plot |
|---|---|---|---|---|
| GSC2 | hg38_v1_chr22_-_19150292_19150292 | 0.55 | 1.3e-18 | Click! |
Activity profile of GSC_GSC2 motif
Sorted Z-values of GSC_GSC2 motif
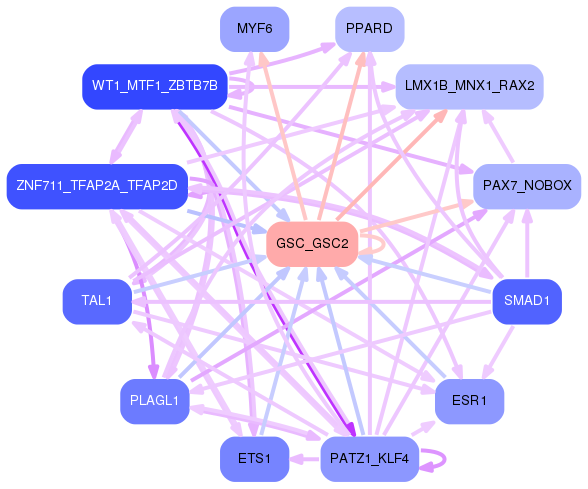
Network of associatons between targets according to the STRING database.

First level regulatory network of GSC_GSC2
| Promoter | Score | Transcript | Gene | Gene Info |
|---|---|---|---|---|
| chr17_-_55511434 | 40.68 |
ENST00000636752.1
|
SMIM36
|
small integral membrane protein 36 |
| chr2_-_174847015 | 29.18 |
ENST00000650938.1
|
CHN1
|
chimerin 1 |
| chr2_-_174846405 | 24.66 |
ENST00000409597.5
ENST00000413882.6 |
CHN1
|
chimerin 1 |
| chr20_+_35968566 | 19.23 |
ENST00000373973.7
ENST00000349339.5 ENST00000489667.1 ENST00000538900.1 |
CNBD2
|
cyclic nucleotide binding domain containing 2 |
| chr11_-_111923722 | 17.00 |
ENST00000527950.5
|
CRYAB
|
crystallin alpha B |
| chr4_+_153222402 | 16.78 |
ENST00000676335.1
ENST00000675146.1 |
TRIM2
|
tripartite motif containing 2 |
| chr11_-_111912871 | 14.36 |
ENST00000528628.5
|
CRYAB
|
crystallin alpha B |
| chr4_+_153222307 | 13.33 |
ENST00000675899.1
ENST00000675611.1 ENST00000674872.1 ENST00000676167.1 |
TRIM2
|
tripartite motif containing 2 |
| chr12_-_54588516 | 13.17 |
ENST00000547431.5
|
PPP1R1A
|
protein phosphatase 1 regulatory inhibitor subunit 1A |
| chr2_-_55269038 | 12.93 |
ENST00000417363.5
ENST00000412530.1 ENST00000366137.6 ENST00000420637.5 |
MTIF2
|
mitochondrial translational initiation factor 2 |
| chr7_+_29122274 | 9.47 |
ENST00000582692.2
ENST00000644824.1 |
ENSG00000285412.1
ENSG00000285162.1
|
novel transcript, antisense to CPVL chimerin 2 |
| chr19_-_3772211 | 9.42 |
ENST00000555978.5
ENST00000555633.3 |
RAX2
|
retina and anterior neural fold homeobox 2 |
| chr9_+_100442271 | 9.30 |
ENST00000502978.1
|
MSANTD3-TMEFF1
|
MSANTD3-TMEFF1 readthrough |
| chrX_+_101078861 | 9.26 |
ENST00000372930.5
|
TMEM35A
|
transmembrane protein 35A |
| chr7_-_98252117 | 9.18 |
ENST00000420697.1
ENST00000415086.5 ENST00000447648.7 |
TECPR1
|
tectonin beta-propeller repeat containing 1 |
| chr1_+_20070156 | 8.86 |
ENST00000375108.4
|
PLA2G5
|
phospholipase A2 group V |
| chr11_+_61755372 | 8.68 |
ENST00000265460.9
|
MYRF
|
myelin regulatory factor |
| chr17_-_28576882 | 8.47 |
ENST00000395319.7
ENST00000581807.5 ENST00000226253.9 ENST00000584086.5 ENST00000395321.6 |
ALDOC
|
aldolase, fructose-bisphosphate C |
| chr19_-_35757009 | 8.42 |
ENST00000587965.1
ENST00000004982.6 |
HSPB6
|
heat shock protein family B (small) member 6 |
| chr3_-_10505508 | 8.33 |
ENST00000643662.1
ENST00000397077.6 ENST00000360273.7 |
ATP2B2
|
ATPase plasma membrane Ca2+ transporting 2 |
| chrX_-_6228835 | 8.18 |
ENST00000381095.8
|
NLGN4X
|
neuroligin 4 X-linked |
| chr10_-_102418748 | 7.78 |
ENST00000020673.6
|
PSD
|
pleckstrin and Sec7 domain containing |
| chr18_-_66604076 | 7.22 |
ENST00000540086.5
ENST00000580157.2 ENST00000262150.7 |
CDH19
|
cadherin 19 |
| chr19_+_7914823 | 7.11 |
ENST00000565886.2
|
TGFBR3L
|
transforming growth factor beta receptor 3 like |
| chr11_+_76445001 | 6.95 |
ENST00000533988.5
ENST00000524490.5 ENST00000334736.7 ENST00000533972.5 |
EMSY
|
EMSY transcriptional repressor, BRCA2 interacting |
| chr11_+_67455352 | 6.92 |
ENST00000325656.7
|
CABP4
|
calcium binding protein 4 |
| chr14_-_100568475 | 6.88 |
ENST00000553553.6
|
BEGAIN
|
brain enriched guanylate kinase associated |
| chr9_+_17135017 | 6.74 |
ENST00000380641.4
ENST00000380647.8 |
CNTLN
|
centlein |
| chr3_-_170908626 | 6.11 |
ENST00000295822.7
ENST00000474096.5 |
EIF5A2
|
eukaryotic translation initiation factor 5A2 |
| chr3_-_98522514 | 6.03 |
ENST00000503004.5
ENST00000506575.1 ENST00000513452.5 ENST00000515620.5 |
CLDND1
|
claudin domain containing 1 |
| chr2_+_120013068 | 5.90 |
ENST00000443902.6
ENST00000263713.10 |
EPB41L5
|
erythrocyte membrane protein band 4.1 like 5 |
| chr12_-_54588636 | 5.74 |
ENST00000257905.13
|
PPP1R1A
|
protein phosphatase 1 regulatory inhibitor subunit 1A |
| chrX_+_136197020 | 5.64 |
ENST00000370676.7
|
FHL1
|
four and a half LIM domains 1 |
| chr14_-_100568070 | 5.64 |
ENST00000557378.6
ENST00000443071.6 ENST00000637646.1 |
BEGAIN
|
brain enriched guanylate kinase associated |
| chr19_-_12723925 | 5.63 |
ENST00000425528.6
ENST00000589337.5 ENST00000588216.5 |
TNPO2
|
transportin 2 |
| chr5_+_141489066 | 5.62 |
ENST00000252087.3
|
PCDHGC5
|
protocadherin gamma subfamily C, 5 |
| chr5_+_161848112 | 5.56 |
ENST00000393943.10
|
GABRA1
|
gamma-aminobutyric acid type A receptor subunit alpha1 |
| chr6_+_35342614 | 5.54 |
ENST00000337400.6
ENST00000311565.4 |
PPARD
|
peroxisome proliferator activated receptor delta |
| chr17_-_42112674 | 5.53 |
ENST00000251642.8
ENST00000591220.5 |
DHX58
|
DExH-box helicase 58 |
| chr16_-_275908 | 5.51 |
ENST00000359740.6
ENST00000316163.9 ENST00000397770.8 |
RGS11
|
regulator of G protein signaling 11 |
| chr2_+_172928165 | 5.38 |
ENST00000535187.5
|
RAPGEF4
|
Rap guanine nucleotide exchange factor 4 |
| chr5_-_147081428 | 4.93 |
ENST00000394413.7
|
PPP2R2B
|
protein phosphatase 2 regulatory subunit Bbeta |
| chr19_-_48044037 | 4.86 |
ENST00000293255.3
|
CABP5
|
calcium binding protein 5 |
| chr11_-_63015831 | 4.77 |
ENST00000430500.6
ENST00000336232.7 |
SLC22A8
|
solute carrier family 22 member 8 |
| chr12_+_77830886 | 4.73 |
ENST00000397909.7
ENST00000549464.5 |
NAV3
|
neuron navigator 3 |
| chr16_-_68236069 | 4.62 |
ENST00000473183.7
ENST00000565858.5 |
ESRP2
|
epithelial splicing regulatory protein 2 |
| chr17_+_46590669 | 4.61 |
ENST00000398238.8
|
NSF
|
N-ethylmaleimide sensitive factor, vesicle fusing ATPase |
| chr5_-_178996184 | 4.40 |
ENST00000650031.1
|
GRM6
|
glutamate metabotropic receptor 6 |
| chr2_-_70553638 | 4.28 |
ENST00000444975.5
ENST00000445399.5 ENST00000295400.11 ENST00000418333.6 |
TGFA
|
transforming growth factor alpha |
| chr5_+_161848314 | 4.23 |
ENST00000437025.6
|
GABRA1
|
gamma-aminobutyric acid type A receptor subunit alpha1 |
| chrX_+_12137409 | 4.20 |
ENST00000672010.1
|
FRMPD4
|
FERM and PDZ domain containing 4 |
| chr11_-_70717994 | 4.17 |
ENST00000659264.1
|
SHANK2
|
SH3 and multiple ankyrin repeat domains 2 |
| chr10_+_100462969 | 4.13 |
ENST00000343737.6
|
WNT8B
|
Wnt family member 8B |
| chr8_-_132111159 | 4.06 |
ENST00000673615.1
ENST00000434736.6 |
HHLA1
|
HERV-H LTR-associating 1 |
| chr5_-_149944744 | 4.06 |
ENST00000255266.10
ENST00000617647.4 ENST00000613228.1 |
PDE6A
|
phosphodiesterase 6A |
| chr5_-_33984636 | 3.92 |
ENST00000382102.7
ENST00000509381.1 |
SLC45A2
|
solute carrier family 45 member 2 |
| chr7_+_138797952 | 3.81 |
ENST00000397602.7
ENST00000442682.7 ENST00000458494.1 ENST00000413208.1 |
TMEM213
|
transmembrane protein 213 |
| chr17_+_49575828 | 3.79 |
ENST00000328741.6
|
NXPH3
|
neurexophilin 3 |
| chr11_-_62984957 | 3.77 |
ENST00000377871.7
ENST00000360421.9 |
SLC22A6
|
solute carrier family 22 member 6 |
| chr2_-_240820945 | 3.75 |
ENST00000428768.2
ENST00000650053.1 ENST00000650130.1 |
KIF1A
|
kinesin family member 1A |
| chr4_+_70028452 | 3.69 |
ENST00000530128.5
ENST00000381057.3 ENST00000673563.1 |
HTN3
|
histatin 3 |
| chr15_+_64460728 | 3.68 |
ENST00000416172.1
|
ZNF609
|
zinc finger protein 609 |
| chr15_-_26939518 | 3.68 |
ENST00000541819.6
|
GABRB3
|
gamma-aminobutyric acid type A receptor subunit beta3 |
| chr19_-_49017087 | 3.49 |
ENST00000649238.3
|
LHB
|
luteinizing hormone subunit beta |
| chr19_-_42427379 | 3.48 |
ENST00000244289.9
|
LIPE
|
lipase E, hormone sensitive type |
| chr17_-_9905248 | 3.41 |
ENST00000226193.6
|
RCVRN
|
recoverin |
| chr1_+_113905156 | 3.40 |
ENST00000650596.1
|
DCLRE1B
|
DNA cross-link repair 1B |
| chr6_+_35342535 | 3.39 |
ENST00000360694.8
ENST00000418635.6 ENST00000448077.6 |
PPARD
|
peroxisome proliferator activated receptor delta |
| chr7_-_128775793 | 3.33 |
ENST00000249389.3
|
OPN1SW
|
opsin 1, short wave sensitive |
| chr13_+_73058993 | 3.32 |
ENST00000377687.6
|
KLF5
|
Kruppel like factor 5 |
| chr10_-_75109172 | 3.22 |
ENST00000372700.7
ENST00000473072.2 ENST00000491677.6 ENST00000372702.7 |
DUSP13
|
dual specificity phosphatase 13 |
| chr5_-_147081462 | 3.14 |
ENST00000508267.5
ENST00000504198.5 |
PPP2R2B
|
protein phosphatase 2 regulatory subunit Bbeta |
| chr3_-_49021045 | 3.12 |
ENST00000440857.5
|
DALRD3
|
DALR anticodon binding domain containing 3 |
| chr10_-_75109085 | 2.89 |
ENST00000607131.5
|
DUSP13
|
dual specificity phosphatase 13 |
| chrX_-_139642835 | 2.84 |
ENST00000536274.5
|
MCF2
|
MCF.2 cell line derived transforming sequence |
| chr17_-_19748341 | 2.79 |
ENST00000395555.7
|
ALDH3A1
|
aldehyde dehydrogenase 3 family member A1 |
| chr1_+_16921923 | 2.79 |
ENST00000375541.10
|
CROCC
|
ciliary rootlet coiled-coil, rootletin |
| chr8_-_86743626 | 2.76 |
ENST00000320005.6
|
CNGB3
|
cyclic nucleotide gated channel subunit beta 3 |
| chr16_+_81238682 | 2.72 |
ENST00000258168.7
ENST00000564552.1 |
BCO1
|
beta-carotene oxygenase 1 |
| chr2_-_29921580 | 2.69 |
ENST00000389048.8
|
ALK
|
ALK receptor tyrosine kinase |
| chr12_-_96400067 | 2.69 |
ENST00000542666.5
|
CDK17
|
cyclin dependent kinase 17 |
| chr9_-_42129125 | 2.67 |
ENST00000617422.4
ENST00000612828.4 ENST00000341990.8 ENST00000377561.7 ENST00000276974.7 |
CNTNAP3B
|
contactin associated protein family member 3B |
| chrX_+_136196750 | 2.64 |
ENST00000539015.5
|
FHL1
|
four and a half LIM domains 1 |
| chr16_-_57971086 | 2.62 |
ENST00000564448.5
ENST00000311183.8 |
CNGB1
|
cyclic nucleotide gated channel subunit beta 1 |
| chr17_-_19748285 | 2.57 |
ENST00000570414.1
ENST00000225740.11 |
ALDH3A1
|
aldehyde dehydrogenase 3 family member A1 |
| chr6_+_31620701 | 2.50 |
ENST00000376033.3
ENST00000376007.8 |
PRRC2A
|
proline rich coiled-coil 2A |
| chr11_-_128842467 | 2.48 |
ENST00000392664.2
|
KCNJ1
|
potassium inwardly rectifying channel subfamily J member 1 |
| chr22_-_29267965 | 2.41 |
ENST00000216085.12
|
RHBDD3
|
rhomboid domain containing 3 |
| chrX_+_136197039 | 2.40 |
ENST00000370683.6
|
FHL1
|
four and a half LIM domains 1 |
| chrX_-_139642889 | 2.39 |
ENST00000370576.9
|
MCF2
|
MCF.2 cell line derived transforming sequence |
| chr17_-_19748355 | 2.37 |
ENST00000494157.6
|
ALDH3A1
|
aldehyde dehydrogenase 3 family member A1 |
| chr1_+_197268222 | 2.35 |
ENST00000367400.8
ENST00000638467.1 ENST00000367399.6 |
CRB1
|
crumbs cell polarity complex component 1 |
| chr12_-_13095664 | 2.30 |
ENST00000337630.10
ENST00000545699.1 |
GSG1
|
germ cell associated 1 |
| chr17_+_70104848 | 2.22 |
ENST00000392670.5
|
KCNJ16
|
potassium inwardly rectifying channel subfamily J member 16 |
| chr13_+_113667213 | 2.22 |
ENST00000335678.7
|
GRK1
|
G protein-coupled receptor kinase 1 |
| chr17_-_35560812 | 2.20 |
ENST00000674182.1
|
SLFN14
|
schlafen family member 14 |
| chr12_+_80707625 | 2.12 |
ENST00000228641.4
|
MYF6
|
myogenic factor 6 |
| chr15_+_64151706 | 2.10 |
ENST00000325881.9
|
SNX22
|
sorting nexin 22 |
| chr11_-_62984690 | 2.10 |
ENST00000421062.2
ENST00000458333.6 |
SLC22A6
|
solute carrier family 22 member 6 |
| chr18_-_26863187 | 2.09 |
ENST00000440832.7
|
AQP4
|
aquaporin 4 |
| chr22_+_29268316 | 2.01 |
ENST00000414183.6
ENST00000333395.10 ENST00000455726.5 ENST00000332035.10 |
EWSR1
|
EWS RNA binding protein 1 |
| chr3_+_1092654 | 1.99 |
ENST00000350110.2
|
CNTN6
|
contactin 6 |
| chr14_+_21317535 | 1.97 |
ENST00000382933.8
|
RPGRIP1
|
RPGR interacting protein 1 |
| chr15_-_43266857 | 1.88 |
ENST00000349114.8
ENST00000220420.10 |
TGM5
|
transglutaminase 5 |
| chr1_+_160343375 | 1.79 |
ENST00000294785.10
ENST00000421914.5 ENST00000438008.5 |
NCSTN
|
nicastrin |
| chr17_+_79024243 | 1.74 |
ENST00000311661.4
|
C1QTNF1
|
C1q and TNF related 1 |
| chr13_+_35476740 | 1.72 |
ENST00000537702.5
|
NBEA
|
neurobeachin |
| chr1_+_113905290 | 1.69 |
ENST00000650450.2
|
DCLRE1B
|
DNA cross-link repair 1B |
| chr3_+_1093002 | 1.68 |
ENST00000446702.7
|
CNTN6
|
contactin 6 |
| chr19_-_38849923 | 1.67 |
ENST00000601813.1
ENST00000221419.10 |
HNRNPL
|
heterogeneous nuclear ribonucleoprotein L |
| chr19_-_49057730 | 1.65 |
ENST00000684222.1
ENST00000596965.5 |
CGB7
|
chorionic gonadotropin subunit beta 7 |
| chr17_+_79024142 | 1.62 |
ENST00000579760.6
ENST00000339142.6 |
C1QTNF1
|
C1q and TNF related 1 |
| chr12_-_113136224 | 1.60 |
ENST00000546530.5
ENST00000261729.9 |
RASAL1
|
RAS protein activator like 1 |
| chr10_-_84241538 | 1.59 |
ENST00000372105.4
|
LRIT1
|
leucine rich repeat, Ig-like and transmembrane domains 1 |
| chr1_+_18630839 | 1.57 |
ENST00000420770.7
|
PAX7
|
paired box 7 |
| chr15_+_33310946 | 1.56 |
ENST00000415757.7
ENST00000634891.2 ENST00000389232.9 ENST00000622037.1 |
RYR3
|
ryanodine receptor 3 |
| chr16_-_57971121 | 1.56 |
ENST00000251102.13
|
CNGB1
|
cyclic nucleotide gated channel subunit beta 1 |
| chr19_+_3708378 | 1.55 |
ENST00000541714.7
ENST00000539908.6 |
TJP3
|
tight junction protein 3 |
| chr1_+_18631006 | 1.55 |
ENST00000375375.7
|
PAX7
|
paired box 7 |
| chr15_-_31161157 | 1.52 |
ENST00000542188.5
|
TRPM1
|
transient receptor potential cation channel subfamily M member 1 |
| chr12_-_13095628 | 1.50 |
ENST00000457134.6
ENST00000537302.5 |
GSG1
|
germ cell associated 1 |
| chr12_-_13095798 | 1.42 |
ENST00000396302.7
|
GSG1
|
germ cell associated 1 |
| chr6_-_41163103 | 1.40 |
ENST00000373122.8
ENST00000373113.8 |
TREM2
|
triggering receptor expressed on myeloid cells 2 |
| chr1_+_202462730 | 1.39 |
ENST00000290419.9
ENST00000491336.5 |
PPP1R12B
|
protein phosphatase 1 regulatory subunit 12B |
| chrX_+_15749848 | 1.39 |
ENST00000479740.5
ENST00000454127.2 |
CA5B
|
carbonic anhydrase 5B |
| chr14_-_24081928 | 1.37 |
ENST00000396995.1
|
NRL
|
neural retina leucine zipper |
| chr5_-_33984681 | 1.37 |
ENST00000296589.9
|
SLC45A2
|
solute carrier family 45 member 2 |
| chr6_-_70283105 | 1.34 |
ENST00000683980.1
|
COL9A1
|
collagen type IX alpha 1 chain |
| chr12_-_76878985 | 1.30 |
ENST00000547435.1
ENST00000552330.5 ENST00000311083.10 ENST00000546966.5 |
CSRP2
|
cysteine and glycine rich protein 2 |
| chrX_-_10620534 | 1.30 |
ENST00000317552.9
|
MID1
|
midline 1 |
| chr4_-_75902444 | 1.30 |
ENST00000286719.12
|
PPEF2
|
protein phosphatase with EF-hand domain 2 |
| chr14_+_58427686 | 1.28 |
ENST00000650904.1
ENST00000652326.2 ENST00000554463.5 ENST00000555833.5 |
KIAA0586
|
KIAA0586 |
| chrX_-_24647300 | 1.24 |
ENST00000379144.7
|
PCYT1B
|
phosphate cytidylyltransferase 1, choline, beta |
| chr1_-_21279520 | 1.21 |
ENST00000357071.8
|
ECE1
|
endothelin converting enzyme 1 |
| chr6_-_70283184 | 1.18 |
ENST00000320755.12
|
COL9A1
|
collagen type IX alpha 1 chain |
| chr7_-_138798188 | 1.15 |
ENST00000310018.7
|
ATP6V0A4
|
ATPase H+ transporting V0 subunit a4 |
| chr14_-_24081986 | 1.14 |
ENST00000560550.1
|
NRL
|
neural retina leucine zipper |
| chr22_-_30471986 | 1.12 |
ENST00000401751.5
ENST00000402286.5 ENST00000403066.5 ENST00000215812.9 |
SEC14L3
|
SEC14 like lipid binding 3 |
| chr12_+_53425070 | 1.10 |
ENST00000550839.1
|
AMHR2
|
anti-Mullerian hormone receptor type 2 |
| chr8_+_69466617 | 1.10 |
ENST00000525061.5
ENST00000260128.8 ENST00000458141.6 |
SULF1
|
sulfatase 1 |
| chr4_-_101347492 | 1.10 |
ENST00000394854.8
|
PPP3CA
|
protein phosphatase 3 catalytic subunit alpha |
| chr3_-_14178569 | 1.09 |
ENST00000285021.12
|
XPC
|
XPC complex subunit, DNA damage recognition and repair factor |
| chrX_-_10620419 | 1.05 |
ENST00000380782.6
|
MID1
|
midline 1 |
| chr11_-_126062782 | 1.01 |
ENST00000531738.6
|
CDON
|
cell adhesion associated, oncogene regulated |
| chr6_-_70283214 | 0.95 |
ENST00000683758.1
|
COL9A1
|
collagen type IX alpha 1 chain |
| chr17_+_17042433 | 0.95 |
ENST00000651222.2
|
MPRIP
|
myosin phosphatase Rho interacting protein |
| chr10_+_116590956 | 0.94 |
ENST00000358834.9
ENST00000528052.5 |
PNLIPRP1
|
pancreatic lipase related protein 1 |
| chr7_+_21428023 | 0.92 |
ENST00000432066.2
ENST00000222584.8 |
SP4
|
Sp4 transcription factor |
| chr7_-_138798104 | 0.90 |
ENST00000353492.4
|
ATP6V0A4
|
ATPase H+ transporting V0 subunit a4 |
| chr1_-_27604176 | 0.84 |
ENST00000642416.1
|
AHDC1
|
AT-hook DNA binding motif containing 1 |
| chr6_-_35512882 | 0.82 |
ENST00000229771.11
|
TULP1
|
TUB like protein 1 |
| chr2_+_127418420 | 0.77 |
ENST00000234071.8
ENST00000429925.5 ENST00000442644.5 |
PROC
|
protein C, inactivator of coagulation factors Va and VIIIa |
| chrX_+_66162663 | 0.72 |
ENST00000519389.6
|
HEPH
|
hephaestin |
| chr4_+_169620527 | 0.71 |
ENST00000360642.7
ENST00000512813.5 ENST00000513761.6 |
CLCN3
|
chloride voltage-gated channel 3 |
| chrX_+_41447322 | 0.70 |
ENST00000378220.2
ENST00000342595.2 |
NYX
|
nyctalopin |
| chr5_+_141213919 | 0.69 |
ENST00000341948.6
|
PCDHB13
|
protocadherin beta 13 |
| chr1_-_27604135 | 0.67 |
ENST00000673934.1
ENST00000642245.1 |
AHDC1
|
AT-hook DNA binding motif containing 1 |
| chrY_+_14522573 | 0.66 |
ENST00000643089.1
ENST00000382872.5 |
NLGN4Y
|
neuroligin 4 Y-linked |
| chr18_+_34710249 | 0.66 |
ENST00000680346.1
ENST00000348997.9 ENST00000681274.1 ENST00000680822.1 ENST00000680767.2 ENST00000597599.5 ENST00000444659.6 |
DTNA
|
dystrobrevin alpha |
| chr4_+_169620509 | 0.62 |
ENST00000347613.8
|
CLCN3
|
chloride voltage-gated channel 3 |
| chr19_-_51034993 | 0.54 |
ENST00000684732.1
|
KLK12
|
kallikrein related peptidase 12 |
| chr5_+_150508110 | 0.53 |
ENST00000261797.7
|
NDST1
|
N-deacetylase and N-sulfotransferase 1 |
| chr22_-_40533808 | 0.44 |
ENST00000422851.1
ENST00000651694.1 ENST00000652095.2 |
MRTFA
|
myocardin related transcription factor A |
| chr3_-_54928044 | 0.42 |
ENST00000273286.6
|
LRTM1
|
leucine rich repeats and transmembrane domains 1 |
| chr1_-_165445220 | 0.40 |
ENST00000619224.1
|
RXRG
|
retinoid X receptor gamma |
| chr1_-_47190013 | 0.36 |
ENST00000294338.7
|
PDZK1IP1
|
PDZK1 interacting protein 1 |
| chr5_+_134115563 | 0.34 |
ENST00000517851.5
ENST00000521639.5 ENST00000522375.5 ENST00000378560.8 ENST00000520958.5 ENST00000518915.5 ENST00000395023.5 |
TCF7
|
transcription factor 7 |
| chr4_+_125314918 | 0.33 |
ENST00000674496.2
ENST00000394329.9 |
FAT4
|
FAT atypical cadherin 4 |
| chr6_-_42722590 | 0.33 |
ENST00000230381.7
|
PRPH2
|
peripherin 2 |
| chr1_-_165445088 | 0.32 |
ENST00000359842.10
|
RXRG
|
retinoid X receptor gamma |
| chr17_+_40309161 | 0.30 |
ENST00000254066.10
|
RARA
|
retinoic acid receptor alpha |
| chr13_-_35476682 | 0.26 |
ENST00000379919.6
|
MAB21L1
|
mab-21 like 1 |
| chr19_+_47821907 | 0.24 |
ENST00000539067.5
ENST00000221996.12 ENST00000613299.1 |
CRX
|
cone-rod homeobox |
| chr5_+_42548043 | 0.24 |
ENST00000618088.4
ENST00000612382.4 |
GHR
|
growth hormone receptor |
| chr15_+_33310993 | 0.23 |
ENST00000634418.1
ENST00000634750.1 |
RYR3
|
ryanodine receptor 3 |
| chr1_+_171257930 | 0.18 |
ENST00000354841.4
|
FMO1
|
flavin containing dimethylaniline monoxygenase 1 |
| chr22_-_19150292 | 0.16 |
ENST00000086933.3
|
GSC2
|
goosecoid homeobox 2 |
| chr11_-_65857763 | 0.14 |
ENST00000531407.5
|
CFL1
|
cofilin 1 |
| chr6_-_35512863 | 0.14 |
ENST00000428978.1
ENST00000614066.4 ENST00000322263.8 |
TULP1
|
TUB like protein 1 |
| chr1_+_113979391 | 0.10 |
ENST00000393300.6
ENST00000369551.5 |
OLFML3
|
olfactomedin like 3 |
| chr18_+_8717371 | 0.09 |
ENST00000359865.7
|
MTCL1
|
microtubule crosslinking factor 1 |
| chr11_+_124865425 | 0.04 |
ENST00000397801.6
|
ROBO3
|
roundabout guidance receptor 3 |
| chr15_+_48206286 | 0.03 |
ENST00000396577.7
ENST00000380993.8 |
SLC12A1
|
solute carrier family 12 member 1 |
| chr1_+_113979460 | 0.03 |
ENST00000320334.5
|
OLFML3
|
olfactomedin like 3 |
| chr1_-_160343235 | 0.00 |
ENST00000368069.7
ENST00000241704.8 ENST00000647683.1 ENST00000649787.1 |
COPA
|
COPI coat complex subunit alpha |
| chr6_-_41163182 | 0.00 |
ENST00000338469.3
|
TREM2
|
triggering receptor expressed on myeloid cells 2 |
Gene Ontology Analysis
Gene overrepresentation in biological process category:
| Log-likelihood per target | Total log-likelihood | Term | Description |
|---|---|---|---|
| 2.2 | 8.9 | GO:0006663 | platelet activating factor biosynthetic process(GO:0006663) |
| 2.0 | 5.9 | GO:0008078 | mesodermal cell migration(GO:0008078) axial mesoderm morphogenesis(GO:0048319) |
| 1.8 | 31.4 | GO:0007021 | tubulin complex assembly(GO:0007021) |
| 1.5 | 53.8 | GO:0008045 | motor neuron axon guidance(GO:0008045) |
| 1.4 | 6.9 | GO:0060040 | retinal bipolar neuron differentiation(GO:0060040) |
| 1.4 | 5.5 | GO:0039534 | negative regulation of MDA-5 signaling pathway(GO:0039534) |
| 1.3 | 5.1 | GO:0031627 | telomeric loop formation(GO:0031627) |
| 1.2 | 5.9 | GO:0015742 | alpha-ketoglutarate transport(GO:0015742) |
| 1.0 | 3.1 | GO:0014813 | skeletal muscle satellite cell commitment(GO:0014813) |
| 1.0 | 8.8 | GO:2000288 | positive regulation of myoblast proliferation(GO:2000288) |
| 0.9 | 8.3 | GO:0032790 | ribosome disassembly(GO:0032790) |
| 0.9 | 8.8 | GO:0097105 | presynaptic membrane assembly(GO:0097105) |
| 0.9 | 8.7 | GO:0032286 | central nervous system myelin maintenance(GO:0032286) |
| 0.8 | 4.2 | GO:0051835 | positive regulation of synapse structural plasticity(GO:0051835) |
| 0.8 | 6.1 | GO:0006452 | translational frameshifting(GO:0006452) positive regulation of translational termination(GO:0045905) |
| 0.7 | 2.7 | GO:0036269 | swimming behavior(GO:0036269) |
| 0.7 | 3.4 | GO:2000860 | positive regulation of mineralocorticoid secretion(GO:2000857) positive regulation of aldosterone secretion(GO:2000860) |
| 0.6 | 3.7 | GO:2000291 | regulation of myoblast proliferation(GO:2000291) |
| 0.6 | 3.5 | GO:0046340 | diacylglycerol catabolic process(GO:0046340) |
| 0.6 | 9.5 | GO:0010457 | centriole-centriole cohesion(GO:0010457) |
| 0.5 | 2.5 | GO:0045872 | positive regulation of rhodopsin gene expression(GO:0045872) |
| 0.5 | 4.0 | GO:0071286 | cellular response to magnesium ion(GO:0071286) |
| 0.5 | 13.5 | GO:0071420 | cellular response to histamine(GO:0071420) |
| 0.5 | 3.5 | GO:0006701 | progesterone biosynthetic process(GO:0006701) |
| 0.5 | 9.5 | GO:0050962 | detection of light stimulus involved in visual perception(GO:0050908) detection of light stimulus involved in sensory perception(GO:0050962) |
| 0.5 | 8.5 | GO:0030388 | fructose 1,6-bisphosphate metabolic process(GO:0030388) |
| 0.5 | 1.4 | GO:0002585 | positive regulation of antigen processing and presentation of peptide or polysaccharide antigen via MHC class II(GO:0002582) positive regulation of antigen processing and presentation of peptide antigen(GO:0002585) positive regulation of antigen processing and presentation of peptide antigen via MHC class II(GO:0002588) |
| 0.4 | 3.3 | GO:0032534 | regulation of microvillus assembly(GO:0032534) |
| 0.4 | 2.4 | GO:0032815 | negative regulation of natural killer cell activation(GO:0032815) |
| 0.4 | 5.6 | GO:0006610 | ribosomal protein import into nucleus(GO:0006610) |
| 0.3 | 8.1 | GO:0070262 | peptidyl-serine dephosphorylation(GO:0070262) |
| 0.3 | 1.3 | GO:0048388 | endosomal lumen acidification(GO:0048388) |
| 0.3 | 4.1 | GO:0048263 | determination of dorsal identity(GO:0048263) |
| 0.3 | 7.8 | GO:0032012 | regulation of ARF protein signal transduction(GO:0032012) |
| 0.3 | 1.0 | GO:1905205 | positive regulation of connective tissue replacement(GO:1905205) |
| 0.3 | 0.8 | GO:0044537 | regulation of circulating fibrinogen levels(GO:0044537) |
| 0.3 | 8.4 | GO:0010667 | negative regulation of cardiac muscle cell apoptotic process(GO:0010667) |
| 0.3 | 1.0 | GO:0014816 | skeletal muscle satellite cell differentiation(GO:0014816) |
| 0.2 | 2.7 | GO:0006776 | vitamin A metabolic process(GO:0006776) |
| 0.2 | 3.4 | GO:0031284 | positive regulation of guanylate cyclase activity(GO:0031284) |
| 0.2 | 1.2 | GO:0010814 | substance P catabolic process(GO:0010814) calcitonin catabolic process(GO:0010816) endothelin maturation(GO:0034959) |
| 0.2 | 1.1 | GO:1902612 | regulation of anti-Mullerian hormone signaling pathway(GO:1902612) negative regulation of anti-Mullerian hormone signaling pathway(GO:1902613) anti-Mullerian hormone signaling pathway(GO:1990262) |
| 0.2 | 5.9 | GO:0022400 | regulation of rhodopsin mediated signaling pathway(GO:0022400) |
| 0.2 | 2.4 | GO:0035372 | protein localization to microtubule(GO:0035372) |
| 0.2 | 3.3 | GO:0018298 | protein-chromophore linkage(GO:0018298) |
| 0.2 | 2.1 | GO:0048743 | positive regulation of skeletal muscle fiber development(GO:0048743) |
| 0.2 | 5.2 | GO:0042462 | eye photoreceptor cell development(GO:0042462) |
| 0.2 | 4.6 | GO:0060445 | branching involved in salivary gland morphogenesis(GO:0060445) |
| 0.2 | 4.6 | GO:0001921 | positive regulation of receptor recycling(GO:0001921) |
| 0.2 | 2.1 | GO:0070070 | energy coupled proton transport, down electrochemical gradient(GO:0015985) ATP synthesis coupled proton transport(GO:0015986) proton-transporting V-type ATPase complex assembly(GO:0070070) vacuolar proton-transporting V-type ATPase complex assembly(GO:0070072) |
| 0.2 | 1.1 | GO:0060686 | negative regulation of prostatic bud formation(GO:0060686) |
| 0.2 | 18.9 | GO:0005977 | glycogen metabolic process(GO:0005977) |
| 0.1 | 4.8 | GO:0043252 | sodium-independent organic anion transport(GO:0043252) |
| 0.1 | 10.7 | GO:0003254 | regulation of membrane depolarization(GO:0003254) |
| 0.1 | 1.8 | GO:0007220 | Notch receptor processing(GO:0007220) |
| 0.1 | 4.2 | GO:0097352 | autophagosome maturation(GO:0097352) |
| 0.1 | 3.1 | GO:0006418 | tRNA aminoacylation for protein translation(GO:0006418) |
| 0.1 | 1.0 | GO:0006657 | CDP-choline pathway(GO:0006657) |
| 0.1 | 4.2 | GO:0060292 | long term synaptic depression(GO:0060292) |
| 0.1 | 3.7 | GO:0045747 | positive regulation of Notch signaling pathway(GO:0045747) |
| 0.1 | 3.7 | GO:0050832 | defense response to fungus(GO:0050832) |
| 0.1 | 0.3 | GO:0044336 | canonical Wnt signaling pathway involved in negative regulation of apoptotic process(GO:0044336) |
| 0.1 | 25.0 | GO:0043523 | regulation of neuron apoptotic process(GO:0043523) |
| 0.1 | 0.3 | GO:0072137 | condensed mesenchymal cell proliferation(GO:0072137) |
| 0.1 | 0.2 | GO:0046532 | regulation of photoreceptor cell differentiation(GO:0046532) |
| 0.1 | 13.5 | GO:0007156 | homophilic cell adhesion via plasma membrane adhesion molecules(GO:0007156) |
| 0.1 | 0.3 | GO:0060010 | Sertoli cell fate commitment(GO:0060010) |
| 0.1 | 3.2 | GO:0010107 | potassium ion import(GO:0010107) |
| 0.1 | 1.1 | GO:0031573 | intra-S DNA damage checkpoint(GO:0031573) |
| 0.1 | 1.6 | GO:1903861 | positive regulation of dendrite extension(GO:1903861) |
| 0.1 | 0.5 | GO:0015014 | protein sulfation(GO:0006477) heparan sulfate proteoglycan biosynthetic process, polysaccharide chain biosynthetic process(GO:0015014) |
| 0.1 | 5.4 | GO:0019933 | cAMP-mediated signaling(GO:0019933) |
| 0.1 | 8.2 | GO:1903779 | regulation of cardiac conduction(GO:1903779) |
| 0.1 | 10.8 | GO:0007601 | visual perception(GO:0007601) |
| 0.1 | 7.9 | GO:0006805 | xenobiotic metabolic process(GO:0006805) |
| 0.0 | 2.1 | GO:0003091 | renal water homeostasis(GO:0003091) |
| 0.0 | 1.9 | GO:0018149 | peptide cross-linking(GO:0018149) |
| 0.0 | 3.1 | GO:0007218 | neuropeptide signaling pathway(GO:0007218) |
| 0.0 | 19.6 | GO:0048232 | spermatogenesis(GO:0007283) male gamete generation(GO:0048232) |
| 0.0 | 0.2 | GO:0000255 | allantoin metabolic process(GO:0000255) |
| 0.0 | 1.4 | GO:0015701 | bicarbonate transport(GO:0015701) |
| 0.0 | 4.9 | GO:0035023 | regulation of Rho protein signal transduction(GO:0035023) |
| 0.0 | 0.7 | GO:0006825 | copper ion transport(GO:0006825) |
| 0.0 | 1.7 | GO:0000381 | regulation of alternative mRNA splicing, via spliceosome(GO:0000381) |
| 0.0 | 1.7 | GO:0007292 | female gamete generation(GO:0007292) |
| 0.0 | 0.7 | GO:1901522 | positive regulation of transcription from RNA polymerase II promoter involved in cellular response to chemical stimulus(GO:1901522) |
| 0.0 | 1.3 | GO:0007224 | smoothened signaling pathway(GO:0007224) |
Gene overrepresentation in cellular component category:
| Log-likelihood per target | Total log-likelihood | Term | Description |
|---|---|---|---|
| 2.0 | 31.4 | GO:0097512 | cardiac myofibril(GO:0097512) |
| 1.4 | 4.2 | GO:0017071 | intracellular cyclic nucleotide activated cation channel complex(GO:0017071) |
| 1.3 | 5.3 | GO:0035841 | new growing cell tip(GO:0035841) |
| 0.6 | 3.5 | GO:0005594 | collagen type IX trimer(GO:0005594) |
| 0.4 | 9.2 | GO:0097381 | photoreceptor disc membrane(GO:0097381) |
| 0.3 | 13.5 | GO:1902711 | GABA-A receptor complex(GO:1902711) |
| 0.3 | 1.1 | GO:0071942 | XPC complex(GO:0071942) |
| 0.3 | 4.2 | GO:0005883 | neurofilament(GO:0005883) |
| 0.3 | 1.8 | GO:0070765 | gamma-secretase complex(GO:0070765) |
| 0.3 | 9.2 | GO:0000421 | autophagosome membrane(GO:0000421) |
| 0.2 | 1.2 | GO:0031302 | intrinsic component of endosome membrane(GO:0031302) |
| 0.2 | 2.1 | GO:0000220 | vacuolar proton-transporting V-type ATPase, V0 domain(GO:0000220) |
| 0.2 | 8.1 | GO:0000159 | protein phosphatase type 2A complex(GO:0000159) |
| 0.2 | 2.8 | GO:0035253 | ciliary rootlet(GO:0035253) |
| 0.1 | 4.7 | GO:0005640 | nuclear outer membrane(GO:0005640) |
| 0.1 | 7.8 | GO:0097610 | cleavage furrow(GO:0032154) cell surface furrow(GO:0097610) |
| 0.1 | 8.5 | GO:1904724 | tertiary granule lumen(GO:1904724) |
| 0.1 | 1.6 | GO:0031235 | intrinsic component of the cytoplasmic side of the plasma membrane(GO:0031235) |
| 0.1 | 1.0 | GO:0005955 | calcineurin complex(GO:0005955) |
| 0.1 | 5.5 | GO:0005834 | heterotrimeric G-protein complex(GO:0005834) |
| 0.1 | 4.6 | GO:0043198 | dendritic shaft(GO:0043198) |
| 0.1 | 0.2 | GO:0070195 | growth hormone receptor complex(GO:0070195) |
| 0.1 | 6.9 | GO:0043195 | terminal bouton(GO:0043195) |
| 0.1 | 9.3 | GO:0005901 | caveola(GO:0005901) |
| 0.1 | 3.1 | GO:0001750 | photoreceptor outer segment(GO:0001750) |
| 0.1 | 2.0 | GO:0032391 | photoreceptor connecting cilium(GO:0032391) |
| 0.1 | 1.8 | GO:0001917 | photoreceptor inner segment(GO:0001917) |
| 0.1 | 5.0 | GO:0005778 | peroxisomal membrane(GO:0005778) microbody membrane(GO:0031903) |
| 0.1 | 6.3 | GO:0005814 | centriole(GO:0005814) |
| 0.1 | 6.1 | GO:0005643 | nuclear pore(GO:0005643) |
| 0.0 | 3.4 | GO:0005581 | collagen trimer(GO:0005581) |
| 0.0 | 2.3 | GO:0005902 | microvillus(GO:0005902) |
| 0.0 | 4.3 | GO:0005796 | Golgi lumen(GO:0005796) |
| 0.0 | 1.8 | GO:0033017 | sarcoplasmic reticulum membrane(GO:0033017) |
| 0.0 | 2.4 | GO:0005881 | cytoplasmic microtubule(GO:0005881) |
| 0.0 | 5.1 | GO:0032587 | ruffle membrane(GO:0032587) |
| 0.0 | 5.1 | GO:0000784 | nuclear chromosome, telomeric region(GO:0000784) |
| 0.0 | 4.2 | GO:0043197 | dendritic spine(GO:0043197) |
| 0.0 | 4.7 | GO:0008076 | voltage-gated potassium channel complex(GO:0008076) potassium channel complex(GO:0034705) |
| 0.0 | 6.8 | GO:0045211 | postsynaptic membrane(GO:0045211) |
| 0.0 | 1.4 | GO:0031672 | A band(GO:0031672) |
| 0.0 | 3.7 | GO:0031225 | anchored component of membrane(GO:0031225) |
| 0.0 | 3.4 | GO:0009897 | external side of plasma membrane(GO:0009897) |
| 0.0 | 12.5 | GO:0005925 | focal adhesion(GO:0005925) |
| 0.0 | 6.3 | GO:0009986 | cell surface(GO:0009986) |
| 0.0 | 26.8 | GO:0005615 | extracellular space(GO:0005615) |
| 0.0 | 19.1 | GO:0005887 | integral component of plasma membrane(GO:0005887) |
| 0.0 | 38.8 | GO:0016021 | integral component of membrane(GO:0016021) |
| 0.0 | 0.3 | GO:0005719 | nuclear euchromatin(GO:0005719) |
| 0.0 | 2.1 | GO:0090575 | RNA polymerase II transcription factor complex(GO:0090575) |
Gene overrepresentation in molecular function category:
| Log-likelihood per target | Total log-likelihood | Term | Description |
|---|---|---|---|
| 2.4 | 18.9 | GO:0004865 | protein serine/threonine phosphatase inhibitor activity(GO:0004865) |
| 1.3 | 39.8 | GO:0005212 | structural constituent of eye lens(GO:0005212) |
| 1.3 | 7.7 | GO:0018479 | benzaldehyde dehydrogenase (NAD+) activity(GO:0018479) |
| 1.2 | 3.5 | GO:0033878 | hormone-sensitive lipase activity(GO:0033878) |
| 1.2 | 6.9 | GO:0005223 | intracellular cGMP activated cation channel activity(GO:0005223) |
| 1.1 | 53.8 | GO:0046875 | ephrin receptor binding(GO:0046875) |
| 1.1 | 9.8 | GO:0099529 | neurotransmitter receptor activity involved in regulation of postsynaptic membrane potential(GO:0099529) transmitter-gated ion channel activity involved in regulation of postsynaptic membrane potential(GO:1904315) |
| 0.9 | 8.9 | GO:0047498 | calcium-dependent phospholipase A2 activity(GO:0047498) |
| 0.8 | 8.5 | GO:0004332 | fructose-bisphosphate aldolase activity(GO:0004332) |
| 0.7 | 14.0 | GO:0031404 | chloride ion binding(GO:0031404) |
| 0.7 | 2.2 | GO:0050254 | rhodopsin kinase activity(GO:0050254) |
| 0.7 | 3.4 | GO:0008048 | calcium sensitive guanylate cyclase activator activity(GO:0008048) |
| 0.6 | 4.4 | GO:0001640 | adenylate cyclase inhibiting G-protein coupled glutamate receptor activity(GO:0001640) G-protein coupled glutamate receptor activity(GO:0098988) |
| 0.6 | 4.2 | GO:0030160 | GKAP/Homer scaffold activity(GO:0030160) |
| 0.6 | 5.1 | GO:0035312 | 5'-3' exodeoxyribonuclease activity(GO:0035312) |
| 0.5 | 8.3 | GO:0043024 | ribosomal small subunit binding(GO:0043024) |
| 0.5 | 24.6 | GO:0030552 | cAMP binding(GO:0030552) |
| 0.4 | 2.7 | GO:0004704 | NF-kappaB-inducing kinase activity(GO:0004704) |
| 0.4 | 5.5 | GO:0031681 | G-protein beta-subunit binding(GO:0031681) |
| 0.4 | 3.7 | GO:0022851 | GABA-gated chloride ion channel activity(GO:0022851) |
| 0.4 | 3.5 | GO:0030020 | extracellular matrix structural constituent conferring tensile strength(GO:0030020) |
| 0.4 | 1.1 | GO:0005026 | transforming growth factor beta receptor activity, type II(GO:0005026) |
| 0.4 | 1.8 | GO:0048763 | calcium-induced calcium release activity(GO:0048763) |
| 0.3 | 1.3 | GO:0072320 | volume-sensitive chloride channel activity(GO:0072320) |
| 0.3 | 5.3 | GO:0005402 | sugar:proton symporter activity(GO:0005351) cation:sugar symporter activity(GO:0005402) |
| 0.3 | 8.3 | GO:0005388 | calcium-transporting ATPase activity(GO:0005388) |
| 0.3 | 3.3 | GO:0008020 | G-protein coupled photoreceptor activity(GO:0008020) |
| 0.3 | 2.5 | GO:0015272 | ATP-activated inward rectifier potassium channel activity(GO:0015272) |
| 0.3 | 1.1 | GO:0008449 | N-acetylglucosamine-6-sulfatase activity(GO:0008449) |
| 0.3 | 8.9 | GO:0036041 | long-chain fatty acid binding(GO:0036041) |
| 0.3 | 9.2 | GO:0032266 | phosphatidylinositol-3-phosphate binding(GO:0032266) |
| 0.3 | 1.9 | GO:0003810 | protein-glutamine gamma-glutamyltransferase activity(GO:0003810) |
| 0.2 | 7.8 | GO:0005086 | ARF guanyl-nucleotide exchange factor activity(GO:0005086) |
| 0.2 | 6.1 | GO:0003746 | translation elongation factor activity(GO:0003746) |
| 0.2 | 1.4 | GO:0070891 | lipoteichoic acid binding(GO:0070891) |
| 0.2 | 1.0 | GO:0004105 | choline-phosphate cytidylyltransferase activity(GO:0004105) |
| 0.2 | 1.1 | GO:0000404 | heteroduplex DNA loop binding(GO:0000404) |
| 0.2 | 0.7 | GO:0004886 | 9-cis retinoic acid receptor activity(GO:0004886) |
| 0.2 | 3.7 | GO:0005112 | Notch binding(GO:0005112) |
| 0.2 | 2.8 | GO:0043522 | leucine zipper domain binding(GO:0043522) |
| 0.2 | 4.8 | GO:0015347 | sodium-independent organic anion transmembrane transporter activity(GO:0015347) |
| 0.1 | 1.7 | GO:0097157 | pre-mRNA intronic binding(GO:0097157) |
| 0.1 | 3.1 | GO:0016875 | aminoacyl-tRNA ligase activity(GO:0004812) ligase activity, forming carbon-oxygen bonds(GO:0016875) ligase activity, forming aminoacyl-tRNA and related compounds(GO:0016876) |
| 0.1 | 0.5 | GO:0050119 | N-acetylglucosamine deacetylase activity(GO:0050119) |
| 0.1 | 4.6 | GO:0017075 | syntaxin-1 binding(GO:0017075) |
| 0.1 | 2.2 | GO:0015467 | G-protein activated inward rectifier potassium channel activity(GO:0015467) |
| 0.1 | 6.1 | GO:0008138 | protein tyrosine/serine/threonine phosphatase activity(GO:0008138) |
| 0.1 | 5.6 | GO:0008139 | nuclear localization sequence binding(GO:0008139) |
| 0.1 | 1.0 | GO:0033192 | calmodulin-dependent protein phosphatase activity(GO:0033192) |
| 0.1 | 9.4 | GO:0004722 | protein serine/threonine phosphatase activity(GO:0004722) |
| 0.1 | 4.1 | GO:0005109 | frizzled binding(GO:0005109) |
| 0.1 | 6.0 | GO:0005246 | calcium channel regulator activity(GO:0005246) |
| 0.1 | 0.7 | GO:0016724 | ferroxidase activity(GO:0004322) oxidoreductase activity, oxidizing metal ions, oxygen as acceptor(GO:0016724) |
| 0.1 | 2.7 | GO:0016702 | oxidoreductase activity, acting on single donors with incorporation of molecular oxygen, incorporation of two atoms of oxygen(GO:0016702) |
| 0.1 | 2.1 | GO:0046961 | ATPase activity, coupled to transmembrane movement of ions, rotational mechanism(GO:0044769) proton-transporting ATPase activity, rotational mechanism(GO:0046961) |
| 0.1 | 1.4 | GO:0004089 | carbonate dehydratase activity(GO:0004089) |
| 0.1 | 3.1 | GO:0000983 | transcription factor activity, RNA polymerase II core promoter sequence-specific(GO:0000983) |
| 0.1 | 4.2 | GO:0070063 | RNA polymerase binding(GO:0070063) |
| 0.1 | 5.5 | GO:0003725 | double-stranded RNA binding(GO:0003725) |
| 0.0 | 23.2 | GO:0004842 | ubiquitin-protein transferase activity(GO:0004842) |
| 0.0 | 9.2 | GO:0044325 | ion channel binding(GO:0044325) |
| 0.0 | 2.8 | GO:0019894 | kinesin binding(GO:0019894) |
| 0.0 | 0.7 | GO:0042043 | neurexin family protein binding(GO:0042043) |
| 0.0 | 0.3 | GO:0044323 | retinoic acid-responsive element binding(GO:0044323) |
| 0.0 | 0.9 | GO:0004806 | triglyceride lipase activity(GO:0004806) |
| 0.0 | 4.9 | GO:0005089 | Rho guanyl-nucleotide exchange factor activity(GO:0005089) |
| 0.0 | 2.3 | GO:0005546 | phosphatidylinositol-4,5-bisphosphate binding(GO:0005546) |
| 0.0 | 5.9 | GO:0005200 | structural constituent of cytoskeleton(GO:0005200) |
| 0.0 | 1.7 | GO:0043022 | ribosome binding(GO:0043022) |
| 0.0 | 2.1 | GO:0070888 | E-box binding(GO:0070888) |
| 0.0 | 4.3 | GO:0005179 | hormone activity(GO:0005179) |
| 0.0 | 1.5 | GO:0017046 | peptide hormone binding(GO:0017046) |
| 0.0 | 2.4 | GO:0051219 | phosphoprotein binding(GO:0051219) |
| 0.0 | 3.4 | GO:0005518 | collagen binding(GO:0005518) |
| 0.0 | 0.2 | GO:0004499 | N,N-dimethylaniline monooxygenase activity(GO:0004499) |
| 0.0 | 17.7 | GO:0005509 | calcium ion binding(GO:0005509) |
| 0.0 | 8.4 | GO:0001077 | transcriptional activator activity, RNA polymerase II core promoter proximal region sequence-specific binding(GO:0001077) |
| 0.0 | 1.1 | GO:0004693 | cyclin-dependent protein serine/threonine kinase activity(GO:0004693) |
| 0.0 | 0.3 | GO:0047555 | 3',5'-cyclic-GMP phosphodiesterase activity(GO:0047555) |
| 0.0 | 0.0 | GO:0008511 | sodium:potassium:chloride symporter activity(GO:0008511) |
Gene overrepresentation in curated gene sets: canonical pathways category:
| Log-likelihood per target | Total log-likelihood | Term | Description |
|---|---|---|---|
| 0.8 | 58.7 | PID RAC1 REG PATHWAY | Regulation of RAC1 activity |
| 0.2 | 8.3 | PID RHODOPSIN PATHWAY | Visual signal transduction: Rods |
| 0.2 | 9.9 | PID RXR VDR PATHWAY | RXR and RAR heterodimerization with other nuclear receptor |
| 0.1 | 8.1 | PID ATR PATHWAY | ATR signaling pathway |
| 0.1 | 3.5 | NABA COLLAGENS | Genes encoding collagen proteins |
| 0.1 | 1.8 | PID SYNDECAN 3 PATHWAY | Syndecan-3-mediated signaling events |
| 0.1 | 1.1 | PID ALK2 PATHWAY | ALK2 signaling events |
| 0.0 | 3.7 | PID NOTCH PATHWAY | Notch signaling pathway |
| 0.0 | 1.6 | ST GA12 PATHWAY | G alpha 12 Pathway |
| 0.0 | 1.0 | PID HEDGEHOG 2PATHWAY | Signaling events mediated by the Hedgehog family |
| 0.0 | 1.0 | PID IL12 STAT4 PATHWAY | IL12 signaling mediated by STAT4 |
| 0.0 | 3.4 | NABA ECM AFFILIATED | Genes encoding proteins affiliated structurally or functionally to extracellular matrix proteins |
| 0.0 | 1.3 | PID ATF2 PATHWAY | ATF-2 transcription factor network |
| 0.0 | 0.8 | PID INTEGRIN2 PATHWAY | Beta2 integrin cell surface interactions |
| 0.0 | 0.7 | NABA PROTEOGLYCANS | Genes encoding proteoglycans |
| 0.0 | 3.0 | NABA ECM REGULATORS | Genes encoding enzymes and their regulators involved in the remodeling of the extracellular matrix |
Gene overrepresentation in curated gene sets: REACTOME pathways category:
| Log-likelihood per target | Total log-likelihood | Term | Description |
|---|---|---|---|
| 0.6 | 10.6 | REACTOME ORGANIC CATION ANION ZWITTERION TRANSPORT | Genes involved in Organic cation/anion/zwitterion transport |
| 0.6 | 8.9 | REACTOME ACYL CHAIN REMODELLING OF PS | Genes involved in Acyl chain remodelling of PS |
| 0.4 | 13.5 | REACTOME GABA A RECEPTOR ACTIVATION | Genes involved in GABA A receptor activation |
| 0.3 | 58.1 | REACTOME SIGNALING BY RHO GTPASES | Genes involved in Signaling by Rho GTPases |
| 0.3 | 8.3 | REACTOME PLATELET CALCIUM HOMEOSTASIS | Genes involved in Platelet calcium homeostasis |
| 0.3 | 3.3 | REACTOME OPSINS | Genes involved in Opsins |
| 0.3 | 3.5 | REACTOME GLYCOPROTEIN HORMONES | Genes involved in Glycoprotein hormones |
| 0.2 | 4.4 | REACTOME CLASS C 3 METABOTROPIC GLUTAMATE PHEROMONE RECEPTORS | Genes involved in Class C/3 (Metabotropic glutamate/pheromone receptors) |
| 0.2 | 4.6 | REACTOME TRAFFICKING OF GLUR2 CONTAINING AMPA RECEPTORS | Genes involved in Trafficking of GluR2-containing AMPA receptors |
| 0.2 | 6.9 | REACTOME PTM GAMMA CARBOXYLATION HYPUSINE FORMATION AND ARYLSULFATASE ACTIVATION | Genes involved in PTM: gamma carboxylation, hypusine formation and arylsulfatase activation |
| 0.1 | 8.5 | REACTOME GLYCOLYSIS | Genes involved in Glycolysis |
| 0.1 | 1.8 | REACTOME SIGNALING BY NOTCH3 | Genes involved in Signaling by NOTCH3 |
| 0.1 | 3.5 | REACTOME HORMONE SENSITIVE LIPASE HSL MEDIATED TRIACYLGLYCEROL HYDROLYSIS | Genes involved in Hormone-sensitive lipase (HSL)-mediated triacylglycerol hydrolysis |
| 0.1 | 4.6 | REACTOME RAP1 SIGNALLING | Genes involved in Rap1 signalling |
| 0.1 | 2.1 | REACTOME REGULATION OF WATER BALANCE BY RENAL AQUAPORINS | Genes involved in Regulation of Water Balance by Renal Aquaporins |
| 0.1 | 9.9 | REACTOME NUCLEAR RECEPTOR TRANSCRIPTION PATHWAY | Genes involved in Nuclear Receptor transcription pathway |
| 0.1 | 4.1 | REACTOME CGMP EFFECTS | Genes involved in cGMP effects |
| 0.1 | 3.9 | REACTOME INWARDLY RECTIFYING K CHANNELS | Genes involved in Inwardly rectifying K+ channels |
| 0.1 | 1.4 | REACTOME REVERSIBLE HYDRATION OF CARBON DIOXIDE | Genes involved in Reversible Hydration of Carbon Dioxide |
| 0.1 | 2.1 | REACTOME INSULIN RECEPTOR RECYCLING | Genes involved in Insulin receptor recycling |
| 0.1 | 1.4 | REACTOME OTHER SEMAPHORIN INTERACTIONS | Genes involved in Other semaphorin interactions |
| 0.1 | 3.5 | REACTOME COLLAGEN FORMATION | Genes involved in Collagen formation |
| 0.0 | 3.1 | REACTOME MYOGENESIS | Genes involved in Myogenesis |
| 0.0 | 5.5 | REACTOME RIG I MDA5 MEDIATED INDUCTION OF IFN ALPHA BETA PATHWAYS | Genes involved in RIG-I/MDA5 mediated induction of IFN-alpha/beta pathways |
| 0.0 | 1.0 | REACTOME SYNTHESIS OF PC | Genes involved in Synthesis of PC |
| 0.0 | 1.1 | REACTOME FORMATION OF INCISION COMPLEX IN GG NER | Genes involved in Formation of incision complex in GG-NER |
| 0.0 | 0.7 | REACTOME IRON UPTAKE AND TRANSPORT | Genes involved in Iron uptake and transport |
| 0.0 | 5.5 | REACTOME G ALPHA I SIGNALLING EVENTS | Genes involved in G alpha (i) signalling events |
| 0.0 | 1.0 | REACTOME DARPP 32 EVENTS | Genes involved in DARPP-32 events |
| 0.0 | 2.3 | REACTOME TRANSCRIPTIONAL REGULATION OF WHITE ADIPOCYTE DIFFERENTIATION | Genes involved in Transcriptional Regulation of White Adipocyte Differentiation |
| 0.0 | 2.4 | REACTOME CLASS B 2 SECRETIN FAMILY RECEPTORS | Genes involved in Class B/2 (Secretin family receptors) |
| 0.0 | 2.2 | REACTOME L1CAM INTERACTIONS | Genes involved in L1CAM interactions |
| 0.0 | 0.5 | REACTOME HS GAG BIOSYNTHESIS | Genes involved in HS-GAG biosynthesis |