Project
GNF SymAtlas + NCI-60 cancer cell lines, human (Su, 2004; Ross, 2000)
Navigation
Downloads
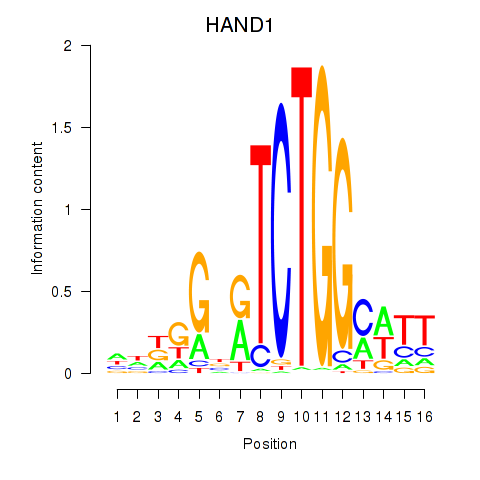
Results for HAND1
Z-value: 0.56
Motif logo
Transcription factors associated with HAND1
| Gene Symbol | Gene ID | Gene Info |
|---|---|---|
|
HAND1
|
ENSG00000113196.3 | HAND1 |
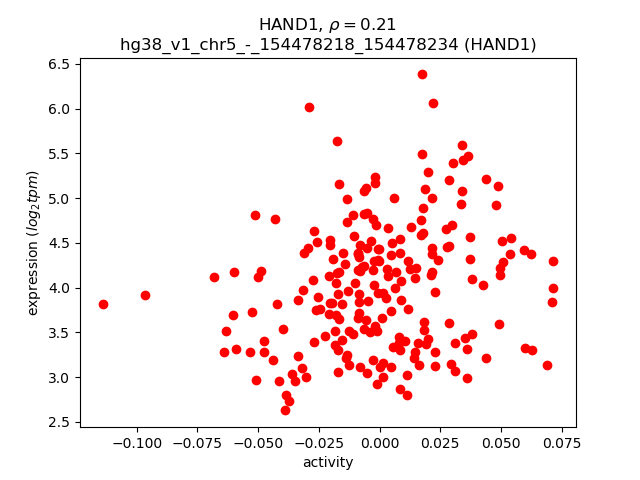
Activity-expression correlation:
| Gene | Promoter | Pearson corr. coef. | P-value | Plot |
|---|---|---|---|---|
| HAND1 | hg38_v1_chr5_-_154478218_154478234 | 0.21 | 2.0e-03 | Click! |
Activity profile of HAND1 motif
Sorted Z-values of HAND1 motif
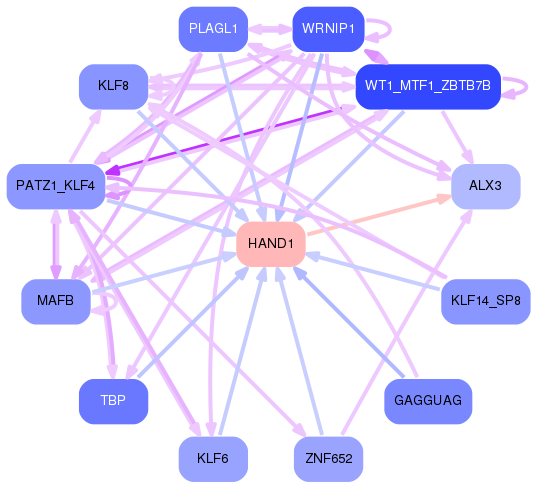
Network of associatons between targets according to the STRING database.

First level regulatory network of HAND1
| Promoter | Score | Transcript | Gene | Gene Info |
|---|---|---|---|---|
| chr19_+_35868585 | 4.59 |
ENST00000652533.1
|
APLP1
|
amyloid beta precursor like protein 1 |
| chr11_-_5243644 | 4.50 |
ENST00000643122.1
|
HBD
|
hemoglobin subunit delta |
| chr19_+_35868518 | 4.38 |
ENST00000221891.9
|
APLP1
|
amyloid beta precursor like protein 1 |
| chr4_+_25160631 | 4.35 |
ENST00000510415.1
ENST00000507794.2 ENST00000512921.4 |
SEPSECS-AS1
PI4K2B
|
SEPSECS antisense RNA 1 (head to head) phosphatidylinositol 4-kinase type 2 beta |
| chr19_-_37210484 | 3.75 |
ENST00000527838.5
ENST00000591492.5 ENST00000532828.7 |
ZNF585B
|
zinc finger protein 585B |
| chr1_+_65309517 | 3.70 |
ENST00000371069.5
|
DNAJC6
|
DnaJ heat shock protein family (Hsp40) member C6 |
| chr5_+_36608146 | 3.64 |
ENST00000381918.4
ENST00000513646.1 |
SLC1A3
|
solute carrier family 1 member 3 |
| chr10_+_5048748 | 3.57 |
ENST00000602997.5
ENST00000439082.7 |
AKR1C3
|
aldo-keto reductase family 1 member C3 |
| chr14_-_64942720 | 3.05 |
ENST00000557049.1
ENST00000389614.6 |
GPX2
|
glutathione peroxidase 2 |
| chr14_-_64942783 | 2.94 |
ENST00000612794.1
|
GPX2
|
glutathione peroxidase 2 |
| chr10_-_5003850 | 2.89 |
ENST00000421196.7
ENST00000455190.2 ENST00000380753.8 |
AKR1C2
|
aldo-keto reductase family 1 member C2 |
| chr1_-_110064916 | 2.75 |
ENST00000649954.1
|
ALX3
|
ALX homeobox 3 |
| chr2_+_209579399 | 2.54 |
ENST00000360351.8
|
MAP2
|
microtubule associated protein 2 |
| chr16_-_28610032 | 2.52 |
ENST00000567512.1
|
SULT1A1
|
sulfotransferase family 1A member 1 |
| chr20_+_46029165 | 2.42 |
ENST00000616201.4
ENST00000616202.4 ENST00000616933.4 ENST00000626937.2 |
SLC12A5
|
solute carrier family 12 member 5 |
| chr16_+_6019585 | 2.38 |
ENST00000547372.5
|
RBFOX1
|
RNA binding fox-1 homolog 1 |
| chr4_+_41613476 | 2.37 |
ENST00000508466.1
|
LIMCH1
|
LIM and calponin homology domains 1 |
| chr4_+_41612892 | 2.29 |
ENST00000509454.5
ENST00000396595.7 ENST00000381753.8 |
LIMCH1
|
LIM and calponin homology domains 1 |
| chr16_-_28609992 | 2.25 |
ENST00000314752.11
|
SULT1A1
|
sulfotransferase family 1A member 1 |
| chr17_-_66220630 | 2.16 |
ENST00000585162.1
|
APOH
|
apolipoprotein H |
| chr2_+_209579598 | 2.16 |
ENST00000445941.5
ENST00000673860.1 |
MAP2
|
microtubule associated protein 2 |
| chr2_+_209579429 | 2.14 |
ENST00000361559.8
|
MAP2
|
microtubule associated protein 2 |
| chr11_+_125063295 | 1.93 |
ENST00000532000.5
ENST00000403796.7 ENST00000308074.4 |
SLC37A2
|
solute carrier family 37 member 2 |
| chr2_-_27495185 | 1.86 |
ENST00000264703.4
|
FNDC4
|
fibronectin type III domain containing 4 |
| chr11_-_2301859 | 1.82 |
ENST00000456145.2
ENST00000381153.8 |
C11orf21
|
chromosome 11 open reading frame 21 |
| chr16_-_28597042 | 1.79 |
ENST00000533150.5
ENST00000335715.9 |
SULT1A2
|
sulfotransferase family 1A member 2 |
| chr12_+_40692413 | 1.77 |
ENST00000551295.7
ENST00000547702.5 ENST00000551424.5 |
CNTN1
|
contactin 1 |
| chr16_-_28609976 | 1.71 |
ENST00000566189.5
|
SULT1A1
|
sulfotransferase family 1A member 1 |
| chr11_+_2302119 | 1.68 |
ENST00000381121.7
|
TSPAN32
|
tetraspanin 32 |
| chr1_-_52404387 | 1.64 |
ENST00000371566.1
ENST00000371568.8 |
ORC1
|
origin recognition complex subunit 1 |
| chr4_+_41612702 | 1.63 |
ENST00000509277.5
|
LIMCH1
|
LIM and calponin homology domains 1 |
| chr1_+_45012691 | 1.56 |
ENST00000469548.5
|
UROD
|
uroporphyrinogen decarboxylase |
| chr17_-_44947637 | 1.55 |
ENST00000587309.5
ENST00000593135.6 |
KIF18B
|
kinesin family member 18B |
| chr18_-_46757012 | 1.54 |
ENST00000315087.12
|
ST8SIA5
|
ST8 alpha-N-acetyl-neuraminide alpha-2,8-sialyltransferase 5 |
| chr1_+_27935022 | 1.53 |
ENST00000411604.5
ENST00000373888.8 |
SMPDL3B
|
sphingomyelin phosphodiesterase acid like 3B |
| chr18_-_46756791 | 1.46 |
ENST00000538168.5
ENST00000536490.1 |
ST8SIA5
|
ST8 alpha-N-acetyl-neuraminide alpha-2,8-sialyltransferase 5 |
| chr11_+_72114840 | 1.42 |
ENST00000622388.4
|
FOLR3
|
folate receptor gamma |
| chr1_+_207089195 | 1.42 |
ENST00000452902.6
|
C4BPB
|
complement component 4 binding protein beta |
| chr17_-_8210203 | 1.41 |
ENST00000578549.5
ENST00000582368.5 |
AURKB
|
aurora kinase B |
| chr1_+_45012896 | 1.40 |
ENST00000428106.1
|
UROD
|
uroporphyrinogen decarboxylase |
| chr1_+_174877430 | 1.39 |
ENST00000392064.6
|
RABGAP1L
|
RAB GTPase activating protein 1 like |
| chr2_+_113058637 | 1.36 |
ENST00000346807.7
|
IL36RN
|
interleukin 36 receptor antagonist |
| chr1_+_43979179 | 1.31 |
ENST00000434555.7
ENST00000372324.6 ENST00000481924.2 |
B4GALT2
|
beta-1,4-galactosyltransferase 2 |
| chr10_+_116590956 | 1.26 |
ENST00000358834.9
ENST00000528052.5 |
PNLIPRP1
|
pancreatic lipase related protein 1 |
| chr12_+_49323236 | 1.23 |
ENST00000549275.5
ENST00000551245.5 ENST00000380327.9 ENST00000548311.5 ENST00000257909.8 ENST00000550346.5 ENST00000550709.5 ENST00000549534.1 ENST00000547807.5 ENST00000551567.1 |
TROAP
|
trophinin associated protein |
| chrX_+_71144818 | 1.22 |
ENST00000536169.5
ENST00000358741.4 ENST00000395855.6 ENST00000374051.7 |
NLGN3
|
neuroligin 3 |
| chr3_+_124094663 | 1.20 |
ENST00000460856.5
ENST00000240874.7 |
KALRN
|
kalirin RhoGEF kinase |
| chr1_+_207089233 | 1.19 |
ENST00000243611.9
ENST00000367076.7 |
C4BPB
|
complement component 4 binding protein beta |
| chr6_+_101181254 | 1.19 |
ENST00000682090.1
ENST00000421544.6 |
GRIK2
|
glutamate ionotropic receptor kainate type subunit 2 |
| chr1_+_207089283 | 1.18 |
ENST00000391923.1
|
C4BPB
|
complement component 4 binding protein beta |
| chr10_+_116591010 | 1.14 |
ENST00000530319.5
ENST00000527980.5 ENST00000471549.5 ENST00000534537.5 |
PNLIPRP1
|
pancreatic lipase related protein 1 |
| chr16_+_6019663 | 1.13 |
ENST00000422070.8
|
RBFOX1
|
RNA binding fox-1 homolog 1 |
| chr10_-_116273606 | 1.13 |
ENST00000682743.1
|
GFRA1
|
GDNF family receptor alpha 1 |
| chr11_-_63563370 | 1.10 |
ENST00000255695.2
|
PLAAT2
|
phospholipase A and acyltransferase 2 |
| chr7_-_151057848 | 1.10 |
ENST00000297518.4
|
CDK5
|
cyclin dependent kinase 5 |
| chr7_+_111091119 | 1.08 |
ENST00000308478.10
|
LRRN3
|
leucine rich repeat neuronal 3 |
| chr7_-_151057880 | 1.08 |
ENST00000485972.6
|
CDK5
|
cyclin dependent kinase 5 |
| chr14_+_96256194 | 1.08 |
ENST00000216629.11
ENST00000553356.1 |
BDKRB1
|
bradykinin receptor B1 |
| chr9_-_112332962 | 1.05 |
ENST00000458258.5
ENST00000210227.4 |
PTBP3
|
polypyrimidine tract binding protein 3 |
| chr6_+_44223770 | 1.05 |
ENST00000652453.1
ENST00000393841.6 ENST00000371724.6 ENST00000642777.1 ENST00000645692.1 |
SLC29A1
|
solute carrier family 29 member 1 (Augustine blood group) |
| chr1_+_207088825 | 1.04 |
ENST00000367078.8
|
C4BPB
|
complement component 4 binding protein beta |
| chr2_-_42361198 | 1.03 |
ENST00000234301.3
|
COX7A2L
|
cytochrome c oxidase subunit 7A2 like |
| chr7_-_142885737 | 1.00 |
ENST00000359396.9
ENST00000436401.1 |
TRPV6
|
transient receptor potential cation channel subfamily V member 6 |
| chr6_-_53148822 | 0.98 |
ENST00000259803.8
|
GCM1
|
glial cells missing transcription factor 1 |
| chr4_-_25030922 | 0.97 |
ENST00000382114.9
|
LGI2
|
leucine rich repeat LGI family member 2 |
| chr6_-_52803807 | 0.93 |
ENST00000334575.6
|
GSTA1
|
glutathione S-transferase alpha 1 |
| chr3_+_112332500 | 0.92 |
ENST00000606471.5
|
CD200
|
CD200 molecule |
| chr7_+_111091006 | 0.89 |
ENST00000451085.5
ENST00000422987.3 ENST00000421101.1 |
LRRN3
|
leucine rich repeat neuronal 3 |
| chr3_-_9769910 | 0.89 |
ENST00000256460.8
|
CAMK1
|
calcium/calmodulin dependent protein kinase I |
| chrX_+_15749848 | 0.86 |
ENST00000479740.5
ENST00000454127.2 |
CA5B
|
carbonic anhydrase 5B |
| chr19_+_7920313 | 0.83 |
ENST00000221573.11
ENST00000595637.1 |
SNAPC2
|
small nuclear RNA activating complex polypeptide 2 |
| chr10_+_101354028 | 0.80 |
ENST00000393441.8
|
BTRC
|
beta-transducin repeat containing E3 ubiquitin protein ligase |
| chr7_+_97005538 | 0.80 |
ENST00000518156.3
|
DLX6
|
distal-less homeobox 6 |
| chr1_+_1281224 | 0.79 |
ENST00000400928.7
|
SCNN1D
|
sodium channel epithelial 1 subunit delta |
| chr11_+_2301987 | 0.77 |
ENST00000612299.4
ENST00000182290.9 |
TSPAN32
|
tetraspanin 32 |
| chr10_+_101354083 | 0.73 |
ENST00000408038.6
ENST00000370187.8 |
BTRC
|
beta-transducin repeat containing E3 ubiquitin protein ligase |
| chr2_+_203867764 | 0.72 |
ENST00000648405.2
|
CTLA4
|
cytotoxic T-lymphocyte associated protein 4 |
| chr20_-_1184981 | 0.71 |
ENST00000429036.2
|
TMEM74B
|
transmembrane protein 74B |
| chrX_+_150363258 | 0.67 |
ENST00000683696.1
|
MAMLD1
|
mastermind like domain containing 1 |
| chr12_-_56360084 | 0.67 |
ENST00000314128.9
ENST00000557235.5 ENST00000651915.1 |
STAT2
|
signal transducer and activator of transcription 2 |
| chrX_+_150363306 | 0.64 |
ENST00000370401.7
ENST00000432680.7 |
MAMLD1
|
mastermind like domain containing 1 |
| chr16_+_67893244 | 0.63 |
ENST00000291041.6
ENST00000570631.5 |
PSKH1
|
protein serine kinase H1 |
| chr17_-_10469558 | 0.62 |
ENST00000255381.2
|
MYH4
|
myosin heavy chain 4 |
| chr18_+_58045642 | 0.61 |
ENST00000676223.1
ENST00000675147.1 |
NEDD4L
|
NEDD4 like E3 ubiquitin protein ligase |
| chr1_+_27935110 | 0.61 |
ENST00000549094.1
|
SMPDL3B
|
sphingomyelin phosphodiesterase acid like 3B |
| chr22_-_23751080 | 0.60 |
ENST00000341976.5
|
ZNF70
|
zinc finger protein 70 |
| chr16_+_90022600 | 0.59 |
ENST00000620723.4
ENST00000268699.9 |
GAS8
|
growth arrest specific 8 |
| chr12_+_67648737 | 0.59 |
ENST00000344096.4
ENST00000393555.3 |
DYRK2
|
dual specificity tyrosine phosphorylation regulated kinase 2 |
| chr1_+_27934980 | 0.59 |
ENST00000373894.8
|
SMPDL3B
|
sphingomyelin phosphodiesterase acid like 3B |
| chr3_+_124094696 | 0.58 |
ENST00000360013.7
ENST00000684186.1 ENST00000684276.1 |
KALRN
|
kalirin RhoGEF kinase |
| chr10_-_102451536 | 0.58 |
ENST00000625129.1
|
C10orf95
|
chromosome 10 open reading frame 95 |
| chr15_-_78811415 | 0.58 |
ENST00000388820.5
|
ADAMTS7
|
ADAM metallopeptidase with thrombospondin type 1 motif 7 |
| chr9_+_77177511 | 0.55 |
ENST00000360280.8
ENST00000645632.1 ENST00000643348.1 |
VPS13A
|
vacuolar protein sorting 13 homolog A |
| chr4_-_40629842 | 0.54 |
ENST00000295971.12
|
RBM47
|
RNA binding motif protein 47 |
| chr22_+_24603147 | 0.54 |
ENST00000412658.5
ENST00000445029.5 ENST00000400382.6 ENST00000419133.5 ENST00000438643.6 ENST00000452551.5 ENST00000412898.5 ENST00000400380.5 ENST00000455483.5 ENST00000430289.5 |
GGT1
|
gamma-glutamyltransferase 1 |
| chr19_+_12751672 | 0.49 |
ENST00000549706.5
|
BEST2
|
bestrophin 2 |
| chr1_+_202122910 | 0.49 |
ENST00000682545.1
ENST00000367282.6 ENST00000682887.1 |
GPR37L1
|
G protein-coupled receptor 37 like 1 |
| chr7_-_117323041 | 0.48 |
ENST00000491214.1
ENST00000265441.8 |
WNT2
|
Wnt family member 2 |
| chr19_-_12933680 | 0.45 |
ENST00000593021.1
ENST00000314606.9 ENST00000587981.1 ENST00000423140.6 |
FARSA
|
phenylalanyl-tRNA synthetase subunit alpha |
| chr7_+_73827737 | 0.44 |
ENST00000435050.1
|
CLDN4
|
claudin 4 |
| chr7_+_76510516 | 0.44 |
ENST00000257632.9
|
UPK3B
|
uroplakin 3B |
| chr2_-_207167220 | 0.43 |
ENST00000421199.5
ENST00000457962.5 |
KLF7
|
Kruppel like factor 7 |
| chr1_+_11189347 | 0.41 |
ENST00000376819.4
|
ANGPTL7
|
angiopoietin like 7 |
| chr1_-_205631962 | 0.41 |
ENST00000289703.8
ENST00000357992.9 |
ELK4
|
ETS transcription factor ELK4 |
| chr8_+_2045037 | 0.41 |
ENST00000262113.9
|
MYOM2
|
myomesin 2 |
| chr7_-_81770039 | 0.40 |
ENST00000222390.11
ENST00000453411.6 ENST00000457544.7 ENST00000444829.7 |
HGF
|
hepatocyte growth factor |
| chr5_-_41870416 | 0.39 |
ENST00000196371.10
|
OXCT1
|
3-oxoacid CoA-transferase 1 |
| chr18_+_58045683 | 0.39 |
ENST00000592846.5
ENST00000675801.1 |
NEDD4L
|
NEDD4 like E3 ubiquitin protein ligase |
| chr16_-_89490479 | 0.38 |
ENST00000642600.1
ENST00000301030.10 |
ANKRD11
|
ankyrin repeat domain 11 |
| chr1_-_167914089 | 0.38 |
ENST00000476818.2
ENST00000367848.1 ENST00000367851.9 ENST00000545172.5 |
ADCY10
|
adenylate cyclase 10 |
| chr2_+_203867943 | 0.37 |
ENST00000295854.10
ENST00000487393.1 ENST00000472206.1 |
CTLA4
|
cytotoxic T-lymphocyte associated protein 4 |
| chr10_+_97584347 | 0.35 |
ENST00000370649.3
ENST00000370646.9 |
ENSG00000249967.1
HOGA1
|
novel protein 4-hydroxy-2-oxoglutarate aldolase 1 |
| chr20_+_1135178 | 0.35 |
ENST00000435720.5
|
PSMF1
|
proteasome inhibitor subunit 1 |
| chr3_+_46877705 | 0.35 |
ENST00000449590.6
|
PTH1R
|
parathyroid hormone 1 receptor |
| chr17_+_6444441 | 0.31 |
ENST00000250056.12
ENST00000571373.5 ENST00000570337.6 ENST00000572595.6 ENST00000572447.6 ENST00000576056.5 |
PIMREG
|
PICALM interacting mitotic regulator |
| chr20_+_1135217 | 0.31 |
ENST00000381898.5
|
PSMF1
|
proteasome inhibitor subunit 1 |
| chr1_+_27392612 | 0.31 |
ENST00000374024.4
|
GPR3
|
G protein-coupled receptor 3 |
| chr3_-_49093578 | 0.31 |
ENST00000424300.5
|
QRICH1
|
glutamine rich 1 |
| chr19_+_4304588 | 0.29 |
ENST00000221856.11
|
FSD1
|
fibronectin type III and SPRY domain containing 1 |
| chr1_-_51878799 | 0.29 |
ENST00000354831.11
ENST00000544028.5 |
NRDC
|
nardilysin convertase |
| chr11_+_118956289 | 0.28 |
ENST00000264031.3
|
UPK2
|
uroplakin 2 |
| chr8_+_2045058 | 0.27 |
ENST00000523438.1
|
MYOM2
|
myomesin 2 |
| chr17_-_42185452 | 0.27 |
ENST00000293330.1
|
HCRT
|
hypocretin neuropeptide precursor |
| chr7_-_81770122 | 0.26 |
ENST00000423064.7
|
HGF
|
hepatocyte growth factor |
| chr2_-_196926717 | 0.23 |
ENST00000409475.5
ENST00000374738.3 |
PGAP1
|
post-GPI attachment to proteins inositol deacylase 1 |
| chr1_+_202122881 | 0.23 |
ENST00000683302.1
ENST00000683557.1 |
GPR37L1
|
G protein-coupled receptor 37 like 1 |
| chr2_+_201132872 | 0.21 |
ENST00000470178.6
|
CFLAR
|
CASP8 and FADD like apoptosis regulator |
| chr3_+_148697784 | 0.19 |
ENST00000497524.5
ENST00000418473.7 ENST00000349243.8 ENST00000404754.2 |
AGTR1
|
angiotensin II receptor type 1 |
| chr12_+_25958891 | 0.18 |
ENST00000381352.7
ENST00000535907.5 ENST00000405154.6 ENST00000615708.4 |
RASSF8
|
Ras association domain family member 8 |
| chr21_+_33230073 | 0.17 |
ENST00000342101.7
ENST00000413881.5 ENST00000443073.5 |
IFNAR2
|
interferon alpha and beta receptor subunit 2 |
| chr1_-_51878711 | 0.15 |
ENST00000352171.12
|
NRDC
|
nardilysin convertase |
| chr12_-_10802627 | 0.13 |
ENST00000240687.2
|
TAS2R7
|
taste 2 receptor member 7 |
| chr11_-_26722051 | 0.10 |
ENST00000396005.8
|
SLC5A12
|
solute carrier family 5 member 12 |
| chr10_+_50990864 | 0.10 |
ENST00000401604.8
|
PRKG1
|
protein kinase cGMP-dependent 1 |
| chr6_-_36986122 | 0.08 |
ENST00000460219.2
ENST00000373627.10 ENST00000373616.9 |
MTCH1
|
mitochondrial carrier 1 |
| chr6_+_6588708 | 0.08 |
ENST00000230568.5
|
LY86
|
lymphocyte antigen 86 |
| chr13_-_60013178 | 0.07 |
ENST00000498416.2
ENST00000465066.5 |
DIAPH3
|
diaphanous related formin 3 |
| chr19_+_12751789 | 0.05 |
ENST00000553030.6
|
BEST2
|
bestrophin 2 |
| chr6_-_87095059 | 0.05 |
ENST00000369582.6
ENST00000610310.3 ENST00000630630.2 ENST00000627148.3 ENST00000625577.1 |
CGA
|
glycoprotein hormones, alpha polypeptide |
| chr12_-_68253502 | 0.02 |
ENST00000328087.6
ENST00000538666.6 |
IL22
|
interleukin 22 |
| chr2_+_227813834 | 0.01 |
ENST00000358813.5
ENST00000409189.7 |
CCL20
|
C-C motif chemokine ligand 20 |
Gene Ontology Analysis
Gene overrepresentation in biological process category:
| Log-likelihood per target | Total log-likelihood | Term | Description |
|---|---|---|---|
| 1.5 | 9.0 | GO:0071874 | cellular response to norepinephrine stimulus(GO:0071874) |
| 1.2 | 3.6 | GO:0016487 | sesquiterpenoid metabolic process(GO:0006714) sesquiterpenoid catabolic process(GO:0016107) farnesol metabolic process(GO:0016487) farnesol catabolic process(GO:0016488) regulation of testosterone biosynthetic process(GO:2000224) |
| 0.7 | 2.9 | GO:0009753 | response to jasmonic acid(GO:0009753) cellular response to jasmonic acid stimulus(GO:0071395) |
| 0.6 | 2.5 | GO:0030886 | negative regulation of myeloid dendritic cell activation(GO:0030886) |
| 0.6 | 4.8 | GO:0030450 | regulation of complement activation, classical pathway(GO:0030450) negative regulation of complement activation, classical pathway(GO:0045959) regulation of opsonization(GO:1903027) |
| 0.5 | 1.4 | GO:0044878 | mitotic cytokinesis checkpoint(GO:0044878) |
| 0.4 | 2.4 | GO:0030644 | cellular chloride ion homeostasis(GO:0030644) |
| 0.4 | 3.6 | GO:0006537 | glutamate biosynthetic process(GO:0006537) gamma-aminobutyric acid biosynthetic process(GO:0009449) |
| 0.4 | 8.3 | GO:0006068 | ethanol catabolic process(GO:0006068) |
| 0.3 | 1.0 | GO:0060018 | astrocyte fate commitment(GO:0060018) |
| 0.3 | 2.2 | GO:0031914 | negative regulation of synaptic plasticity(GO:0031914) |
| 0.3 | 3.7 | GO:0016191 | synaptic vesicle uncoating(GO:0016191) |
| 0.3 | 1.2 | GO:0060024 | rhythmic synaptic transmission(GO:0060024) |
| 0.3 | 1.9 | GO:0015760 | hexose phosphate transport(GO:0015712) glucose-6-phosphate transport(GO:0015760) |
| 0.2 | 2.7 | GO:0006685 | sphingomyelin catabolic process(GO:0006685) |
| 0.2 | 4.5 | GO:0015671 | oxygen transport(GO:0015671) |
| 0.2 | 1.1 | GO:0045590 | negative regulation of regulatory T cell differentiation(GO:0045590) |
| 0.2 | 2.2 | GO:0051918 | negative regulation of fibrinolysis(GO:0051918) |
| 0.2 | 1.1 | GO:0015862 | uridine transport(GO:0015862) |
| 0.2 | 1.8 | GO:0060125 | negative regulation of growth hormone secretion(GO:0060125) |
| 0.2 | 0.9 | GO:0051835 | positive regulation of synapse structural plasticity(GO:0051835) |
| 0.2 | 1.4 | GO:0019732 | antifungal humoral response(GO:0019732) |
| 0.2 | 3.0 | GO:0006782 | protoporphyrinogen IX biosynthetic process(GO:0006782) |
| 0.1 | 1.1 | GO:0043249 | erythrocyte maturation(GO:0043249) |
| 0.1 | 1.1 | GO:0035860 | glial cell-derived neurotrophic factor receptor signaling pathway(GO:0035860) |
| 0.1 | 3.0 | GO:0097503 | glycosphingolipid biosynthetic process(GO:0006688) sialylation(GO:0097503) |
| 0.1 | 0.6 | GO:0051534 | negative regulation of NFAT protein import into nucleus(GO:0051534) |
| 0.1 | 0.7 | GO:0060665 | regulation of branching involved in salivary gland morphogenesis by mesenchymal-epithelial signaling(GO:0060665) |
| 0.1 | 0.5 | GO:0006432 | phenylalanyl-tRNA aminoacylation(GO:0006432) |
| 0.1 | 0.5 | GO:0016554 | cytidine to uridine editing(GO:0016554) |
| 0.1 | 7.4 | GO:0001578 | microtubule bundle formation(GO:0001578) |
| 0.1 | 0.4 | GO:0019470 | 4-hydroxyproline catabolic process(GO:0019470) |
| 0.1 | 1.2 | GO:0051967 | regulation of short-term neuronal synaptic plasticity(GO:0048172) negative regulation of synaptic transmission, glutamatergic(GO:0051967) |
| 0.1 | 0.7 | GO:0002074 | extraocular skeletal muscle development(GO:0002074) |
| 0.1 | 1.4 | GO:0015884 | folic acid transport(GO:0015884) |
| 0.1 | 1.0 | GO:2001288 | positive regulation of caveolin-mediated endocytosis(GO:2001288) |
| 0.1 | 0.7 | GO:0021940 | positive regulation of cerebellar granule cell precursor proliferation(GO:0021940) |
| 0.1 | 0.5 | GO:0003228 | atrial cardiac muscle tissue development(GO:0003228) atrial cardiac muscle tissue morphogenesis(GO:0055009) foregut regionalization(GO:0060423) lung field specification(GO:0060424) lung induction(GO:0060492) |
| 0.1 | 0.5 | GO:0019344 | cysteine biosynthetic process(GO:0019344) |
| 0.1 | 0.4 | GO:0046952 | ketone body catabolic process(GO:0046952) |
| 0.1 | 0.6 | GO:0036066 | protein O-linked fucosylation(GO:0036066) |
| 0.1 | 1.0 | GO:1990035 | calcium ion import across plasma membrane(GO:0098703) calcium ion import into cell(GO:1990035) |
| 0.1 | 1.5 | GO:0042753 | positive regulation of circadian rhythm(GO:0042753) |
| 0.1 | 4.3 | GO:0007032 | endosome organization(GO:0007032) |
| 0.1 | 2.7 | GO:0035115 | embryonic forelimb morphogenesis(GO:0035115) |
| 0.1 | 1.3 | GO:0018146 | keratan sulfate biosynthetic process(GO:0018146) |
| 0.1 | 6.9 | GO:0098869 | cellular oxidant detoxification(GO:0098869) |
| 0.0 | 0.2 | GO:0086097 | phospholipase C-activating angiotensin-activated signaling pathway(GO:0086097) |
| 0.0 | 3.5 | GO:0000381 | regulation of alternative mRNA splicing, via spliceosome(GO:0000381) |
| 0.0 | 0.9 | GO:0006123 | mitochondrial electron transport, cytochrome c to oxygen(GO:0006123) |
| 0.0 | 1.3 | GO:0007205 | protein kinase C-activating G-protein coupled receptor signaling pathway(GO:0007205) |
| 0.0 | 1.6 | GO:0000083 | regulation of transcription involved in G1/S transition of mitotic cell cycle(GO:0000083) |
| 0.0 | 0.4 | GO:0003351 | epithelial cilium movement(GO:0003351) |
| 0.0 | 0.2 | GO:0034334 | adherens junction maintenance(GO:0034334) |
| 0.0 | 1.5 | GO:0007019 | microtubule depolymerization(GO:0007019) |
| 0.0 | 0.4 | GO:0051044 | positive regulation of membrane protein ectodomain proteolysis(GO:0051044) |
| 0.0 | 0.6 | GO:0006895 | Golgi to endosome transport(GO:0006895) |
| 0.0 | 1.2 | GO:0010765 | positive regulation of sodium ion transport(GO:0010765) |
| 0.0 | 2.0 | GO:0051965 | positive regulation of synapse assembly(GO:0051965) |
| 0.0 | 0.4 | GO:0061436 | establishment of skin barrier(GO:0061436) |
| 0.0 | 0.1 | GO:0060087 | relaxation of vascular smooth muscle(GO:0060087) |
| 0.0 | 0.4 | GO:0070932 | histone H3 deacetylation(GO:0070932) |
| 0.0 | 5.0 | GO:0031032 | actomyosin structure organization(GO:0031032) |
| 0.0 | 0.9 | GO:0006730 | one-carbon metabolic process(GO:0006730) |
| 0.0 | 0.9 | GO:0050909 | sensory perception of taste(GO:0050909) |
| 0.0 | 0.2 | GO:0043031 | negative regulation of macrophage activation(GO:0043031) |
| 0.0 | 0.7 | GO:0090140 | regulation of mitochondrial fission(GO:0090140) |
| 0.0 | 0.3 | GO:0002076 | osteoblast development(GO:0002076) |
| 0.0 | 0.3 | GO:0040020 | regulation of meiotic nuclear division(GO:0040020) |
| 0.0 | 1.4 | GO:0090630 | activation of GTPase activity(GO:0090630) |
| 0.0 | 0.8 | GO:0006383 | transcription from RNA polymerase III promoter(GO:0006383) |
| 0.0 | 0.4 | GO:0060325 | face morphogenesis(GO:0060325) |
| 0.0 | 0.6 | GO:0030049 | muscle filament sliding(GO:0030049) actin-myosin filament sliding(GO:0033275) |
Gene overrepresentation in cellular component category:
| Log-likelihood per target | Total log-likelihood | Term | Description |
|---|---|---|---|
| 0.9 | 6.8 | GO:0097442 | CA3 pyramidal cell dendrite(GO:0097442) |
| 0.4 | 2.2 | GO:0016533 | cyclin-dependent protein kinase 5 holoenzyme complex(GO:0016533) |
| 0.3 | 4.5 | GO:0005833 | hemoglobin complex(GO:0005833) |
| 0.2 | 1.4 | GO:0032133 | chromosome passenger complex(GO:0032133) |
| 0.2 | 1.5 | GO:0000235 | astral microtubule(GO:0000235) aster(GO:0005818) |
| 0.2 | 0.5 | GO:0009328 | phenylalanine-tRNA ligase complex(GO:0009328) |
| 0.1 | 1.6 | GO:0005664 | origin recognition complex(GO:0000808) nuclear origin of replication recognition complex(GO:0005664) |
| 0.1 | 2.2 | GO:0031089 | platelet dense granule lumen(GO:0031089) |
| 0.1 | 3.5 | GO:0098636 | protein complex involved in cell adhesion(GO:0098636) |
| 0.0 | 1.3 | GO:0032982 | myosin filament(GO:0032982) |
| 0.0 | 2.4 | GO:0043198 | dendritic shaft(GO:0043198) |
| 0.0 | 4.8 | GO:0044215 | other organism(GO:0044215) other organism cell(GO:0044216) other organism part(GO:0044217) |
| 0.0 | 5.2 | GO:0005604 | basement membrane(GO:0005604) |
| 0.0 | 5.0 | GO:0031225 | anchored component of membrane(GO:0031225) |
| 0.0 | 1.2 | GO:0032839 | dendrite cytoplasm(GO:0032839) |
| 0.0 | 7.5 | GO:0005802 | trans-Golgi network(GO:0005802) |
| 0.0 | 0.5 | GO:1990909 | Wnt signalosome(GO:1990909) |
| 0.0 | 1.5 | GO:0019005 | SCF ubiquitin ligase complex(GO:0019005) |
| 0.0 | 0.6 | GO:0031045 | dense core granule(GO:0031045) |
| 0.0 | 0.7 | GO:0005839 | proteasome core complex(GO:0005839) |
| 0.0 | 1.0 | GO:0005771 | multivesicular body(GO:0005771) |
| 0.0 | 1.4 | GO:1904724 | tertiary granule lumen(GO:1904724) |
| 0.0 | 0.4 | GO:0016327 | apicolateral plasma membrane(GO:0016327) |
| 0.0 | 1.3 | GO:0032580 | Golgi cisterna membrane(GO:0032580) |
| 0.0 | 5.6 | GO:0060076 | excitatory synapse(GO:0060076) |
Gene overrepresentation in molecular function category:
| Log-likelihood per target | Total log-likelihood | Term | Description |
|---|---|---|---|
| 3.0 | 9.0 | GO:0031696 | alpha-2C adrenergic receptor binding(GO:0031696) |
| 1.4 | 8.3 | GO:0047894 | flavonol 3-sulfotransferase activity(GO:0047894) |
| 1.3 | 6.5 | GO:0047086 | phenanthrene 9,10-monooxygenase activity(GO:0018636) ketosteroid monooxygenase activity(GO:0047086) trans-1,2-dihydrobenzene-1,2-diol dehydrogenase activity(GO:0047115) |
| 0.7 | 3.0 | GO:0004853 | uroporphyrinogen decarboxylase activity(GO:0004853) |
| 0.7 | 2.2 | GO:0030549 | acetylcholine receptor activator activity(GO:0030549) |
| 0.7 | 4.3 | GO:0004430 | 1-phosphatidylinositol 4-kinase activity(GO:0004430) |
| 0.5 | 2.2 | GO:0060230 | lipoprotein lipase activator activity(GO:0060230) |
| 0.5 | 1.9 | GO:0015119 | hexose phosphate transmembrane transporter activity(GO:0015119) organophosphate:inorganic phosphate antiporter activity(GO:0015315) hexose-phosphate:inorganic phosphate antiporter activity(GO:0015526) glucose 6-phosphate:inorganic phosphate antiporter activity(GO:0061513) |
| 0.4 | 3.0 | GO:0003828 | alpha-N-acetylneuraminate alpha-2,8-sialyltransferase activity(GO:0003828) |
| 0.3 | 1.3 | GO:0004461 | lactose synthase activity(GO:0004461) |
| 0.3 | 2.7 | GO:0004767 | sphingomyelin phosphodiesterase activity(GO:0004767) |
| 0.3 | 4.5 | GO:0005344 | oxygen transporter activity(GO:0005344) |
| 0.3 | 1.4 | GO:0005152 | interleukin-1 receptor antagonist activity(GO:0005152) |
| 0.3 | 6.8 | GO:0002162 | dystroglycan binding(GO:0002162) |
| 0.3 | 3.6 | GO:0015501 | glutamate:sodium symporter activity(GO:0015501) |
| 0.2 | 0.7 | GO:0036505 | prosaposin receptor activity(GO:0036505) |
| 0.2 | 6.9 | GO:0004602 | glutathione peroxidase activity(GO:0004602) |
| 0.2 | 2.4 | GO:0015379 | potassium:chloride symporter activity(GO:0015379) potassium ion symporter activity(GO:0022820) |
| 0.2 | 1.1 | GO:0016167 | glial cell-derived neurotrophic factor receptor activity(GO:0016167) |
| 0.2 | 1.4 | GO:0035174 | histone serine kinase activity(GO:0035174) |
| 0.1 | 1.2 | GO:0015277 | kainate selective glutamate receptor activity(GO:0015277) |
| 0.1 | 0.4 | GO:0016833 | oxo-acid-lyase activity(GO:0016833) |
| 0.1 | 2.4 | GO:0004806 | triglyceride lipase activity(GO:0004806) |
| 0.1 | 0.5 | GO:0004826 | phenylalanine-tRNA ligase activity(GO:0004826) |
| 0.1 | 0.4 | GO:0008410 | CoA-transferase activity(GO:0008410) |
| 0.1 | 1.2 | GO:0042043 | neurexin family protein binding(GO:0042043) |
| 0.1 | 1.4 | GO:0005542 | folic acid binding(GO:0005542) |
| 0.1 | 0.3 | GO:0004991 | parathyroid hormone receptor activity(GO:0004991) |
| 0.1 | 0.4 | GO:0048408 | epidermal growth factor binding(GO:0048408) |
| 0.1 | 0.2 | GO:0001596 | angiotensin type I receptor activity(GO:0001596) |
| 0.1 | 1.0 | GO:0019871 | sodium channel inhibitor activity(GO:0019871) |
| 0.1 | 1.8 | GO:0030676 | Rac guanyl-nucleotide exchange factor activity(GO:0030676) |
| 0.1 | 0.8 | GO:0015280 | ligand-gated sodium channel activity(GO:0015280) |
| 0.1 | 1.1 | GO:0005337 | nucleoside transmembrane transporter activity(GO:0005337) |
| 0.0 | 0.9 | GO:0004089 | carbonate dehydratase activity(GO:0004089) |
| 0.0 | 0.5 | GO:0036374 | glutathione hydrolase activity(GO:0036374) |
| 0.0 | 0.9 | GO:0004129 | cytochrome-c oxidase activity(GO:0004129) heme-copper terminal oxidase activity(GO:0015002) oxidoreductase activity, acting on a heme group of donors, oxygen as acceptor(GO:0016676) |
| 0.0 | 0.7 | GO:0097493 | structural molecule activity conferring elasticity(GO:0097493) |
| 0.0 | 0.7 | GO:0070628 | proteasome binding(GO:0070628) |
| 0.0 | 0.4 | GO:0004016 | adenylate cyclase activity(GO:0004016) |
| 0.0 | 1.5 | GO:0019894 | kinesin binding(GO:0019894) |
| 0.0 | 1.5 | GO:0045309 | protein phosphorylated amino acid binding(GO:0045309) |
| 0.0 | 0.1 | GO:0004692 | cGMP-dependent protein kinase activity(GO:0004692) |
| 0.0 | 0.5 | GO:0048018 | receptor agonist activity(GO:0048018) |
| 0.0 | 0.9 | GO:0004683 | calmodulin-dependent protein kinase activity(GO:0004683) |
| 0.0 | 0.7 | GO:0042056 | chemoattractant activity(GO:0042056) |
| 0.0 | 2.6 | GO:0004725 | protein tyrosine phosphatase activity(GO:0004725) |
| 0.0 | 0.1 | GO:0004905 | type I interferon receptor activity(GO:0004905) |
| 0.0 | 0.1 | GO:0033038 | bitter taste receptor activity(GO:0033038) |
| 0.0 | 0.6 | GO:0030145 | manganese ion binding(GO:0030145) |
Gene overrepresentation in curated gene sets: canonical pathways category:
| Log-likelihood per target | Total log-likelihood | Term | Description |
|---|---|---|---|
| 0.1 | 6.8 | PID DELTA NP63 PATHWAY | Validated transcriptional targets of deltaNp63 isoforms |
| 0.1 | 6.1 | PID LKB1 PATHWAY | LKB1 signaling events |
| 0.1 | 4.8 | PID HNF3A PATHWAY | FOXA1 transcription factor network |
| 0.1 | 1.8 | PID ARF6 DOWNSTREAM PATHWAY | Arf6 downstream pathway |
| 0.0 | 2.2 | PID LIS1 PATHWAY | Lissencephaly gene (LIS1) in neuronal migration and development |
| 0.0 | 0.7 | ST TYPE I INTERFERON PATHWAY | Type I Interferon (alpha/beta IFN) Pathway |
| 0.0 | 1.4 | PID AURORA A PATHWAY | Aurora A signaling |
| 0.0 | 1.8 | PID NOTCH PATHWAY | Notch signaling pathway |
| 0.0 | 1.1 | PID RET PATHWAY | Signaling events regulated by Ret tyrosine kinase |
| 0.0 | 0.8 | PID ARF6 PATHWAY | Arf6 signaling events |
| 0.0 | 1.1 | ST T CELL SIGNAL TRANSDUCTION | T Cell Signal Transduction |
| 0.0 | 1.6 | PID E2F PATHWAY | E2F transcription factor network |
| 0.0 | 0.5 | PID WNT SIGNALING PATHWAY | Wnt signaling network |
| 0.0 | 1.0 | PID TRKR PATHWAY | Neurotrophic factor-mediated Trk receptor signaling |
Gene overrepresentation in curated gene sets: REACTOME pathways category:
| Log-likelihood per target | Total log-likelihood | Term | Description |
|---|---|---|---|
| 0.4 | 8.3 | REACTOME CYTOSOLIC SULFONATION OF SMALL MOLECULES | Genes involved in Cytosolic sulfonation of small molecules |
| 0.2 | 4.3 | REACTOME SYNTHESIS OF PIPS AT THE EARLY ENDOSOME MEMBRANE | Genes involved in Synthesis of PIPs at the early endosome membrane |
| 0.2 | 4.8 | REACTOME REGULATION OF COMPLEMENT CASCADE | Genes involved in Regulation of Complement cascade |
| 0.1 | 1.6 | REACTOME CDC6 ASSOCIATION WITH THE ORC ORIGIN COMPLEX | Genes involved in CDC6 association with the ORC:origin complex |
| 0.1 | 3.0 | REACTOME METABOLISM OF PORPHYRINS | Genes involved in Metabolism of porphyrins |
| 0.1 | 3.7 | REACTOME LYSOSOME VESICLE BIOGENESIS | Genes involved in Lysosome Vesicle Biogenesis |
| 0.1 | 1.3 | REACTOME NOTCH HLH TRANSCRIPTION PATHWAY | Genes involved in Notch-HLH transcription pathway |
| 0.1 | 1.8 | REACTOME ACTIVATED NOTCH1 TRANSMITS SIGNAL TO THE NUCLEUS | Genes involved in Activated NOTCH1 Transmits Signal to the Nucleus |
| 0.1 | 1.3 | REACTOME N GLYCAN ANTENNAE ELONGATION | Genes involved in N-Glycan antennae elongation |
| 0.1 | 0.9 | REACTOME REVERSIBLE HYDRATION OF CARBON DIOXIDE | Genes involved in Reversible Hydration of Carbon Dioxide |
| 0.1 | 1.5 | REACTOME PROLACTIN RECEPTOR SIGNALING | Genes involved in Prolactin receptor signaling |
| 0.1 | 0.5 | REACTOME CYTOSOLIC TRNA AMINOACYLATION | Genes involved in Cytosolic tRNA aminoacylation |
| 0.0 | 3.6 | REACTOME AMINO ACID AND OLIGOPEPTIDE SLC TRANSPORTERS | Genes involved in Amino acid and oligopeptide SLC transporters |
| 0.0 | 1.5 | REACTOME GLUTATHIONE CONJUGATION | Genes involved in Glutathione conjugation |
| 0.0 | 0.7 | REACTOME REGULATION OF IFNA SIGNALING | Genes involved in Regulation of IFNA signaling |
| 0.0 | 6.7 | REACTOME FACTORS INVOLVED IN MEGAKARYOCYTE DEVELOPMENT AND PLATELET PRODUCTION | Genes involved in Factors involved in megakaryocyte development and platelet production |
| 0.0 | 0.7 | REACTOME IL 7 SIGNALING | Genes involved in Interleukin-7 signaling |
| 0.0 | 2.4 | REACTOME TRANSPORT OF INORGANIC CATIONS ANIONS AND AMINO ACIDS OLIGOPEPTIDES | Genes involved in Transport of inorganic cations/anions and amino acids/oligopeptides |
| 0.0 | 1.2 | REACTOME IONOTROPIC ACTIVITY OF KAINATE RECEPTORS | Genes involved in Ionotropic activity of Kainate Receptors |
| 0.0 | 0.8 | REACTOME RNA POL III TRANSCRIPTION INITIATION FROM TYPE 3 PROMOTER | Genes involved in RNA Polymerase III Transcription Initiation From Type 3 Promoter |
| 0.0 | 1.8 | REACTOME NRAGE SIGNALS DEATH THROUGH JNK | Genes involved in NRAGE signals death through JNK |
| 0.0 | 1.1 | REACTOME TRANSPORT OF VITAMINS NUCLEOSIDES AND RELATED MOLECULES | Genes involved in Transport of vitamins, nucleosides, and related molecules |
| 0.0 | 2.1 | REACTOME APC C CDH1 MEDIATED DEGRADATION OF CDC20 AND OTHER APC C CDH1 TARGETED PROTEINS IN LATE MITOSIS EARLY G1 | Genes involved in APC/C:Cdh1 mediated degradation of Cdc20 and other APC/C:Cdh1 targeted proteins in late mitosis/early G1 |
| 0.0 | 1.1 | REACTOME NCAM1 INTERACTIONS | Genes involved in NCAM1 interactions |
| 0.0 | 0.4 | REACTOME TIGHT JUNCTION INTERACTIONS | Genes involved in Tight junction interactions |
| 0.0 | 0.9 | REACTOME RESPIRATORY ELECTRON TRANSPORT | Genes involved in Respiratory electron transport |