Project
GNF SymAtlas + NCI-60 cancer cell lines, human (Su, 2004; Ross, 2000)
Navigation
Downloads
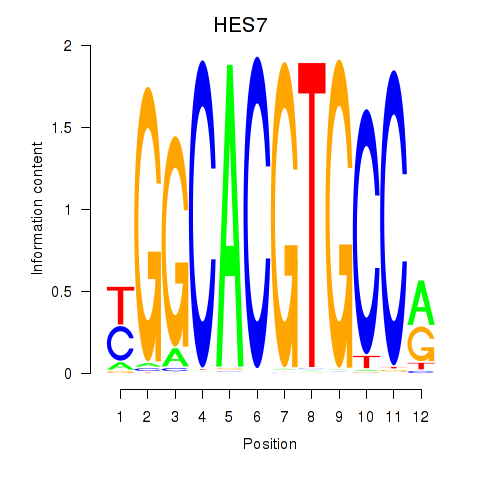
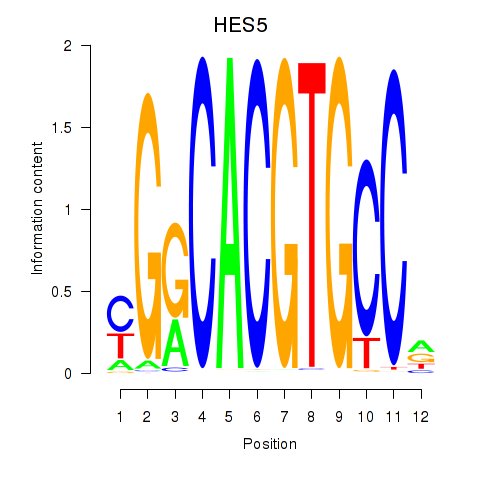
Results for HES7_HES5
Z-value: 0.79
Motif logo
Transcription factors associated with HES7_HES5
| Gene Symbol | Gene ID | Gene Info |
|---|---|---|
|
HES7
|
ENSG00000179111.9 | HES7 |
|
HES5
|
ENSG00000197921.6 | HES5 |
Activity profile of HES7_HES5 motif
Sorted Z-values of HES7_HES5 motif
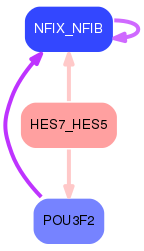
Network of associatons between targets according to the STRING database.

First level regulatory network of HES7_HES5
Gene Ontology Analysis
Gene overrepresentation in biological process category:
| Log-likelihood per target | Total log-likelihood | Term | Description |
|---|---|---|---|
| 6.6 | 78.8 | GO:1905098 | negative regulation of guanyl-nucleotide exchange factor activity(GO:1905098) |
| 2.8 | 8.5 | GO:0036071 | N-glycan fucosylation(GO:0036071) |
| 1.3 | 4.0 | GO:1902595 | regulation of DNA replication origin binding(GO:1902595) |
| 1.1 | 4.3 | GO:1903756 | regulation of transcription from RNA polymerase II promoter by histone modification(GO:1903756) negative regulation of transcription from RNA polymerase II promoter by histone modification(GO:1903758) |
| 0.7 | 5.9 | GO:0099566 | regulation of postsynaptic cytosolic calcium ion concentration(GO:0099566) |
| 0.6 | 3.0 | GO:0098532 | histone H3-K27 trimethylation(GO:0098532) |
| 0.6 | 1.8 | GO:0021779 | noradrenergic neuron development(GO:0003358) neuroblast differentiation(GO:0014016) spinal cord oligodendrocyte cell differentiation(GO:0021529) spinal cord oligodendrocyte cell fate specification(GO:0021530) oligodendrocyte cell fate specification(GO:0021778) oligodendrocyte cell fate commitment(GO:0021779) glial cell fate specification(GO:0021780) regulation of timing of neuron differentiation(GO:0060164) olfactory pit development(GO:0060166) |
| 0.6 | 4.5 | GO:0006498 | N-terminal protein lipidation(GO:0006498) |
| 0.6 | 2.8 | GO:0035106 | operant conditioning(GO:0035106) |
| 0.5 | 7.9 | GO:0047484 | regulation of response to osmotic stress(GO:0047484) |
| 0.5 | 2.6 | GO:0031119 | tRNA pseudouridine synthesis(GO:0031119) |
| 0.5 | 4.0 | GO:0035524 | proline transmembrane transport(GO:0035524) |
| 0.5 | 6.5 | GO:0033623 | regulation of integrin activation(GO:0033623) |
| 0.4 | 3.0 | GO:0071279 | cellular response to cobalt ion(GO:0071279) |
| 0.4 | 2.4 | GO:0043103 | hypoxanthine salvage(GO:0043103) |
| 0.4 | 2.4 | GO:0035469 | determination of pancreatic left/right asymmetry(GO:0035469) |
| 0.4 | 14.1 | GO:0048665 | neuron fate specification(GO:0048665) |
| 0.4 | 1.1 | GO:0098935 | dendritic transport(GO:0098935) anterograde dendritic transport(GO:0098937) |
| 0.3 | 3.1 | GO:0071502 | cellular response to temperature stimulus(GO:0071502) |
| 0.3 | 4.5 | GO:0016024 | CDP-diacylglycerol biosynthetic process(GO:0016024) |
| 0.3 | 1.7 | GO:0097029 | mature conventional dendritic cell differentiation(GO:0097029) |
| 0.3 | 1.2 | GO:2000393 | negative regulation of lamellipodium morphogenesis(GO:2000393) |
| 0.3 | 1.4 | GO:0051771 | negative regulation of nitric-oxide synthase biosynthetic process(GO:0051771) |
| 0.3 | 1.3 | GO:0042360 | vitamin E metabolic process(GO:0042360) |
| 0.3 | 1.0 | GO:0052042 | induction of programmed cell death(GO:0012502) peptidyl-cysteine S-trans-nitrosylation(GO:0035606) positive regulation of apoptotic process in other organism(GO:0044533) positive regulation by symbiont of host programmed cell death(GO:0052042) positive regulation by organism of programmed cell death in other organism involved in symbiotic interaction(GO:0052330) positive regulation by organism of apoptotic process in other organism involved in symbiotic interaction(GO:0052501) |
| 0.3 | 2.3 | GO:0030951 | establishment or maintenance of microtubule cytoskeleton polarity(GO:0030951) |
| 0.2 | 4.4 | GO:0015671 | oxygen transport(GO:0015671) |
| 0.2 | 1.1 | GO:0019464 | glycine catabolic process(GO:0006546) glycine decarboxylation via glycine cleavage system(GO:0019464) |
| 0.2 | 2.0 | GO:0006685 | sphingomyelin catabolic process(GO:0006685) |
| 0.2 | 31.7 | GO:0046718 | viral entry into host cell(GO:0046718) |
| 0.2 | 1.6 | GO:0006390 | transcription from mitochondrial promoter(GO:0006390) |
| 0.2 | 4.6 | GO:0010842 | retina layer formation(GO:0010842) |
| 0.2 | 1.4 | GO:0061343 | cell adhesion involved in heart morphogenesis(GO:0061343) |
| 0.2 | 0.8 | GO:0006772 | thiamine metabolic process(GO:0006772) |
| 0.1 | 1.5 | GO:1901538 | DNA methylation involved in embryo development(GO:0043045) histone H3-K4 trimethylation(GO:0080182) changes to DNA methylation involved in embryo development(GO:1901538) |
| 0.1 | 0.7 | GO:0006344 | maintenance of chromatin silencing(GO:0006344) |
| 0.1 | 7.7 | GO:0048488 | synaptic vesicle endocytosis(GO:0048488) |
| 0.1 | 2.6 | GO:0006488 | dolichol-linked oligosaccharide biosynthetic process(GO:0006488) |
| 0.1 | 2.7 | GO:0072520 | seminiferous tubule development(GO:0072520) |
| 0.1 | 1.6 | GO:0045046 | protein import into peroxisome membrane(GO:0045046) |
| 0.1 | 0.7 | GO:0022027 | interkinetic nuclear migration(GO:0022027) |
| 0.1 | 2.1 | GO:0050812 | regulation of acetyl-CoA biosynthetic process from pyruvate(GO:0010510) regulation of acyl-CoA biosynthetic process(GO:0050812) |
| 0.1 | 4.0 | GO:0090383 | phagosome acidification(GO:0090383) |
| 0.1 | 1.0 | GO:0044341 | sodium-dependent phosphate transport(GO:0044341) |
| 0.1 | 6.9 | GO:0010501 | RNA secondary structure unwinding(GO:0010501) |
| 0.1 | 0.6 | GO:0043988 | histone H3-S28 phosphorylation(GO:0043988) |
| 0.1 | 0.6 | GO:1903588 | negative regulation of blood vessel endothelial cell proliferation involved in sprouting angiogenesis(GO:1903588) |
| 0.1 | 0.4 | GO:0018199 | peptidyl-glutamine modification(GO:0018199) |
| 0.1 | 0.4 | GO:1904020 | regulation of G-protein coupled receptor internalization(GO:1904020) negative regulation of G-protein coupled receptor internalization(GO:1904021) |
| 0.1 | 2.2 | GO:0051290 | protein heterotetramerization(GO:0051290) |
| 0.1 | 0.3 | GO:0007197 | adenylate cyclase-inhibiting G-protein coupled acetylcholine receptor signaling pathway(GO:0007197) |
| 0.1 | 0.8 | GO:0048227 | plasma membrane to endosome transport(GO:0048227) |
| 0.1 | 2.5 | GO:1903959 | regulation of anion transmembrane transport(GO:1903959) |
| 0.0 | 0.5 | GO:0006621 | protein retention in ER lumen(GO:0006621) |
| 0.0 | 2.1 | GO:0032456 | endocytic recycling(GO:0032456) |
| 0.0 | 0.5 | GO:0001574 | ganglioside biosynthetic process(GO:0001574) |
| 0.0 | 0.9 | GO:0006688 | glycosphingolipid biosynthetic process(GO:0006688) |
| 0.0 | 1.1 | GO:0009235 | cobalamin metabolic process(GO:0009235) |
| 0.0 | 5.5 | GO:0046854 | phosphatidylinositol phosphorylation(GO:0046854) |
| 0.0 | 0.4 | GO:0034498 | early endosome to Golgi transport(GO:0034498) |
| 0.0 | 0.9 | GO:0032012 | regulation of ARF protein signal transduction(GO:0032012) |
| 0.0 | 2.3 | GO:0045646 | regulation of erythrocyte differentiation(GO:0045646) |
| 0.0 | 1.1 | GO:0071108 | protein K48-linked deubiquitination(GO:0071108) |
| 0.0 | 0.6 | GO:0033141 | positive regulation of peptidyl-serine phosphorylation of STAT protein(GO:0033141) |
| 0.0 | 0.3 | GO:0006069 | ethanol oxidation(GO:0006069) |
| 0.0 | 0.1 | GO:0019557 | histidine catabolic process to glutamate and formamide(GO:0019556) histidine catabolic process to glutamate and formate(GO:0019557) formamide metabolic process(GO:0043606) |
| 0.0 | 0.3 | GO:0000050 | urea cycle(GO:0000050) |
| 0.0 | 0.1 | GO:0051418 | interphase microtubule nucleation by interphase microtubule organizing center(GO:0051415) microtubule nucleation by microtubule organizing center(GO:0051418) |
| 0.0 | 2.1 | GO:0006968 | cellular defense response(GO:0006968) |
| 0.0 | 2.3 | GO:1903955 | positive regulation of protein targeting to mitochondrion(GO:1903955) |
| 0.0 | 0.3 | GO:0007175 | negative regulation of epidermal growth factor-activated receptor activity(GO:0007175) |
| 0.0 | 0.1 | GO:0019482 | beta-alanine metabolic process(GO:0019482) |
| 0.0 | 2.5 | GO:0046546 | male gonad development(GO:0008584) development of primary male sexual characteristics(GO:0046546) |
| 0.0 | 10.5 | GO:0051301 | cell division(GO:0051301) |
| 0.0 | 0.2 | GO:2000001 | regulation of DNA damage checkpoint(GO:2000001) |
| 0.0 | 0.1 | GO:0000012 | single strand break repair(GO:0000012) |
Gene overrepresentation in cellular component category:
| Log-likelihood per target | Total log-likelihood | Term | Description |
|---|---|---|---|
| 1.2 | 5.9 | GO:0044308 | axonal spine(GO:0044308) |
| 0.8 | 6.9 | GO:0033391 | chromatoid body(GO:0033391) |
| 0.6 | 1.9 | GO:0034991 | nuclear meiotic cohesin complex(GO:0034991) |
| 0.5 | 1.4 | GO:0005953 | CAAX-protein geranylgeranyltransferase complex(GO:0005953) |
| 0.4 | 2.1 | GO:0005967 | mitochondrial pyruvate dehydrogenase complex(GO:0005967) |
| 0.4 | 7.7 | GO:0001931 | uropod(GO:0001931) cell trailing edge(GO:0031254) |
| 0.3 | 1.5 | GO:0001940 | male pronucleus(GO:0001940) |
| 0.3 | 2.6 | GO:0005672 | transcription factor TFIIA complex(GO:0005672) |
| 0.3 | 1.1 | GO:1990075 | periciliary membrane compartment(GO:1990075) |
| 0.3 | 1.1 | GO:0005960 | glycine cleavage complex(GO:0005960) |
| 0.2 | 15.8 | GO:0032154 | cleavage furrow(GO:0032154) cell surface furrow(GO:0097610) |
| 0.2 | 82.7 | GO:0005874 | microtubule(GO:0005874) |
| 0.1 | 0.6 | GO:0000221 | vacuolar proton-transporting V-type ATPase, V1 domain(GO:0000221) |
| 0.1 | 3.4 | GO:0033176 | proton-transporting V-type ATPase complex(GO:0033176) |
| 0.1 | 11.0 | GO:0097517 | stress fiber(GO:0001725) contractile actin filament bundle(GO:0097517) |
| 0.1 | 1.0 | GO:0097452 | GAIT complex(GO:0097452) |
| 0.1 | 0.3 | GO:0032279 | asymmetric synapse(GO:0032279) |
| 0.1 | 3.0 | GO:0031307 | integral component of mitochondrial outer membrane(GO:0031307) |
| 0.1 | 4.3 | GO:0043198 | dendritic shaft(GO:0043198) |
| 0.1 | 1.4 | GO:0044233 | ER-mitochondrion membrane contact site(GO:0044233) |
| 0.1 | 3.2 | GO:0090545 | NuRD complex(GO:0016581) CHD-type complex(GO:0090545) |
| 0.1 | 7.2 | GO:0032580 | Golgi cisterna membrane(GO:0032580) |
| 0.1 | 0.3 | GO:0005850 | eukaryotic translation initiation factor 2 complex(GO:0005850) |
| 0.1 | 0.8 | GO:0016580 | Sin3 complex(GO:0016580) |
| 0.1 | 7.8 | GO:0005901 | caveola(GO:0005901) |
| 0.1 | 1.6 | GO:0031231 | integral component of peroxisomal membrane(GO:0005779) intrinsic component of peroxisomal membrane(GO:0031231) |
| 0.1 | 0.7 | GO:0000242 | pericentriolar material(GO:0000242) |
| 0.0 | 2.4 | GO:0097014 | axoneme(GO:0005930) ciliary plasm(GO:0097014) |
| 0.0 | 1.2 | GO:0016592 | mediator complex(GO:0016592) |
| 0.0 | 2.2 | GO:0000794 | condensed nuclear chromosome(GO:0000794) |
| 0.0 | 3.6 | GO:0043204 | perikaryon(GO:0043204) |
| 0.0 | 4.5 | GO:0005741 | mitochondrial outer membrane(GO:0005741) |
| 0.0 | 1.7 | GO:0035578 | azurophil granule lumen(GO:0035578) |
| 0.0 | 0.7 | GO:0031519 | PcG protein complex(GO:0031519) |
| 0.0 | 0.1 | GO:0030868 | smooth endoplasmic reticulum membrane(GO:0030868) smooth endoplasmic reticulum part(GO:0097425) |
| 0.0 | 1.2 | GO:0032587 | ruffle membrane(GO:0032587) |
Gene overrepresentation in molecular function category:
| Log-likelihood per target | Total log-likelihood | Term | Description |
|---|---|---|---|
| 2.9 | 11.8 | GO:0052812 | phosphatidylinositol-3,4-bisphosphate 5-kinase activity(GO:0052812) |
| 2.8 | 8.5 | GO:0046921 | glycoprotein 6-alpha-L-fucosyltransferase activity(GO:0008424) alpha-(1->6)-fucosyltransferase activity(GO:0046921) |
| 1.0 | 4.0 | GO:0035033 | histone deacetylase regulator activity(GO:0035033) |
| 0.9 | 2.8 | GO:0016497 | substance K receptor activity(GO:0016497) |
| 0.7 | 3.0 | GO:0061628 | H3K27me3 modified histone binding(GO:0061628) |
| 0.7 | 5.9 | GO:0004971 | AMPA glutamate receptor activity(GO:0004971) |
| 0.5 | 4.0 | GO:0015193 | L-proline transmembrane transporter activity(GO:0015193) |
| 0.5 | 1.4 | GO:0004662 | CAAX-protein geranylgeranyltransferase activity(GO:0004662) |
| 0.4 | 8.7 | GO:0031005 | filamin binding(GO:0031005) |
| 0.4 | 1.1 | GO:0004047 | aminomethyltransferase activity(GO:0004047) |
| 0.4 | 2.1 | GO:0004740 | pyruvate dehydrogenase (acetyl-transferring) kinase activity(GO:0004740) |
| 0.3 | 1.0 | GO:0015319 | sodium:inorganic phosphate symporter activity(GO:0015319) |
| 0.3 | 1.0 | GO:0035605 | peptidyl-cysteine S-nitrosylase activity(GO:0035605) |
| 0.3 | 4.4 | GO:0005344 | oxygen transporter activity(GO:0005344) |
| 0.3 | 2.2 | GO:0005087 | Ran guanyl-nucleotide exchange factor activity(GO:0005087) |
| 0.2 | 31.7 | GO:0001618 | virus receptor activity(GO:0001618) |
| 0.2 | 2.0 | GO:0004767 | sphingomyelin phosphodiesterase activity(GO:0004767) |
| 0.2 | 2.6 | GO:0009982 | pseudouridine synthase activity(GO:0009982) |
| 0.2 | 84.0 | GO:0015631 | tubulin binding(GO:0015631) |
| 0.2 | 0.8 | GO:0004802 | transketolase activity(GO:0004802) |
| 0.2 | 0.6 | GO:0004711 | ribosomal protein S6 kinase activity(GO:0004711) |
| 0.2 | 1.1 | GO:0016807 | cysteine-type carboxypeptidase activity(GO:0016807) cysteine-type exopeptidase activity(GO:0070004) |
| 0.2 | 4.5 | GO:0003841 | 1-acylglycerol-3-phosphate O-acyltransferase activity(GO:0003841) |
| 0.2 | 1.6 | GO:0050682 | AF-2 domain binding(GO:0050682) |
| 0.2 | 2.1 | GO:0019957 | C-C chemokine binding(GO:0019957) |
| 0.2 | 2.4 | GO:0070840 | dynein complex binding(GO:0070840) |
| 0.1 | 0.9 | GO:0003828 | alpha-N-acetylneuraminate alpha-2,8-sialyltransferase activity(GO:0003828) |
| 0.1 | 0.4 | GO:0031687 | A2A adenosine receptor binding(GO:0031687) |
| 0.1 | 0.5 | GO:0047291 | neolactotetraosylceramide alpha-2,3-sialyltransferase activity(GO:0004513) lactosylceramide alpha-2,3-sialyltransferase activity(GO:0047291) |
| 0.1 | 2.5 | GO:0005247 | voltage-gated chloride channel activity(GO:0005247) |
| 0.1 | 0.6 | GO:0008553 | hydrogen-exporting ATPase activity, phosphorylative mechanism(GO:0008553) |
| 0.1 | 4.3 | GO:0070577 | lysine-acetylated histone binding(GO:0070577) |
| 0.1 | 3.1 | GO:0099604 | calcium-release channel activity(GO:0015278) ligand-gated calcium channel activity(GO:0099604) |
| 0.1 | 2.6 | GO:0000030 | mannosyltransferase activity(GO:0000030) |
| 0.1 | 2.2 | GO:0008409 | 5'-3' exonuclease activity(GO:0008409) |
| 0.1 | 6.9 | GO:0004004 | ATP-dependent RNA helicase activity(GO:0004004) |
| 0.1 | 3.3 | GO:0001103 | RNA polymerase II repressing transcription factor binding(GO:0001103) |
| 0.1 | 13.0 | GO:0001078 | transcriptional repressor activity, RNA polymerase II core promoter proximal region sequence-specific binding(GO:0001078) |
| 0.1 | 1.4 | GO:0034185 | apolipoprotein binding(GO:0034185) |
| 0.1 | 0.3 | GO:0016907 | G-protein coupled acetylcholine receptor activity(GO:0016907) |
| 0.1 | 1.4 | GO:0045499 | chemorepellent activity(GO:0045499) |
| 0.1 | 0.4 | GO:0003810 | protein-glutamine gamma-glutamyltransferase activity(GO:0003810) |
| 0.1 | 7.9 | GO:0008565 | protein transporter activity(GO:0008565) |
| 0.0 | 3.0 | GO:0016706 | oxidoreductase activity, acting on paired donors, with incorporation or reduction of molecular oxygen, 2-oxoglutarate as one donor, and incorporation of one atom each of oxygen into both donors(GO:0016706) |
| 0.0 | 0.5 | GO:0097506 | uracil DNA N-glycosylase activity(GO:0004844) deaminated base DNA N-glycosylase activity(GO:0097506) |
| 0.0 | 0.6 | GO:0005132 | type I interferon receptor binding(GO:0005132) |
| 0.0 | 0.6 | GO:0048406 | nerve growth factor binding(GO:0048406) |
| 0.0 | 2.4 | GO:0016763 | transferase activity, transferring pentosyl groups(GO:0016763) |
| 0.0 | 0.9 | GO:0005086 | ARF guanyl-nucleotide exchange factor activity(GO:0005086) |
| 0.0 | 3.1 | GO:0015399 | primary active transmembrane transporter activity(GO:0015399) P-P-bond-hydrolysis-driven transmembrane transporter activity(GO:0015405) ATPase activity, coupled to transmembrane movement of substances(GO:0042626) |
| 0.0 | 0.1 | GO:0070259 | tyrosyl-DNA phosphodiesterase activity(GO:0070259) |
| 0.0 | 1.6 | GO:0003743 | translation initiation factor activity(GO:0003743) |
| 0.0 | 0.3 | GO:0016813 | hydrolase activity, acting on carbon-nitrogen (but not peptide) bonds, in linear amidines(GO:0016813) |
| 0.0 | 0.3 | GO:0004030 | aldehyde dehydrogenase [NAD(P)+] activity(GO:0004030) |
| 0.0 | 1.6 | GO:0051117 | ATPase binding(GO:0051117) |
| 0.0 | 0.2 | GO:0004143 | diacylglycerol kinase activity(GO:0004143) |
Gene overrepresentation in curated gene sets: canonical pathways category:
| Log-likelihood per target | Total log-likelihood | Term | Description |
|---|---|---|---|
| 3.9 | 78.5 | PID P38 GAMMA DELTA PATHWAY | Signaling mediated by p38-gamma and p38-delta |
| 0.2 | 15.8 | PID RHOA PATHWAY | RhoA signaling pathway |
| 0.1 | 5.8 | PID EPHB FWD PATHWAY | EPHB forward signaling |
| 0.0 | 2.3 | PID AURORA A PATHWAY | Aurora A signaling |
| 0.0 | 3.0 | PID MTOR 4PATHWAY | mTOR signaling pathway |
| 0.0 | 0.9 | ST PHOSPHOINOSITIDE 3 KINASE PATHWAY | PI3K Pathway |
| 0.0 | 1.8 | PID HES HEY PATHWAY | Notch-mediated HES/HEY network |
| 0.0 | 0.6 | SA TRKA RECEPTOR | The TrkA receptor binds nerve growth factor to activate MAP kinase pathways and promote cell growth. |
| 0.0 | 3.4 | WNT SIGNALING | Genes related to Wnt-mediated signal transduction |
| 0.0 | 1.7 | PID CMYB PATHWAY | C-MYB transcription factor network |
| 0.0 | 0.4 | PID INTEGRIN A9B1 PATHWAY | Alpha9 beta1 integrin signaling events |
| 0.0 | 1.3 | PID ERBB1 DOWNSTREAM PATHWAY | ErbB1 downstream signaling |
Gene overrepresentation in curated gene sets: REACTOME pathways category:
| Log-likelihood per target | Total log-likelihood | Term | Description |
|---|---|---|---|
| 0.3 | 6.3 | REACTOME SEMA3A PLEXIN REPULSION SIGNALING BY INHIBITING INTEGRIN ADHESION | Genes involved in SEMA3A-Plexin repulsion signaling by inhibiting Integrin adhesion |
| 0.3 | 8.5 | REACTOME N GLYCAN ANTENNAE ELONGATION IN THE MEDIAL TRANS GOLGI | Genes involved in N-glycan antennae elongation in the medial/trans-Golgi |
| 0.2 | 4.6 | REACTOME NRIF SIGNALS CELL DEATH FROM THE NUCLEUS | Genes involved in NRIF signals cell death from the nucleus |
| 0.2 | 5.9 | REACTOME TRAFFICKING OF GLUR2 CONTAINING AMPA RECEPTORS | Genes involved in Trafficking of GluR2-containing AMPA receptors |
| 0.1 | 4.0 | REACTOME INSULIN RECEPTOR RECYCLING | Genes involved in Insulin receptor recycling |
| 0.1 | 4.5 | REACTOME SYNTHESIS OF PA | Genes involved in Synthesis of PA |
| 0.1 | 2.1 | REACTOME REGULATION OF PYRUVATE DEHYDROGENASE PDH COMPLEX | Genes involved in Regulation of pyruvate dehydrogenase (PDH) complex |
| 0.1 | 5.5 | REACTOME SYNTHESIS OF PIPS AT THE PLASMA MEMBRANE | Genes involved in Synthesis of PIPs at the plasma membrane |
| 0.1 | 2.4 | REACTOME PURINE SALVAGE | Genes involved in Purine salvage |
| 0.1 | 1.4 | REACTOME CALNEXIN CALRETICULIN CYCLE | Genes involved in Calnexin/calreticulin cycle |
| 0.1 | 2.6 | REACTOME BIOSYNTHESIS OF THE N GLYCAN PRECURSOR DOLICHOL LIPID LINKED OLIGOSACCHARIDE LLO AND TRANSFER TO A NASCENT PROTEIN | Genes involved in Biosynthesis of the N-glycan precursor (dolichol lipid-linked oligosaccharide, LLO) and transfer to a nascent protein |
| 0.1 | 4.0 | REACTOME AMINO ACID TRANSPORT ACROSS THE PLASMA MEMBRANE | Genes involved in Amino acid transport across the plasma membrane |
| 0.1 | 2.3 | REACTOME DCC MEDIATED ATTRACTIVE SIGNALING | Genes involved in DCC mediated attractive signaling |
| 0.1 | 2.3 | REACTOME CELL EXTRACELLULAR MATRIX INTERACTIONS | Genes involved in Cell-extracellular matrix interactions |
| 0.1 | 1.3 | REACTOME HDL MEDIATED LIPID TRANSPORT | Genes involved in HDL-mediated lipid transport |
| 0.0 | 1.9 | REACTOME MEIOTIC SYNAPSIS | Genes involved in Meiotic Synapsis |
| 0.0 | 0.3 | REACTOME ETHANOL OXIDATION | Genes involved in Ethanol oxidation |
| 0.0 | 2.1 | REACTOME CHEMOKINE RECEPTORS BIND CHEMOKINES | Genes involved in Chemokine receptors bind chemokines |
| 0.0 | 2.8 | REACTOME LOSS OF NLP FROM MITOTIC CENTROSOMES | Genes involved in Loss of Nlp from mitotic centrosomes |
| 0.0 | 0.3 | REACTOME REGULATION OF INSULIN SECRETION BY ACETYLCHOLINE | Genes involved in Regulation of Insulin Secretion by Acetylcholine |
| 0.0 | 1.1 | REACTOME DEGRADATION OF THE EXTRACELLULAR MATRIX | Genes involved in Degradation of the extracellular matrix |
| 0.0 | 0.5 | REACTOME BASE FREE SUGAR PHOSPHATE REMOVAL VIA THE SINGLE NUCLEOTIDE REPLACEMENT PATHWAY | Genes involved in Base-free sugar-phosphate removal via the single-nucleotide replacement pathway |
| 0.0 | 1.6 | REACTOME FORMATION OF THE TERNARY COMPLEX AND SUBSEQUENTLY THE 43S COMPLEX | Genes involved in Formation of the ternary complex, and subsequently, the 43S complex |
| 0.0 | 2.8 | REACTOME PEPTIDE LIGAND BINDING RECEPTORS | Genes involved in Peptide ligand-binding receptors |
| 0.0 | 1.0 | REACTOME GLYCOLYSIS | Genes involved in Glycolysis |
| 0.0 | 0.6 | REACTOME SIGNAL TRANSDUCTION BY L1 | Genes involved in Signal transduction by L1 |
| 0.0 | 0.6 | REACTOME REGULATION OF IFNA SIGNALING | Genes involved in Regulation of IFNA signaling |
| 0.0 | 2.2 | REACTOME HOST INTERACTIONS OF HIV FACTORS | Genes involved in Host Interactions of HIV factors |
| 0.0 | 0.1 | REACTOME RECRUITMENT OF NUMA TO MITOTIC CENTROSOMES | Genes involved in Recruitment of NuMA to mitotic centrosomes |
| 0.0 | 1.0 | REACTOME TRANSPORT OF INORGANIC CATIONS ANIONS AND AMINO ACIDS OLIGOPEPTIDES | Genes involved in Transport of inorganic cations/anions and amino acids/oligopeptides |